Embed Size (px)
Citation preview

n0!
m u
NO. I v x i
IMPLEMENTATION CHARACTERISTICS OF EFFECTIVE
CONTINUOUS QUALITY IMPROVEMENT TRAINING
AS PERCEIVED BY SELECTED INDIVIDUALS
AT TWO- AND FOUR-YEAR COLLEGES
IN THE UNITED STATES
DISSERTATION
Presented to the Graduate Council of the
University of North Texas in Partial
Fulfillment of the Requirements
For the Degree of
DOCTOR OF PHILOSOPHY
By
Katherine C. Miller, B.B.A., M.S. Ed.
Denton, Texas
December, 1996
Miller, Katherine C., Implementation characteristics of effective
continuous quality improvement training as perceived bv selected individuals at
two- and four-vear colleges in the United States. Doctor of Philosophy (Higher
Education), December, 1996, 232 pp., 35 tables, references, 128 titles.
Within the last decade, continuous quality improvement (CQI) has been
embraced by higher education management. An important component of the
quality philosophy is to institute training for everyone: faculty, administrators,
staff and students—in order to achieve a cultural transformation. The purpose of
this study was to identify and describe the implementation characteristics of CQI
training programs and to determine whether or not and to what degree relation-
ships exist between these characteristics and training program effectiveness, as
perceived by selected individuals at two- and four-year colleges in the United
States.
A survey instrument was designed to elicit the perceptions of both the
chief administrators and those quality professionals who are charged with the
training process as they relate to specific implementation characteristics such
as training content needed to convey the appropriate philosophy, program
implementation processes, and the perceived effectiveness of the respondents'
quality training program.
A 21-item questionnaire was used to gather the data from a sample of
524 individuals at two- and four-year colleges in the United States. The

dependent variables in the study related to items addressing program
effectiveness based on four types of program evaluation, and the independent
variables related to specific implementation characteristics.
Spearman correlation matrices were executed to test the relationships
between and among implementation characteristics and between the four
levels of evaluation. Multiple regression analyses were computed to determine
which and to what extent implementation characteristics accounted for variation
in each of the four measures of effectiveness. Analyses revealed that using a
variety of philosophies, tools and content segments, providing training in quality
awareness, team leadership, management and leadership, and assessment,
using internal trainers, and the extent of staff and faculty support accounted for
the largest proportions of variance. The statistical results for the two hypotheses
which were derived from the research questions were also reported.

Copyright by
Katherine C. Miller
1996

ACKNOWLEDGMENTS
Striving for quality has been a guiding principle throughout my life and
even more so as I endeavored to achieve the doctoral degree. I offer my
deepest appreciation to those who have encouraged, inspired, and contributed
to the final fulfillment of this milestone in my life.
To my major professor, Dr. Howard W. Smith, Jr., I extend my deepest
appreciation for his patience, advice, and professionalism. In addition, I thank
the other committee members, Dr. William A. Miller, Dr. Victor Prybutok, and
Dr. Roger Ditzenberger for their recommendations and insistence on a high
level of scholarly research.
To my co-workers I extend my gratitude for their understanding, support
and encouragement during the dissertation process. Special thanks are given
to Tom Barker, Marsha Johnson, Mary Landers, Jim Messinger, and Martha
Tandy and her able library staff for their generous contributions to this project.
To Dr. Shirley Chenault, I extend my sincerest appreciation for her continuing
encouragement, timely advice, and unwavering friendship.
I further express my love and thanks to both my father, the late Martin
Bach, and my mother, Katherine, for their encouragement, assistance, and
appreciation of the value of higher education. And most importantly, I
acknowledge and express my love and grateful appreciation to my husband,
Edd, for his sacrifices, understanding, support, and encouragement throughout
the past eight years as I progressed through the doctoral studies.

TABLE OF CONTENTS
Page
LIST OF TABLES viii
Chapter
1. INTRODUCTION 1
Background of the Study 1
Statement of the Problem 5
Purposes of the Study 6
Research Questions 6
Hypotheses 9
Significance of the Study 9
Definition of Terms 13
Limitations and Delimitations 15
Assumptions 16
Chapter Summary 16
2. REVIEW OF THE LITERATURE 18
Introduction 18
The Concept of Quality 20
The Philosophy of TQM 22
Total Quality Management in Education 36
Implementation of TQM through Training Programs 65

VI
Chapter Page
Chapter Summary 76
3. PROCEDURES FOR DATA COLLECTION 78
Research Design 78
Study Population 78
The Survey Instrument 79
Instrument Validity 82
Instrument Reliability 84
Procedures for the Collection of Data 85
Procedures for the Analysis of Data 86
4. PRESENTATION AND ANALYSIS OF THE DATA 88
Introduction 88
Restatement of the Research Questions and Hypotheses 90
Report of the Distribution and Rate of Return 93
Demographic Profile of Respondents Involved in CQI Training . . . . 96
Profile of Quality Training Participants and Processes 100
Measurement of Perceived Training Program Effectiveness 104
Identification of Implementation Characteristics in the Continuous Quality Improvement Training Programs 111
Relationships between Major Implementation Characteristics . . . . 121
Relationships between Implementation Characteristics and Outcome Measures for Training Program Effectiveness 128
Multiple Regression Analyses of Outcome Measures of Perceived Training Program Effectiveness 137
Vli
Chapter Page
Testing for the Two Hypotheses 145
Chapter Summary 147
5. SUMMARY, DISCUSSION, CONCLUSIONS, AND IMPLICATIONS
AND RECOMMENDATIONS 148
Introduction 148
Summary of the Study 148
Discussion of the Findings 160
Conclusions 168
Implications and Recommendations 171
APPENDIXES 177
REFERENCES 219

LIST OF TABLES
Table Page
4-1 Return Rate by Type of College and CQI Training Involvement 95
4-2 Range and Mean of FTE Students Enrolled and Number of Employees at Two- and Four-Year Colleges Involved in CQI Training 96
4-3 Position Held by Respondent and by Type of College 97
4-4 Title of Positions for Non-designated Quality Improvement Responsibilities 99
4-5 Mean Percentages and Standard Error Percentages for Selected Employee Groups Receiving CQI Training at Selected Colleges 101
4-6 Types of Sessions Used to Deliver CQI Training at Selected Colleges 103
4-7 Use of the Four Levels of Evaluation for CQI Training Programs at Selected Colleges 105
4-8 Means, Standard Errors, and Response Ranges for Outcome Measures of Effectiveness of CQI Training at Selected Colleges 107
4-9 How Behavior Change is Evaluated after CQI Training at Selected Colleges 108
4-10 Summary of Frequencies for the Evaluation of Perceived Effectiveness of Selected Organizational Areas after CQI Training at Selected Colleges 109
4-11 Summary of Frequencies for the Evaluation of Perceived Effectiveness of Specific Work Processes after CQI Training at Selected Colleges 110

IX
Table Page
4-12 Summary of Selected Frequencies and Percentages of Respondent Use of CQI Philosophies and Tools at Selected Colleges 112
4-13 Summary of Selected Frequencies and Percentages of Respondent Use of Specific Content Segments for CQI Training at Selected Colleges 114
4-14 Means and Standard Errors for Degree of Support for CQI Training at Selected Colleges 116
4-15 Frequency Distributions and Percentages for Participation in Quality Improvement Training and Using Skills Learned on the Job as Part of Employee Performance Reviews at Selected Colleges 117
4-16 Work Units in Which Pilot Programs were Conducted to Initiate Continuous Quality Improvement at Selected Colleges 119
4-17 Estimated Annual Budgets for Quality Improvement Training at Two- and Four-Year Colleges 120
4-18a Correlation Matrix of Major Implementation Variables Featuring Philosophy and Tools and Areas of Organizational Development .. 122
4-18b Correlation Matrix of Major Implementation Variables Featuring Philosophy and Tools and Areas of Organizational Development .. 123
4-19a Correlation Matrix of Major Implementation Variables Featuring Content Segments 125
4-19b Correlation Matrix of Major Implementation Variables Featuring Content Segments 127
4-20a Correlation Matrix of Major Implementation Variables Featuring Philosophy and Tools and Outcome Measures of Training Program Effectiveness 129
4-20b Correlation Matrix of Major Implementation Variables Featuring Content Segments and Outcome Measures of Training Program Effectiveness 131
4-21 a Training Variables that Correlate to Explain the Outcome Measure of Rated Reaction/Opinion 132

X
Table Page
4-21 b Training Variables that Correlate to Explain the Outcome Measure of Extent of New Skills Learned 133
4-21c Training Variables that Correlate to Explain the Outcome Measure of Extent of New Skills Used 134
4-21 d Training Variables that Correlate to Explain the Outcome Measure of Extent of Positive Organizational Change 136
4-22 Stepwise Multiple Regression of Significant Major Implementation Characteristics to Predict Rated Reaction/Opinion 138
4-23 Stepwise Multiple Regression of Significant Major Implementation Characteristics to Predict Rated Extent New Skills Learned 139
4-24 Stepwise Multiple Regression of Significant Major Implementation Characteristics to Predict Rated Positive Organizational Change .. 140
4-25 Stepwise Multiple Regression of Significant Other Training Program Variables to Predict Rated Reaction/Opinion 141
4-26 Stepwise Multiple Regression of Significant Other Training Program Variables to Predict Rated Extent of New Skills Learned 142
4-27 Stepwise Multiple Regression of Significant Other Training Program Variables to Predict Rated Extent of New Skills Used 143
4-28 Stepwise Multiple Regression of Significant Other Training Program Variables to Predict Rated Extent of Positive Organizational Change 144
4-29 t-test for Two- and Four-Year Colleges' Perception of Top Management Support 146

CHAPTER I
INTRODUCTION
Background of the Study
The emergence of the philosophy of continuous quality improvement or
total quality management in higher education is at an embryonic stage. While
many businesses and industries have embraced quality-first principles in order
to maintain an edge in an increasingly competitive global economy and to react
to fast market shifts, the public sector has been slow to adopt the practice.
Educators at all levels, however, are increasingly concerned with accountability
issues and have demonstrated an interest in pursuing the quality journey. The
newest revolution in education is calling for a new kind of quality—quality that is
identified by the processes used to achieve effectiveness in contrast to the
traditional emphasis on discrete inputs and outcomes.
Higher education institutions across the country are working to
implement the philosophy of continuous quality improvement in a tangible form
by restructuring the way they deliver services to their customers: students,
parents, business and industry, and the community. The philosophy of
continuous quality improvement follows a simple common sense rule: "The first
priority of an enterprise and everyone in it must be knowing and satisfying the
customer" (Seymour, 1992, p. 13).

An important component of the quality philosophy is to initiate training for
everyone (Juran, 1989; Deming, 1986; Ishikawa, 1986; and Crosby, 1976). In a
higher education setting, this would include faculty, administrators, staff and
students—in order to achieve a cultural transformation. The continuous quality
improvement process requires various types of training for interpersonal and
process skills as well as training in the use of statistical tools.
Training programs for total quality management in business and industry
are usually sponsored through the human resource development (HRD)
division or through quality centers or departments. These programs are often
referred to as total quality training, quality improvement training, or quality
control training and focus on company personnel learning new skills and using
them on the job to achieve the goals of continuous quality improvement. The
ultimate goal of the management system is to improve the quality of an
organization's products or services.
In higher education, training for employees is not generally a normal
function of the college, and many decisions must be made regarding the
process for a quality training initiative. Therefore, the internal training
coordinator for quality may be vexed by the following questions which Stieber
(1991) identified in a similar study that focused on quality training initiatives in
the corporate arena: Is there a specific training content required to convey the
appropriate philosophy? Should a specific quality philosophy determine the
creation of training materials? How should the program be implemented?
Which employees and how many must be trained to effect organizational

change? Who should be responsible for the design and instruction in the
training program? How long should the training program be? How should
training sessions be conducted-at specified intervals or presented at one time?
Should attendance at training sessions be mandatory or voluntary? And, what
is the cost of continuous quality improvement training?
Stieber (1991) further sought to determine other variables which had an
impact on effective training for quality, such as upper- and middle-management
support of the overall effort. Many quality theorists have emphasized the critical
importance of upper management support (Juran, 1989; Deming, 1986; and
Crosby, 1976). Thus, Stieber also posed the questions: From which of the two
groups is support most critical? And, what should the supportive role of such
groups be during the training process?
Cornesky, McCool, Byrnes, and Weber (1991) agreed that one of five
necessary conditions for implementing total quality management in academic
institutions is the education and commitment of faculty and staff. They
explained:
All of the quality leaders make the point that before lasting change
toward quality can be realized, management must: (1) be trained in
quality processes and systems, and (2) make it clear that they will
support the commitment toward quality, (p. 95)
Although many training and development resources exist to assist
business and industry with quality training initiatives, there are no precise
answers to these questions. Just as corporate America has struggled with

training issues specific to the implementation of the quality philosophy, higher
education institutions will also seek answers to the same questions as well as to
questions which relate directly to the mission and goals of those institutions. As
yet, information about training related to quality initiatives at higher education
institutions is sparse.
In conjunction with the training mission, there is also the question of
whether or not such training is effective. Effectiveness in training programs is
characterized by how well outcomes are achieved as perceived by those who
are responsible for the training function as well as by those who are looking for
specific improvements in the organizational system. Crosby (1984) emphasized
that training for quality:
. . . must be done in a formal way so people will know that it is going on.
This means that classes must be structured and held. Courses must be
documented in some way, and some records must be kept of those who
qualify. Once training has been implemented, it is necessary to follow up
and see whether the students are indeed practicing what they learned,
(p. 169)
Kirkpatrick (1975) identified four levels or techniques for evaluation that
determine the effectiveness of training: Level 1: The trainee reactions; Level 2:
The change in trainee learning; Level 3: Behavior change on the job; and Level
4: The results to the organization. These four techniques have been the basis
for measuring the effectiveness of training programs in business and industry

over the past two decades. They have also been used as the measure for
effectiveness in this study.
A comprehensive study of the identification of the implementation
characteristics of effective continuous quality improvement training programs as
perceived by selected individuals in higher education institutions in the United
States would be beneficial to those administrators who must take a leadership
role and make decisions regarding the management system that would best
serve the college, its community, and those to whom it is accountable for
institutional effectiveness. In addition, this information will be helpful to those
higher education employees who are directly involved in the implementation
and evaluation of the training function for continuous quality improvement and
will provide administrators with the information they need to make appropriate
and effective choices for the future implementation of training programs
associated with quality initiatives.
Statement of the Problem
The problem of this study was to identify and describe the
implementation characteristics of continuous quality improvement training
programs and to determine whether or not and to what degree relationships
exist between the implementation characteristics and training program
effectiveness, as perceived by selected individuals at two- and four-year
colleges in the United States.

6
Purposes of the Study
The specific purposes of this study in relation to the perceived
effectiveness of training programs for the implementation of continuous quality
improvement processes at selected higher education institutions were to:
1. identify through the literature and verify through experts the extent to
which higher education institutions are involved in continuous quality
improvement training programs;
2. describe how the institutions are organized for training personnel in
the philosophy and tools of total quality management;
3. determine which methods of training are perceived to be effective in
implementing the total quality management philosophy in higher education
institutions;
4. describe the best practices for total quality management training at
selected higher education institutions;
5. describe the impact of total quality management training programs
within these institutions; and
6. provide information and direction for professionals charged with
making decisions associated with the implementation of training programs for
total quality initiatives in higher education institutions.
Research Questions
The following research questions were investigated to identify and
describe the implementation characteristics of continuous quality improvement
training programs and to facilitate an examination of the nature of relationships

between implementation characteristics and training program effectiveness for
quality training initiatives, as perceived by selected individuals at designated
higher education institutions in the United States:
1. What is the demographic profile of those higher education institutions
involved in quality improvement training?
2. To what degree is participation in quality improvement training
programs voluntary?
3. To what extent have various levels of personnel in the college
received training in continuous quality improvement practices?
4. How is quality improvement training scheduled: as one continuous
session, or at periodic intervals with employees returning back to the job
between sessions?
5. To what extent have training participants taken part in any evaluation
assessment of quality improvement training?
6. To what extent has quality improvement training been evaluated by
various assessment methods?
7. To what degree have specific quality philosophies or tools supported
the quality improvement training efforts?
8. To what extent have specific content segments been used as part of
the quality improvement training process?
9. To what degree has the institution's top management supported the
quality improvement training program?
8
10. To what extent is participation in quality improvement training and the
use of the new skills on the job made a part of performance reviews?
11. To what extent do institutions utilize external consultants versus their
own internal staff as trainers in the quality improvement training program, and is
there a difference in the perceived effectiveness of the training provided by
each?
12. To what extent are managers or supervisors involved in the
instruction for the quality improvement training program?
13. To what extent are pilot projects used and appropriate groups trained
for continuous quality improvement?
14. To what extent do two- and four-year colleges allocate funding for the
quality improvement training process?
15. To what extent does the allocation of funding for training in
continuous quality improvement at two- and four-year colleges influence the
perceived effectiveness of training?
16. To what extent do relationships exist between the major
implementation characteristics or training program variables associated with
continuous quality improvement training programs?
17. To what extent are there relationships between implementation
characteristics or training program variables and perceived quality training
program effectiveness?

18. To what extent do selected individuals at two- and four-year colleges
differ in their perceptions of the effectiveness of continuous quality improvement
training programs at their institutions?
Hypotheses
In order to address certain research objectives, the following hypotheses
were proposed:
Hypothesis 1 (Research Question 9): There will be no significant
difference between administrators, faculty, and staff, at two- and four-year
colleges, in their perceptions of the degree to which top management has
supported continuous quality improvement training programs.
Hypothesis 2 (Research Question 18): There will be no significant
difference between administrators, faculty, and staff, at two- and four-year
colleges, in their perceptions of the effectiveness of continuous quality
improvement training programs at their institutions.
Significance of the Study
This study investigated the implementation characteristics of training
programs for total quality management or continuous quality improvement and
the extent of the effectiveness of such training as perceived by selected
individuals at designated higher education institutions in the United States.
While total quality management has had a significant impact in management
processes within the business sector, the management philosophy is just

10
recently being embraced by the public sector and more specifically by higher
education management.
Qualitv-first principles are now considered to be a preferred management
system that business and industry have adopted in order to maintain an edge in
an increasingly competitive global economy. The proponents of the quality
management philosophy maintain that the characteristics which distinguish
exemplary companies from others are based in the knowledge that service and
innovation are built on the principles of listening, trust, and respect for the
creative potential of each employee (Juran, 1989; Deming, 1986; Peters and
Waterman, 1982; and Crosby, 1976).
The Harvard Business Review (1991) published "An Open Letter: TQM
on the Campus" which was written by the chairmen of six of the leading blue-
chip companies in the United States. Their goal was to improve the awareness
of TQM and initiate change within higher education:
We believe business and academia have a shared responsibility to
learn, to teach, and to practice total quality management. If the United
States expects to improve its global competitive performance, business
and academic leaders must close ranks behind an agenda that stresses
the importance and value of TQM. (p. 94)
The letter encouraged the forging of strategic links with higher education in the
pursuit of quality within the academy where institutions are "missing the
opportunity to lead change, and at worst, run the risk of becoming less relevant
to the business world" (p. 94). In addition, the letter suggested that universities

11
and colleges learn what leading TQM organizations here and abroad are
teaching their employees; establish research agendas in total quality
management; and take inventory of their curricula, measuring the proportion of
quality-related course content in core courses as well as in electives.
Adopting management concepts and practices from business is not new
to higher education, but only recently (within the past ten years) have educators
listened to the call for quality as it exists in the continuous quality improvement
process. Today a growing number of colleges and universities are recognizing
that quality concepts are more compatible with higher education than many
existing management systems (Sherr and Lozier, 1991). Higher education
institutions are struggling to survive in times of retrenchment, aging faculties,
and increasing accountability to students, parents, and legislatures. The quality
movement is being recognized as a viable method that can assist higher
education in meeting the challenges of the 21st Century without hesitation.
Godfrey (1993) identified ten emerging trends related to the theory and
implementation of total quality management in the public and private sectors
over the next ten years. These trends included: (1) revolutionary rates of
improvement; (2) expansion to all industries and all functions; (3) product
design and process engineering; (4) intense education and training;
(5) information systems and technology; (6) self-directed work teams;
(7) partnering; (8) self-assessment and benchmarking; (9) customer focus; and
(10) strategic quality management (p. 47). According to the author, each of
these emerging trends offer an opportunity for further research. In terms of the

12
trend for intense education and training, Godfrey stated that the concepts,
methods, and tools for modern quality management are new for most members
of the organization, but little research has gone into defining just what is needed
and when to ensure effective quality education and training.
Godfrey (1993) posed the following research questions relating to the
quality training function: What is the basic core of knowledge and skills needed
by all workers? What specific tools and methods are needed by specific groups
or work units? How do adults learn? What should be the mix of learning and
doing? And, what is the best way to deliver training? Why? (p. 57).
As higher education institutions adopt and adapt the quality philosophy
and employ training programs to achieve implementation, there is a need for
further data to analyze whether such training programs are effective. Further, it
is important to determine the adaptation in such areas as costs, benefits, and
the problems that have been encountered in the initiation of training programs.
Clearly, information about the effectiveness of training programs for the
implementation of continuous quality improvement in higher education is
important to those institutions that are currently involved in the continuous
quality improvement process, as well as to those institutions planning to adopt
this management philosophy and implement future training programs.

13
Definition of Terms
The following terms were defined as they related to the study:
Baldrige assessment is an institutional evaluation based on the 7
categories, 28 items, and 63 areas of the Malcolm Baldrige National Quality
Award Criteria.
Benchmarking is the process of reviewing, visiting and modeling the best
in class programs, services, and practices.
Chief executive officer is a strategist and the designated authority for the
total administration of policy matters and is the coordinator of aggregate daily
operations of an institution. He serves as the custodian of the institution as
appointed by the governing body of the institution.
Continuous quality improvement (CQ\) is a fundamental attribute of total
quality management, which arises from the philosophy that all business
operations and work activities can be done more efficiently. It requires the
development of a management approach that encourages identifying and
seizing on-going opportunities to improve.
Culture is the pattern of shared beliefs and values that provide members
of an organization rules of behavior or accepted norms for conducting business.
Customer is the end user of all programs and services produced within
an institution. Customers are both internal and external.
Cycle time is the amount of time it takes to complete a specific work
process.

14
Development refers to the organization's efforts (as well as the person's
own efforts) to increase a person's abilities to advance in his organization or to
perform additional job duties.
Effectiveness is the state of having produced a decided or desired effect;
the state of achieving customer satisfaction.
Empowerment is the freedom of all employees of an organization to
respond to customer demands and requests.
Expert is a professional whose intellectual well-being and personal traits
are in harmony with established norms and standards of contemporary authority
in that discipline.
Implementation characteristic is an element representative of a quality
improvement training program such as the degree of management support for
quality training efforts.
Major implementation characteristic is a vital element included in a
quality improvement training program such as a philosophy, tool, or content
segment.
Mission statement is a published document which defines an institution's
reason for existing. The mission statement is shared with all of the stakeholders
of the organization, both internal and external.
Organizational development refers to the improvement of the total
organization in order to change the culture of the organization which will
facilitate adaptation to a changing environment.
15
Stakeholders include employees, other organizations, communities,
legislators, and any other individuals who may be affected by the operations of
an institution.
Strategic plan is a detailed plan of action that an institution develops by
establishing and defining measurable goals to achieve continuous quality
improvement within an organization.
System is a set of well-defined and well-designed processes for meeting
the institution's quality and performance requirements.
Total Quality Management (TQM) is a management approach that seeks
to improve quality and increase customer satisfaction through a continuous
improvement process. All employees are held accountable for quality and are
given tools and training to fulfill this responsibility.
Training refers to the organization's efforts to improve a person's ability to
perform a job or organizational role.
Limitations and Delimitations
This study was limited to those higher education institutions identified in
the literature as utilizing a total quality management or continuous improvement
process as a management system in one or more areas of the institution. The
population of the study was limited to the chief administrative officers, training
managers, and total quality management professionals of these institutions. The
specific implementation strategies used in this study were limited to
characteristics exclusive of actual learning design. The study was subject to

16
limitations in the methodology of collecting data by mailed survey instruments
and interviews.
Assumptions
The following assumptions were relevant to the study:
1. The survey respondents were involved in a total quality management
or a continuous quality improvement process at their institutions when they
completed the survey instruments.
2. The study was practical, and the analysis described the current extent
of the effectiveness of training programs for the implementation of total quality
management as perceived by selected individuals at postsecondary institutions
in the United States.
Chapter Summary
In summary, this study was designed to determine the impact of training
programs for the implementation of the total quality management processes, as
perceived by selected individuals, at selected higher education institutions in
the United States. The purpose of the study was to identify and describe the
implementation characteristics of quality training programs and to determine
whether and to what degree relationships exist between the implementation
strategies and overall training effectiveness. In addition, the study included a
summary of the costs attendant to training programs at two- and four-year
colleges in the United States, as well as anecdotal descriptions of the problems
that have been associated with continuous quality improvement training as
described in the literature.

17
Administrators who are responsible for quality training programs in
higher education must be aware not only of the characteristics of effective
training but also of the relative importance of each characteristic. With such
information available, they will then be prepared to appropriate their resources
prudently to yield substantive and effective results from their training efforts.

CHAPTER II
REVIEW OF THE LITERATURE
Introduction
The quest for quality in higher education is not new; but as recently as
the 1980s, several major reform reports aroused new interest in quality
processes and practices in higher education. Most notable of these was the
National Institute of Education report, Involvement in Learning (Study Group on
the Conditions of Excellence in American Higher Education, 1984). The reports
were focused on issues of accountability, student learning and ability, program
effectiveness, and institutional accomplishments of mission—all considered to
be conspicuous failures of higher education.
Previously very little had been written or acknowledged about a systems
approach to curing such ills in the higher education domain. Not until recently
did higher education seek out a systems management approach or philosophy
which is known as Total Quality Management (TQM) or as it is more commonly
referred to in higher education circles, Continuous Quality Improvement (CQI).
Mangan (1992) reported that "across the country, colleges and universities
report success with the technique even though some skeptics say Total Quality
Management is just the latest jargon for the kind of collaboration and shared
governance that many colleges and universities have long practiced" (p. A25).

19
Within the last decade, a number of colleges and universities have
decided to determine whether or not the industry-based principles of total
quality management could help their institutions become better—more effective
and more responsive to the challenges ahead. Fisher (1993) reported that such
institutions as Oregon State, Wisconsin, Colorado State, Maryland, Minnesota,
Clemson, Georgia Tech, and many community colleges, had already endorsed
and adopted TQM in whole or in part. Jones and Timmerman (1994) observed
"Quality-conscious, cost-conscious college leaders across the country have
been studying with religious fervor the commandments of modern-day total
quality management (TQM) proponents from business and industry"
(p. 411).
Many higher education associations, organizations, and prestigious
journals have devoted much time and energy in the quest to discover and
understand the newest version of quality. In fact, Sloan (1994) described higher
education today as being compelled to respond to a rising tide of consumerism,
and TQM has been promoted as a way to address this issue, which in turn has
generated immense discussion and controversy in the academy. Seymour
(1994) indicated that "a mass of interested followers has emerged and TQM-
related activities have surged" (p. 1).
It is in the same spirit that this research is undertaken—to discover and
understand the continuous quality improvement efforts in higher education and,
more specifically, the quality training mechanisms that must be in place to
achieve the vision of continuous improvement.

20
The Concept of Quality
Quality has been defined as any continuous improvement of systems to
provide better products or service (Cornesky, 1989). W. Edwards Deming
(1986), a prominent quality theorist, believed that quality is whatever the
customer needs and wants. Peters and Waterman (1982) characterized the
philosophy of excellence as superior service to customers, constant innovation,
and a commitment to people, quality, and leadership. They maintained that the
characteristics that distinguish exemplary companies from others are based in
the knowledge that service and innovation are built on the principles of
listening, trust, and respect for the creative potential of each employee.
Philip Crosby (1990), a corporate vice president of IT&T, explained that
"quality really is just doing what you said you were going to do" (p. 6). It is
conformance to the requirements. According to Crosby, management has
learned that they actually can do something about quality by defining the
requirements—finding out what the customer wants, describing that, and then
meeting that exactly. He asserted that quality is a function of expectations and
that most errors are the result of lack of attention. He cautioned management to
stop doing the things that work against the ultimate goal of defect-free products
(Cook, 1991).
Seymour (1993b) emphasized that quality may be the most overused
word in the English language today.
People are willing to pay for it, organizations are driven to invest in it,
workers are exhorted to produce it, and advertisers feel compelled to

21
communicate it. Quality is a near universal goal. At the same time, it is
one of the least understood concepts. Everyone wants it. But what is it?
And once you decide what it is, how do you attain it? (p. 6)
The Japanese call it Kaizen (Imai, 1986). The West calls it quality control.
Education calls it excellence. But they all lead to the same goal—a process for
continuous improvement. A quality-first model is designed to permeate
principles of excellence throughout the organization and provide a means to
achieve Kaizen. which is the basic underpinning for the excellence in Japanese
management. It is the key to Japanese competitive success. Kaizen means
incremental improvement". . . on-going, involving everyone, everybody's
business. It is a process-oriented way of thinking versus the West's innovation
and results-oriented thinking" (Imai, 1986, p. xxix). The customer is the ultimate
judge of quality—both internally and externally.
Quality is the undergirding principle for continued success in many major
corporations in the United States. Geber (1990) confirmed that "applying quality
improvement principles to knowledge jobs is one of the most recent
developments in the national quality push" (p. 30). Ford Motor Company echoes
the refrain "Quality is Job 1" to its customers, to its competitors, its employees
and its suppliers. Everything accomplished at Ford is deeply rooted in an
allegiance to quality and excellence. Motorola Corporation has also been
touted as a quality company that has been involved in the pursuit of excellence
throughout its organization. Yates (1992) reported that total quality techniques

22
have cut manufacturing costs more than a billion dollars at Motorola within the
last ten years.
Kaufman (1991) enhanced the quality definition through his quality plus
model that depicts more than total quality as methods that extend the vision
beyond a satisfied customer to one who is both satisfied and well served. He
suggested that quality includes a societal-payoff dimension—moving beyond
client satisfaction to include client and societal wellness. Quality plus responds
to the need for a healthy, safe, and satisfied customer. This aligns with
Drucker's concept that doing things right is not as important as doing the right
things (Drucker, 1973).
Carothers (1992) believed that TQM is a philosophy that helps fulfill the
basic need of all workers; that is, a clearer sense of purpose in our work. He
espoused TQM as a natural fit for organizations like colleges and universities
"that rely on the intellectual and creative abilities of their people" (p. 9).
The Philosophy of TQM
Total Quality Management (TQM) has been espoused by the big three
gurus in quality consulting: W. Edwards Deming, Joseph M. Juran, and Philip B.
Crosby—the best-known names in the quality initiative. Each has spent a good
portion of his life telling companies that quality improvement is simple and that
quality focuses on giving customers what they want—on building quality into
products or services and continuously improving them. All three of these quality
champions have focused on getting management's attention to create

23
organization-wide participation in planning and implementing a continuous
improvement process that exceeds customer expectations. The total quality
philosophy was built on the assumption that 85% of problems are a result of
processes, not employees. TQM initiatives focus on doing things right the first
time, every time.
As a management model, TQM emphasizes precise quality benchmarks,
the importance of perfecting systems, and the decentralization of management
control over these systems. The five guiding principles of TQM include: creation
of an appropriate climate, focus placed on the customer, management by
data/fact, people-based management, and continuous quality improvements
(Juran, 1989; Deming, 1986; Ishikawa, 1986; Crosby, 1976).
TQM places responsibility for quality problems with management rather
than on the workers. A principal concept of TQM is the management of process
variation whereby variations in production or quality within a manufacturing or
service process are viewed as special cause variations, which can be removed
by employees operating the process; or common cause variations which
require management action to change some inherent feature of the process
(Kaufman, 1991).
C. Jackson Grayson, founder of the American Quality and Productivity
Center in Houston, Texas, maintained that real TQM got started only a decade
ago with the advent of the Baldrige National Quality Awards. Grayson described
TQM as: "Total, meaning all people, all functions, customers and suppliers;
Quality, meaning not just products, but processes, reliability, and quality of work

24
life; and Management, meaning senior management strategy, goal setting,
organizational structure, compensation, and profits." (Cook, 1991, p. 70).
The hallmark of TQM is the continuous improvement of organizations
which is accomplished through a shift in focus from outcomes (or products) to
the processes that produced them. TQM achieves its objectives through data
collection and analysis. Flow charts, cause and effect diagrams, statistical
process control techniques, and other total quality tools are used to understand
and improve processes. While there are many versions and adaptations of
quality across manufacturing concerns, and even more variants in service
industries and health care, TQM is considered to have its roots tied to the basic
axioms offered by W. Edwards Deming.
Deming's 14 Points Related to Higher Education
Total Quality Management processes, which were developed by W.
Edwards Deming, had its genesis in Walter Shewhart's earlier research at Bell
Laboratories. Shewhart focused on improving the reliability of telephones by
building quality assurance into the entire system of design and manufacture,
rather than relying on end-of-the-line inspection to remove defective phones
before they entered the marketplace. Deming had been an advocate of
Shewhart's work in statistical process control; and finding little response at
home for his ideas about quality, he took his show on the road to Japan.
Deming's quality crusade was considered to be largely responsible for the
Japanese industry's post-World War II recovery and dominance in world
markets.

25
Most U. S. manufacturers ignored Deming's work until the early 1980s
when severe competition was prevalent and ongoing improvement in cost,
quality, and productivity had become critical to economic survival. Deming
(1986) had the solution to this conundrum, which he espoused as a 14-point
system and which is the core of his philosophy. Gitlow and Gitlow (1987) stated
that although any one of the fourteen points could create improvement
individually, it is the implementation of all the points that will ultimately transform
an organization. Bonser (1992) noted that although not all of Deming's
principles may be directly applicable to higher education, a strong case can be
made that enough of them are relevant. A discussion of the fourteen points
follows below.
Point 1 involves creating a constancy of purpose for the improvement of
product and/or service (Deming, 1986). This means a never-ending
commitment to the improvement of quality and an allocation of resources for the
innovation and redesign of product and/or services. The organization's mission
statement will focus on quality, continuous improvement, and customer
satisfaction. Consumer research is utilized to meet the changing requirements
of the consumer (Gitlow and Gitlow, 1987).
Seymour (1992) commented:
. . . Deming's notion of constancy of purpose provides a consistent
philosophy and a unifying focus by emphasizing a long-term commitment
to a vision. It inspires confidence in everyone when the organization is
able to articulate its goals and practice day-to-day decision making that is

26
consistent with those goals. Giving people the tools and techniques, the
training, and the responsibility for causing quality creates a feeling that
the organization is investing in its own people, (p. 33)
Adopting the new philosophy to ensure customer satisfaction as the
primary goal of the organization is the essence of point 2 (Deming, 1986).
Walton (1986) illuminated: "Americans are too tolerant of poor workmanship
and sullen service. We need a new religion in which mistakes and negativism
are unacceptable" (p. 34). Seymour (1992) observed that if improved quality is
the goal, then the obvious answer to achieve it is to ask the people who work in
the system to join with management to work on the system.
Point 3 cautions organizations to cease dependence on mass inspection
to achieve quality (Deming, 1986). Basically this point challenges organizations
to ensure that quality is built into the processes in the first place to eliminate the
need for inspection on a mass basis which is usually at the end of the cycle or
production (Gitlow and Gitlow, 1987). Since inspection after the fact neither
improves nor guarantees quality, improvement of the process in order to
prevent defects enables organizations to 'do it right the first time'
(Scherkenbach, 1988). In academia this means ceasing dependence on testing
to achieve quality. Learning experiences that create quality performance must
be provided. Deming (1986) emphasized that grading should be abolished and
that rating people may have harmful effects.
Point 4 recommends ending the practice of awarding business on the
basis of price tag (Deming, 1986). Rather than using price alone, the emphasis

27
here is on evaluation of suppliers in such areas as management systems,
financial condition, location, political position, personnel qualifications, design
of product, manufacturing capability, purchasing power, inspection and testing,
quality coordination, and price (Gitlow and Gitlow, 1987).
Point 5 advocates the constant improvement of the production and
service system. This could be accomplished through the Plan, Do, Check, Act
(PDCA) cycle that is to be continually repeated in the quality process (Gitlow
and Gitlow, 1987, pp. 79-80).
Step 1: PLAN (P)—Collect data upon which a plan can be constructed for
what needs to be accomplished in a given time frame. Next, determine what
actions must be taken to realize the plan.
Step 2: DO (D)—Take the necessary actions that further the plan
developed in Step 1.
Step 3: CHECK (C)—Check the results of the actions by collecting data
to make sure that planning elements have been achieved.
Step 4: ACT (A)—Act by making the changes to the plan that are needed
to better achieve customer satisfaction and to continue what was successful.
Point 6 instructs organizations to initiate training on the job (Deming,
1986). All employees must be oriented to the quality philosophy and to the
organization's goals. Deming believed that most organizations are unable to
truly implement total quality because of their pervasive attitude that people are
an expense to be controlled rather than an asset to be developed. To achieve
success in the quality mode in higher education means that all levels of

28
employees—administrators, faculty, and staff—must be trained in the
philosophy and tools of quality. Thor (1994) explained that at Rio Salado
College all regular full-time employees completed a 40-hour basic TQM training
program. In addition, the average employee at that college has participated in
over eighty hours of training and sessions on such topics as giving and
receiving feedback, the stages of change, and driving out fear. All full-time
employees at Rio Salado have served on a continuous improvement team or
have been involved in the quality initiative.
Instituting leadership is the core of point 7, The chief responsibility of
management must be the development of people so that they continually
improve. Many of the management practices and principles that are required in
a TQM environment may be contrary to long standing practices in higher
education. Only a strong leadership team focused on quality improvement can
overcome the inevitable inertia and resistance to change by creating clear
quality goals and developing systems and methods for achieving these goals.
Senge stated that". . .in the learning organization, leaders are designers,
stewards, and teachers who are responsible for building organizations where
people continually expand their capabilities to understand complexity, clarify
vision, and improve shared mental models . . . and are responsible for learning"
(1990, p. 340).
Point 8 advises organizations to "drive out fear" (Deming,1986). There
must be an atmosphere of mutual respect where individuals are not afraid to
express ideas or ask questions, so that everyone can work effectively for the

29
organization. Empowerment was suggested as one strategy for achieving
enhanced effectiveness by allowing an individual or work unit to determine how
an outcome would be achieved (Peterson, 1993). Empowerment is usually
implemented from the top down and gives each person delegated authority with
concomitant responsibility founded upon accountability.
Breaking down the barriers between staff areas is the message of point 9
(Deming, 1986). Walton (1986) noted that departments or work units are often
competing with each other or may even have goals that conflict. Emphasizing
common goals that everyone in the organization can aspire to will facilitate
open communication within the organization (Scherkenbach, 1988). Strategies
must be developed to increase cooperation among groups and individuals in
the higher education arena to include faculty, staff, and administrators. Those
involved in teaching, research (faculty and institutional), student services, food
service, accounting, academic affairs, etc. must work as teams, both work teams
and cross-functional teams. Seymour (1992) reported that higher education has
notably few successful adaptations of teamwork concepts.
Point 10 suggests replacing numerical goals and slogans with the
continuous improvement process. Deming (1986) believed that slogans,
posters and other methods that urged productivity of the workers were not
effective and should be replaced with charts, graphs, and management reports
which depict progress toward achieving improvement. Lewis and Smith (1993)
maintained that in higher education the bulk of the causes of low quality and
low productivity belong to the system and are, therefore, beyond the control of

30
the faculty, administration, staff, and students. Exhortations, then, will create
adversarial relationships among and between these constituencies.
The elimination of quotas and management by numbers is the basis of
point 11. Deming (1986) contended that a quota is an impediment to the
improvement of quality and productivity because a specified goal may be
beyond the capability of the system and will not be reached. In addition, a
person may meet a quota at any cost, without regard to damage to the
organization, in order to keep a job (Walton, 1986). Within the academy,
performance standards for faculty, administration, staff and students, such as
increasing retention by X%, should be eliminated. Leadership should be
substituted for management by numbers and numerical goals.
Point 12 recommends that organizations remove barriers to pride of
workmanship. In the higher education setting, this point would translate to the
elimination of obstacles that rob faculty, administration, staff and students of the
right to take pride in and enjoy the satisfaction of personal performance and
productivity. According to Deming (1986) the typical appraisal system is an
inhibitor to continuing improvement in any organization. Within two- and four-
year colleges, this would mean abolishing annual merit ratings and the use of
management by objectives. The focus is shifted from quantity to quality.
Point 13 involves the retraining and education of everyone in the
organization. According to Gitlow and Gitlow (1987), this includes statistical
training, basic mathematics, reading, and communication skills, as well as
training employees to define the organization's mission and goals. The

31
academy must adopt and adapt these same training functions in order to
effectively implement continuous quality improvement processes which will
ensure the ultimate goal of institutional effectiveness.
The maintenance of a system which assures a never-ending quest for
continuous improvement is the essence of point 14. Deming (1986)
emphasized that management systems must be created which foster the
implementation of points 1-13. Everyone in the organization must work to
accomplish the transformation. Thus, in the academy, quality is everyone's
job—everyone acknowledges the focus of the quality philosophy and accepts
its potential to help the organization move in a common direction (Lewis and
Smith, 1994). Senge (1990) described the essence of individual responsibility
as personal mastery in The Fifth Discipline:
Personal mastery is the phrase my colleagues and I use for the
discipline of personal growth and learning. People with high levels of
personal mastery are continually expanding their ability to create the
results in life they truly seek. From their quest for continual learning
comes the spirit of the learning organization, (p. 141)
In summary, the heart of Deming's philosophy is an insistence that
management take the time and resources to create a positive and productive
climate in which employees are continually kept informed about the most
effective methods and practices to achieve continuous improvement. This
climate will enable employees to help one another to adapt, replicate, and
32
refine practices—essentially an ongoing process that continually improves
upon what is already working.
The Malcolm Baldriae National Quality Award
The Malcolm Baldrige National Quality Award, named for the late
commerce secretary, was established by Congress in 1987 to promote national
awareness of the importance of continuous quality improvements in U. S.
companies. It is considered to be America's highest honor for quality and is a
public/private partnership administered by the National Institute of Standards
and Technology. The award is a comprehensive and systematic method which
enables performance improvement in an organization.
Each year up to six Baldrige awards are granted with a maximum of two
awards in each of three categories—manufacturing, service, and small
business (Whittemore, 1990). The application process for this award is
considered to be quite lengthy and the attendant costs can also be significant. A
panel reviews each application and prepares feedback for each participant to
help them further improve the quality of their operations. The criteria for the
award is divided into seven categories, each with two or more examination
items. They include: leadership, information and analysis, strategic quality
planning, human resource utilization, quality assurance of products and
services, quality results, and customer satisfaction. These criteria have become
the standard by which organizations assess quality through benchmarking in an
ongoing effort to improve both processes and products.

33
Since the inception of the Baldrige award, a parallel award was created
for the educational entities in 1992 (Fisher, 1995). The Baldrige Education
Criteria remained the same as the Business Criteria but with modifications in
structure and content which were designed to accommodate the mission of
educational institutions. Thus, maintaining student success and institutional
effectiveness is the central focus of the Baldrige Criteria for Education. The
Criteria focus not only on the outcomes or results of educational institutions, but
also on the conditions and processes that lead to those results. Fisher stated
that "the Malcolm Baldrige National Quality Award Education Criteria are
directed toward delivering improved value to students and stakeholders while
simultaneously maximizing the overall effectiveness of the institution" (p. xiii).
As part of his role as senior examiner for the Malcolm Baldrige Quality
Award, Seymour (1996) explained why the Baldrige is needed in education and
what the first pilot year produced. According to Seymour, for higher education,
the Baldrige may be one of the best chances for the continuance of self-control
of college and university campuses. He cited the managed care aspects of
health care, which is considered to be a professional bureaucracy, as an
example of what might happen in academe. Seymour contended that the
Baldrige award is an alternative paradigm to business as usual in the academy;
and it deserves the attention of academe because "it provides a methodology
such that our professionals can correct deficiencies heretofore ignored; it is both
a systematic and systemic way to regain control over our own institutions"
(p. 11).

34
The education pilot criteria were built upon a set of core values and
concepts which constitute a comprehensive way to codify performance
improvement principles. During the first pilot year (1995) of the Malcolm
Baldrige National Quality Award for education, there were nineteen
applications—ten from higher education and nine from K-12. Out of a possible
1,000 points, the lowest score was 150 and the highest 450. There were no
awards in the 1995 pilot; however several site visits were conducted for those
institutions that showed signs of being a potential award winner. After a
thorough analysis of the results, Seymour (1996) summarized that the applicant
higher education institutions were immature in their development and that:
Leadership is where you must begin, and so it followed that leaders' first
efforts would be in planning and training. It also followed that the
applicants would be able to describe their approaches in these areas.
The initial weakness occurred with Information and Analysis; then,
lacking well-designed self-assessment strategies, for example,
meaningful results were rarely available. Further, innovative approaches
were often described, but few instances existed in which such
approaches were deployed across the institution, (p. 14)
Despite the mediocre performance in the pilot project, Seymour underscored
the value of the Baldrige award as a means to foster innovation by providing a
yardstick that will yield insights and ideas for improving organizational
practices.
35
TQM Applied to Service Sectors
Service industries, as well as public institutions, have been the last to
embrace the Deming quality-first system. Butterfield (1991) asserted that the
real reason service industry leaders have declined to adopt these points may
be that most service managers are too busy fighting fires and do not have time
to reflect. They simply do not think about how to translate Deming's concepts
into the language of service or to incorporate his principles into their corporate
culture. He recommended a revised 14-point list that speaks to the needs of
service industries and challenges leaders to develop a way to transfer this
knowledge to management and employees at all levels as quickly as possible.
In his article, "Improving the Quality of Education: W. Edwards Deming
and Effective Schools," Stampen (1987) affirmed that Deming's overall
approach to improving the quality of products and services in industry seemed
adaptable to the management of education. He suggested that the 14 points
were similar to those guidelines emerging from the literature about effective
schools and school improvement and that:
" . . . the Deming approach emphasizes something that has been
understood for quite some time but ignored by many educational
researchers and practitioners: namely, that the test of anyone's ideas for
improving the quality of educational services is whether they can be
shown to be effective." (p. 428)

36
Carothers (1992) reported that TQM is not restricted to manufacturing
entities or even to business. It has spread rapidly through all fields of enterprise,
to the service sector, to government, to health care, and now to education.
The literature provides a substantive collection of information which
corroborates the recent implementation of TQM principles in higher education
as a means to improving institutional effectiveness. The application of this
management philosophy has become a new challenge to higher education.
Total Quality Management in Education
Adopting management concepts and practices which originated in
business and industry is not new to higher education. Examples have included
the establishment of a formal chain of command, reports, inspections,
performance evaluations, competitive bidding, and strategic planning. An
alternative to many of these business practices may be total quality
management. Today colleges and universities are recognizing that TQM
concepts are more compatible with higher education than many existing
management systems (Sherr and Lozier, 1991).
The philosophy of Total Quality Management, however, has not been
easy to integrate into higher education systems. Sherr and Lozier (1991)
explained that the phrase total quality is a derivative of total quality control,
originally used by Feigenbaum in 1983. Higher education wants to provide
high-quality services, but there are varying methods to define and measure
quality. Furthermore, the words control and management imply centralization

37
and authoritarianism, so they typically insult the community of scholars. TQM
relates to statistical control—not to managerial decisions—and the need to
develop stable, predictable processes. It is not intended to imply control of
people or processes. Coate (1991) illuminated ". . . Faculty members see
themselves as emphasizing diversity. To them, the idea of quality control
suggests uniformity—an attempt to bring everything to the same level" (p. 28).
Sloan (1994) posited that the great challenge in adopting TQM on campus is
finding a language that effectively communicates the benefits of TQM to the
faculty, which will ultimately calm their apprehensions. As president of the
University of Rhode Island, Carothers (1992) addressed the issue of language:
Our challenge is not to fit colleges and universities into some customer
paradigm or language model derived from IBM or Xerox or PPG or
Kodak, but rather to answer the questions in our own way so as to gain
the self-knowledge that will help us to improve. Our challenge is to
change our habits, to adopt new ways of behaving so that we indeed
better serve those whose needs we now better understand. In struggling
with these challenges, the necessary language will emerge, and that
language will be ours, authentic and not derivative, (p. 8-9)
Marchese (1993) suggested that the pessimism about TQM in higher
education comes from a comparison with its adoption in industry. He explained:
"Motorola and Xerox remade themselves into high performing work
organizations because they had to—it was change now or die" (p. 13).

38
Marchese concluded that perhaps few institutions or people in higher education
feel that there is enough pressure to justify such a transformation.
Bender (1991) maintained that "if you can count it, you can improve it"
(p. 24). As superintendent of the Crawford Central School District in Meadville,
Pennsylvania, he embraced the principles of TQM. Rather than instituting TQM
throughout the system, Bender focused on specific project selection where
certain problem areas could be addressed, quantified, and improved. Bender
believed that the application of quality-first processes would be used
increasingly to solve problems in the service sector and that superintendents
and other top managers would also be able to improve the quality of
educational programs and services through visible and sustained commitment
to TQM.
Schargel (1991) declared that public education has been totally ignored
in the quality process. Where American public education was once regarded as
the best system, it is now considered second rate—scholastic aptitude test
scores are dropping; remediation classes are the norm in high schools and
colleges; many high school graduates cannot read, compute, write or think
critically; and the nation's high school dropout rate is staggering at 30% for all
students. (Averages for blacks and Hispanics are higher.) Schargel
recommended that schools establish the same quality standards and
techniques used by business and industry in order to regain the quality once
associated with the public education system. Heverly (1991) noted that TQM is
a technique traditionally reserved for the manufacturing sector but has recently

39
spread to service companies, government agencies, and educational
institutions.
CQI in Higher Education
A review of the literature has confirmed that the academy is actively
involved in the discovery and implementation of continuous quality
improvement processes, both in two- and four-year colleges and universities. In
addition, information exists as to what has worked and what has not in terms of
integrating quality principles in higher education across the United States.
Horine and Hailey (1995) discussed the key challenges to successful quality
management implementation in higher education which included
organizational culture, senior leadership commitment, faculty support,
implementation time, and training.
DeCosmo, Parker, and Heverly, (1991, p. 13) described the
implementation of TQM at Delaware County Community College (DCCC) as
"the new problem-solving paradigm in the search for quality . . . because it best
addresses some of the challenges we will face in the last decade of the
twentieth century." In the past, solving problems or making improvements at
colleges and universities equated to spending money. Higher education
institutions have added staff, constructed buildings, purchased equipment,
enrolled more students, and temporarily many problems were lost in the
paperwork. Today, resources are drying up, and costs and conservation of
resources are major issues in the nineties and into the next century. At DCCC
the principles and methods embodied in TQM are considered to be an avenue

40
to program and service excellence. These authors maintained that "competition
increases as the number of traditional students decline, and prospective
students enjoy a buyer's market" (p. 14).
Seymour (1992) reported that colleges and universities throughout the
country are struggling to survive. He noted that we are currently in the age of
consumerism, and college students are searching for quality and the total
student services package. Students and parents are more educated and
determined to get answers rather than be satisfied by the well-maintained
grounds and the football team. The quality movement in higher education is
fueled by competition, cost containment, accountability, and one-stop shopping.
According to Seymour (1992), colleges and universities tend to define
quality in their own jargon: the number of terminally qualified professors on the
faculty, the size of the library holdings, and securing and maintaining good
standing with accrediting associations. It has become apparent that the primary
customers of the institution do not want more library books and a set of faculty
degrees listed in the back of a catalog. The notion of customer satisfaction on
the collegiate campus has become heightened, and many students express
their frustrations with the traditional bureaucratic systems. As one University of
Texas at Austin undergraduate said, "Here, it's not what the system can do for
you, but what you can do to make the system work for you. You have to fight it"
(Wilson, p. A37).
Higher education has many internal and external customers and,
therefore, can no longer have the luxury of utilizing myopic definitions of quality.

41
The user is not limited to a student or a parent. The difficulty is that many higher
education institutions insist on the traditional definitions of quality and
accreditation standards. Therefore, the focus is limited and rigid. In contrast,
Seymour (1992) insisted that TQM is not concerned with debating definitions or
turf disputes but with developing and understanding constant improvement. At
the core of TQM is the question, "How can it be done better?" not "How well is it
doing?" Higher education is competitive, and quality is the discriminating
feature of the survivors.
Ellen Chaffee (1990) expressed her concern that educators "very often
do not do the right thing" (p. 101). She listed a plan of action that parallels some
of the elements of Deming's 14-point plan. Chaffee suggested that every person
in the organization must work primarily to discover and observe the real needs
of others. Administrators who are motivated by a service ethic see their role as
identifying and fixing inadequate processes inside the organization and
matching its services to the needs of students and the external society.
"Strategic quality management is not about organizational survival; it is about
satisfying and delighting constituencies" (p. 113). Another important aspect of
the plan of action is for the individual to be treated with dignity and respect at all
times. Chaffee indicated that the final step is for management and
administration to shed the need to control people in favor of a need to liberate
people. This action is rewarded by empowering individuals to take corrective
actions without unnecessary involvement from supervisors.

42
Edwards (1991) provided a concise presentation of the benefits of TQM
in terms of three components of the total quality system: teamwork, statistical
process control, and a documented measurement/management system. He
concluded that TQM can help higher education to: (a) focus on the proper
needs of the market, (b) achieve top-quality performance in all areas,
(c) produce systems for achieving quality performance, (d) develop measures of
achievement, (e) help institutions to become competitive, (f) develop team
approaches, (g) improve communication, (h) reward outstanding achievement,
and (i) facilitate a continual review process.
According to Seymour (1992), we are foolish to think of quality as inputs,
such as the number of Ph.D.s held by the faculty or the status of accreditation
standing. Seymour stated:
Quality runs deeper than that, much deeper. Quality must be embedded
in the institution's heroes, it must be manifested in the way that buildings
are maintained, it must be evident in how people treat each other, and it
must be at the very essence of what the organization and its members
hold most dear. (p. 148)
Seymour (1992) has dubbed the college environment as a new culture of
quality with everyone at the college a service fanatic. However, he softens the
rigor of TQM's use of statistical controls and appropriates large chunks of
academic marketing, strategic planning, and better communication in his plan of
TQM for higher education. A survey of 22 colleges and universities that were
among the TQM pioneers was conducted by Seymour in 1991. The survey
43
found that while many of the benefits of TQM were difficult to quantify,
institutions often reported that employees felt better about their jobs, students
were happier, and the process had helped to break down the barriers between
faculty, staff, and management.
Barriers to the Implementation of TQM in the Academy
On the cynical side, there are those detractors of TQM who argue that the
management process cannot fit in today's higher education world. Fisher (1993)
maintained that "TQM may help in administrative service areas . . . but it offers
nothing that smacks of amputation, risk taking, or dramatic change" (p. 17). He
acknowledged that TQM in higher education may assist in helping do what we
do better, but what we really need is something different such as inspired
leadership, a long-range plan, individual accountability, and cost reduction to
effect changes that will truly cure the ills of the academy.
McCormack (1992) theorized that TQM efforts often do not meet
expectations "because people fail to distinguish between philosophy and
strategy. A disappointing outcome is usually due to weak tactics and the lack of
a strategic framework." (p. 43). He suggested that to continually improve the
quality of products and services, a strategic or operational framework must be
established that will provide focus, guidance, and consistency.
Winter (1991) suggested several barriers to the acceptance and
application of TQM into higher education institutions. One major barrier is the
organization's view of itself as currently using participatory decision making.
Winter cited a survey conducted by the National Center for Research to Improve

44
Postsecondary Teaching and Learning, which indicated that the majority of
administrators believed that faculties have a large influence in deciding
institutional academic policies and departmental matters. Thus, there is the
underlying assumption that this decentralization supports and promotes the
participatory process. Therefore, institutions are reluctant to invest any more
time and effort into learning and implementing a system that they believe is
already in use.
Ewell (1993) agreed with this perspective, characterizing the notion as
the academy's recognition that most of these things appear to be already in
place. However, he cautioned that even though many core ideas of quality do
have compelling academic counterparts, there are many things that are not so
simply translated to the quality vernacular.
Another barrier identified by Winter (1991), which is unique to an
educational institution, pertains to the top leadership. The emerging role of a
college or university president as an external ambassador concerned with
activities such as legislative issues, community involvement, and outside
funding, may necessitate delegation of internal leadership to other
administrators. In terms of the implementation of TQM, this may limit the
effectiveness of the new initiative.
According to Winter (1991), the lack of a shared vision, which is
embraced and supported by the entire institution, poses yet another barrier to
implementing TQM in a higher education organization. Faculty members have
become more isolated from the global institution and their loyalties tend to be

45
more focused on their disciplines and departments rather than on the institution
as a whole. In addition, the loyalty of administrative staff members is limited by
their perception of lack of support from the top management. This type of
organizational culture will not easily accept programs such as TQM.
Bonstingl (992) identified some of the potential pitfalls and obstacles in
the adoption or adaption of TQM in education as: (1) Total Quality is not just
another project to do while you wait for the next hot item to come along.
Therefore, commitment to a major transformation and way of thinking is
required; (2) Top leadership is essential for effective quality processes. They
must demonstrate openly their ongoing personal commitment to TQM to inspire
the faculty and staff; (3) Training is essential if the meaning of TQM is to become
embedded in the culture of the campus. Resources must be invested to provide
adequate training that conforms to the language of academia; and (4) There is
no magic plan to institute quality perspectives—it comes with continuous
learning.
Hansen (1993) reflected on why adoption of TQM has lagged in higher
education. He suggested that there are few adherents because many
institutions may regard TQM as just another fad—much like the long discarded
MBO (management by objectives) approach of the 1970s. Hansen also posited
that a slower acceptance or infusion into the instructional areas of the institution
are due to differences in organizational structure. According to this author,
colleges and universities ". . . are composed of faculty members, sometimes
working in groups, but more likely alone, who create new knowledge,

46
synthesize existing knowledge, and transmit new and existing knowledge
directly to students, and less directly to the general public" (p. 261). Difficulties
with the concept of continuous quality improvement may, therefore, arise
because the majority of faculty members do not see their work as contributing to
output or to the satisfaction of the institution's customers.
Coate (1993) concurred that the most common barrier to the successful
implementation of TQM is the conviction that it is just another fad—or the latest
thing in management philosophies. He emphasized that TQM is much more
than a fad; it is an evolution of many systems based in the behavioral sciences,
and it is right for today's workplace. Additional barriers identified by Coate
included: (1) The barrier of time, meaning the time that TQM takes is significant
especially in terms of holding team meetings; (2) The barrier of language, which
is derived from an industrial model. Often faculty members are suspicious of
such terms as quality control, process performance measures, and customers;
(3) The barrier of middle management, where mid-level managers did not have
the expertise to facilitate a teamwork approach or perhaps they were unwilling
to do so; (4) The barrier of university governance, where there is no hierarchical
structure on the academic side, yet a well-entrenched system of politically
correct committees and task forces may exist; (5) The barrier of dysfunctional
work units, where internal existing problems will not be remedied by TQM
processes; and (6) The barrier of attitude, where expectations may exceed
possibilities, where suspicion transcends acceptance of an industry-based
model, and where a basic resistance to change is the norm.

47
Several education reports have also documented problematic
implementation efforts in colleges and universities. Entin (1993) completed a
study of ten higher education institutions in Boston who had reported interest in
the implementation of TQM. The primary findings from Entin's work were:
1. There were no specific TQM philosophies or techniques utilized at any
of the colleges visited. The TQM advocates seemed to be flexible and pragmatic
in approaching implementation.
2. At the six institutions where the president was predisposed toward
TQM, introduction of the subject of TQM was followed by a training session for
the senior management. The training was conducted by an outside consultant
or professional trainer and lasted one or two days. Entin (1993) noted that the
training led to further serious discussions about TQM which sometimes fostered
opposition by some campus leaders.
3. On several campuses, senior non-academic administrators affirmed
the value of TQM and proceeded to implement the concepts within their work
units. In eight of the institutions Entin visited, one or more administrative units
were involved in implementing some form of TQM.
4. Even though seven of the ten institutions had begun to study and
employ TQM two year's prior to Entin's visit, all of the advocates perceived their
institutions as iust beginning. Those involved in the process considered
implementation to require between five and ten years to impact the culture of
the organization and its ways of doing business.

48
Entin (1993) concluded that the success of TQM is related to the level of
commitment by the college president and senior administrators. In addition,
Entin suggested that two conditions are necessary if TQM is to move beyond the
fad stage: (1) college presidents must recognize TQM as a means to resolve
major problems facing their institutions; and (2) senior academic affairs
administrators and faculty must believe that TQM is related to their concerns
and interests (p. 31).
In a follow-up report one year later, Entin (1994) found that five of the ten
Boston institutions he studied either abandoned or delayed their TQM
implementation efforts after a year or two of involvement because of
unprecedented crises such as major budget deficits and prospective employee
layoffs. One of the institutions that declared that formal implementation of TQM
had stopped, reported that TQM had been replaced as a priority by
multiculturalism. At four of the remaining institutions, TQM occurred in selective
work units in which there was a champion for continuous quality improvement.
At the tenth institution, Babson College, TQM was reported to have strong
support from the top management and was being integrated into many other
areas of the college. Entin (1994) reported that Babson has thoroughly
embraced the quality philosophy and is now "managing by fact instead of by
intuition and anecdote" (p. 4).
Entin (1994) concluded that inadequate training in quality management
principles and tools on campuses was a key reason for the failure of the TQM
efforts in higher education. He maintained that campuses do not understand the

49
nature of the disciplined approach of TQM and that it requires special tools and
ways of doing business that must be studied and practiced. Another reason
offered for the apparent failure of TQM at these institutions is the culture of
academic institutions which are resistant to change. Entin also stated that initial
interest in TQM may be prompted by administrators looking for a way to ease
fiscal problems which does not generate broad institutional interest.
Seymour and Collette (1991), in a study of 25 colleges and universities
activating TQM processes, also reported implementation problems such as: lack
of time, a tendency toward lip service, aversion to change, inability to get below
the surface, the recognition of real teamwork versus turfmanship, and a lack of
tangible results.
Notwithstanding the apparent perceived impediments, the implementa-
tion of continuous quality improvement processes is still attractive to many
higher education institutions. Institutions that survive the increasing competition
will be those that best meet the demands of their students, employers and
communities. Adopting a total quality management or continuous quality
improvement process may give institutions the competitive edge and credibility
needed to attract investments for further development. It would appear that
those institutions that capture the quality niche in the nineties will meet the
challenges of the 21st Century without hesitation.
Case Studies about TQM in Higher Education
The literature described many examples of the implementation of total
quality principles or continuous quality improvement at higher education

50
institutions across the country. The case studies included below identify the
successes and disappointments with the implementation of quality practices at
several two- and four year colleges.
Fox Vallev Technical College. In 1985, a Quality First process was
implemented at Fox Valley Technical College in Appleton, Wisconsin. Under
the leadership of its president, Dr. Stanley Spanbauer, a quality model
commonly used in manufacturing was adapted to provide a system to improve
productivity, reduce costs, and ultimately lead to educational excellence.
Spanbauer (1987) noted that one of the key elements of this program was the
development of human educational resources to their highest potential. At Fox
Valley, the general theme was that "Quality First is a perpetual activity" (p. 180).
Fox Valley was the forerunner in the implementation of TQM in higher
education in what Spanbauer called a cultural revolution. He maintained that
TQM means moving away from the idea of managers and toward the idea of
leaders. "It also means changing the way we think about what we do, why we
do it, and who are our customers" (Hendley, 1992, p. 6). At Fox Valley Technical
College, many improvements and successes have been attributed to the TQM
philosophy: the drop-out rate decreased while the number of businesses
working with the college continued to climb; an employee union contract was
settled through a win-win negotiation process; and employee grievances were
drastically reduced.
As a part of the emphasis on customer satisfaction, this college offered a
variety of guarantees to its customers. Businesses and industries that used the

51
college for training programs were guaranteed refunds if they were not satisfied
with the results. Graduates were guaranteed placement or free retraining if they
could not find a job. And, as part of its total commitment to customer service, the
college also provides proficiency statements along with its certificates and
diplomas.
Spanbauer (1987) conceded that certain problems arose while the
college was in the process of adopting quality-first principles. These included
lack of commitment from those involved, aversion to change, poor planning, and
early expectations. But even with these challenges, Spanbauer believed that
educators have to realize that
. . . quality is not only the right thing to do, it is necessary for the survival of
the American educational system. Even educational systems need to
remain competitive. If we don't do it, the Japanese will be here to do it for
us. (Hendley, 1992, p. 7).
Oregon State University (OSU). Oregon State University began its
conversion process to TQM in 1989. Coate (1991) described and analyzed
OSU's conversion and identified nine distinct phases in the process. The
purpose of phase one was to create a critical mass of top management people
who would be willing to support and test the concept. At the conclusion of phase
one, the president and cabinet were enthusiastic about the potential of TQM.
However, the initial response from the academic side of the university was
negative, and they described it as just another management fad. In phase two,
OSU established a pilot study team in the physical plant area that ultimately

52
improved service and morale in the department. Phase three focused on
identifying customer needs through a process of quality function deployment
(QFD). Through the use of tools such as customer surveys, focus groups,
complaints, and comments, OSU learned that its marketing function was almost
nonexistent and, therefore, lacked any awareness of customer-driven systems.
Phase four identified priority breakthrough items, which is essentially a strategic
planning process. Breakthrough items are activities designed to general quality
improvements in the systems and procedures of an organization. This phase
underscored the importance of the president's participation in extensive
planning sessions as well as the acknowledgment that the implementation of
TQM processes throughout the university would take many years. Phases five,
six, seven, and eight extended breakthrough planning in the university's
divisions, involved the formation of daily management teams, initiated cross-
functional pilot projects and the implementation of cross-functional TQM. Phase
nine set up reporting, recognition and awards systems.
Coate (1991) reported that at Oregon State, TQM was vital for the
realization of its vision as well as for its continued survival in the marketplace.
"Quality is what customers say it is, not what universities tell them it is" (p. 37).
Coate acknowledged that although TQM is a simple concept, its application in
the university setting proved to be a challenge. Coate commented that based on
OSU's experience, the successful implementation of TQM in a college or
university depends on the observation of six key principles: (1) gaining support
from the top management; (2) finding a champion who has considerable

53
authority; (3) acting quickly to form and operate teams; (4) assuring that teams
are adequately trained; (5) utilizing breakthrough planning to assist with the
alignment of work units and the integration of strategic planning processes; and
(6) starting TQM on the service side of the university or college.
Syracuse University. Shaw (1993) described the two distinct factors that
prepared the Syracuse University environment for TQM as motivation and
means. The motivation for reform at Syracuse was the need to align the
university's budget with its enrollment. A retrenchment effort was undertaken in
certain areas of the university while other areas received budget add-ons as
incentives. Shaw, the chancellor of Syracuse, noted that the strategic nature of
the plan sent a clear message that the university was intent on focusing on its
strengths. As one of the new initiative to capitalize on their strengths, TQM was
initiated.
The means for bringing continuous quality improvement to Syracuse
started at the top with the chancellor's cabinet. This management team opted to
employ a gradual approach to TQM which required the training of existing top
management, utilizing outside consultants who concentrated on awareness
training as well as various TQM tools. The cabinet then hammered out
definitions of the university's mission and vision.
The next step was the creation of four pilot teams—financial aid, bursar's
operations, health services, and classroom environment. Team leaders and
members received four days of intensive training to learn the skills required for
successful TQM implementation. Shaw (1993) reported that beyond the

54
improved morale, many successes were posted by each of the pilot teams at the
university. Additional successes also materialized from a new mindset on the
campus that was not necessarily from the formal TQM approach.
Based on the experiences at Syracuse University, Shaw (1993) offered
the following TQM checklist for those institutions ready to try the continuous
improvement management style: (1) Allocate adequate time and resources to
the training and implementation functions; (2) Use the power of example by
studying the experiences of other TQM programs in both the private and public
sector; (3) Communicate effectively across the institution about the ongoing
efforts; (4) Address areas of quick and visible impact at the onset of the initiative
to report early successes and maintain momentum; (5) Expect some anxiety
and cynicism about TQM; (6) Adapt the effort to fit the environment, realizing that
each institution will need to tailor TQM to its particular situation. Shaw
explained,". . . there is no perfect model, and we are willing to take the time to
adapt the program to fit our needs" (p. 27); (7) Be willing to change—learn from
experience and change approaches when necessary. For example, the
intensity of training and work required in the early stages may not be necessary
in all service areas; (8) Expect change which is a product of the new methods
and improved services. Learning to live with change is one of the significant
challenges of adopting the new approach; and (9) Don't expect everyone to
applaud the effort. There will be many critics of the attempts at being customer
driven. Shaw noted that". . .there also has been a steady hum of discontent to
spur us toward even greater improvement" (p. 27).

55
Delaware County Community College (DCCC). Among the first two-year
colleges to adopt the total quality management system was Delaware County
Community College. Under the leadership of its president, Richard DeCosmo,
the implementation of TQM was "the result of extensive study and training for
top-level administrators at the college" (Entner, 1993, p. 29). It was determined
that the total quality approach would provide tangible payoffs for the college
which was faced with diminishing resources. DeCosmo, Parker, and Heverly
(1991) maintained that a community college implements Total Quality
Management to "conserve resources, improve effectiveness, capture the quality
niche, and increase participation in decision making" (p. 13).
Entner (1993) reported that the commitment to TQM at DCCC was
formulated into three goals: (1) to transform the college's philosophy of
management to total quality (TQ); (2) to develop training curricula and
programming in TQ for businesses in the DCCC service area; and (3) to
incorporate the concepts of TQ into curricula and classroom management. The
college administration and board of trustees spent almost fifteen months re-
examining the college's philosophy, mission, goals, and strategies to ensure
their continued relevance for the next decade.
Delaware County Community College used the Malcolm Baldrige criteria
as a model to design its plan for a thorough emersion into total quality systems
and practices. The executive staff was the first to be trained in TQM and was
also responsible for developing the plan and identifying goals for TQ
implementation. Entner (1993) noted that "when TQ planning was made a part

56
of regular staff meetings, it started to become an integral part of the college's
processes" (p. 31). The members of the executive council were responsible for
implementing TQM within their respective work units.
Entner (1993) reported that TQM awareness training was mandatory for
all administrators and the majority of the support staff, and all new employees
were expected to attend similar TQ training. Employees at the college also
received just-in-time training, which allowed for special training concepts as it
coordinated with the master TQ implementation plan. Faculty members were
also involved in planning an orientation to TQ for faculty and were also
responsible for exploring special projects that would bring TQ into the
classroom.
The strategic planning processes at the college were focused by a ten-
year plan and a three-year subset of that plan. All departments were involved in
activities which supported the strategic goals. Quality improvement teams were
formed as necessary to accomplish the identified tasks. All of the employees at
DCCC were empowered to identify pilot projects which were handled with a
teaming approach. Entner (1993) described some of the early successes as
improvements in telephone communications, class scheduling, and
reprographics. He emphasized that "the teamwork and communication involved
in identifying and charting processes and related problems has provided a
natural bridge to team problem solving" (p. 33). One of the benefits of
implementing TQ principles was that the college staff were actively involved
with one another in a process of documenting and standardizing college

57
operating procedures which may have previously wandered from their intended
purposes.
The president of DCCC cautioned that TQ requires an intensive
commitment: "Causing a cultural change, especially in a traditional institution, is
not one for faint-hearted leadership" (p. 34). DeCosmo, et al. (1991)
emphasized that the executive staff is convinced of the worth of the effort given
to TQM implementation at DCCC. They concluded "Success in implementing
TQM will allow DCCC to continue to meet the needs of its stakeholders well into
the next century" (p. 23).
Virginia Commonwealth University. Cowles and Gilbreath (1993)
described the adoption of TQM at Virginia Commonwealth University (VCU) as
taking place while the institution was in a virtual state of turmoil—suffering from
divided campuses and a decentralized organization with no common
management philosophy as well as deep budget cuts and low morale among
students, faculty and staff. None of these issues would suggest a fertile
environment for the implementation of TQM, which requires cross-functional
decision-making, consistency and constancy of purpose from the top
management, and considerable initial investments of time and money (p. 282).
Interest in total quality management was piqued at the administrative
level at VCU and subsequently was shared with the university's academic
administrator's council. TQM emerged through a slow, arduous plan of tackling
pilot projects to test the waters. Unlike most other institutions who have
embraced the quality movement, VCU faculty members encouraged the
58
administration to view them as resources within the university who could
contribute to service quality improvement efforts as well as share in the
responsibility of such efforts. The faculty at VCU felt that quality concepts and
tools were applicable to the teaching, research, and service activities of faculty.
To initiate the TQM effort, the faculty resource team hired a consultant
who provided an independent view of TQM for the president's council.
Subsequently the consultant recommended that a quality council be formed.
Instead, however, the president used the monthly council meeting as a forum for
presentations about quality management. Several outside speakers were
invited to share their experiences with total quality management. These
speakers stressed the critical role of top management in supporting the effort as
well as the importance of employee training. Cowles and Gilbreath (1993)
noted ". . . key leaders were not inspired to embark on an intensive self-
education program" (p. 287).
The pilot teams, guided by an outside consultant, tackled a series of
improvement projects that had impact across the university. All of the attempted
improvement efforts were considered to be beneficial. Not only were the initial
problem conditions solved, but also there was improved communication and
morale throughout the campus. Virginia Commonwealth University conducted
an assessment of the TQM pilot projects. Members of the guidance and project
teams participated in the summative climate assessment which confirmed that
the participants wanted to provide quality services and believed that the goals
they identified were realistic and achievable. They also identified what they
59
considered to be necessary conditions for the achievement of a continuous
quality improvement process. These included: open lines of communication,
employee involvement in decision making, cross-functional management,
recognition of employees who make contributions to improve service quality,
creating a climate of change, engaging in fact- and information-based decision
making, and establishing clear lines of responsibility and accountability.
In a separate report to the president's council, the faculty resource team
emphasized that changing the atmosphere of a large organization like VCU
requires changes on the part of the leadership of the organization. They noted
that while there had been an infusion of total quality awareness and an
appreciation of the effectiveness of TQM in certain areas of the university, key
leaders at VCU had not acquired the depth of knowledge about TQM concepts
to afford them the ability "to make an informed decision about adopting TQM as
the philosophy for managing the institution" (Cowles and Gilbreath, 1993,
p. 297). The faculty resource team recommended that the senior leadership of
the institution participate in an intensive education program to include a level of
knowledge sufficient to understand fully what it would mean to adopt TQM as its
operational philosophy and to secure the services of one or more experts
outside of the university to help top management through the initial
transformation stages of TQM. The president's council responded that the
university was not in a position to pursue quality as the team had
recommended. Instead quality efforts were to be under the direction of each of
the vice presidential areas within the university. In the absence of a clear
60
university-wide TQM mandate, pilot projects were to continue but within specific
functional areas.
Cowles and Gilbreath (1993) noted "Faculty resource team members
view the current status of TQM at the University level as in a holding pattern.
with a considerable amount of ongoing activity at subordinate levels" (p. 300).
Those participants guiding the pilot projects felt that the top management's
decision to stall the full implementation of TQM was preferable to a shallow
commitment to the management philosophy. The critical issues in the
implementation process at VCU can be summarized as: defining top
management's role in the quality transformation, deciding the appropriateness
of adopting or adapting the quality processes, learning to cope with change so
there is improvement over the previous condition, and creating a quality culture.
Summary. All of the previous cases studies have a common thread of
underlying issues which initially evoked interest in the new management
philosophy. In addition, each of the institutions seem to have realized that
certain essential elements relating to continuous quality improvement
philosophies and methodologies appeared to be more conducive to a
successful transformation. These essential elements align with the implemen-
tation characteristics which were identified as the core independent variables
for this study.
Related Research on Quality in Higher Education
A search of the literature revealed several studies which have
investigated issues pertaining to the philosophy, principles and/or practices of

61
continuous quality improvement processes in higher education (Anyaocha,
1984; Baas, 1995; Baugher, 1992; Brocato, 1994; Carroll, 1994; Dhiman, 1995;
Fritz, 1993; Greene, 1994; Huang, 1994; Lazio, 1991; Miller, 1993; Moore,
1994; Rux, 1994; and Stiehl, 1992). A description of several of these studies
was warranted as they related to the implementation characteristics of TQM.
Leadership. Dhiman (1995) explored the leadership issues involved in
facilitating the transformation from the current management paradigm to a TQM-
managed paradigm. Focus group interviews and an attitudinal survey were
employed to collect data for the study which included participation by 140
academic leaders. The participants in the focus group interviews agreed on the
following key challenges to leaders: (1) unfamiliar business language of TQM;
(2) inveterate resistance by faculty; (3) individualistic reward/evaluation system
in higher education; (4) departmental separatism; (5) the tradition-based
orientation of higher education is resistant to change; and (6) the perception of
TQM as a downsizing measure. The survey respondents strongly agreed with
several of the findings which included the following: (1) improvement in
outcomes was essential in order to regain public trust.; (2) higher education
must rely more on performance than on resources in the wake of budget cuts
and dwindling resources; and (3) leadership is critical to the success of TQM.
Huang (1994) also investigated the leadership role of presidents in total
quality management efforts through an assessment of leadership styles and
their relationship to performance of total quality leadership behaviors. The
population study consisted of 120 presidents, administrators, and faculty at four-

62
year colleges and universities that had implemented the principles of TQM in
the administrative functions. Two questionnaires were completed by the study
population. The Leadership Behavior Description Questionnaire identified the
two dimensions of leadership styles—consideration (people-oriented) and
initiating structure (task-oriented). The Total Quality Leadership Behavior
Questionnaire was also used to measure the presidents' performance of total
quality leadership behaviors. The results of the study revealed that:
(1) presidents at the selected universities performed total quality leadership
behaviors to a limited degree; (2) strong, positive relationships emerged
between the two dimensions of leadership styles and the presidents'
performance on quality leadership behaviors; (3) presidents indicating a high
consideration/high initiating structure performed total quality leadership
behaviors more often than the other presidents with other leadership styles;
presidents with low consideration/low initiating structure tended to perform
quality leadership much less than other presidents with other leadership styles;
and a strong, positive relationship emerged between length of time of the TQM
implementation in the college or university and the presidents' performance on
total quality leadership. Huang concluded that in the quest for successful
implementation of TQM, top-level administrators must modify or change their
leadership styles to be high on both consideration and initiating structure
dimensions in order for them to exhibit quality leadership behaviors.
TQM Implementation and Assessment. Carroll (1994) investigated the
perceptions of the directors and coordinators of Total Quality Management

63
programs in higher education concerning the implementation and barriers
associated with the quality initiatives on their campuses. In addition, the
researcher examined the nature of administrative support for the quality effort at
each institution. The research questions for this study concerned the
implementation level of TQM, circumstances prompting the use of TQM,
implementation barriers, program resources, and administrative support. The
findings of this study led to several conclusions which were: (1) the implemen-
tation of TQM was only recently started in higher education; (2) external
pressures provided the impetus to move the institutions toward total quality
initiatives; (3) faculty resistance and lack of understanding of TQM
methodologies presented a significant barrier to quality improvement;
(4) commitment from top-level administrators was necessary for acceptance of
TQM implementation; administrators did not model the behaviors necessary to
reinforce the quality principles; and, (5) few institutions have experienced
significant changes in the organization of senior staff since beginning TQM.
Carroll recommended that future research on this topic might include
investigation of both successful and unsuccessful TQM implementation projects
and the identification of methodologies to successfully involve faculty in the
quality movement.
In a study of 200 colleges and universities, Miller (1993) examined the
degree to which Chief Student Affairs Officers (CSAOs) perceived the Malcolm
Baldrige National Quality Award (MBNQA) criteria to be applicable to assessing
quality processes in student affairs divisions. Respondents to the survey

64
evaluated the applicability of each criterion to the MBQNA, identified additional
criteria, as well as strengths and weaknesses of the criteria. The MBQNA criteria
were perceived to be applicable to assessing the quality of student affairs in
higher education. In addition, the responses by student affairs officers also
generated two potential additional criteria—the assessment of academic and
student development outcomes and the quality of financial management. In
terms of the seven categories of the MBNQA criteria, customer satisfaction and
leadership were viewed as most applicable with quality results viewed as less
applicable to higher education. It was also noted by Miller that the language
and definitions employed in total quality management were perceived as
complex by the study population.
Baugher (1992) applied the TQM approach to the academic classroom at
Samford University through a process entitled LEARN, which allows teachers
and students to address classroom learning issues. Student quality teams were
used within the teaching and learning environment. The LEARN process
supports the concept of continuous quality improvement. According to Baugher
this process helped to establish a learning community in a time-on-task
environment which is sometimes hostile to teacher-student discussion
concerning course direction and problems. The researcher assessed the
LEARN process and its materials through an outside expert evaluator, as well
as by piloting the process in three classes at Samford. Other evaluation
techniques included focus groups and participant observation, both of which
indicated initial success for the student quality team process.
65
Strategic Planning and TQM. Moore (1994) explored the compatibility of
strategic planning and total quality management in higher education institutions
and the extent to which quality conceptions were clarified when both processes
were used. A qualitative research method was used to conduct case analyses
at three higher education institutions. Qualitative content analysis was used to
synthesize and analyze a data base consisting of 52 interviews and extensive
written documentation. The findings of the study indicated that strategic
planning and TQM were generally complementary although conflicts can arise.
The data suggested that there were nine areas of compatibility and four areas of
potential conflict between the two processes. The researcher posited that the
combination of both processes may equip higher education institutions to
address the prerequisites for institutional survival and institutional effectiveness.
In addition, the researcher suggested that the synthesis of strategic planning
and total quality management into an integrated system could provide benefits
to a university which outweigh those provided by implementation of either
process in isolation.
Implementation of TQM through Training Programs
Training is a recurring theme in successful total quality transformations.
Such transformations require the involvement of all employees in continuous
quality improvement efforts. Respondents to a 1993 multilevel survey about total
quality management selected training and leadership commitment as the most
important factors in any quality program ("TQM: Dead or Alive?", 1993, p. 63).

66
Deming's (1986) points 6, 7 and 13, all speak to the importance of
training to support employee involvement and empowerment. One of the seven
critical success factors identified by Ishikawa (1986) as essential for the success
of total quality control is "education and training in all aspects of total quality,
which often amounts to thirty days per year per employee" (p. 38). He
emphasized that total quality control begins with education and ends with
education.
Juran (1992) maintained that adoption of modern ways of planning for
quality requires training in how to plan for quality. Such training must be
extended throughout the organization—for all functions and at all levels.
Stuelpnagel (1989) emphasized that "dramatically more education and training
is required with TQM" (p. 7). He noted that the most important single factor
contributing to Japanese successes in world markets was said to be their
continual education and training systems in quality improvement for all
employees.
In a survey of 160 colleges and universities at various stages of quality
management process, Horine and Hailey (1995) found that the training function
was considered to be one of the key challenges to successful implementation.
Respondents to the survey commented that education and a basic under-
standing of the key philosophy was critical as well as a methodology for
engendering interest and enthusiasm for continuous quality improvement
throughout the organization. In addition, the study participants recommended
that training be provided for everyone (including top management) on an

67
on-going basis. These authors concluded that training and development at all
levels of the institution are required to sustain quality practices.
Cornesky, McCool, Barnes, and Weber (1991) suggested a process to
determine an institution's quality index and stressed the education of
administrators, faculty, and staff as necessary conditions for implementing total
quality improvement processes. They recommended that the professional
development activities of the faculty and staff should include an understanding
of quality philosophies and processes as well as training on the tools and
techniques needed to implement total quality management. The obvious reason
for educating all employees about the process is to underscore the importance
of their participation so that the movement will be successful.
Fields (1993) observed that it may seem odd to emphasize the
importance of training to people in the training business. He continued that total
quality in education is a new way of doing things for many people, and this
requires training. The training program for total quality management must
emphasize why, who, what, how, and when all things will happen and must be
of a high caliber and pertinent to the level of the learner.
Implementation Characteristics of Training Programs
In order to achieve effective continuous quality improvement systems,
there are essential elements to be learned, and the training function is
considered to be a vital catalyst to the attainment of this goal (Cornesky, 1990;
Deming, 1986; Ishikawa, 1986; and Juran,1992). Holpp (1989) held that,
unquestionably, training is the glue that binds total quality improvement efforts

68
and describes the needed training as being: (1) delivered on the job, with lots of
application time and reality based; (2) delivered just in time, and coordinated
with the needs of the team; (3) conducted by line people made up of team
members, leaders, supervisors, managers, and executives; (4) provided to
employees at all levels simultaneously so that clear messages are reinforced all
at once; (5) skill based, with measurable, observable and attainable outcomes;
and (6) reinforced by performance measures that make the training stick and
seem important. He offered examples of many corporations who are committed
to training for TQM because the skills and knowledge needed for this
management system are not readily available in the work force.
Coate (1990) stressed that how the TQM process is implemented is as
important as what the process includes. In TQM, all employees commit daily to
improving the quality of their service so that customers' needs are met or
exceeded. Coate (1993) reported that at Oregon State University, the human
resources department prepared training materials, including a manual, and set
up a regular schedule of three-day TQM training sessions. Between 1990 and
1991, 120 members of the institution's staff and faculty had attended the
sessions, and representatives from other colleges and service organizations
have asked to visit the university and attend its TQM training.
Howard (1993) emphasized that employee training and development is a
critical element in the pursuit of TQM. As quality manager at Oregon State
University, Howard developed and delivered TQM training and has described
four major components to the training program: introductory training, strategic

69
planning, team training, and special topics. She suggested that the role of the
quality manager has to develop, evolve, and change as institutional needs
change.
Implementing TQM in any organization constitutes a revolution in thinking
and an evolution in practice. At Delaware County Community College,
DeCosmo, Parker and Heverly (1991) theorized that since consistency and
constancy of purpose are essential to change, the first step is the education of
the executive team. Most teams realize early on that the set of assumptions
underlying the style of management required by TQM differs from the
assumptions underlying the current style of management in higher education
institutions. Butler (1990) cautioned that in order for TQM to be embraced by an
entire organization, there must be a constant leadership effort that is sincerely
committed to making this change. The management officials must lead this
initiative.
In an interview with Marna C. Whittington, Executive Vice President at the
University of Pennsylvania, Marchese (1992) posed the question ". . . Penn is
three years down the quality road, what's your advice now for colleagues in
other institutions?" Whittington responded:
First, there must be commitment from the top and a willingness for
executive leadership to get involved. That means making time to put
quality on your calendar. Second, there has to be training, training, and
more training, but what in TQM we call just-in-time training, that is,
education and tools tailored for immediate application, (p. 14)

70
Juran (1992) believed that training in how to plan for quality is
multidimensional; and, therefore, an organization must establish a training
curriculum that includes the fundamental tools and methodology of quality
disciplines that are widely applicable. Spanbauer (1992) contended that in
order to ensure constant awareness and to promote understanding of each
individual's role in keeping the quality concept going, a strong staff education
program is required. This training program will then provide the techniques and
skills needed by the staff to utilize quality improvement processes within their
specific work units. He suggested that higher education institutions use a model
during training—such as those advocated by Deming, Crosby, and Juran. As
implementation moves forward, however, most organizations will eventually
design their own, as did Fox Valley Technical College which originally used the
Crosby 14-step model and then designed its own 16-step plan.
Stieber (1991) identified the primary implementation characteristics of
effective quality improvement training programs in private organizations as
including: (1) a philosophical approach; (2) effective program content;
(3) making new skills and quality endeavors part of performance appraisals;
(4) delivery effectiveness which includes the use of internal and external
resources as appropriate and the involvement of managers and supervisors as
trainers; (5) conducting pilot programs; and, (6) the appropriate scheduling of
training sessions. In addition, current research indicates consistently that upper
management support or leadership along with a mandated approach to training

71
is critical to the effective implementation of continuous quality improvement
processes (Horine,1995; Juran, 1992; Deming, 1986; Ishikawa, 1986).
Evaluation of Training Programs
As in any teaching and learning environment, it is essential that there be
a methodology for assessing how well the training process works and how
successful the participants have been in learning the new material. Port and
Smith (1992) reported that companies often do not link quality efforts to the
bottom line. For example, many quality companies that initiate team training can
count off how many people are being trained but few can provide data on what
difference the training makes in performance.
Tracey (1968) stated that evaluation should provide a means for
improving the programs and services offered by the training activity for the
benefit of the enterprise and its employees. A systematic follow-up plan is
necessary to ensure improvement in all of the sub-systems of the organization.
Tracey maintained that failure to take follow-up action would mean that the
resources used in the evaluation were wasted.
Michalak and Yager (1979) emphasized that the evaluation of training
has seldom received the attention it deserves. Typically training programs will
be evaluated at the level of participants' reactions and perhaps even at the level
of the trainees' knowledge or skill, or both. Vaught et al. (1985) concurred that
overall the evaluation of training programs was poor and emphasized only
reactionary measures. "Evidence of material learned or behavior change on the

72
job are very seldom used" (p. 165). These authors underscored that the
evaluation stage is critical to improving employee development programs.
Tracey (1968) recommended that training be evaluated from two different
but complementary perspectives—through the application of internal and
external criteria. Internal criteria are used to measure the result of the training
itself and includes content measurement, pre- and post-testing, participant
reactions, measurement against specific standards, and experimental research
such as using a control group. External criteria are used to measure the results
of programs after the employee returns to the work unit. This methodology
utilizes reports, observation, interviews, questionnaires, work samples and
statistics. Tracey stressed that the fundamental question concerning training
evaluation is: "What is important to know about this organization and its people
to determine whether the training and development activity is doing what it is
expected to do and doing it well?" (p. 35).
Vaught, Hoy, and Buchanan (1985) determined that there were flaws in
the evaluation process of training programs which included: (1) procedures
which were often performed poorly and haphazardly; (2) superficial evaluations
which did not fully address program effectiveness; (3) the limitations of
evaluations in terms of organizational and personal objectives; (4) the lack of
specificity in the relationships between evaluation and accountability; (5) the
lack of observable and measurable benefits from the training program; and
(6) the lack of organized support from all management levels for the training
program (p. 145). These authors maintained that the evaluation of training

73
programs is important to ensure that training resources are being effectively and
efficiently spent. Additional reasons identified for evaluating programs were to
gain assurance that the programs offered matched organizational needs, to
ensure future program improvement, and to maintain human resource
development in the short and long run.
Krein and Weldon (1994) maintained that a training program's success
can be gauged only through thorough evaluation, both formative and
summative. The formative evaluation process involves checks made during the
program development process. The summative evaluation process takes place
at the end of the program, to determine whether or not the desired outcomes
were met. These authors espoused Kirkpatrick's four levels of evaluation as an
means to achieving this end.
Measures of Training Effectiveness
Kirkpatrick (1975) stated that training programs can be evaluated at the
following four levels: Level 1, The trainee reactions; Level 2, The change in
trainee learning; Level 3, Behavior change on the job; and Level 4, The results
to the organization. Level 1 - Reaction is defined as how well the trainees liked
a particular training program. It is the same as measuring the feelings of the
participants and does not include any measurement of learning taking place.
Kirkpatrick stated that since reaction is so easy to measure, nearly all training
directors do it; however, little indication of the results that can be attributed to the
training program exists at this level of evaluation. Michalak and Yager (1979)
noted that reaction questionnaires will yield some important information that will

74
assist trainers in improving the training program. Questions which relate to the
quality of instruction methodology, the quality of the instructor, the facilities, the
parts of the program that are relevant to jobs and the parts that are not, the
value of pre-work assignments, all contribute to information that is valuable to
the trainer. Krein and Weldon (1994) suggested that Level 1 evaluation could
reveal certain facts such as: how relevant participants thought the training was;
whether the participants were confused by any of the training; whether any
areas of the training were lacking in information; how engaged the participants
felt by the training; and how favorable overall participant reactions were (p. 64).
Level 2 - Learning is defined as the principles, facts, and techniques that
were understood and absorbed by the participants (Kirkpatrick, 1975).
Evaluation at this level is considered to be much more difficult since it involves a
great deal of work in planning the evaluation procedure, in analyzing the data
that is obtained, and interpreting the results. The type of methodology used at
this level of evaluation is dependent on the nature of the training program. In
some cases a pretest, post-test methodology may be appropriate; while in
another training session, demonstration of learned skills may be the desired
technique. Krein and Weldon (1994) cautioned that if a pretest is not
administered, the possibility that participants could have achieved the
objectives before the training is missed. Michalak and Yager (1979)
recommended that testing be done at the end of a training program in order to:
(1) find out whether the trainer has done the job as well as it should have been
done; (2) determine whether the design of the training program has brought

75
about the learning that was anticipated; and (3) give feed back information to
the trainees so that they will know how much they have learned.
Level 3 - Behavior is defined as using the knowledge and skills learned
in the training program on the job. Kirkpatrick (1975) stressed that this type of
evaluation is more difficult than the reaction and learning levels of evaluation.
He maintained that a more scientific and statistical approach is needed at this
level and also acknowledged that very few training directors have the
background, skill or time necessary to engage in extensive evaluations.
Michalak and Yager (1979) suggested that a pre-training measurement be
taken to assure an accurate evaluation at this level. Krein and Weldon (1994)
proposed questionnaires as a means to reducing costs associated with Level 3
evaluation. In addition, they espouse the use of focus groups for gathering
feedback.
Level 4 - Results is defined as the improvement achieved in whatever
category the training was designed to effect. According to Kirkpatrick (1975),
this type of evaluation is considered to be the least utilized in training programs
and is considered to be time intensive and less dependable because of
extraneous variables which may be responsible for the noted change or results.
Michalak and Yager (1979) pointed out that the purpose of the training program
was because a problem was brought to light. Therefore, they suggested that the
question that needs to be evaluated at the end of the training is "Did this
problem go away?" Still, they maintain, the comment may be "so what?" if other
answers are not readily available to additional questions such as: "What are the
76
results to the organization? Has profitability improved? Is the organization more
effective now as a result of the training? According to these authors, successful
training must produce results for the organization, and these results must be
recognized by management.
Chapter Summary
In summary, the literature provides a liberal sampling of the on-going
efforts to implement the principles of continuous quality improvement processes
in higher education, but whether or not this management system is compatible
with the academic environment and its decision-making models is still unclear.
What has been revealed through a scrutiny of the literature, however, is that
higher education institutions are increasingly demonstrating interest in
continuous quality improvement philosophies and practices and are
undertaking a systematic process for training in the principles of total quality
management. Interestingly, academe has shown a preference to refer to TQM
as continuous quality improvement while typically adhering to the essential
points that Deming has prescribed. Within the training program activities, certain
implementation characteristics have been identified, both in research and case
studies, as being significant to the effectiveness of training as well as to CQI
implementation.
As institutions of higher education face critical decisions and challenges
concerning retrenchment, enrollment management, outcomes assessment,
accountability, and numerous other issues, it is essential to ascertain the

77
benefits accrued and problems that might arise when institutions implement
new management systems. The wide-scale adoption of the principles of
continuous quality improvement in higher education would be a pronounced
transformation best described by Seymour as no less than a paradigm shift
(1991). Formulating appropriate responses to address the concomitant change
that is inevitable with a paradigm shift to continuous quality improvement
processes is critical to its successful implementation. Information about the
mechanisms used to execute the training process and an analysis of the
perceptions of how effective the training has been will assist those
administrators who are or will be embarking on the continuous quality
improvement journey.

CHAPTER III
PROCEDURES FOR DATA COLLECTION
Research Design
The purpose of this study was to identify and describe the
implementation characteristics of continuous quality improvement training
programs and to determine whether or not and to what extent relationships exist
between the implementation characteristics and training program effectiveness,
as perceived by selected individuals at two- and four-year colleges in the
United States. To accomplish this objective, a descriptive research design was
selected and a mailed questionnaire was used to gather the data. Anecdotal
comments were also used for further clarification and enhancement.
Study Population
This study focused on a systematic sample population of those
individuals at two- and four-year colleges and universities in the United States
who were identified in the literature as subscribing to a continuous quality
improvement process or total quality management. Borg (1987) stated that:
Systematic sampling, like simple random sampling, is used to obtain a
sample from the defined population. This technique can be used if all
members in the defined population have already been placed on a list
such as a membership list or a school census, (p. 88)

79
A mailing list was compiled from information reported in the October
1991, 1992, 1993, and September 1994 issues of Quality Progress which
identified two- and four-year colleges and universities that had indicated
involvement in continuous quality improvement processes on their campus.
This data was then cross referenced with similar information which was
published in Total Quality in Higher Education (Lewis and Smith, 1994). The
resultant study population was comprised of 362 four-year colleges and 162
community colleges, for a total of 524 higher education institutions from across
the United States. Administrators, quality coordinators, training managers
and/or human resource directors were considered to be the collegiate
representatives most likely to have information on both effectiveness and
implementation issues associated with continuous quality improvement training
efforts.
The Survey Instrument
The survey instrument used in the study was a comprehensive
questionnaire which was modeled after an instrument used by William G.
Stieber in his 1991 dissertation, Implementation Characteristics of Effective
Quality Improvement Training: A Descriptive Study. There were no published
instruments known to assess implementation characteristics of effective training
programs for continuous quality improvement or total quality management at
higher education institutions in the United States. Modifications to the original
instrument were based on the differences of the populations studied (corporate
versus educational entities) as well as from the suggestions offered by the

80
panel of experts in the instrument validity phase and the additional findings from
the pilot study.
The revised, twenty-one item questionnaire was designed to reflect
various implementation characteristics of a continuous quality improvement or
total quality management training program and the perceived effectiveness of
such training programs. The questionnaire included both dependent variables
(items addressing program effectiveness) and independent variables (items
related to the implementation characteristics). Survey items 4, 5, 6, and 8, which
addressed program effectiveness, were based on the four levels of training
program evaluation proposed by Kirkpatrick (1975). These levels included:
(1) participant reaction to training; (2) actual learning; (3) behavior change; and
(4) organizational change results. The four items in the survey instrument
relating to training effectiveness asked whether the quality improvement training
program had been evaluated by each of these approaches and what the results
and/or methodology of these evaluations had been. Using Likert-type scales,
respondents reported the results of these distinct levels of evaluation.
If respondents answered in the affirmative that they had evaluated the
quality training program by determining if positive organizational change had
occurred as a result of the training, they were asked to identify which area(s) of
the institution had been evaluated-e.g., leadership, work environment, work
processes, customer service, classroom environment, or other areas. The
remaining items on the questionnaire were designed to determine the
81
implementation characteristics of the quality improvement training program and
used both Likert-type scales and categorical responses.
The research questions and hypotheses explored in this study
essentially asked the question: What implementation characteristics are
important to the quality training program process, and what is the nature of the
relationship between each of the identified implementation characteristics and
training program effectiveness? The implementation characteristics were
reflected in the survey instrument as follows: Item 1: a conditional item which
determined if quality training was currently underway or had taken place; Item 9:
which asked whether an institution's training program is supported by a
particular quality philosophy or tool; Item 10: which asked what specific content
segments are included as part of the overall quality improvement training; Item
11: which asked the degree to which the organization's top-level administrators
are committed to the training initiative; Items 12. 13: which asked whether
attendance at training sessions and using the skills taught in the quality training
program on the job is made part of the employee's self-assessment; Items 14.
15. 16: which asked the extent to which the institution utilizes its own employees
versus external consultants as trainers and the perceived effectiveness of each,
as well as the extent to which the institution uses supervisors or managers as
instructors in the training program; Items 17. 18: which asked whether pilot
programs were used, in which work units of the institution, and the extent of
evaluation assessment of the training; Item 19: asked whether training in quality
improvement is mandatory for employees and the percent of those employees

82
not required to attend training who attended voluntarily; and Item 20: which
asked whether the training was scheduled continuously or at periodic intervals.
Information categorized as institutional demographics included: number of
students enrolled, number of employees, the type of institution (two- or four-
year), whether it was a public or private college, the type of position held and
title of the respondent, the number of years that the institution has been involved
in continuous quality improvement processes, the employment status of the
designated quality improvement coordinator, and the estimated annual budget
designated for the quality improvement training program.
Instrument Validity
The survey questionnaire was modeled after an instrument used by
William G. Stieber in his 1991 dissertation, Implementation Characteristics of
Effective Quality Improvement Training: A Descriptive Study. There were no
published instruments known to assess implementation characteristics of
effective continuous quality improvement or total quality management training
programs at higher education institutions. The survey instrument was assessed
for content validity by a panel of experts. Kerlinger (1986) noted that "Content
validation consists essentially in judgment. Alone or with others, one judges the
representativeness of the items" (p. 418).
Nationally known individuals who have expertise in the field of
continuous quality improvement in higher education were asked to participate
in the review of the instrument. (The transmittal letter and a list of the

83
participants is included in Appendix A. These experts were identified by their
publications, appearances, and consulting work in continuous quality
improvement as well as through recommendations from practitioners in the
field. The panel of experts included: Robert Cornesky, Owner, Total Quality
Management Consultants, Port Orange, Florida; Margo Hirsch, Director of
Quality and Planning, Dallas County Community College District, Dallas, Texas;
Maudie L. Holm, Director, Organizational Development, Cuyahoga Community
College, Cleveland, Ohio; Art Lacy, Director of Group Education, Texas
Instruments, Dallas, Texas; Carol Mishler, Project and Research Services
Manager, Fox Valley Technical College, Appleton, Wisconsin; Daniel Seymour,
Author and Owner of Q Systems, Palm Springs, California; and Stanley
Spanbauer, National Quality Academy, Appleton, Wisconsin.
An abstract of the proposed study as well as the prototype survey
instrument was mailed to each of the panel members who were asked to agree
or disagree with the items in the survey, to indicate if each item was an
appropriate statement, to comment on the clarity of each question, and to write
any comments or suggestions related to the implementation characteristics and
measures of effectiveness for continuous quality improvement training
programs. No item was discarded through this analysis. All responses
submitted by the panel of experts were reviewed for changes in the survey
instrument, including clarifications of wording and improvement of the format.
Those items determined by consensus of the panel as needing revision were
changed. The revised instrument was then used to conduct the pilot study.

84
Instrument Reliability
Bell (1987) advocated that all data gathering instruments should be
piloted to test how long it takes recipients to complete them, to check that all
questions and instructions are clear and to enable the researcher to remove
any items which do not yield usable data. Sax (1979) concurred that pilot
studies can be useful to "determine if the items are yielding the kind of
information that is needed" (p. 258). Therefore, the survey instrument was
mailed to a portion of the systematic sample of selected individuals at the two-
and four-year colleges across the United States that were previously identified
in the literature as subscribing to a continuous quality improvement process and
which mirrored the intended population.
Because the pilot study was limited to using a portion of those institutions
determined in the already limited systematic sampling, the normal procedure of
using two distinct populations to determine reliability was not an alternative.
While there are a number of devices available for checking reliability in scales
and tests, these methods are not always feasible or necessary. Bell (1987)
stated that" . . . such checking mechanisms will not be necessary unless you are
attempting to produce a test or scale. The check for reliability will come at the
stage of question wording and piloting of the instrument" (p. 51).
The questionnaires completed by pilot sample respondents were
compared to the later responses from their respective institutions. Also norms of
these responses were compared to the norms of the final completed surveys.
There were small differences noted between responses from these individuals

85
and the later responses sent to other individuals at the same institution. These
indicators were used to imply reliability since the normal pretest and post-test
procedures could not be used. It is likely that a subsequent administration of the
same instrument would reflect only those changes resulting from the time delay
of the first administration.
Procedures for the Collection of Data
This study was designed to identify and describe the implementation
characteristics of continuous quality improvement or total quality management
training programs and to investigate the relationships between the major
implementation characteristics and their effectiveness as perceived by selected
individuals at two- and four-year colleges in the United States. A questionnaire
packet containing a cover letter, the survey instrument, and a stamped,
addressed, return envelope was mailed to the chief executive officers and
training managers and/or quality professionals at selected higher education
institutions that were identified through the literature as having a continuous
quality improvement process or total quality management system in effect. Four
weeks after the initial mailing, a follow-up postcard was sent to non-
respondents. Additional follow-up procedures were utilized with non-
respondents and included a second follow-up letter, telephone calls, and e-mail
communication in an attempt to achieve a greater return rate. Studies have
shown that follow-ups or reminders are the most effective method to increase
the response rate, and two reminders have yielded as much as 20 percent more

86
responses (Kanuk and Berenson, 1975; Warwick and Lininger, 1975). Copies
of the materials which comprised the questionnaire packet are included in
Appendix B.
Procedures for Analysis of the Data
As the survey instruments were returned, the scores were coded into a
data file. Each survey instrument was identified by an institution code and a
respondent-type code (Administrator, 1; Staff, 2; Faculty, 3). The aggregate
response data was tallied, statistically computed using BMDP Statistical
Software, analyzed, and interpreted.
The data were interpreted descriptively and included frequencies,
percentages, measures of central tendency, standard deviations, and standard
errors. Analytical tables were utilized to report the research data from the
collected raw scores generated by the survey instrument. These tables included
information relating to the research questions, supporting indicators, and the
respondents' comments.
The data were also analyzed to determine if and to what extent
relationships existed between implementation characteristics and the four
levels of program effectiveness identified by Kirkpatrick (1975). This was
accomplished through Spearman ranked, non-parametric correlation coefficient
analyses of the independent and dependent variables to determine which
implementation characteristics were significantly related to training program
effectiveness. Those implementation characteristics that were related to

87
program effectiveness at the .05 level of significance were then submitted to a
series of stepwise multiple regressions to determine the relative importance of
each predictor variable to the four measures of program effectiveness—
reaction, learning, behavior, and organizational change.
The two hypotheses which were derived from the research questions
were tested using a multivariate analysis of variance (MANOVA) statistical
technique. The assumptions underlying MANOVA were tested using Levene F
tests. To test equal variances when they were not met, separate t tests were
reported; and pooled t tests were reported when the assumption of variance
was met.

CHAPTER IV
PRESENTATION AND ANALYSIS OF THE DATA
Introduction
The problem of this study was to identify and describe the
implementation characteristics of continuous quality improvement training
programs and to determine whether or not and to what degree relationships
exist between the implementation characteristics and training program
effectiveness, as perceived by selected individuals at two- and four-year
colleges in the United States. The specific purposes of this study in relation to
the perceived effectiveness of training programs for the implementation of
continuous quality improvement processes at selected higher education
institutions were to:
1. identify through the literature and verify through experts the extent to
which higher education institutions are involved in continuous quality
improvement training programs;
2. describe how the institutions are organized for training personnel in
the philosophy and tools of total quality management;
3. determine which methods of training are perceived to be effective in
implementing the total quality management philosophy in higher education
institutions;

89
4. describe the best practices for total quality management training at
selected higher education institutions;
5. describe the impact of total quality management training programs
within these institutions; and
6. provide information and direction for professionals charged with
making decisions associated with the implementation of training programs for
total quality initiatives in higher education institutions.
The purpose of this chapter is to present and analyze the data which was
collected in order to answer the research questions and test the hypotheses
which were stated in Chapter I. For convenience, the questions posed from the
purpose of the study, along with the two hypotheses derived from the research
questions, are presented in the first part of this chapter. The chapter is then
divided into nine sections which include: (1) a report of the distribution and rate
of return, (2) demographic information on who responded to the survey, (3) a
profile of the participants and processes involved in quality training, (4) an
analysis of the measures of effectiveness and training program outcomes which
addresses how quality training programs are being evaluated and the results of
those evaluations, (5) an analysis of training program implementation
characteristics and descriptive information concerning philosophy, tools, and
content segments of quality training, (6) an analysis of the relationships among
and between major implementation variables associated with quality training
through the use of correlation matrices, (7) an examination of specific
correlations between training program variables and outcome measures

90
through the use of correlation matrices among implementation characteristics
and matrices of the correlations of major implementation characteristics and
outcome measures, (8) multiple regression analyses to predict outcome
variables from the statistically significant implementation characteristics, and
(9) an analysis of the results obtained when testing the two hypotheses which
were derived from the research questions.
It is important to note that not all respondents reported information for
every item on the survey instrument and may have erroneously failed to
complete each item response. In other cases, respondents did not have current
information for each item, which they indicated by stating that they had not
assessed or evaluated their quality training efforts since they were involved in
the initial implementation stages of quality training as they completed the survey
instrument.
Restatement of the Research Questions and Hypotheses
Research Questions
The following research questions were investigated to identify and
describe the implementation characteristics of continuous quality improvement
training programs and to facilitate an examination of the nature of relationships
between implementation characteristics and training program effectiveness for
quality training initiatives, as perceived by selected individuals at designated
higher education institutions in the United States:
1. What is the demographic profile of those higher education institutions
involved in quality improvement training?

91
2. To what degree is participation in quality improvement training
programs voluntary?
3. To what extent have various levels of personnel in the college
received training in continuous quality improvement practices?
4. How is quality improvement training scheduled: as one continuous
session, or at periodic intervals with employees returning back to the job
between sessions?
5. To what extent have training program participants taken part in any
evaluation assessment of quality improvement training?
6. To what extent has quality improvement training been evaluated by
various assessment methods?
7. To what degree have specific quality philosophies or tools supported
the quality improvement training efforts?
8. To what extent have specific content segments been used as part of
the quality improvement training process?
9. To what degree has the institution's top management supported the
quality improvement training program?
10. To what extent is participation in quality improvement training and the
use of the new skills on the job made a part of performance reviews?
11. To what extent do institutions utilize external consultants versus their
own internal staff as trainers in the quality improvement training program, and is
there a difference in the perceived effectiveness of the training provided by
each?

92
12. To what extent are managers or supervisors involved in the instruction
for the quality improvement training program?
13. To what extent are pilot projects used and appropriate groups trained
for continuous quality improvement?
14. To what extent do two- and four-year colleges allocate funding for the
quality improvement training process?
15. To what extent does the allocation of funding for training in continuous
quality improvement at two- and four-year colleges influence the perceived
effectiveness of training?
16. To what extent do relationships exist between the major
implementation characteristics or training program variables associated with
continuous quality improvement training programs?
17. To what extent are there relationships between implementation
characteristics or training program variables and perceived quality training
program effectiveness?
18. To what extent do selected individuals at two- and four-year colleges
differ in their perceptions of the effectiveness of continuous quality improvement
training programs at their institutions?
Hypotheses
In order to address certain research objectives, the following hypotheses
were proposed:
Hypothesis 1 (Research Question 9): There will be no significant
difference between administrators, faculty, and staff, at two- and four-year

93
colleges, in their perceptions of the degree to which top management has
supported continuous quality improvement training programs.
Hypothesis 2 (Research Question 18): There will be no significant
difference between administrators, faculty, and staff, at two- and four-year
colleges, in their perceptions of the effectiveness of continuous quality
improvement training programs at their institutions.
Report of the Distribution and Rate of Return
The study population was comprised of 362 four-year colleges and 162
community colleges, for a total of 524 higher education institutions from across
the United States. These institutions were identified in the October 1991, 1992,
1993, and September 1994 issues of Quality Progress as being involved in
continuous quality improvement processes. This data was then cross
referenced with similar information which was published in Total Quality in
Higher Education (Lewis and Smith, 1994). Administrators, quality coordinators,
training managers and/or human resource directors were considered to be the
collegiate representatives most likely to have information on both effectiveness
and implementation issues associated with continuous quality improvement
training efforts.
A questionnaire packet containing a cover letter, the survey instrument,
and a stamped, addressed, return envelope was mailed in May, 1995, to the
sample population which consisted of the chief executive officers and training
managers and/or quality professionals at the 524 two- and four-year colleges
94
that were identified through the literature as having a continuous quality
improvement process or total quality management system in effect. Four weeks
after the initial mailing, a follow-up postcard was sent to non-respondents.
Additional follow-up procedures were utilized with non-respondents and
included a second follow-up letter, telephone calls, and e-mail communication
in an attempt to achieve a greater return rate. Copies of the materials that
comprised the questionnaire packet and were mailed to the study participants
are presented in Appendix B.
The target response rate for this survey was 80% or at least 419
responses from both two- and four-year colleges. While the 80% return rate was
not achieved, 332 institutions did respond to the survey for a 63% return rate.
Rea and Parker (1992) confirmed that when conducting mail-out surveys, it can
be reasonably expected that the procedure will yield a response rate of 50% to
60% for the general public and somewhat higher for specialized populations.
They stated that a response rate of 50% to 60% can be considered satisfactory
for purposes of analysis and reporting findings.
Of the 332 institutions that returned the survey instrument, only those who
indicated that they provided training in continuous quality improvement (n=211)
were included in this study. It is important to note that the target population of
524 colleges consisted of approximately 31% two-year and 69% four-year
colleges, which is almost identical to the return rate percentages. The total
response rate results by type of college and CQI training involvement are
presented in Table 1.

95
Table 1
Return Rate by Type of College and CQI Training Involvement (n=332)
Type of College CQI T raining CQI T raining
Provided Not Provided Totals Percentage
Two-Year Public 85 37 122 36.7 Two-Year Private 2 1 3 1.0
Four-Year Public 84 47 131 39.5 Four-Year Private 40 36 76 22.8
Totals 211 121 332 100.0
While a greater number of respondents were from the total sample of the
four-year institutions, there were almost egual responses from both the two- and
four-year public institutions. Of the 124 responding four-year colleges indicating
involvement in quality training, 33% were from private institutions; and of the
two-year respondents indicating involvement in quality training, less than 3%
were classified as private institutions.
Those institutions which responded that they did not provide their
employees with training in quality improvement processes offered some insight
as to why they had either abandoned training practices for continuous quality
improvement or explained that they were at the beginning stages of the
implementation process. Verbatim comments from these respondents are
included in Appendix C.

96
Demographic Profile of Respondents Involved in CQI Training
A summary of the pertinent demographic data concerning those
respondents who are currently involved in continuous quality improvement
training is presented in response to the first research question: What is the
demographic profile of those higher education institutions who are involved in
quality improvement training? This information includes the college size, the
number of employees, the respondent's position and title, the length of time
involved in quality improvement practices, and an identification of the individual
who is responsible for quality improvement efforts.
Enrollment and Employee Size
Table 2 lists the range of full-time equivalent student enrollment and
number of employees at both the two- and four-year colleges that indicated
involvement in training for continuous quality improvement.
Table 2 Range and Mean of FTE Students Enrolled and Number of Employees at Two- and Four-Year Colleges Involved in CQI Training (n=21~h
College Type Range Mean
Two-Year Colleges Full-Time Equivalent Students 500-33,000 6,149 Number of Employees 62 - 6,200 620
Four-Year Colleges Full-Time Equivalent Students 500-70,000 12,976 Number of Employees 65- 17,785 3,105
Whether in a two- or four-year college, it appears that the implementation
of continuous quality improvement practices is not impacted by size—either

97
large or small—in terms of student enrollment or number of employees. The
range in each category indicates that both large and small colleges are
interested in quality improvement, and the number of employees does not
appear to be a delimiting factor for the implementation of quality improvement
training programs.
Employment Position of Respondents
The survey respondents were asked to indicate their employment
position as one of three choices: administrator, staff, or faculty. This information
is presented by institution type in Table 3.
Table 3
Position Held by Respondent and bv Type of College 01=2041
College Type/Position Frequency Percentage
Two-Year Colleges Administrators 70 83.3 Staff 3 3.6 Faculty 11 13.1
Totals 84 100.0
Four-Year Colleges Administrators 71 59.2 Staff 26 21.7 Faculty 23 19.1
Totals 120 100.0
At both the two- and four-year colleges, the majority of the respondents
were classified as administrators, for a total of 69%. Those respondents who

98
indicated their position as staff, accounted for 14% of the total; and those who
indicated their position as faculty, accounted for the remaining 17%. The
breakdown of percentage of responses from the various types of employee
groups appeared to be similar to those identified in the sample population.
Respondents were also asked to provide their job titles on the survey
instrument. The various job titles which were identified included president,
assistant to the president, vice president, provost, dean, quality coordinator,
director of quality, director of institutional research and planning, director of
human resources, professor, and associate professor.
Number of Years Involved in CQI
In response to the survey question concerning the number of years the
institution had practiced quality improvement, 30% of the total respondents
indicated between two to three years (n=208). Fifty-nine percent of the two-year
colleges indicated that they had been practicing quality improvement between
two and five years (n=84). Only 3% of the two-year colleges reported
involvement in quality processes for more than eight years. Of the four-year
college respondents, 65% indicated that they had practiced quality
improvement between two and five years, and less than 3% of the same type of
institutions reported involvement for more than eight years (n=118).
Designation of Quality Improvement Personnel
The survey instrument also included the questions: Does your institution
have a designated quality improvement coordinator? If not, who is responsible
for quality improvement? The data (n=209) indicated that 25% of the
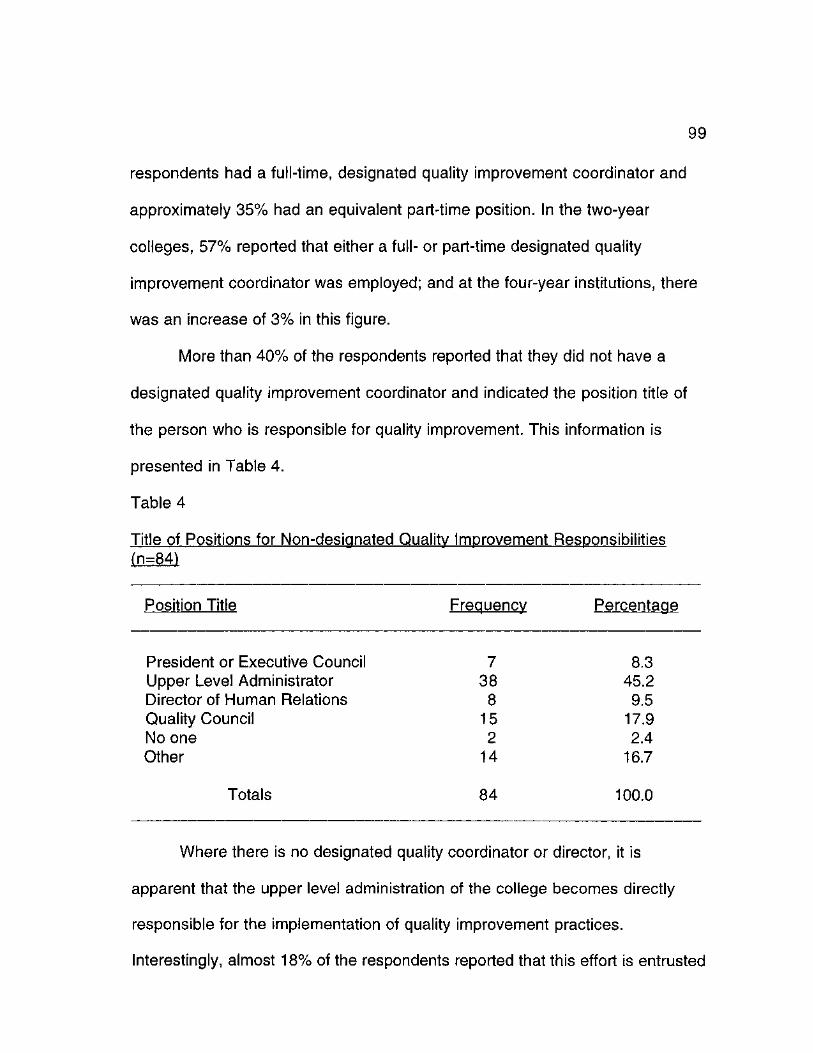
99
respondents had a full-time, designated quality improvement coordinator and
approximately 35% had an equivalent part-time position. In the two-year
colleges, 57% reported that either a full- or part-time designated quality
improvement coordinator was employed; and at the four-year institutions, there
was an increase of 3% in this figure.
More than 40% of the respondents reported that they did not have a
designated quality improvement coordinator and indicated the position title of
the person who is responsible for quality improvement. This information is
presented in Table 4.
Table 4
Title of Positions for Non-desianated Quality Improvement Responsibilities (n=84)
Position Title Frequency Percentage
President or Executive Council 7 8.3 Upper Level Administrator 38 45.2 Director of Human Relations 8 9.5 Quality Council 15 17.9 No one 2 2.4 Other 14 16.7
Totals 84 100.0
Where there is no designated quality coordinator or director, it is
apparent that the upper level administration of the college becomes directly
responsible for the implementation of quality improvement practices.
Interestingly, almost 18% of the respondents reported that this effort is entrusted

100
to and guided by a quality council or leadership team. Those position titles
described as other included such entries as college development, development
committee, director of industrial effectiveness, staff development director,
shared, and every administrator-
Profile of Quality Training Participants and Processes
The implementation characteristics that describe which personnel are
trained, at what levels, whether training is voluntary, when training takes place,
and whether the training function is evaluated were included in this study to
provide a profile of the participants in quality training as well as the training
process at the responding two- and four-year colleges. These characteristics or
variables are considered to be associated with perceived effectiveness, and
several items on the survey instrument were designed to provide pertinent data.
Participation in CQI Training
Research question two asked: To what degree is participation in quality
improvement training programs voluntary? Item 19 on the survey instrument
was designed to determine if training was mandatory for all employees and to
further determine that if it was not mandatory, what percentage of employees
attended the training voluntarily. The data collected from the 201 responses to
the first part of this question indicate that at 43 or 21% of the colleges, training is
mandatory for all employees. Of the 158 or 79% of the respondents indicating
that quality improvement training was not a requirement, more than half noted
that their employees had attended the program voluntarily.

101
Training of Various Personnel Levels in CQI
The third research question asked: To what extent have various levels of
personnel in the college received training in continuous quality improvement
practices? Item 7 of the questionnaire was designed to provide information
about the percentage of selected employee groups that had received training at
the time the survey was completed. A summary of the means and standard
errors for each employee group is presented in Table 5. The mean numbers
represent the average of percentages noted by respondents as the level of
involvement in CQI training by various employee groups. Respondents were
able to select a percentage from a scale of 0% to 100%.
Table 5
Mean Percentages and Standard Error Percentages for Selected Employee Groups Receiving CQI Training at Selected Colleges
Mean Std. Error Employee Level of % Trained of % Trained
Board Members* (n=169) 26.39 2.8995 Administrators (n=197) 67.82 2.5525 Directors/Chairs (n=192) 50.94 2.8431 Supervisors (n=189) 56.77 2.5350 Faculty (n=188) 32.77 2.3861 Professional Staff (n= 192) 48.49 2.4047 Hourly Employees (n=193) 41.97 2.4808
Note: For the purpose of this study, board members*
are considered to be an equivalent employee level.
The employee group identified as board members had the lowest
number of persons involved in the training process, with respondents indicating

102
that 55% percent of the board members having had no training in CQI
whatsoever. At the other end of the range, 12.4% of the respondents reported
that 100% of their board members had received training. Administrators
(persons who manage total work units of functional staffs at top levels) who
participated in CQI training averaged well over 50%, with almost 40% of the
respondents indicating that 100% of the administrator group had been trained.
In the director/chair category (persons who manage full-time and adjunct
faculty), 24% of the respondents indicated that 100% had been trained from this
group. More than 50% of supervisors (persons who manage staff) had
participated in training; however, only 22% of the respondents indicated that
100% of this employee group had received training. Faculty were reported as
having the next least involvement in training after board members. Only 6% of
the respondents indicated that 100% of the faculty had participated in CQI
training at their institutions. Professional staff members appeared to be less
involved in the training process also, with 11% of the respondents indicating
that 100% of this employee group had participated in training. Lastly, the
employee group labeled as hourly employees were less likely to have been
involved in CQI training. Only 8% of the respondents indicated that all persons
in this employee group had been trained at their institution.
The means for each of these groups indicate that a higher percentage of
top level employees at the responding colleges (other than board members)
received training as compared to lower level employee groups as well as
compared to the faculty group. Overall findings indicate a relatively fair amount

103
of the employee populations being trained at all levels of the respondent higher
education institutions.
Delivery of CQI Training
Research question four focused on the delivery of CQI training and
asked: How is quality improvement training scheduled—as one continuous
session or at periodic intervals with employees returning back to the job
between sessions? Item 20 on the survey instrument provided the data to
answer this question which is summarized in Table 6.
Table 6
Types of Sessions Used to Deliver CQI Training at Selected Colleges (n=204)
Type of Session Frequency Percentaae
Continuous 23 11.3 Periodic 106 52.0 Both Continuous and Periodic 51 25.0 Just-in-Time Training 24 11.8
Totals 204 100.0
More than 50% of the respondents indicated that quality improvement
training is delivered predominantly at periodic intervals. Another 25% indicated
that a combination of the two types of sessions is used. The concept of just-in-
time training was the least popular type of delivery system with 11.8% of the
colleges denoting usage.
104
Measurement of Perceived Training Program Effectiveness
Information was gathered to determine a measurement for perceived
effectiveness of quality improvement training programs at the two- and four-year
colleges under investigation. Five of the items on the survey instrument,
therefore, concerned the evaluation of quality improvement training efforts and
the perceived outcomes as a result of such training.
Evaluation Assessment by CQI Training Participants
Research question five asked: To what extent have training participants
taken part in any evaluation assessment of quality improvement training? Item
18 of the questionnaire was designed to ask the respondent to report the
percentage of those trained in quality improvement processes who had taken
part in any type of evaluation assessment. Of the total responses (n=200), 36%
indicated that they were currently in the process of assessing the quality
improvement training function at their respective institutions. Of the remaining
responses, 74% indicated that more than half of those persons trained had
evaluated the quality improvement training program. In fact, 34% of the
respondents indicated that all of their trainees had an opportunity to evaluate
the quality training program in which they had participated.
Methods of Quality Training Program Evaluation and Outcomes
To answer the sixth research question, "To what extent has quality
improvement training been evaluated by various assessment methods?," four of
the questionnaire items required the respondents to indicate how they
evaluated their quality training efforts and for the perceived evaluation results.

105
These items were based on the four levels of training program evaluation
proposed by Kirkpatrick (1975) which include: (a) participant reaction to
training, (b) actual learning, (c) behavior change, and (d) organizational change
results. The four items (4, 5, 6, and 8) in the survey instrument relating to
training effectiveness, asked whether the quality improvement training program
had been evaluated by each of these approaches and what the results or
perceived levels of effectiveness had been. Table 7 includes the data on the
use of each of these four levels of training program evaluation as measures of
effectiveness at both the two- and four-year colleges.
Table 7 Use of the Four Levels of Evaluation for CQI Training Programs at Selected Colleges (n =211)
Level of Evaluation Frequency Percentage
Seek Participant Reaction to Training 156 73.9 Assess Actual Learning 86 40.8 Assess Behavior Change 54 25.6 Assess Organizational Change 75 35.6
It is readily apparent that a majority of the respondent colleges evaluate
their quality training function at what is considered to be the lowest level of
evaluation—participant reaction to training (Kirkpatrick, 1975). More colleges
reported assessment of organizational change than the assessment of
individual behavior change.
For each of the identified measures of effectiveness, respondents were
also asked to indicate ratings at each of the four levels of evaluation. For

106
participant reaction, a rating of the participants' overall opinion of the program
was obtained. For assessment of new skills learned as a result of training, a
rating for the extent of skills learned was obtained. In addition, the respondent
was asked if pre- and post-testing was used to assess behavior or attitude
change before and after training. For assessment of new skills being used on
the job, a rating for the extent of skills used on the job was obtained, and a
follow-up question was included to determine how the employee behavior
change was evaluated. Finally, a rating for the fourth level of evaluation,
organizational change, was obtained for those respondents indicating that they
had determined whether or not positive organizational change had occurred as
a result of the training. This question also included an opportunity for the
respondent to categorize the degree of change in specific areas of the
organization—e.g., leadership, work environment, work processes, customer
service, classroom environment.
For each of these questions, respondents reported the performance of
their institution's quality improvement training programs based on the identified
levels of effectiveness using Likert-type scales with a range from one to ten. A
summary of the mean, standard error, and response range for each measure of
program effectiveness is presented in Table 8.

107
Table 8
Means. Standard Errors, and Response Ranges for Outcome Measures of Effectiveness of CQI Training at Selected Colleges
Standard Type of Evaluation Mean Error Range
Participant's Reaction (n=156) 7.31 0.1252 3.0-10.0 (1 Unfavorable, 5=Favorable, 10 =Highly Favorable)
New Skills Learned (n=86) 6.73 0.1765 4.0-10.0 (1=No new skills, 5=Some new skills, 10=Many new skills)
New Skills Used (n=54) 6.19 0.2336 3.0-10.0 (1=Not using skills, 10=Extensively using skills)
Organizational Change (n=75) 6.07 0.2117 1.0-10.0 (1=No noticeable change, 5=Some change, 10=Extensive change)
Overall it appears that the respondents perceived the training function
positively for each of the four levels of effectiveness (with 5.5 being an average
rating using a Likert-type scale). The evaluation of organizational change had
the greatest range which was 9 and had more responses than the third level of
evaluation—new skills learned. With respect to the assessment of the extent
that new skills had been learned, 20.6% of the respondents indicated that pre-
and post-testing was used to assess behavior/attitude change before and after
training; 61.8% indicated that no testing had been conducted; and 17.6% noted

108
that their institution was in the process of adding pre- and post-test assessment
to the training function.
In relation to assessing the extent that new skills were being used on the
job, respondents were asked to identify the way in which employee behavior
change was evaluated. Table 9 consolidates these responses into essentially
five methods of behavior change assessment which include behavior change
and observed activities, performance evaluations, surveys, interviews and direct
observation, and customer satisfaction. While many alternatives were noted on
the questionnaires, the summary in Table 9 describes the techniques most
frequently used to determine employee behavior change.
Table 9
How Behavior Change is Evaluated after CQI Training at Selected Colleges (n =54)
Type of Evaluation Frequency Percentage
Behavior/Activities 25 46.3 Performance Evaluations 20 37.0 Surveys 18 33.3 Interviews/Observation 8 14.8 Customer Satisfaction 6 11.1
An analysis of the data indicate that respondents were inclined to use
more than one type of evaluation to assess behavior change. However, only
26% of the respondents indicated that they utilize this level of evaluation.
With respect to the question about organizational change, respondents
were asked to further evaluate the effectiveness of their quality training

109
programs based on improvement in specific areas of organizational
development such as leadership, work environment, work processes, customer
service, and classroom environment. These items were rated on a Likert-type
scale which ranged from got worse to improved. Table 10 depicts the
consensus of the specific evaluation ratings given by respondents to the series
of items pertaining to the evaluation of perceived effectiveness based on the
organizational measures.
Table 10
Summary of Frequencies for the Evaluation of Perceived Effectiveness of Selected Organizational Areas after CQI Training at Selected Colleges (n=143)
Got Remained Not Area of Oraanization Worse the Same Improved Applicable
Leadership 2 28 110 3 Work Environment 2 39 98 4 Work Processes 0 25 115 3 Customer Service 0 24 117 2 Classroom Environment 0 71 48 24 Other 0 1 8 4
Overall, it appears that the respondents perceived improvement in all of
the selected areas of their respective institutions, with the area of classroom
environment having the least perceived improvement. In the space labeled as
other, respondents wrote in such items as assessment, pockets of excellence,
morale, student outcomes, and customer satisfaction.
Another set of variables were offered for evaluation by respondents and
focused on additional measures of CQI effectiveness pertaining to selected

110
work processes which included the cost of quality, time on task, waste, and
service problems. These processes were considered to be relevant for certain
administrative and support service areas of two- and four-year colleges, and the
items were evaluated on a Likert-type scale which ranged from decreased
(denoting improvement) to increased (denoting regression). This data is
summarized in Table 11 which includes a frequency distribution for each of the
selected work process areas.
Table 11
Summary of Frequencies for the Evaluation of Perceived Effectiveness of Specific Work Processes after CQI Training at Selected Colleges
Remained Not Work Process Improvement the Same Regression Applicable
Cost of Quality 28 46 28 14 Time on Task 41 38 27 15 Waste 72 32 3 14 Service Problems 79 30 4 13 Other 0 1 1 6
The frequency distributions for the variables in Table 11 appear to be
positive as do the variables outlined in Table 10. The respondents perceived a
decrease (improvement) in each of the work processes as a result of CQI
training. In the area of cost of quality, there was perceived improvement as well
as an equal perception of increase (regression) which is most likely related to
the cost of conducting CQI training itself.

111
Identification of Implementation Characteristics in the
Continuous Quality Improvement Training Programs
Vital to the effective implementation of continuous quality improvement is
an understanding of the various quality philosophies and processes as well as
training on the tools and techniques that are a critical part of quality initiatives. In
addition, there are other implementation characteristics which further impact the
perceived effectiveness of training programs. Several of the research questions
in this study addressed these issues.
Major Implementation Characteristics—Philosophy. Tools, and Content
Segments
Philosophy and Tools. Research question seven asked: To what degree
have specific quality philosophies or tools supported the quality improvement
training efforts? This information correlates to Item 9 on the questionnaire. A
summary of the frequency distributions of the use and non-use of various quality
philosophies and tools is presented in Table 12 along with the corresponding
percentages.

112
Table 12
Summary of Selected Frequencies and Percentages of Respondent Use of CQI Philosophies and Tools at Selected Colleges (n=211^
Colleges Using It Philosophy or Tool Frequency Percentage
Conway 7 03.3 Crosby 50 23.7 Deming 153 72.5 Feigenbaum 10 04.7 Teaming 107 50.7 Ishikawa 31 14.7 Juran 40 19.0 Peters 60 28.4 Peter Senge 47 22.3 Baldrige Criteria 73 34.6 None Specifically 85 40.3 Other 31 14.7
Based on the information in Table 12, a wide variety of philosophies and
tools appear to help fashion the training program design at the respondent
colleges. The range of responses indicate a low of 3% for Conway to a high of
72% of the respondents utilizing a Deming approach. Interestingly, more than
half of the respondents indicated that they had adopted a philosophy espoused
by one of the more popular gurus of quality processes: Crosby, Juran, and
Peters. The Baldrige Criteria also ranked high with almost 35% indicating
usage. More than half of the respondents also answered that they use a
teaming approach as a quality tool. In the other category, respondents offered a
multiplicity of authors, companies, and philosophies which include Margaret

113
Wheatly, Joel Barker, Motorola, John Gardner, Steven Covey, Stanley
Spanbauer, Tom Angelo, tools training, organizational change, classroom
assessment, institutional effectiveness criteria, as well as The Holv Bible. Lastly,
in the category labeled none specifically, there were 85 responses or
approximately 40% of the colleges affirming that they may use more than one of
the philosophies or tools and even in some cases develop their own processes
based on a more eclectic approach.
Content Segments. Research question eight asked: To what extent have
specific content segments been used as part of the quality improvement training
process? This information correlates to Item 10 on the questionnaire which
asked the respondent to indicate as many content areas that were being used
for quality training at their college. Questionnaire items included as content
segments focused on CQI awareness, leadership, management, problem
solving, teaming, process improvement, and customer service. This information
is presented in Table 13 in the form of frequency distributions and percentages.

114
Table 13
Summary of Selected Frequencies and Percentages of Respondent Use of Specific Content Segments for CQI Training at Selected Colleges (n=211^
Colleges Using It Content Segment Frequency Percentage
Quality Awareness 173 82.0 Management Practices/Leadership 142 67.3 Interpersonal Skills 134 63.5 Processes and Improvement 161 76.3 Problem Solving Tools 170 80.6 Advanced Statistical Tools 21 10.0 Customer Service 149 70.6 Inventory Management 15 7.1 Group Dynamics 101 47.9 Team Leader Training 133 63.0 Process Improvement Teaming 145 68.7 Quality Function Deployment 23 10.9 Assessment/Measurement of CQI 87 41.2 None of the Above 0 0.0 Others 10 4.7
The content segments identified as being used by the respondents were
varied and ranged from a low of 7% for inventory/supplier training to a high of
82% for quality awareness training. Other areas which emerged as being the
more popular content segments with a 50% or greater response included:
problem solving tools, process improvement techniques and teaming, customer
service, team leader training, interpersonal skills, and management/leadership
training. Notably, there were no entries for the category of none of the above:
however, for the category labeled others, there were several items written in
which included effective meeting skills, focus group training, benchmarking,

115
strategic planning, classroom assessment, visioning, and creativity and
breakthrough thinking skills.
Additional Implementation Characteristics
The next seven research questions focused on other implementation
characteristics or variables associated with continuous quality improvement
training programs. These variables included the degree of top management
support for training, the association of training and use of skills to performance,
the use of external and internal consultants and their correlation to perceived
effectiveness, the extent that managers are involved in the training process, the
use of pilot projects, funding allocated for the training process, and the
correlation of funding to perceived effectiveness.
Top Management Support. Research question nine asked: To what
degree has the institution's top management supported the quality improvement
training program? Item 11 on the questionnaire broadened the question to
include perceived support for four personnel areas: (1) CEO—chancellor or
president; (2) administrators— provost, vice president, dean, or chair; (3) faculty;
and (4) staff. For the purposes of this study, top management is considered to
be either the chief executive officer or an upper-level administrator. The data
means and standard errors are presented in Table 14.

116
Table 14
Means and Standard Errors for Degree of Support for CQI Training at Selected Colleges
Standard Tvoe of Employee Mean Error
Chancellor, President (n=207) 7.56 0.1927 Administrators (n=209) 7.23 0.1661 Faculty (n=202) 4.43 0.1611 Staff (n=208) 6.52 0.1428
Rating: (1=Low Support, 5=Moderate Support,10=High Support)
Based on the responses to this question, it appears that both the chief
executive officers and other administrators support the quality training initiatives
at their respective institutions with a rating level indicating moderate support to
high support. It also appears that staff members show a little more than
moderate support for the program. Faculty support for CQI training was at a
considerably lower level.
Participation in training and use of new skills in performance reviews.
Research question ten asked: To what extent is participation in quality
improvement training and the use of new skills on the job made a part of
performance reviews? Items 12 and 13 on the survey instrument captured this
information which is presented in Table 15 as frequencies and percentages.

Table 15
Frequency Distributions and Percentages for Participation in Quality Improvement Training and Using Skills Learned on the Job as Part of Employee Performance Reviews at Selected Colleges
117
Item Yes Response* No Sometimes Totals
Attending quality 17 159 32 improvement training is part 8.2% 76.4% 15.4% of performance review
Using the skills taught on 26 135 44 the job is part of performance 12.7% 65.8% 21.5% review
208 100%
205 100%
Note. *Frequency, percentage
Based on the data presented in Table 15, it does not appear that
employee attendance in the quality training program or using the skills taught
on the job is considered to be important to the performance review process at
the responding colleges.
Use of consultants versus internal staff and perceived effectiveness.
Research question eleven asked: To what extent do institutions utilize external
consultants versus their own internal staff as trainers in the quality improvement
training program, and is there a difference in the perceived effectiveness of the
training provided by each? Items 14 and 15 on the questionnaire provided the
data for this research question. Of the 209 responses to the first part of the
question (Item 14). 31% indicated that they use only internal staff for training
purposes. Those colleges using both internal staff and outside consultants

118
accounted for 64% of the responses. The remaining 5% of respondents
indicated that they use all external consultants in the training function. The
second part of the question, dealing with perceived effectiveness for in-house
training versus external consultant training, was rated on a Likert-type scale
described as 1 = not effective. 5 = effective, and 10 = very effective. For the
internal rating, respondents (n=172) perceived training to be considerably
effective, with a mean of 7.42 and a standard error of 0.1419. Those rating the
external consultants (n=154) perceived such training to be somewhat less
effective, but still above the effective rating, with a mean of 6.80 and a standard
error of 0.1675.
Extent of involvement of managers or supervisors in instruction.
Research question twelve asked: To what extent are managers involved in the
instruction of the quality improvement training process? Item 16 provided the
data for this research question, and a Likert-type scale was used that was
described as 1 - no involvement. 5 = some involvement, and 10 = significant
involvement. The data summarized from the 205 respondents indicates that
there is some involvement of managers and supervisors in the instruction for the
training program, with a mean of 4.9 and a standard error of 0.1729.
Use of pilot projects. Research question thirteen asked: To what extent
are pilot projects used and appropriate groups trained for continuous quality
improvement? Item 17 on the questionnaire elicited this information; and if the
response was in the affirmative, the respondent was requested to identify which
work units of the institution had participated in the pilot projects. Of the 203

119
responses, over 60% of the respondents indicated that their institution had
conducted a pilot project. Table 16 summarizes, in frequencies and
percentages, the work units in which pilot programs were initiated at the
respondent colleges.
Table 16
Work Units in Which Pilot Programs were Conducted to Initiate Continuous Quality Improvement at Selected Colleges (n=123)
Work Unit Frequency Percentage
Administration 75 61.0 Academic Program 17 13.8 Technical Program 7 5.7 Business Office 42 34.2 Student Services 35 28.5 Library 11 8.9 Physical Plant 22 17.9 Food Services 7 5.7 Other 22 17.9
The dominant areas for initiating pilot programs at the respondent
colleges appears to be in the administrative and support service departments.
Instructional areas were the least likely to initiate such projects. In the other
category, several respondents indicated that they had initiated cross-functional
groups as pilot projects. Accreditation teams were also noted as pilot projects
for the implementation of quality processes.
Annual budgets for CQI training. Research question fourteen asked: To
what extent do two- and four-year colleges allocate funding for the quality

120
improvement training process? Table 17 summarizes this information for both
the two- and four-year colleges.
Table 17
Estimated Annual Budgets for Quality Improvement Training at Two- and Four-Year Colleges
Two-Year Four-Year Estimated Colleges % Colleges %
Class Annual Budget (n=81) (n=117)
1 No Funding 2.5 11.1 2 $1 to $9,999 33.3 28.2 3 $10,000 to $29,999 23.5 15.4 4 $30,000 to $49,999 18.5 12.0 5 $50,000 to $69,999 4.9 8.5 6 $70,000 to $99,999 4.9 1.7 7 $100,000 to $299,999 6.2 10.3 8 Over $300,00 0.0 2.6 9 Unknown 6.2 10.3
Totals 100.0 100.0
More than 55% of both the two- and four-year colleges indicated that they
budget up to $50,000 on quality training. The two-year colleges had a class
mean of 3.67 with a standard error of 0.2243; and the four-year colleges had a
class mean of 3.99 with a standard error of 0.2337. At the four-year schools,
there were thirteen respondents who reported a zero dollar budget to carry on
the quality training function. While the distribution of dollars is different, the total
spending for quality improvement training appears to be about the same for

121
two- and four-year colleges. However, data was not available to determine what
impact the size of the institution would have in this comparison.
Allocation of funding and perceived effectiveness of training. Research
question fifteen asked: To what extent does the allocation of funding for training
in continuous quality improvement influence the perceived effectiveness of
training? A Spearman ranked, non-parametric correlation coefficient matrix was
compiled to examine the relationships between the budget allocation
responses and the four outcome variables designed to measure effectiveness.
None of the paired items in the matrix revealed any associations at the .05 level
of significance.
Relationships Between Major Implementation Characteristics
Research question sixteen asked: To what extent do relationships exist
between the major implementation characteristics or training program variables
associated with continuous quality improvement training programs? The
relationships between the major implementation characteristics or program
training variables was determined through the execution of a series of
Spearman ranked, non-parametric correlation coefficient matrices. These
correlations were conducted for two sets of comparisons.
The first correlation was between Item 8 (c.d^ and Item 9. on the
questionnaire which included the implementation characteristics based on
specific areas of organizational development such as leadership, work
environment, work processes, and customer service, versus the types of
philosophies and/or tools utilized to support training efforts. The second
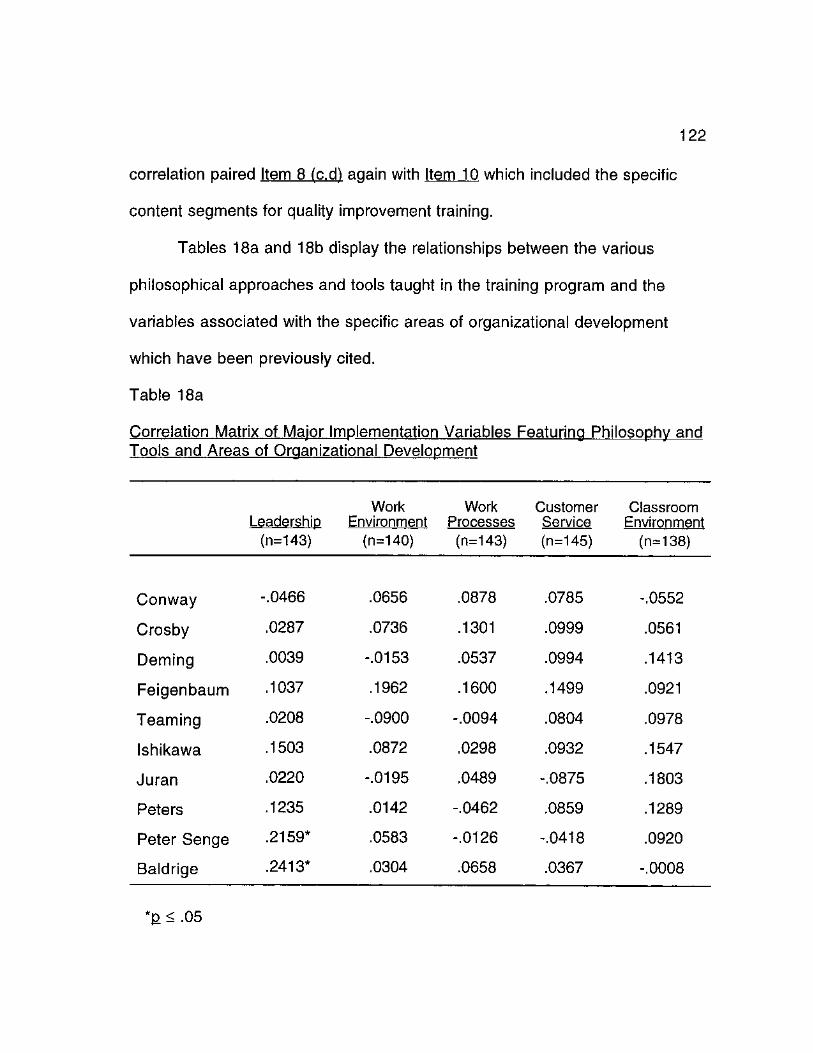
122
correlation paired Item 8 (c.d) again with Item 10 which included the specific
content segments for quality improvement training.
Tables 18a and 18b display the relationships between the various
philosophical approaches and tools taught in the training program and the
variables associated with the specific areas of organizational development
which have been previously cited.
Table 18a
Correlation Matrix of Major Implementation Variables Featuring Philosophy and Tools and Areas of Organizational Development
Work Work Customer Classroom Leadership Environment Processes Service Environment
(n=143) (n=140) (n=143) (n=145) (n=138)
Conway -.0466 .0656 .0878 .0785 -.0552
Crosby .0287 .0736 .1301 .0999 .0561
Deming .0039 -.0153 .0537 .0994 .1413
Feigenbaum .1037 .1962 .1600 .1499 .0921
Teaming .0208 -.0900 -.0094 .0804 .0978
Ishikawa .1503 .0872 .0298 .0932 .1547
Juran .0220 -.0195 .0489 -.0875 .1803
Peters .1235 .0142 -.0462 .0859 .1289
Peter Senge .2159* .0583 -.0126 -.0418 .0920
Baldrige .2413* .0304 .0658 .0367 -.0008
*]D < .05

123
When reviewing the various philosophies as depicted in Table 18a, two
statistically significant relationships emerge. Both Senge and the Baldrige
Criteria are associated with the perception of improved leadership at the
responding institutions (r > .17, e < .05). No other significant associations were
noted.
Table 18b
Correlation Matrix of Maior Implementation Variables Featuring Philosophy and Tools and Areas of Organizational Development
Cost of Time Service Quality on Task Waste Problems (n=114) (n=121) (n=121) (n=126)
Conway .0478 .1069 -.1179 -.1031
Crosby - .0588 -.0386 -.2462* -.1573
Deming -.1179 -.0412 -.0771 -.1069
Feigenbaum -.1239 .1322 -.0619 -.0645
Teaming -.0950 -.0686 -.0291 -.0123
Ishikawa -.1594 -.0507 -.1171 .0077
Juran -.0415 -.0569 -.0732 -.0752
Peters .0186 .1412 .0022 -.0329
Peter Senge -.1335 -.0720 -.0855 -.0570
Baldrige -.1950 -.1349 -.0605 -.1050
*e < .05
When analyzing the data in Table 18b, which compares the philosophies
and tools to perceived improvement in certain process areas, only the use of

124
Crosby as a philosophy is associated with the perception of a decrease in
waste, which is statistically significant when r > .19 and £ < .05. (When the
associated correlation coefficient reflects a negative sign, it is an indicator of
improvement.) No other significant associations were noted.
Relationships between the specific content segment variables and the
variables associated with the specific areas of organizational development are
presented in Tables 19a and 19b. The use of the Spearman ranked, non-
parametric correlation coefficient reveals significant positive correlations at the
^ < .05 level of significance in several cases.
As denoted in Table 19a, quality process awareness training is positively
related to perceived improvement in the effectiveness of the work environment
(r > .17, JD < .05). Training in management and leadership is positively related to
perceived improvement in the effectiveness of leadership (r > .17, £ < .05).
Team leadership training is positively related to perceived improvement in the
work environment (r > .17, £ < .05) as well as to the classroom environment
(r > .17, £ < .05). Team training in process improvement is positively related to
perceived improvements in both work processes and classroom environment
(r>.17,e<.05).

125
Table 19a
Correlation Matrix of Major Implementation Variables Featuring Content Segments
Work Work Customer Classroom Leadership Environment Processes Service Environment
(n=143) (n=140) (n=143) (n=145) (n=138)
Quality
Awareness .1729 .2246* .2115 .2045 .1093
Management and
Leadership .2429* .1945 .1144 .0278 .0159
Interpersonal
Skills -.0068 .1342 -.0140 .0068 .0651
Process
Improvement .1980 .0654 .1630 .1902 .1738
Problem
Solving .0213 .0318 .0334 .0716 .1910
Adv. Statistical
Processes -.1584 .0093 .1373 .0686 .1532
Customer
Service .1255 .1575 -.0696 .1035 .0675
Inventory
Management .1246 .0585 .1073 .0345 .1805
Group
Dynamics -.0099 .0801 .0797 .1331 .0581
Team
Leadership .1077 .2156* .0831 -.0138 .3142*
Team Process
Improvement .1978 .1162 .2351* .1258 .2842*
Quality Function Deployment .0627 -.0544 .0357 -.0230 .0116 Accoccrnnnt
of Quality .1773 .1100 .1350 .1434 .0890
*e < .05

126
When analyzing the data in Table 19b, which compares the content
segments to perceived improvement in processes that are relevant to certain
administrative and support areas, several statistically significant relationships
emerge at the .05 level of significance. Both training in process improvement
and problem solving are positively related to perceived improvement in
controlling waste (r > .18). Team leadership training is positively related to three
of the areas of perceived institutional improvements—cost of quality (r > .19),
controlling waste (r > .18), and decreasing service problems (r > .17). In
addition, training in team process improvement was also positively related to
perceived improvement in controlling waste (r > .17).

127
Table 19b
Correlation Matrix of Maior Implementation Variables Featurinn Content Segments
Cost of Quality (n=114)
Time on Task (n=121)
Waste (n=121)
Service Problems (n=126)
Quality Awareness -.1061 -.1149 -.1611 -.1839 Management and Leadership -.1290 -.0463 -.1345 -.1265 Interpersonal Skills -.0410 -.0342 -.1197 .0224 Process Improvement -.0100 -.1190 -.2818* -.1426 Problem Solving -.0116 -.0839 -.2632* -.1942 Adv. Statistical Processes .0317 -.0275 -.0963 -.1337 Customer Service -.1206 -.1033 -.1654 -.1924 Inventory Management -.1643 -.0760 -.1557 -.0406 Group Dynamics -.1872 -.1354 -.1673 -.1113 Team Leadership -.3140* -.1242 -.3266* -.2919* Team Process Improvement -.0659 -.1817 -.2543* -.1376 Quality Function Deployment .0008 .0179 .0330 .0145 Assessment of Quality -.0812 -.0252 -.1001 -.1029
< .05

128
Relationships Between Implementation Characteristics and
Outcome Measures for Training Program Effectiveness
A series of Spearman ranked, non-parametric correlation coefficient
matrices were compiled to examine the relationships between the
implementation characteristics or training program variables and the four
outcome variables designed to measure perceived training program
effectiveness. This information was compiled to answer research question
seventeen: To what extent are there relationships between implementation
characteristics or training program variables and perceived quality training
program effectiveness? Comparisons were completed for the major
implementation characteristics which included the philosophies, tools, and
content segments, as well as for other training program variables, in relation to
the four measures of effectiveness—rated reaction/opinion, the extent of skills
learned, the extent of skills used, and the extent of positive organizational
change.
Quality Philosophies and Tools
The Spearman ranked, non-parametric correlation coefficient matrices
for the major implementation characteristics which related to specific quality
philosophies and tools and the four outcome measures of effectiveness are
presented in Table 20a. When correlating the various quality philosophies and
tools included in Table 20a with the four outcome measures of effectiveness,
there are several associations to be noted. The outcome measure described as

129
participant reaction/opinion yielded one statistically significant association at
the .05 level of significance with the item labeled as other (r > .16). For the
outcome measure described as extent that new skills are learned, three
associations with a specific philosophy or tool appear to be statistically
significant. The use of Peters and the Baldrige Criteria appear to be related at
the .05 level of significance to the extent that new skills are learned (r > .22).
Neither of the remaining two outcome measures yielded statistically significant
associations.
Table 20a
Correlation Matrix of Major Implementation Variables Featuring Philosophy and Tools and Outcome Measures of Training Program Effectiveness
Participant Reaction/Opinion
Extent of Skills Learned
Extent of Skills Used
Positive Organizational
Chanae (n=156) (n=86) (n=54) (n=75)
Conway .0377 .0827 .0053 -.0265
Crosby -.0269 .0447 -.0254 .1336
Deming -.0245 -.0682 -.0195 .0231
Feigenbaum .0458 .2111 .0752 .0603
Teaming -.0118 .0091 -.2145 .1028
Ishikawa -.0427 .1240 .0797 -.1087
Juran -.0925 .0785 .1217 .0020
Peters .0293 .2414* -.0652 .0374
Peter Senge .0095 .0573 -.0390 .1869
Baldrige .0124 .2394* -.0036 .1700
Other .1741* .1900 .0290 .0436
< .05

130
Content Segments
The Spearman ranked, non-parametric correlation coefficient matrix for
training program content segment variables and the four outcome measures of
effectiveness are presented in Table 20b. Several statistically significant
associations at the .05 level of significance emerge from this correlation. For the
outcome measure of participant reaction/opinion, quality awareness training
appears to be related to a more positive rating of this level of effectiveness
(r > .16). Two content segments appear to be related to the extent of skills
learned. Both process improvement training and the assessment of quality also
appear to have a positive impact on this measure of effectiveness (r > .21). For
the outcome measure of extent of skills used, there were no apparent significant
associations. The final level of effectiveness, positive organization change,
yielded several positive associations with the content segment variables.
Training in quality awareness, management and leadership, interpersonal
skills, and team leadership all appear to be related to positive organizational
change (r > .22 ). One negative association also emerged in this comparison.
The content segment variable labeled as advanced statistical processes was
inversely correlated to this outcome measure (r > .22), indicating a negative
relationship.

131
Table 20b
Correlation Matrix of Major Implementation Variables Featuring Content Segments and Outcome Measures of Training Program Effectiveness
Participant Reaction/Opinion
Extent of Skills Learned
Extent of Skills Used
Positive Organizational
Chanae (n=156) (n=86) (n=54) (n=75)
Quality Awareness .1919* .1579 -.0763 .2652* Management and Leadership -.0255 .0839 -.0850 .3471* Interpersonal Skills -.0899 -.0924 .0175 .2665* Process Improvement .1114 .2697* .0308 .1909 Problem Solving .0281 -.0340 -.1771 .1823 Adv. Statistical Processes .0519 -.0673 -.0144 -.2189* Customer Service .0375 .0508 .0170 .1921 Inventory Management -.0203 .1064 .0660 .1930 Group Dynamics .0618 .1145 .2388 .1497 Team Leadership -.0343 .0544 .1105 .3994* Team Process Improvement -.0522 .0751 .1263 .0342 Quality Function Deployment -.0648 .0874 .1811 -.0974 Assessment of Quality .0896 .2987* .0949 .1914
*£ < .05
Other Training Program Variables
To determine the relationships between other training program variables
and perceived training program effectiveness, a series of Spearman ranked,

132
non-parametric correlation coefficient matrices were computed. Those training
variables which related to specific outcome measures at the £ < .05 level of
significance are included in tables 21a, 21b, 21c, and 21 d, which are
categorized by the four levels of effectiveness—rated reaction/opinion, the
extent of new skills learned, the extent of new skills used, and the extent of
positive organizational change.
Correlations with Rated Reaction/Opinion. Table 21a lists three training
program variables that correlated with the outcome measure of rated
reaction/opinion of the training program at the .05 level of significance. The
rated effectiveness of internal trainers appears to have a stronger relationship to
the outcome measure of rated reaction/opinion than does the rated
effectiveness of external trainers.
Table 21a
Training Variables that Correlate to Explain the Outcome Measure of Rated Reaction/Opinion
Reaction/Opinion to the Training Program rs*
Extent of Staff Support of Training .3316 155
Rated Effectiveness of Internal Trainers .4228 136
Rated Effectiveness of External Trainers .2813 123
< .05

133
Correlations with Extent of New Skills Learned. Table 21b lists five
training program variables that correlated with the outcome measure of extent of
new skills learned at the .05 level of significance. Both faculty and staff support
of the training program were associated with this outcome measure, with staff
support appearing to have a somewhat stronger association. The extent of the
use of external or internal trainers had an inverse correlation to this outcome
measure, indicating a negative relationship. The rated effectiveness of both the
internal and external trainers were positively related to the extent of new skills
learned, with rated effectiveness of internal trainers appearing to have a much
stronger association.
Table 21b
Training Variables that Correlate to Explain the Outcome Measure of Extent of New Skills Learned
Extent of New Skills Learned r * is n
Extent of Faculty Support of Training .2204 8 4
Extent of Staff Support of Training .3897 85
Extent of Use of External or Internal Trainers -.2127 86
Rated Effectiveness of Internal Trainers .4035 73
Rated Effectiveness of External Trainers .2583 67
*£ < .05
Correlations with the Extent of New Skills Used. Table 21c lists four
statistically significant variables that correlated with the outcome measure of

134
extent of new skills used at the .05 level of significance. The extent of both
administrator and staff support of training were associated with this outcome
measure, with staff support showing a stronger relationship. The extent that
skills are used as part of performance reviews was inversely correlated to this
outcome measure, indicating a negative relationship. The rated effectiveness of
internal training was also associated with this measure of effectiveness.
Table 21c
Training Variables that Correlate to Explain the Outcome Measure of Extent of New Skills Used
Extent of New Skills Used re *
Extent of Administrator Support of Training .2730 35
Extent of Staff Support of Training .4102 55
Extent Skills Used are Part of Performance Review -.3967 53
Rated Effectiveness of Internal Trainers .3066 53
*12 < .05
Correlations with the Extent of Positive Organizational Change. Table
21 d lists fourteen statistically significant variables that correlated with the
outcome measure of extent of positive organizational change at the .05 level of
significance. With the exception of the category identified as chairs/directors on
the survey instrument, the extent that all of the other groups of employees were
trained (board members, administrators, supervisors, faculty, professional staff,
and support staff) emerged as statistically significant at the .05 level of

135
significance in their association with the outcome measure of positive
organizational change. The extent that supervisors are trained had the
strongest relationship for this item. In the area of support for the training
program, all employee groups showed a statistically significant relationship to
the outcome measure of the extent of positive organizational change, with the
faculty group showing the strongest association. The rated effectiveness of both
the internal and external trainers were positively related to the extent of new
skills learned, with external trainers appearing to have a stronger association
for this outcome measure. The final variable which emerged as statistically
significant in this correlation was the extent that supervisors/managers are
involved in the instructional process.

136
Table 21 d
Training Variables that Correlate to Explain the Outcome Measure of Extent of Positive Organizational Change
Extent of Positive Organizational Change r * J-s
n
Extent that Board Members are Trained .3389 61
Extent that Administrators are Trained .2652 72
Extent that Supervisors are Trained .4417 71
Extent that Faculty are Trained .2909 69
Extent that Professional Staff are Trained .3488 74
Extent that Support Staff are Trained .3677 74
Extent of President/Chancellor Support of Training .5693 74
Extent of Administrator Support of Training .4951 76
Extent of Faculty Support of Training .6009 74
Extent of Staff Support of Training .5566 76
Extent Skills Used are Part of Performance Review -.2445 74
Rated Effectiveness of Internal Trainers .2778 71
Rated Effectiveness of External Trainers .3932 63
Extent that Supervisors/Managers are Involved .2875 75 in Instruction for Quality Training Program
< .05

137
Multiple Regression Analyses of Outcome Measures
of Perceived Training Program Effectiveness
In order to ascertain the relative importance of the statistically significant
implementation characteristics in explaining the variation in quality training
program effectiveness, a series of stepwise multiple regression analyses were
executed for each of the four outcome measures of effectiveness—rated
reaction/opinion, the extent of skills learned, the extent of skills used, and the
extent of positive organizational change. All of the implementation variables that
correlated with an outcome measure at the .05 level of significance in the
Spearman ranked, non-parametric correlations were entered into each
regression analysis using the stepwise method, based upon their ability to
explain a significant proportion of the variance.
Philosophies/Tools and Content Segments
Tables 22 through 24 include the results of three of the regression
analyses which were executed to reveal the predictor variables or major
implementation characteristics relating to the philosophies, tools, and content
segments included in the training program and their ability to explain the four
outcome measures of effectiveness—rated reaction/opinion, extent of new skills
learned, extent of new skills used, and extent of positive organizational change.
The outcome measure relating to the extent of new skills used did not yield any
significant variables to enter into the multiple regression analysis for this
category and, therefore, could not be included.

138
Variables which Predict Rated Reaction/Opinion of the Training Program.
The two variables which were significant in the Spearman ranked, non-
parametric correlation matrices, which included the philosophies, tools, and
content segments and associated with the outcome measure of
reaction/opinion, were quality awareness and other. Table 21 provides a
summary of the results of the multiple regression analysis for this outcome
measure.
Table 22
Stepwise Multiple Regression of Significant Major Implementation Characteristics to Predict Rated Reaction/Opinion
Variables in Std. Step the Equation E AE £ cLt Beta
1 Quality Awareness .1981 0.0392 6.29 1, 154 .189
2 Other .2526 0.0246 4.02 2, 153 .157
Final R2 = .0638
The content segment identified as quality awareness and the category
labeled as other in the philosophy/tools survey item, together explained 6% of
the variance for the outcome measure of reaction/opinion of the quality
improvement training program.
Variables which Predict the Extent of New Skills Learned. Table 23
includes the results of the multiple regression analysis related to the extent that
new skills were learned. The data relating to the five variables which were
significant in the Spearman ranked, non-parametric correlation matrices, which

139
included philosophy/tools and content segments, were entered into the
regression analysis. These variables included Peters, Baldrige, process
improvement, and assessment of quality.
Table 23
Stepwise Multiple Regression of Significant Major Implementation Characteristics to Predict Rated Extent New Skills Learned
Step Variables in the Equation B AB JE d/L
Std. Beta
1 Assessment of Quality
.2974 0.0885 8.15 1,84 .297
Final R2 = .0885
Of the four variables entered, only one remained in the equation to
explain variance of the outcome measure identified as extent of new skills
learned. The content segment variable—assessment of quality—explained
almost 9% of the variance for this outcome measure.
Variables which Predict the Extent of Positive Organizational Change.
The results of the multiple regression analysis related to the outcome measure
extent of positive organizational change are detailed in Table 24. The variables
which were entered into the equation included the content segments that were
significant in the Spearman ranked, non-parametric correlation matrix. These
variables included quality awareness, management and leadership,
interpersonal skills, team leadership, and advanced statistical processes which
had a negative relationship.

140
Table 24
Stepwise Multiple Regression of Significant Major Implementation Characteristics to Predict Rated Positive Organizational Change
Step Variables in the Equation R I B _F d.f.
Std. Beta
1 Team Leadership .4142 0.1716 15.12 1,73 .376
2 Management and .5197 0.0985 9.72 2, 72 .316 Leadership
Final R2 = .2701
Of the four variables entered into the equation, the two which remained
after Step 2 were the content segment variables identified as team leadership
and management and leadership. These two variables in combination explain
27% of the variance for the outcome measure of positive organizational change.
Other Training Program Variables
Tables 25 through 28 include the results of four stepwise multiple
regression analyses which were executed to reveal the predictor variables
relating to the other statistically significant training variables or implementation
characteristics of quality training programs and their ability to explain the four
outcome measures of the rated reaction/opinion, the extent of new skills
learned, the extent of new skills used, and the extent of positive organizational
change.
Other Significant Training Variables which Predict Rated Reaction or
Opinion of the Training Program. The three training variables which were

141
significant in the Spearman ranked, non-parametric correlation matrices and
were associated with reaction/opinion, included the extent of staff support of
training, rated effectiveness of internal trainers, and rated effectiveness of
external trainers. Table 25 provides a summary of the results of the stepwise
multiple regression analysis for this outcome measure.
Table 25
Stepwise Multiple Regression of Significant Other Training Program Variables to Predict Rated Reaction/Opinion
Variables in Std. Step the Equation Fj AR JE d.f. Beta
1 Rated Effectiveness .3961 0.1526 27.12 1,118 .376 of Internal Trainers
2 Rated Effectiveness .2192 0.0467 17.83 2,117 .175 of External Trainers
Final R2 = .1993
Of the three significant training variables which emerged in the
Spearman correlation, the two independent variables which related to the
effectiveness of trainers, in combination, accounted almost 20% of the variance
for the outcome measure of reaction/opinion of the quality improvement training
program.
Other Significant Training Variables which Predict the Extent of New
Skills Learned. Table 26 includes the results of the stepwise multiple regression
analysis related to the extent that new skills were learned. The data relating to
the five variables which were significant in the Spearman ranked, non-

142
parametric correlation matrices, which included other training variables, were
entered into the regression analysis. These variables included the extent of
faculty support of training, the extent of staff support of training, the extent of the
use of external or internal trainers, the rated effectiveness of internal trainers,
and the rated effectiveness of external trainers.
Table 26
Stepwise Multiple Regression of Significant Other Training Program Variables to Predict Rated Extent of New Skills Learned
Variables in Std. Step the Equation JR AR _E dj. Beta
1 Rated Effectiveness .3419 0.1105 9.65 2,60 .327 of Internal Trainers
2 Extent of Faculty .2729 0.0758 7.99 1,61 .179 Support of Training
Final R2 = .1863
Of the five variables entered, two remained in the equation to explain
variance of the outcome measure identified as extent of new skills learned.
Extent of faculty support and rated effectiveness of internal trainers together
explained almost 19% of the variance.
Other Significant Training Variables which Predict the Extent of New
Skills Used. Table 27 includes the results of the stepwise multiple regression
analysis related to the extent that new skills were used. The data relating to the
four variables which were significant in the Spearman ranked, non-parametric
correlation matrices, which included other training variables, were entered into

143
the regression analysis. These variables included the, the extent of administra-
tor support of training, the extent of staff support of training, the extent that skills
used are part of a performance review, and the rated effectiveness of internal
trainers.
Table 27
Stepwise Multiple Regression of Significant Other Training Program Variables to Predict Rated Extent of New Skills Used
Variables in Std. Step the Equation B AR -E I T Beta
2 Rated Effectiveness .3811 0.1396 8.66 1,51 .381 of Internal Trainers
Final R2 = .1396
Of the four training variables entered, one variables remained in the
equation to explain variance of the outcome measure identified as extent of new
skills used. The training variable of rated effectiveness of internal training
explained almost 14% of the variance for this outcome measure.
Other Significant Training Variables which Predict the Extent of Positive
Organizational Change. Table 28 includes the results of the stepwise multiple
regression analysis related to the extent of positive organizational change. The
data relating to the seventeen training variables which were significant in the
Spearman ranked, non-parametric correlation matrices were entered into the
regression analysis. These variables included the extent that board members,
administrators, supervisors, faculty, professional staff, and support staff are

144
trained; the extent of president/chancellor, administrator, faculty, and staff
support of training; the extent that skills used are part of a performance review;
the rated effectiveness of internal and external trainers, and the extent that
supervisors/managers are involved in instruction for quality training programs.
Table 28
Stepwise Multiple Regression of Significant Other Training Program Variables to Predict Rated Extent of Positive Organizational Change
Variables in Std. Step the Equation _R AR _E di. Beta
1 Extent of Staff .4570 0.1248 37.69 1,41 .384 Support of Training
2 Extent of Faculty .3405 0.1030 23.45 2,40 .236 Support of Training
Final R2 = .2278
Of the fourteen variables entered, two remained in the equation to
explain variance of the outcome measure identified as extent of positive
organizational change. The training variables identified as extent of staff
support of training and the extent of faculty support of training together
explained almost 23% of the variance for this outcome measure, with staff
support being somewhat greater.

145
Testing for the Two Hypotheses
In order to address certain research objectives, the following hypotheses
were proposed:
Hypothesis 1 (Research Question 9): There will be no significant
difference between administrators, faculty, and staff, at two- and four-year
colleges, in their perceptions of the degree to which top management has
supported continuous quality improvement training programs.
Hypothesis 2 (Research Question 18): There will be no significant
difference between administrators, faculty, and staff, at two- and four-year
colleges, in their perceptions of the effectiveness of continuous quality
improvement training programs at their institutions.
Top Management Support of Quality Training
Hypothesis 1, which was derived from research question 9, was tested
using the Hotelling T2 test as a preliminary step in the multivariate process. The
Hotelling T2 test showed a significant overall difference (Hotelling T2 = 50.98,
E = 12.56, £ < .0001) between administrators, faculty, and staff at two- and four-
year colleges in their perceptions of the degree to which top management has
supported continuous quality improvement training programs. This result led to
rejection of the null hypothesis of identical mean vectors for the two groups at
the conventional .05 or .01 levels. Since there was a significant result in the
multivariate t test of the two groups, further analysis was necessary to find out
exactly which dependent variable(s) contributed to the overall significant

146
difference. Therefore, both the two- and four-year responses were compared
with respect to each of the separate dependent variables using a t test for
independent samples. This information is summarized in Table 29.
Table 29
t-test for Two- and Four-Year Colleges' Perception of Top Management Support
Top Management Support x2
X4 t a
Chief Executive 8.5422 6.8718 4.67* .0001 Officer (n=83) (n=117) Administrator 7.4762 7.0593 1.28 .2038
(n=84) (n=118)
*G < .05
The two-year college sample revealed a higher mean for perceived
support of both the chief executive officer and the administrator groups. The
chief executive officer group for the two-year colleges had a calculated t of 4.67,
based on a comparison of the two means, which was statistically significant
(p < .0001). Therefore, the training variable of perceived top management
support from the chief executive officer at the two-year colleges contributed to
the overall significant difference between the two- and four-year colleges.
Effectiveness of Continuous Quality Improvement Training Programs
Hypothesis 2, which was derived from research question 18, was tested
using the Hotelling T2 test as a preliminary step in the multivariate process. The
overall multivariate test was not statistically significant at the .05 level of

147
significance (Hotelling T2 7.9466, F = 1.9572, £ = .1025) with 11 completed
cases for the two-year group and 12 completed cases for the four-year group.
This result failed to reject the null hypothesis of identical mean vectors between
administrators, faculty, and staff at two- and four-year colleges in their
perceptions of the effectiveness of continuous quality improvement training;
and, therefore, the second hypothesis is supported.
Chapter Summary
The procedures for this study involved an analysis of the responses to a
questionnaire which was distributed to 524 individuals at two- and four-year
colleges in the United States that had been identified in the literature as being
involved in continuous quality improvement processes. There were 324
questionnaires returned and 211 of these affirmed activities in training for
continuous quality improvement and formed the basis for the data coding and
analysis. Data analysis was reported for each of the eighteen research
questions using a variety of statistical techniques. The statistical results for the
two hypotheses which were derived from the research questions were also
reported.

CHAPTER V
SUMMARY, DISCUSSION, CONCLUSIONS, AND
IMPLICATIONS AND RECOMMENDATIONS
Introduction
Chapter 5 is organized into five main sections: summary, discussion,
conclusions, and implications and recommendations for further research. The
summary of the study outlines the rationale and purpose for the study, the
research procedures which were undertaken, and the findings. Discussion of
the findings is presented and related to the literature review. Implications for the
research findings are addressed, and recommendations for additional research
are related to the findings.
Summary of the Study
Rationale for the Study
The rationale for the study resulted from recent interest demonstrated by
higher education institutions in their adoption and adaption of continuous
quality improvement (CQI) processes, a popular management philosophy
(Seymour, 1995, 1994, 1993d; Entin, 1994, 1993; Entner, 1993; Fisher, 1993;
Hendley, 1992; Horine, et al., 1993; Mangan, 1992; Coate, 1991, 1990;
DeCosmo, et al., 1991; Marchese, 1991; Sherr & Lozier, 1991; and Cornesky, et
al., 1990). In particular, the need for appropriate training in the philosophy and

149
tools of continuous quality improvement has been deemed integral to the
success of the management system; and certain implementation characteristics
have been identified as essential to ensure training program effectiveness
(Seymour, 1996; Horine & Hailey, 1995; Coate, 1993; Entner, 1993; Fisher,
1993; Sherr & Teeter, 1991; Stieber, 1991).
The research design and survey instrument were based on a previous
investigation of private businesses that were involved in the practice of total
quality management. In a descriptive research study, Stieber (1991) focused on
the identification of implementation characteristics of quality training programs
and the relationship of those training program variables to quality training
program outcomes or measures of effectiveness.
Problem and Purposes of the Study
The problem of this study was to identify and describe the implementa-
tion characteristics of continuous quality improvement training programs and to
determine whether or not and to what degree relationships exist between the
implementation characteristics and training program effectiveness, as perceived
by selected individuals at two- and four-year higher education institutions in the
United States. The specific purposes of this study in relation to the perceived
effectiveness of training programs for the implementation of continuous quality
improvement processes at selected higher education institutions were to:
1. identify through the literature and verify through experts the extent to
which higher education institutions are involved in continuous quality
improvement training programs;

150
2. describe how the institutions are organized for training personnel in
the philosophy and tools of total quality management;
3. determine which methods of training are perceived to be effective in
implementing the total quality management philosophy in higher education
institutions;
4. describe the best practices for total quality management training at
selected higher education institutions;
5. describe the impact of total quality management training programs
within these institutions; and
6. provide information and direction for professionals charged with
making decisions associated with the implementation of training programs for
total quality initiatives in higher education institutions.
Method of Procedures
The procedures for this study involved the designing of a descriptive
survey instrument based on previous research and based on a review of the
literature. The survey instrument was assessed for content validity by a panel of
experts. A pilot survey was conducted using a random sample of individuals at
two- and four year colleges who had indicated subscribing to a continuous
quality improvement process. Initially these returns were examined to determine
if there were any misunderstandings or obvious faults with the instrument. The
returns were compared with a later mailing to respondents from the same
institutions; and because only minor differences were found, reliability was
inferred.

151
After the pilot survey questionnaires were analyzed, the survey
instrument, along with a cover letter and return envelope, was mailed to
selected individuals at 524 two- and four-year colleges that were identified in
the literature as being involved in continuous quality improvement processes. A
63% return rate was achieved. Only those respondents who indicated
involvement in a continuous quality improvement training program were
included in the study (n =211).
The completed survey questionnaires were used to code the data and
present the results which were obtained after the execution of a variety of
statistical procedures. Anecdotal comments from the respondents were
summarized and are included in Appendix C.
Summary of the Findings
The findings of the study align with the responses to the eighteen
research questions and two hypotheses that were investigated to identify and
describe the implementation characteristics of continuous quality improvement
training programs and to facilitate an examination of the nature of relationships
between implementation characteristics and perceived training program
effectiveness for quality training initiatives. The major findings are presented
based on the results of the survey.
Demographic Profile of Respondents. An analysis of the demographic
profile of those colleges participating in CQI training revealed a wide range in
terms of institution size, based on the number of students enrolled and the
number of persons employed. Both large and small institutions were involved in

152
continuous quality improvement training. Those persons completing the survey
instrument were predominantly administrators who held various position titles
such as president, vice president, provost, dean, quality coordinator, director of
institutional research and planning and director of human resources. A majority
of the respondents indicated that they had been involved in CQI processes
between two and five years and employed either a full- or part-time person to
coordinate the implementation of quality improvement practices as well as the
direction of the training functions.
Profile of Quality Training Participants and Processes. While participation
in quality improvement training programs was not considered to be mandatory
by a majority of the respondents, more than half indicated that their employees
voluntarily attended the sessions which were delivered at periodic intervals.
Administrators and supervisors were the employee groups that had the highest
participation in training programs. However, overall findings indicate that a
relatively fair amount of the employee populations are being trained at all levels
of the respondent colleges.
Measurement of Perceived Training Program Effectiveness. More than
70% of the respondents indicated that a majority of those persons trained in
quality processes had an opportunity to evaluate the training program. In
addition, 36% indicated that they were currently in the process of assessing the
quality improvement training function. When asked how the evaluation was
conducted, based on the four levels of effectiveness proposed by Kirkpatrick
(1975), respondents indicated overwhelmingly (almost 74%) that they had

153
evaluated training effectiveness at the first level—participant reaction. The
remaining three levels of evaluation were also used but to a much lesser
degree—assess actual learning, 41% (n=86); assess behavior change, 26%
(n=54); and assess organizational change, 36% (n=75). However, respondents
indicated a positive response for perceived effectiveness at each level of
evaluation. In order to assess new skills learned, 20.6% of the respondents
indicated the use of pre- and post-testing. Assessing behavior change or new
skills used appears to be more difficult to achieve. Respondents noted varied
approaches such as observation, interviews, surveys, and performance
evaluations. Assessment of positive organizational change was also observed
or measured through climate surveys. When rating the perceived improvement
in selected areas of the organization, improvements were noted in all areas
except for the classroom environment. Also respondents perceived an
improvement in each of the work process areas as a result of CQI training. In the
area of cost of quality, there was perceived improvement as well as an equal
perception of regression which is most likely related to the cost of conducting
CQI training itself.
Identification of Implementation Characteristics. The identification of
major implementation characteristics included the philosophies, tools,
processes, and content segments that are a critical part of quality initiatives. A
wide variety of quality philosophies and tools appears to fashion the training
program design at the respondent colleges. The Deming approach ranked
highest, with more than 72% of the respondents indicating its use. A teaming

154
approach, the Baldrige Criteria, as well as the use of one of the more popular
authors on quality (Crosby, Juran, and Peters) also ranked high. Almost 40% of
the respondents indicated that they may use more than one of the philosophies
and/or tools, confirming a more eclectic approach to the training process. The
use of a variety of content segments was also verified with respondents
indicating a multiplicity of selections. Quality awareness, management and
leadership improvement, problem solving tools, teaming, interpersonal skills,
and customer service training were used by more than 60% of the respondents.
Beyond the major implementation characteristics of philosophies, tools
and content segments, additional implementation characteristics were identified
and analyzed. More than 70% of the respondents indicated support for the
training program from the top management of the colleges, which included both
the president/chancellor and the next level of administrators such as vice
presidents and provosts. Overwhelmingly, neither attending the quality
improvement training nor assessing skills used on the job were part of
performance reviews, with more than 65% of the respondents responding in the
negative. The majority of the respondent colleges indicated that they used both
internal and external trainers in the training function and were equally pleased
with the results from each type of training. For internal training programs, there
is some involvement of managers and supervisors in the instructional process,
but less than 50%. In terms of initiating pilot projects across the campus, over
60% of the respondents answered in the affirmative and indicated the dominant
areas of interest to be in the administrative and support service work units of the

155
college. The allocation of funding for the implementation of quality improvement
training programs at the respondent colleges averaged $50,000. Total
budgeting for quality improvement training appeared to be equal for both the
two- and four-year colleges. The results of a Spearman, ranked non-parametric
correlation coefficient matrix revealed no statistically significant relationship
between the allocation of funding for quality training and the perceived
effectiveness of such training.
Relationships between Major Implementation Characteristics. Several
Spearman ranked, non-parametric correlation coefficient matrices were
executed to determine the relationships between the philosophies, tools, and
content segments to the areas of organizational development as well as to the
various work processes. In the Spearman matrix featuring philosophies and
tools and organizational development areas, both Senge and the Baldrige
Criteria were associated with the perception of improved leadership. In the
Spearman matrix featuring philosophies and tools and work processes, Crosby
was associated with the perception of a decrease in waste. In the Spearman
matrix featuring content segments and organizational development areas, there
were several statistically significant associations. These included training in
quality awareness (work environment), management and leadership
(leadership), team leadership (work and classroom environment), and training
in team process improvement (work processes and classroom environment).
In the area of perceived improvements in processes relevant to certain
administrative and support areas, several content segment areas emerged as

156
statistically significant. These included team leadership (cost of quality,
controlling waste, and decreasing service problems) and training in team
process improvement (controlling waste).
Relationships between Implementation Characteristics and Outcome
Measures for Training Effectiveness. A series of Spearman ranked, non-
parametric correlation coefficient matrices were compiled to examine the
relationships between the implementation characteristics or training program
variables and the four criterion variables designed to measure perceived
training program effectiveness. Only those associations which were statistically
significant at the .05 level of significance are included in this summary.
The correlation matrix of major implementation variables featuring
philosophy and tools yielded two associations with the outcome measures for
effectiveness. The category labeled as other was related to the outcome
measure participant reaction/opinion. Two associations emerged for the
outcome measure of extent of new skills learned and included the use of Peters
and the Baldrige Criteria. The correlation matrix featuring content segments
yielded several statistically significant associations. Quality awareness training
was related to the outcome measure participant reaction/opinion. Both process
improvement training and the assessment of quality proved to be positively
related to the outcome measure of extent of skills learned. Training in quality
awareness, management and leadership, interpersonal skills, and team
leadership were all positively associated with positive organizational change. A

157
negative relationship also emerged between this outcome measure and
advanced statistical processes.
Other training variables were also correlated to the outcome measures
for effectiveness to determine if any relationships existed at the .05 level of
significance, through the use of a Spearman ranked, non-parametric correlation
coefficient matrix. Those training variables which correlated positively with the
outcome measure of rated reaction/opinion included: extent of staff support of
training, rated effectiveness of internal trainers, and rated effectiveness of
external trainers. Positive correlations of other training variables with the
outcome measure of rated extent of new skills learned included: extent of faculty
support of training, extent of staff support of training, extent of the use of external
or internal trainers, rated effectiveness of internal trainers, and rated
effectiveness of external trainers. Positive correlations of other training variables
with the outcome measure of extent of new skills used included: extent of
administrator support of training, extent of staff support of training, extent that
skills used are part of performance reviews, and rated effectiveness of internal
trainers. Positive correlations of other training variables with the outcome
measure of extent of positive organizational change included: extent that board
members, administrators, supervisors, faculty, professional staff and support
staff are trained; extent of president/chancellor, administrator, faculty and staff
support of training; extent that skills used are part of performance reviews; rated
effectiveness of internal and external trainers; and the extent that supervisors

158
and managers are involved in the instructional processes for the quality training
program.
Multiple Regression Analyses of Outcome Measures for Perceived
Training Program Effectiveness. In order to ascertain the relative importance of
each of the statistically significant implementation characteristics in explaining
the variation in perceived quality training program effectiveness, a series of
stepwise multiple regression analyses were executed for the each of the four
outcome measures of effectiveness—rated reaction/opinion, the extent of skills
learned, the extent of skills used, and the extent of positive organizational
change. All of the implementation variables that correlated with an outcome
measure at the .05 level of significance in the Spearman ranked, non-
parametric correlations were entered into each regression analysis using the
stepwise method, based upon their ability to explain a significant proportion of
the variance.
The major implementation variables that were significant via the
Spearman matrices, and which included philosophies, tools and content
segments, yielded several predictor variables based on the regression
analyses. The philosophy/tool category labeled as other and the content
segment identified as quality awareness together explained 6% of the variance
for the outcome measure of rated reaction/opinion. The content segment
variable, assessment of quality, explained 9% of the variance for the outcome
measure extent of new skills learned. For the outcome measure of extent of
positive organizational change, the content segment variables identified as

159
team leadership and management and leadership in combination explained
27% of the variance.
In addition, four stepwise multiple regression analyses were executed to
reveal the predictor variables relating to the other statistically significant training
variables or implementation characteristics of quality training programs and
their ability to explain the four outcome measures of effectiveness. This process
also yielded several predictor variables. The independent training variables
identified as rated effectiveness of both internal and external trainers in
combination accounted for almost 20% of the variance for the outcome measure
of rated reaction/opinion. The independent training variables identified as
faculty support of training and rated effectiveness of internal trainers together
accounted for almost 19% of the variance for the outcome measure extent of
new skills learned. The independent training variable identified as rated
effectiveness of internal training accounted for almost 14% of the variance for
the outcome measure of rated extent of new skills used. And for the outcome
measure of rated extent of positive organizational change, the independent
training variables identified as staff and faculty support of training accounted for
almost 23% of the variance.
Testing for the Two Hypotheses. The findings for the two hypotheses that
were derived from the research questions were as follows:
Hypothesis 1 (Research Question 9): There will be no significant
difference between administrators, faculty, and staff, at two- and four-year
colleges, in their perceptions of the degree to which top management has

160
supported continuous quality improvement training programs. The multivariate,
Hotelling T2 test showed a significant overall difference (Hotelling T2 = 50.98,
F = 12.56, £ < .0001) between administrators, faculty, and staff at two- and four-
year colleges in their perceptions of the degree to which top management has
supported continuous quality improvement training programs. Consequently,
Hypothesis 1 was rejected.
Hypothesis 2 (Research Question 18): There will be no significant
difference between administrators, faculty, and staff, at two- and four-year
colleges, in their perceptions of the effectiveness of continuous quality
improvement training programs at their institutions. The multivariate, Hotelling
T2 test was not statistically significant at the .05 level of significance (Hotelling T2
= 7.9466, £ = 1.9572, £ = .1025) with 11 completed cases for the two-year group
and 12 completed cases for the four-year group. Consequently, Hypothesis 2
was substantiated.
Discussion of the Findings
The literature review, as well as the findings from this study, support the
need for further information and direction for professionals charged with making
decisions associated with the implementation of training programs for
continuous quality improvement processes. However, while a considerable
number of two- and four year colleges have indicated involvement in CQI
training initiatives, many start-ups result in less than expected outcomes which

161
is primarily attributed to a weakness of the implementation process as well as to
the strength of the culture of the campus (Sloan, 1994).
Demographics
While the research study yielded an adequate return of 63%, almost 37%
of those respondents indicated that their college had not yet committed to the
management concept, had abandoned quality training practices, or were at the
beginning stages of the implementation process. Overall, those persons who
returned the survey unanswered indicated their personal support for the
concept of continuous quality improvement. Comments from the respondents
indicated that the implementation process was quite a challenge, implying that
adoption of the management system was often predicated on who provided the
leadership for the successful implementation of the process as well as on other
intervening circumstances such as retrenchment issues and the need for moral
support from all employees.
Those institutions that indicated current practice in quality training and in
continuous quality improvement processes were not disparate in terms of
institution size—of both employees and students—indicating a wide breadth of
involvement in the two- and four-year colleges. Many of the larger institutions
were organized by divisions or colleges when there was no champion from the
president or chancellor to support the effort. The literature supports the concept
of finding champions within the organization to provide leadership for the
implementation of continuous quality improvement since many higher
education institutions are trapped in the myths and traditions which have

162
nurtured the campus culture arid which may prevent quality processes from
taking hold (Carroll, 1994; Seymour, 1992, 1993d; Coate, 1993; Cornesky et al.,
1991). The majority of the respondents had been involved in continuous quality
improvement processes between two and five years which is considered to be,
according to the experts in the field, in a formative phase in terms of embracing
such systemic change (Horine & Hailey, 1995; Entner, 1993; Coate, 1991; and
Crosby, 1979). Many of the anecdotal comments from the respondents
indicated that certain aspects of the evaluation processes had not occurred
because the CQI process was in its beginning stage.
Measures of Perceived Training Program Effectiveness
The results of the study found that assessing reaction to the training
program was the most frequently employed evaluation technique. This
substantiates the literature which describes this method of evaluation as the
easiest to implement as it takes usually takes place immediately after the
training sessions (Krein & Weldon, 1994; Michalak & Yager, 1979; Kirkpatrick,
1975; and Tracey, 1968). While other levels of evaluation were utilized by the
respondents, the numbers were small. The length of time involved in quality
processes and training specifically may also help to explain this deficiency.
When respondents evaluated the perceived improvements in various
organizational areas, the least affected area was that of the classroom
environment which supports the literature findings that instruction is generally
the last area of the organization to adopt the quality philosophy (Horine &
Hailey, 1995; Jones & Timmerman, 1994; Seymour, 1993b, 1992; Coate, 1993;

163
and Ewell, 1993). Respondents also perceived improvement in specific work
processes such as controlling waste and solving service problems as a result of
the quality training program. However, in the area of time on task, there was a
perception of some regression, which is most likely attributable to a perceived
increase in the amount of time spent in training, as well as in working in teams
and adhering to the new types of group processes.
Identification of Implementation Characteristics
All of the implementation characteristics which were revealed as
elements of the quality training programs in this study are described in the
literature as well as in other research studies as critical elements (Seymour,
1995, 1992; Peterson, 1993; Stieber, 1991; Winter, 1991; and Spanbauer,
1987). The wide variety of philosophies, tools and content segments utilized in
the quality training programs were especially effective in providing an
awareness level of the management process. Other characteristics such as
support of top management for the training program and the use of pilot projects
were common to the quality training programs as well. Interestingly, a majority
of respondents indicated that there were no requirements for mandatory
participation in training or for assessment of employees using skills on the job.
Deming (1986) underscored his opposition to performance assessments,
preferring to look at processes as indicators of improvement needs.
The cost of quality is another question that comes up frequently when
embarking on the quality journey. The results of the study, however, indicated
that the allocation of funding for quality training has a neglegible effect on the

164
perceived effectiveness of such training. However, dollars expended for training
programs may escalate when the training is outsourced to consultants.
Relationships between Major Implementation Characteristics
The relationships between the major implementation characteristics of
philosophies, tools and content segments were indicative of expectations based
on the literature. Notably, Senge and the Baldrige Criteria were related to
improved leadership which is an underlying theme for both of these variables.
Those content areas which emerged as positively related to both organizational
areas and work processes once again revealed associations that would be
expected. Quality awareness, leadership, teaming, and process improvement
training are considered to be the basic underpinnings for effective training in
continuous quality improvement processes (Seymour, 1996; Juran, 1989;
Ishikawa, 1986; Deming, 1986; and Crosby, 1979).
Relationships between Implementation Characteristics and Outcome Measures
for Training Program Effectiveness
The relationships between the major characteristics of philosophy, tools,
and content segments and the four levels of effectiveness did not reveal any
extensive associations. However, the use of Peters and the Baldrige Criteria
were associated with perceived effectiveness for the extent of new skills
learned. Each of these are extremely prescriptive in terms their suggestions for
the implementation of quality processes. When correlating content segments to
the four levels of effectiveness, there were associations that related to the
primary concepts of quality awareness, team process improvement and

165
leadership which are considered to be critical elements for any quality program
(Seymour, 1996; Fisher, 1995; Stieber, 1991; and Gitlow & Gitlow, 1987).
The other training variables which were positively associated with the
outcome measures were supported by the literature review as well as other
research (Seymour, 1996; Horine and Hailey, 1995; Carroll, 1994; Bonstingl,
1992; and Stieber, 1991). The use of and the rated effectiveness of both internal
and external trainers related to several of the outcome measures. No doubt, it is
essential to provide high caliber training whether it is delivered by the
employees of the college or paid consultants. However, this variable had an
inverse relationship to the outcome measure of new skills learned (r = -.2127)
which demonstrates that both types of trainers were perceived to be effective.
Both support of the training effort and the extent that employee groups were
trained was also significant for all employee groups in at least one of the
outcome measures. In particular, for the outcome measure of extent of positive
organizational change, there were ten relationships that indicated the
importance of support for the training program as well as actual participation in
the program.
The research study revealed that the majority of respondents depended
upon the president/chancellor or other upper level administrators for steering
the quality training functions which were achieved through both internal and
external resources. Stieber (1991) found that the level of top management
support was also significantly related to perceived effectiveness of the training
program. Interestingly, the extent of faculty support of training had the highest

166
correlation to this outcome measure (r = .6009), which is indicative of the impact
that faculty can have on the culture of the campus. The extent that skills used
are part of performance reviews had an inverse relationship to positive
organizational change which explains the current reluctance to relate quality
improvement training efforts to performance.
Predictor Variables for Outcome Measures of Effectiveness
Major implementation characteristics as predictor variables. Both quality
awareness and the use of an eclectic approach to training emerged as predictor
variables for the outcome measure of rated reaction/opinion. Instruction in
quality training usually begins with sessions about quality awareness, and most
likely the majority of those colleges that were involved in training for less than
two years had completed this level of instruction. Using a variety of
philosophies, tools and techniques is also quite common, especially in higher
education institutions where there may be a preference to find less business
oriented materials and champions. The content segment of assessment of
quality emerged as a predictor variable for the outcome measure of new skills
learned. This is quite understandable since assessment is critical to any type of
learning process, especially one that is focused on continuous improvement.
The Baldrige Criteria as well as Deming focus on assessment by data and fact
as the means to determine effectiveness. Positive organizational change was
perceived to be impacted by a concentration on the principles of team
leadership and management and leadership. Again, this is indicative of the
literature findings which emphasize that solid management and leadership

167
roles in an organization are vital to effective quality processes (Seymour, 1996,
1992; Coate, 1993; Juran, 1992; and Stieber, 1991).
Other implementation characteristics as predictor variables. The
effectiveness of both internal and external trainers emerged as significant
predictors for rated reaction/opinion. If the training is good, the participants will
respond accordingly. There being no discrimination between the two types of
trainers would lead to a question of which was most cost effective. No doubt, the
use of consultants adds tremendously to the cost of quality; therefore, the use of
internal staff may be economical and at the same time yield further support from
those being trained.
The predictor variables that emerged for the outcome measure of extent
of new skills learned were the extent of faculty support of training and the rated
effectiveness of internal trainers. It is apparent that faculty support of training
would relate to new skills learned since this employee group has as its main
focus the teaching and learning processes. Again, the perceived effectiveness
of internal trainers has a predictor effect on this outcome measure which further
supports their use in the quality training program.
For the outcome measure of extent of new skills used, the rated
effectiveness of internal trainers emerged as a predictor variable. The use of
internal trainers shows its strength once again and most likely has a positive
effect on the skills being used because those who are doing the training are
also actively participating in the day-to-day operations of the organization
where they can model the same skills they teach. Also the extent of staff support

168
as a predictor variable for this outcome measure supports the wide use of pilot
projects where staff members are more likely to be involved, thus using the
skills they have learned in the quality training program.
For the fourth level of effectiveness, the extent of positive organizational
change, two predictor variables emerged—both the extent of faculty and staff
support of training. Each of these employee groups can have a significant
impact on the quality initiative. Generally, faculty are the last employee group to
position themselves as supporters of CQI programs. They are the primary force
that creates the culture of the campus; and, no doubt, their support of the quality
training program will impact the tenor of the climate of the campus. Staff support
of training will also impact positive organizational change if those trained are
actively involved in pilot projects, thus proving the utility as well as the validity of
the skills learned in the quality training program.
Conclusions
Based on the findings from the analysis of the data, as well as from the
review of the literature, the following conclusions are derived as they relate to
the purposes of the study:
1. Training programs for the implementation of continuous quality
improvement processes are being used at both two- and four-year colleges in
the United States regardless of institution size. Overall, it appears that the study
population perceives the training function positively for each level of
effectiveness. However, evaluation of such training programs at all of the levels

169
of effectiveness is not a common practice. The first level of effectiveness—
reaction to the training—is the most often used measure to assess training
programs. The assessment of skills learned, skills used, and ultimately the
measurement of campus climate or positive organizational change are
considered to be more difficult to undertake in the training programs. However,
in the case of training for CQI it is even more essential to include all levels of
measurement to underscore the inherent theme of continuous quality
improvement within the training program function itself.
2. The implementation characteristics which were identified through a
review of the literature as being significant to the training program were
substantiated in the data analysis with the exception of three variables:
attending the quality improvement training sessions is used as part of an
employee's performance review; use of the skills taught in the quality training
program on the job is part of the performance reviews; and training in quality
improvement is mandatory for all employees. None of these variables emerged
as essential elements or characteristics of the quality training programs.
Business and industry may subscribe more closely to these characteristics
since they are oriented toward a profit motive. At this time, higher education
institutions are less inclined to mandate training and tie such training to
performance; however, as accountability issues become more pressing and
funding levels continue to diminish, colleges may reassess their approach to
how accountability for quality fits into everyone's responsibility.

170
3. The predictor variables which related to perceived training program
effectiveness included the following: (a) using a variety of philosophies, tools,
and content segments; (b) training in quality awareness, team leadership,
management and leadership, and assessment; (c) the use of internal and
external trainers; and (d) the extent of staff and faculty support. As substantiated
by the literature review, all of these implementation characteristics are critical to
an effective CQI training process. Colleges currently involved in or beginning a
quality initiative would be well served by identifying and including each of these
characteristics as well as the other significant variables as critical components
in their training programs. However, the actual reliability of these characteristics
as predictor variables of effectiveness is suspect because of the low numbers of
colleges indicating assessment at each of the levels of effectiveness.
4. The implementation of effective continuous quality improvement
training programs is dependent on top management support and the training of
employee groups particularly at the supervisory level and above. However, top
management support for quality training programs was perceived to be greater
at two-year colleges in the study population which may be influenced by the
more pragmatic nature of the community college in its diverse mission and
scope. In the academy, faculty support of the training function, as well as of CQI
processes, appears to be quite low. Unquestionably, the primacy of the faculty

171
as de facto champions of quality education prohibits their unbridled acceptance
of anything that smacks of faddism or relates to business and industry protocol.
5. The use of internal trainers was a significant predictor variable for each
of the outcome measures of effectiveness, with the exception of rated extent of
positive organizational change. However, whether training was conducted by
using internal personal or outside consultants, it was perceived to be effective.
When correlating funding for such training to perceived effectiveness, there was
no significant relationship determined. Therefore, administrators involved in
budgeting for quality training processes should not equate additional dollars
expended to training program effectiveness.
6. While variation in quality training program outcomes can be explained
by a variety and combination of implementation characteristics, it is important to
consider that some of the percentage of variation could be attributed to the
learning design that was used, as well as to other strategies not included in this
study, and to measurement error inherent in the survey instrument itself (i.e.
respondents interpreting questions differently).
Implications and Recommendations
Every two- and four-year college is a proponent of quality. Mechanisms
are in place at higher education institutions that demonstrate and document
quality—self-study accreditation documents, admission requirements,
standards for grades, promotion and tenure criteria. Everyone appears to be for
quality. But within the last decade there has been unprecedented demand for

172
higher quality in the academy. National reports have indicated that results are
not forthcoming, and accrediting bodies have revised criteria to focus on
outcomes assessment. Higher education may be for quality, but perceptions
seem to indicate that higher education is not doing quality. The recent interest in
continuous quality improvement processes by higher education institutions is
indicative of the realization that quality has more depth, is more challenging, is
illusive to some, and requires organizational transformation by adoption or
adaption in its entirety.
Implications
Based on the review of the literature and the study findings, a program of
training for quality initiatives is vital to the effective implementation of continuous
quality improvement processes. The identification of the implementation
characteristics for training programs will allow those persons charged with the
planning, development, implementation, and assessment functions to focus on
those elements that are integral to systemic change and ultimately to an
improved campus climate. While each college is unique in its mission and
goals, the system that defines quality processes is similarly structured for all
practitioners.
Continuous quality improvement training must have the support of top
management to succeed. A review of the comments on the survey instruments
reveal that many quality initiatives are dependent on a champion to lead the
effort. Those colleges that are successful in continuing the quality journey are
driven by leadership that has defined a sense of purpose for the organization.

173
Training programs are best serving the internal customers when they
include everyone. The lack of faculty support and participation in the training
programs defeats the basic premise of constancy of purpose. Respondents
mentioned that if they were to once again launch CQI on their campus they
would involve faculty differently such as including them in the training process
as opposed to hiring outside consultants. All employees of the organization
must be committed to CQI if positive, systemic organizational change is to be
achieved.
Both two- and four-year colleges seem to prefer a variety of philosophies,
tools and content segments which focus on quality awareness, leadership,
teaming, process improvements and customer service. In colleges that choose
to focus on pilot projects or cross-functional teams, it is imperative that the
training program include enough tools or practical advice so that teams are able
to function successfully. One resounding commonality from respondents of the
study population was that there are many approaches to the implementation of
quality improvement training. No one right thing emerged in terms of facilitating
the process.
Evaluation of the continuous quality improvement training programs
appears to be based on undocumented successes described by the study
population. Evaluation is common at the reaction/opinion level, but tangible
results are less quantifiable and measurable. The use of the Balridge Criteria
for Education may provide direction for those institutions desiring a more
structured approach for the implementation of continuous quality improvement

174
processes. Utilizing a Baldrige assessment, customer satisfaction surveys,
organizational climate surveys, internal audits and student and staff surveys can
provide for an effective formal evaluation system.
A final word to those considering the implementation of continuous
quality improvement training programs is not to expect great successes in a
short period of time. Most of the respondent colleges had been involved in
continuous quality improvement training between two and five years and
indicated that they were just getting started. Educators considering CQI should
take time to research the process, visit other campuses, and digest the
voluminous materials that are available in many formats. Quality is a continuous
journey; training is just the first step.
Recommendations for Further Study
The current research investigation has revealed suggestions for further
study in the following areas:
1. The baseline data developed in this study can be used for a
longitudinal study in three to five years to determine what progress the
respondent colleges have made in their training programs as well as in the
implementation of continuous quality improvement processes.
2. A revised survey instrument, using the Baldrige for Education Criteria,
could be developed to assess the extent of adherence to the principles of
continuous quality improvement by the respondent colleges.
3. A study could be conducted employing the critical-incident technique.
This would involve the investigation of the performance of various groups of

175
employees at those colleges who continue the quality journey after ten years.
This type of study would reveal those attributes which have contributed to the
success of the continuous quality improvement process.
4. Future research into relevant implementation characteristics such as
content segments, top management support, use of internal and external
trainers, extent of support of faculty and staff could attempt to establish causal
links between the implementation variables and the outcome measures for
training program effectiveness.
5. Much of the unexplained variance in each of the four outcome
measures of effectiveness may be attributed to some other factor such as
learning design, other implementation characteristics not included in this study,
and measurement error of the survey instrument. Therefore, future research
could attempt to account for the unexplained variance in perceived program
effectiveness.
6. Certain implementation variables could be explored further to discover
specific issues that are attendant to each, such as the extent of faculty support.
Questions whether and why not faculty attended training sessions, participated
in the instruction process, and took part in pilot projects could be studied to
ascertain what impact each attribute of faculty has on the outcome measures of
effectiveness pertaining to quality improvement training.
7. The survey instrument contained general questions regarding the four
measures of effectiveness such as the use of pre- and post-testing, behavior
change, and organizational change methodology. The instrument could be

176
further refined to include specific skills learned, behavior change and
organizational change items that will elicit discrete methodologies for each.

APPENDIXES

APPENDIX A
TRANSMITTAL LETTER TO PANEL OF EXPERTS
LIST OF PANEL OF EXPERTS

179
APPENDIX: A Transmittal Letter to Panel of Experts
October, 1994
TO: PANEL OF EXPERTS
Thank you for agreeing to participate as a member of the panel of experts who will validate the survey instrument to be used in my dissertation entitled "Implementation Characteristics of Effective Quality Improvement Training at Selected Institutions of Higher Education in the United States".
After numerous drafts and what seems to have been an inordinately lengthy process, I successfully defended my dissertation proposal at the University of North Texas, Department of Higher Education on August 11,1994. The enclosed survey instrument is being sent to you for your analysis and suggested revisions. An abstract of the dissertation proposal, along with the survey instrument and a critique sheet is enclosed for your use in the validation process.
Please review the survey instrument and make suggestions for changes on the critique sheets. Also indicate whether or not a question should be retained by checking either "yes" or "no" next to each of the survey items. Those questions which have a 51 percent positive response will be retained. Additional questions will also be considered.
Please return the survey instrument and critique sheet in the enclosed, stamped envelope at your earliest convenience. I am targeting November 1,1994, as the date to send out the revised instrument to a pilot sample for reliability testing.
Once again, I appreciate your affirmation of this important research by your acceptance of this task. I will keep in touch with you to let you know how I am progressing. If you are in need of additional information or have any further questions, please telephone me at Home: (817) 596-9988; or Work: (817) 594-5471. Also, my FAX number at work is (817) 594-0627.
Cordially yours,
KatherineC. Miller Enclosures

180
APPENDIX: A PANEL OF EXPERTS
For Validation of the Research Instrument
Robert Cornesky, Sc.D. Total Quality Management Consultants Specializing in Educational Institutions 489 Oakland Park Blvd. Port Orange, Florida 32127 (800) 388-8682
Maude L. Holm, M.Ed. Director, Organizational Development Cuyahoga Community College 2415 Woodland Avenue Cleveland, Ohio 44115-3239 216-987-3034
Margo Hirsch, Ph.D. Director of Quality and Planning Dallas Community College District 701 Elm Street Dallas, Texas 75202 (214) 746-2451
Art Lacy, Group Education Defense Systems and Electronics Group Texas Instruments 7800 Banner Drive (P.O. Box 650311) Dallas, Texas 75265 (214) 917-7516
Carol Mishler Project and Research Services Mgr. Fox Valley Technical College 1825 Bluemound Drive (P.O. Box 2277) Appleton, Wisconsin 54913-2277 414-735-5600
Daniel T. Seymour, Ph.D. Consultant to Higher Education Q Systems 110 S. Sunrise Way, Suite 350 Palm Springs, California 92262 (619) 778-8704
Stanley Spanbauer, Ph. D. National Quality Academy 5 Systems Lane (P.O. Box 2277) Appleton, Wisconsin 54913 (414) 735-4898 800) 638-1202
181
APPENDIX B
SURVEY INSTRUMENT
TRANSMITTAL LETTER TO STUDY POPULATION
FOLLOW-UP POST CARD TO STUDY POPULATION
FOLLOW-UP LETTER TO STUDY POPULATION

1 8 2
Survey of Quality Improvement Training Programs
College/University Name
Type of Institution: • 2-Year • 4-Year Number of Employees _
Number of FTE Students (Yr.)
Respondent Name (Optional)
• Public • Private
Position: • Admin. • Staff • Faculty Title
1. Is your institution currently involved in training its employees for quality improvement? (If not, please check "no", leave the rest of the survey blank, and return it.)
• Yes • No
2. How many years has your institution practiced quality improvement?
• Less than a year • 5 to 6 years • 1 to 2 years • 6 to 7 years • 2 to 3 years • 7 to 8 years • 3 to 4 years • More than 8 years • 4 to 5 years • Not available
3. Does your institution have a designated quality improvement coordinator?
If no, who is responsible for quality improvement?
• Yes, Full-Time • Yes, Part-Time • No
Position Title:
4. Have you evaluated the quality improvement training program you currently use by seeking participants' reactions to the program?
If "yes", rate the participants' overall opinion of the program. (Circle number)
• Yes • No
1 = Unfavorable 5 = Favorable
10 = Highly Favorable
1 2 3 4 5 6 7 8 9 10
5. a. Have you evaluated the training program you currently use by assessing to what extent new skills have been learned?
If "yes", to what degree? (Circle number)
b. Was pre- and post-testing used to assess behavior/attitude change before and after training? (example: climate survey)
• Yes • No
1 = No new skills 5 = Some new skills
10 = Many new skills
1 2 3 4 5 6 7 8 9 10
• Yes • No • In Process
6. a. Have you evaluated the training program you currently use by determining to what extent new skills are being used on the job?
If so, to what extent? (Circle number)
b. If yes, how was employee behavior change evaluated?
• Yes • No • In Process
1 = Not using skills 10 = Extensively using skills
1 2 3 4 5 6 7 8 9 10
Please identify:
6. a. Have you evaluated the training program you currently use by determining to what extent new skills are being used on the job?
If so, to what extent? (Circle number)
b. If yes, how was employee behavior change evaluated?
6. a. Have you evaluated the training program you currently use by determining to what extent new skills are being used on the job?
If so, to what extent? (Circle number)
b. If yes, how was employee behavior change evaluated?

183
7. Approximately what percentage of the following groups have received quality training to date?
(Circle number)
a. Board Members 0 10 20 30 40 50 60 70 80 90 100 %
b. Administration (Manages total work units of 0 10 20 30 40 50 60 70 80 90 100 % functional staffs at top levels)
c. Chairs/Directors (Manages full-time and adjunct 0 10 20 30 40 50 60 70 80 90 100 % faculty)
d. Supervisory (Manages Staff) 0 10 20 30 40 50 60 70 80 90 100 %
e. Salaried Employees (Faculty) 0 10 20 30 40 50 60 70 80 90 100 %
f. Salaried Employees (Professional Staff) 0 10 20 30 40 50 60 70 80 90 100 %
g. Hourly Employees (Support Staff) 0 10 20 30 40 50 60 70 80 90 100 %
8. a. Have you evaluated the training program you • Yes • No • Too early to evaluate currently use by determining if positive organizational change has occurred as a result of the training?
b. If yes, to what extent has positive organizational 1 = No noticeable change change occurred? 5 = Some change
10 = Extensive change (Circle number)
1 2 3 4 5 6 7 8 9 10 c. Evaluate the effectiveness of your quality
training program based on the following areas of Got Remained Not your institution: Worse the Same Improved Applicable
Leadership • • • •
Work Environment • • • •
Work Processes • • • •
Customer Service • • • •
Classroom Environment • • • •
Other • • • •
Note: These items may be relevant to certain Remained Not administrative/support service areas: Decreased the Same Increased Applicable
Cost of Quality • • • •
Time on Task • • • •
Waste • • • •
Service Problems • • • •
Other • • • •

1 8 4
9. What, if any, specific quality philosophy or tools support your training efforts?
(Please rank: e.g. 1=most frequently used, 2=next, etc.)
Conway Crosby Deming Feigenbaum Teaming Other (Identify):
Ishikawa Juran Peters Peter Senge Baldridge Criteria None Specifically
10. What specific content segments do you include as part of overall quality improvement training?
(Please check as appropriate)
• Quality Awareness Training • Management Practices/Leadership • Interpersonal Skills • Knowledge of Processes and Process Improvement
Techniques • Problem Solving Tools/Techniques • Advanced Statistical Techniques • Customer Service • Inventory/Supplier Management • Group Dynamics • Team Leader Training • Process Improvement Team Training • Quality Function Deployment • Assessment/Measurement of Quality • None of the above • Others (Please specify by name)
11. To what degree do you have moral support for the quality improvement training program? (Circle Number)
1 = Low Support 5 = Moderate Support
10 = High Support
a. CEO: Chancellor, President 1 2 3 4 5 6 7 8 9 10 b. Administrators: Provost, V-P, Dean, Chair 1 2 3 4 5 6 7 8 9 10 c. Faculty 1 2 3 4 5 6 7 8 9 10 d. Staff 1 2 3 4 5 6 7 8 9 10
12. Is attending the quality improvement training sessions part of an employee's performance review?
• Yes • No • * Sometimes * Comment:
13. Is using the skills taught in the quality improvement training program on the job made part of performance reviews?
• Yes • No * Comment:
• * Sometimes
14. To what extent does your institution use its own employees versus external consultants as trainers in the quality improvement training program?
• All Own Employees • Both Employees and Consultants • All External Consultants
15. Rate the effectiveness of in-house training vs. external consultant training.
1 = Not Effective 5 = Effective 10 = Very Effective
Internal: 1
External: 1
2
2
3 4
3 4
6
6
7
7
8
8
10
10

185
16. To what degree are the supervisors or managers involved in the instruction of the training program?
(Circle Number)
1 = No Involvement 5 = Some Involvement
10 = Significant Involvement
1 2 3 4 5 6 7 8 9 10
17. a. Was an initial pilot program conducted to evaluate the quality training program?
b. If yes, in which work units of the institution?
• Yes • No
• Administration • Business Office • Maintenance • Academic Prog. • Student Services • Cafeteria • Technical Prog. • Library • Other
18. Approximately what percentage of those trained took part in any evaluation assessment of quality improvement training?
(Circle Number)
• In process (if currently on-going)
0 10 20 30 40 50 60 70 80 90 100%
19. Is training in quality improvement mandatory for all employees?
If no, what percentage of those employees not required to attend training voluntarily attended the program?
(Circle Number)
• Yes • No
• Information not available
0 10 20 30 40 50 60 70 80 90 100%
20. Is your institution's quality improvement training scheduled during one continuous session, as periodic sessions with employees returning to their jobs between sessions, or as needed?
• Continuous Session • Periodic Sessions • Combination of the two • Just-in-Time-Training
21. What is the estimated annual budget for quality training at your institution?
• $0 • $70,000 to $99,999 • $1 to $9,999 • $100,000 to $299,999 • $10,000 to $29,999 • Over $300,000 • $30,000 to $49,999 • Don't know • $50,000 to $69,999
ADDITIONAL COMMENTS (Please include any special characteristics regarding the way in which your institution's quality improvement training program has been implemented).
Thank you for completing this survey. Please return it in the pre-addressed envelope provided.
Would you be interested in participating in a follow-up interview about your CQI initiative? • Yes • No
Check here if you would like to receive a summary of the final report.
Katherine C. Miller Weatherford College 308 East Park Avenue Weatherford, TX 76086 (817)594-5471, Extension 336

186
APPENDIX: B Transmittal Letter to Study Participants
April 24,1995
Dear Colleague:
As a University of North Texas doctoral candidate, as well as an ardent advocate for quality principles, I am conducting a dissertation study to determine the perceptions of administrators and/or quality coordinators as to which methods of training are effective in implementing Continuous Quality Improvement (CQI) processes at higher education institutions across the United States. You have been identified in the literature as being a champion for the implementation of CQI processes in the educational and/or management systems at your institution; therefore, your assistance with the completion of the survey instrument is invited.
Your participation in this study will provide valuable information concerning the quality improvement training program at your institution. The results of this research will assist quality professionals and administrators with decisions on how to implement future training efforts associated with quality initiatives in their organizations. In addition, the findings will enable colleges and universities to make appropriate, cost effective choices when implementing training programs for CQI.
Please take a few minutes of your valuable time to fill out the survey instrument and also write any comments you may have concerning the items or other pertinent aspects of your experience with CQI. If possible, please return the survey instrument within two weeks, using the enclosed stamped, addressed envelope. In appreciation for your assistance with this survey, I will be pleased to send you a summary report of the findings. Please be assured that the information you provide is for research purposes only and will be held in strict confidence.
The ultimate benefits of this or any other survey depend on the thoughtful responses and willing participation from those who are asked to help. Your willingness to participate is important and extremely appreciated. Thank you.
Yours in quality!
Katherine Miller, Dean of Occupational Education Ph.D. Candidate, University of North Texas
Enclosures
Note: If you do not have the information requested, please forward this packet, as soon as possible, to the person at your institution who can best provide accurate and timely data.

187
Reminder...Reminder...Reminder...Reminder...Reminder...Reminder...Reminder...Reminder Recently you were requested to complete a survey instrument or to pass it along to someone else in
your organization who is familiar with your CQI campus training effort.
The purpose of the research project is to determine the perceptions of administrators and/or quality coordinators as to which methods of training are effective in implementing Continuous Quality Improvement (CQJ) processes at higher education institutions across the United States.
You have been identified in the literature as being a champion for the implementation of CQI processes in the educational and/or management systems at your institution; therefore, you can provide valuable information.
The results of this research will assist quality professionals and administrators with decisions on how to implement future training efforts associated with quality initiatives in their organizations. In addition, the findings will enable college and universities to make appropriate, cost effective choices when implementing training programs for CQI.
If you have any questions or need another survey instrument, please contact:
A Survey of
Quality
Improvement
Training Programs Dean Katherine Miller * Weatherford College
(817) 594-5471, Ext. 336 or E-Mail [email protected]
Please take a few minutes and respond by returning the completed questionnaire within the week. Your comments are invited. Thank you!
Reminder...Reminder...Reminder...Reminder...Reminder...Reminder...Reminder...Reminder

188
APPENDIX: B Follow-up Letter to Study Sample
July 28, 1995
Dear Colleague:
SUBJECT: YOUR ASSISTANCE WITH A QUALITY SURVEY PROJECT
Each day I rush to the mail box to see whether you have completed and returned the Survey of Quality Improvement Training Programs which was mailed to you several months ago. So far, I have not heard from you, but I still need your HELP!
As a University of North Texas doctoral candidate, as well as an ardent advocate for quality principles, I am conducting a dissertation study to determine the perceptions of administrators and/or quality coordinators as to which methods of training are effective in implementing Continuous Quality Improvement (CQI) processes at higher education institutions across the United States. Your response to the questionnaire is critical to the success of this study.
Please take a few minutes of your valuable time to fill out the survey instrument today and return it in the enclosed stamped, addressed envelope. Any comments you may have concerning the items or other pertinent aspects of your experience with CQI are also invited. In appreciation for your assistance with this survey, I will be pleased to send you a summary report of the findings. Please be assured that the information vou provide is for research purposes only and will be held in strict confidence.
The ultimate benefits of this or any other survey depend on the thoughtful responses and willing participation from those who are asked to help. Your willingness to participate is important and extremely appreciated. Thank you.
Yours in quality!
Katherine Miller, Dean of Occupational Education Ph.D. Candidate, University of North Texas
Enclosures
Note: If you do not have the information requested, please forward this packet, as soon as possible, to the person at your institution who can best provide accurate and timely data.

APPENDIX C
VERBATIM COMMENTS FROM RESPONDENTS

190
APPENDIX: C VERBATIM COMMENTS
FROM 'YES' RESPONDENTS
NO. ITEM RESPONSES
001 (3) Executive Steering Council (6b) Self-evaluation as well as customer surveys. (10) Facilitator training
002 (3) Director of Human Resources
003 (3) Director of Quality (10) Effective meetings
004 (6b) Observation/Interview
005 (1) A limited number. We have a "continuous improvement core team," and are bringing others in slowly.
(3) The "core team" has a leader (part-time) drawn from the faculty. The president is also key.
(5a) Assessed by observation and project success. (17) Cross structure group. (AC) A small team was formed and trained. That group
now functions as the core of the effort and trains and guides other groups formed as needed.
006 (AC) In the middle of our quality program, the president retired and a new one was hired. This has delayed and changed the focus of our program.
007 (3) The President (12) Not yet (13) Not yet
008 (9) Whitley (12) Manager/Supervisor only (AC) I will mention that our initiator of quality improve-
ment, Mr. Robert Saltonstall, Director of Physical Plant, was cordially helpful in completing this questionnaire. Our phone: (203) 685-3400
009 (3) The Quality Council (22 members) (7a) The Quality Council (10) These six areas have been included in the
training of our Quality Council. We have not yet started to work with improvement teams.
(11) Don't know yet. (12) The performance of top management will include
an evaluation of their efforts to improve quality. (13) For top management. Only at this point. (14) We expect to use all our employees as we expand. (16) Not yet.

191
009 (Cont'd.) (AC) A twenty-two member Quality Council has been appointed.
010 (3) VP Graduate School & Research 011 (3) Director of Quality Programs. (Presently vacant.)
012 (13) Not yet—in the planning stages. (AC) It must be evolutionary, using in-house
champions who are in power positions but, clearly have the administrative support.
014 (3) Executive Director CQI. (10) Facilitator training, focus group training, root
cause analysis, and other tools training. (17) Too early for anything extensive. (AC) Involvement of faculty in design and instruction.
015 (7) Not much. (AC) Just started quality improvement efforts at the
college.
016 (3) Human Resources Manager (6) Observation of employee team performance
by management. (9) Xerox model (17) Cross section of staff within unit. (AC) Unit is a 170 person department/school size.
017 (3) An Excellence Council (AC) Council members were initially trained and
then became facilitators for department.
018 (3) Registrar/Assistant Dean, Assistant to the President for Quality Leadership
(6) Evaluation—surveys (13) In process.
019 (18) N/A (AC) I regret that many folks here use the terms but
really do not understand and practice the concepts.
020 (1) But only those at Stone Hospital, and in the enrollments division.
(3) Yes, full-time in hospital No, University-wide Associate, VP, Enrollments is responsible in Enrollments Division.
(6) Through homework assigned during training, through monitoring groups, through individual performance appraisals, through staff meetings.
(7) "I can't answer for the hospital." Everyone in Enrollments Division. Only a handful staff outside of the division.
(8a) Not formally. (8c) Informal assessment, just within division.
Have been some savings results. (10) In facilitator training, not general training.

192
020(Contd.) (12) But all employees must attend. (14) Now—used consultant initially. (15) External, when we used it. (17a) The groups within the Administrative unit. (19) In our division. (21) l n our division. Can't speak for the hospital.
u ^ ' (4) Previously external vendor, now changing to in-house.
(8c) Very early, hard to assess. (9) None specifically for the most part. (12) Union implications. (15) Don't know yet. (16) Planned. (21) Salaries included.
022 (6) Questions on a baseline survey with plans to have informal campus visits.
(12) The HR person does not see the connection for success.
(13) That is a part that needs to be further developed.
023 (7) Estimates. (12) As determined by supervisor.
(13) As determined by supervisor.
0 2 4 (3) Quality Steering Committee.
025 (15) Depends on the individuals. (AC) We did a pilot program. There is no upper
management support to continue even though the initial results were good for 3 of the 4 teams.
026 (6a) Not formally. (6b) Incremental learning has occurred. (12) Support staff. (19) Initially, 100 percent. (AC) We now support a variety of just-in-time training all
of which is customer and process focused and which relates to skill areas of staff, i.e., is collaborative learning, CAT's for faculty, Covey's 7 habits for staff, extensive computer training for all, and administrative quality awareness program.
027 (6b) Self-report survey (7) All faculty and staff were invited to attend orientation
sessions on our quality initiatives. About 90% participated.
(8c) Not sure. (9) A blend of the above, plus others especially our
university's emphasis on communities. (12) Wish it was. (13) Ditto. (17) Cross-unit. (19) All are invited. (AC) See envelope with history attached.

193
028 (3) Dean of Business and Technical Education. (AC) Our program is a partnership with the local
chamber, local business leaders, educators and government employees also train in our programs.
029 (4) I answered according to what I do in the Industrial Management Program. These answers do not apply to the college as a whole.
(8) Industrial Management Program (9) Taiichi, Ohno, Shigeo, Shingo (10) Again, this response is Industrial Management
program specific. (AC) The philosophy of the Board and President is
such that TQM will not occur on our campus in the foreseeable future.
031 (3) The President's Executive Council. (6b) Peer Supervisor internal customer survey (9) Goetsch/Davis which combines all of these. (10) Strategic planning. (17) We used all of these at one of our campuses.
032 (3) Director (8c) "Pockets of excellence" (9) Goal/QPC, tools, problem planning, Joel
Barker, Paradigm Shifts, Future Search Process. (10) Organizational Change, Rewards and
Recognition (being developed), Creativity and Breakthrough Thinking, Communication Styles.
(12) Needs to be. (13) Should be. (16) Supporting role (17) Staff—self—scheduled (AC) Possibly instead of training general, self-selected
employees. We are finding that training entire divisions or departments at one time works well (Key concept!) with the support of the director. Teams are begun on the spot and organizational routines are confronted. There is employee buy in and tools are just not taught but utilized during the session.
033 (6) Survey of past attendees at training sessions. (10) Planning and Management team training. (13) We are in process of revising our employee
performance evaluation processes. (17) Mixtures of units. (18) To date (AC) We have tried to let units "self-select" for training.
This assumes that training goes first to those most interested in receiving it—and, in my view, most likely to put it to good use.
034 (6) Added interest, better customer focus. (8a) Informally. (8c) Level of concern.

194
034 (Cont'd.) (13) Working its way into our strategic plan. (14) Almost ail. (17) Accreditation Committees. (AC) We continue to develop very active external
programs, training, and assistance to others, and a modest internal program that is not moving fast enough.
035 (3) Director for Continuous Improvement (6b) Monthly reports. (7b) 100% for Business and Financial divisions only. (9) Kano, Heidbreder (10) Statistical techniques—Basic, S.I.P.O.C.
Functional Mapping, Benchmarking (12) Depends on who. (13) Depends on who. (20) All.
036 (1) It believes it is. (3) No one designated. (8c) Cost of Quality—Not even understood
Waste—Not measured (10) All are taught in my class (actively learned) but
this university does not practice/understand CQI/TQM—this applies to faculty, staff and especially administration.
(17a) Are you kidding? (AC) Don't know where you got the Dean's name on
what list but trust me, this institution does not really train its employees in TQM. Lowest level support people are shown Barker's video, sleep through lectures and do some role playing on "how to smile when you say no we're not meeting your needs."
038 (3) No single individual responsible. (AC) Training has been provided only for employees
participating in process improvement teams, and for their supervisors. A training session was also provided for executive leadership.
039 (3) Various
040 (8c) Other—Morale. (13) Not formally. (17b) Sampling of several. (19a) Non-faculty. (AC) Using the term "skills" as in #5b there is a
great deal of faculty that do not relate to "skills", general, e.g. awareness, understanding, attitude, etc.
042 (3b) VP for Quality and Professional Development (6a) Not currently, but have in past. (13) Do not have performance reviews.

195
043 (6b) Surveys (written), small group dialogue, observation, staff/faculty meetings.
(8a) Other—Attitude (9) Too many sources to name, the above are
significant, Deming and Senge used heavily. (10) Others—Systems thinking. (12) We do not do performance reviews. Deming's
7 deadly diseases. (17b) Other—Admissions Office. (AC) The Center for Quality (Primarily Responsible
for Training) is self supporting via training of external customers. We do not pass the cost of CQI training on to the students.
045 (3) Dean College of Applied Science and Technology (6b) Data collected from process improvement activities. (11) Of those involved. (AC) I am not sure these are the right questions or that
they address your problem statement: "perceptions etc." The questions do not reflect nor accommodate the diversity or approaches being used in higher ed nor the differences between 2 year and 4 year institutions with different cultures.
046 (9) Fox Valley Community College Model
047 (3) At each campus. (19) All that attended were selected. (AC) We are taking a "systems" approach by trying to
identify, map, and define our major system on each campus, each sub-system, and each process.
048 (3) Assistant Director B.T.G. Training. (5a) Currently conducting a Baldrige-type assessment. (8) In progress. (From early results). (AC) We are currently doing a fairly extensive self-
assessment using the new "education" Baldrige Criteria. We are fortunate to have Linda James (former member of Baldrige team at NIST) and Donald C. Fisher (author of Baldrige books) to lead this assessment. No final results available.
049 (3) Assistant Vice President, Information Technology, Quality Coordinator
(9) Covey (17a) We are the pilot. (17b) Information technology. (AC) Our Quality program does not fit some of your
questions. I'd be happy to explain our program to you if you want more information.
050 (3) Faculty/Staff development committee (6b) Increased involvement of faculty, staff, and
administration in ongoing operations of the college. (13) Working toward this being true across the board.

196
050 (AC) As for special characteristics regarding the way in which our institution's quality improvement training program was implemented, I would say that there were many folks involved, all of whom represent a broad spectrum of our college community. They included faculty, staff, administration and students.
051 (2) Depends—different areas have started at different times. <1 year: Colleges in partnership with Ford Motor Co.; 2-3 years: Administrative Support areas; 3-4 years: OSU Medical Center.
(3) Coordination is de-centralized. (4) Evaluate individual workshops that are currently
offered (each area doing training does their own evaluations). My estimate of average ratings across programs.
(9) Have adopted the materials used by Xerox which is actually a hybrid of the above.
(13) This is the plan for the new performance management system being developed, not currently being done.
(16) Again, there is no one training program. Some units involve managers, some don't.
(AC) It was hard to address the majority of the questions because of the decentralized way in which quality is being implanted at OSU The areas that are the most active includes : Human Resources and Business and Administrative (two academic support units), the Medical Center, and the four colleges partnered with Ford: Medicine, Business, Engineering, and Agriculture.
054 (8a) In process (AC) We have some champions in the Administrative and
Staff areas. We started with cross-functional teams which had charges that were too broad. We are pushing work on a natural work place level which will have more positive outcomes, but takes more energy and time to achieve our objectives.
055 (3) Director of Planning and Evaluation
056 (3) Director Training and Professional Development. (6) Too early in training (12) Not currently (13) Not currently
057 (1) Top management, just beginning the process for all employees.
(3) Director—Planning and Development (4) One faculty session was very positive. (7a) Intro (7b,c) Beginning (9) Pull from many sources to develop our process. (14) All own employees—for the current process
All External Consultants—for the beginning process.

197
057 (Cont'd.) (15) Too early to tell. (16) All employees can participate as facilitators—will not
limit instructors to administrators. (19) No for all employees, yes for top administrators. (AC) Employees are skeptical of just promoting quality
improvement—they heard more than they have seen results. We are now developing our strategic planning process using principles and tools of continuous improvement.
058 (6b) Survey of the college divisions.
059 (17b) Cross Functional
060 (AC) I refer to it as "quality on a shoestring"
061 (9) Spanbauer (12) Not yet. (13) Not yet
062 (3) Dean of Warton Campus (8c) We have had a change of leadership at the top
which affects the director of the Quality functions. (15) Need both
063 (3) Assistant to the President—Organizational Development
(6b) Use of data in decision making, project team studies, team work—effective meetings, evaluations.
(8a) Not formally—survey in progress (9) Classroom Quality: Cross, Angelo, Howard
Gardner, Cornesky, David Lazar (12) Class (faculty component) 12 hours mandatory
1995-96. Awareness and Process improvement training (16 hours) is mandatory.
(13) Some managers holding staff accountable. (17a) Yes—in process improvement teams and
tools with three teams No—in Awareness training (8 hours)
(17b) Yes, in faculty class CQI program.
064 (3) Quality Steering Team
(7) Information not available
065 (3) Senior Management Team, Quality Steering Team
066 (3) Director of Industrial Effectiveness 067 (3) Not yet.
(9) Incorporated using Language of Commission on College's Info on Institutional Effectiveness.
068 (9) We use Total Quality Transformation from PQ Systems, Dayton,Ohio

198
069 (3) As part of other duties (6b) Informal assessment; reports by staff about uses in
meetings etc. Some volunteer teams use tools and skills. Skills incorporated very well in some areas, less well in others.
(12) Professional development (which includes Ql training) is considered in performance review.
(17) First team (and just-in-time training) served as model for others—Improvements were made for subsequent teams.
(AC) Training is "just in time", we have had six cross functional teams work on requisition code time, administrative processes, textbook acquisition and sales; part-time employment contracting, new student orientation and student access to college programs and services. They are completing work now with regional accreditation self-study in progress 94-96; new teams have not started. Will be glad to share details on team results. We at SCC have worked to integrate continuous quality improvement, institutional effectiveness and strategic planning with some success. We are making a strong effort for quality to be the why we do everything, not just another item in our "to do" list.
070 (4-6) The first training is in progress and an evaluation has not yet been performed.
(9) Mixture of all (17) This is the pilot. (AC) We have just started our quality improvement. I am
the primary instructor and am using many community groups as well. I have been teaching quality improvement to the community for three years and am very happy my own institution has finally started the process.
071 (3) Various VPs have indicated and supported efforts from time to time.
(AC) We did an overall introduction to TQM with the faculty on a retreat, them trained and implanted some flow-charting and processes improvement efforts with staff involved in student services, financial aid, registration, class startup etc. which have provided improvements. The effort in this form is limited to our non-traditional program.
072 (AC) Great initial interest—no on-going training or follow-up. Not enough emphasis or rhetoric about changing culture (work environment). Results of assessment by administration either doesn't exist or are not public. Skepticism of CQI in lower ranks.
073 (6b) Question incorporated into the evaluation. (13) If applicable specific behavioral change regarded as
necessary for effective performance.

199
074 (3) CCIC (Continual Campus Improvement Coordinator)
(6b) Training programs, alumni sessions, (change discussions)
(19) All employees take a 45-hour Deming course. (AC) Students are also in the classes—all levels of
employees, from custodial to secretaries, to faculty, to administrators are mixed in 20 student classes. Won IBM national quality grant ($1m).
077 (9) Training is just six months old. (17) Cross-section (AC) - Training models developed in-house.
- 99% of participants would recommend to others. - Training occurs monthly, started October 1994 - Participating units are charged for courses. - Courses are improved based on participant
feedback. - Training targeted for staff, not faculty.
078 (3) N/A
079 (6) Direct observation (AC) Problems with resistance from deans and chairs;
resistance from faculty. Low commitment to resources. Low probability of success.
080 (12) We are currently in the process of adding it.
081 (9) Motorola (AC) We are in the early stages of developing customer
awareness in a state-financed educational institution.
083 (3) Co-chairs of steering Committee. (9) Partnership with Alcoa
084 (3) Every administrator. (9) Gardner (17b) Combination of above. (19) Not finished yet (AC) Our customer training is the only training with quality
in its name. Our quality effort is called "revitalization".
085 (1) Training is not "formally" quality improvement. (3) President (6b) More responsibility assumed, fact-based decision
making. (AC) As CEO I have introduced quality concepts not as
"quality" per se but as ways to improve efficiency and effectiveness. I have insisted on a "customer focus" and have initiated satisfaction surveys.
086 (6b) Benchmark employee satisfaction (9) Survey as benchmark (12) Depends on evaluator and division.

200
086 (Cont'd.) (13) See #12 (AC) Decentralized to VP/Provost level. Provost not
participating. This is the most significant factor for mixed outcomes today. Quality Coordinator in Administrative Services VP area.
087 (6b) Use and performance (10) Facilitator training
088 (3) Director, Core
089 (3) Assistant to VP for Business Affairs (6b) Employees are finding the various tools helpful in
their everyday activities and are reporting which of them they are using most often.
(10) Facilitator and team sponsor training (17b) Postal Services (19) Still in process (AC) NAU's training program started slowly and has been
building over the last two years. No one is required to participate but interest continues to grow and more and more teams are being formed across campus as results of other teams become apparent.
090 (3) Director, Staff Development (5b) One done, follow up to come. (6a) Informally and anecdotally. (6b) Observation of behavior. (10) [Customer Service] Newest—not operational (AC) See attachment. It was difficult to respond to some
questions because while the statement said "we did this thing" it did not allow for degree or score of response.
091 (3) VP Instruction (6b) Training provided only to those on teams.
092 (6b) Attitude assessment interview (12) Level and union unit # (13) Same as #12 (AC) - Union environment
- State School - Many local system constraints - High percentage of tenured faculty
(and staff) 90%+
093 (17b) Community services (AC) 1) President stated commitment to quality.
2) I conducted a series of 10, two-hour seminars to initiate awareness on campus.
3) Preliminary team formed to attend TQM conference/training in the fall.
4) Plans to develop an executive steering committee after conference/training.
093 5)Great need for training. Knowledge and understanding very low on campus.

201
094 (AC) This has been a "bottom up" effort, and we seem to be at a standstill after some initial enthusiasm. Not enough leadership in quality practices by top administrators and managers. Faculty seems to hate TQM. Many staff managers working with faculty are reluctant to enforce change.
097 (1) Only in certain areas though. (7d,e) Of our division (19) Some is (AC) I answered specific to our division Financial
Management, as the whole university is not doing this.
098 (4) Some components (7a) Was 100%, recent turnover lowered it to 60%. (10) So far as marked (12) Soon will be (21) Last year and coming year for each.
099 (3) Shared responsibility (8a) Ad hoc basis (12) Can be included. (13) Case by case basis depending on supervisor. (17b) Across the board. (AC) We conducted two pilot projects to assess viability
of doing quality on campus. We have done a variety of training on a voluntary basis which was well received. Now we do require quality orientation programs for all new employees.
100 (3) Quality Coordinator (8c) Amount of time. Number was reduced. (13) Varies with supervisor.
101 (1) Just starting with consultant.
(9) But have some information from most above — use information designed by consultant
(10) We are 3/4 of the way through program with managers. Will add other section over the next few months.
(11 c,d) Unknown at this time. (12) At this time, will be in the future. (14) To date, managers will implement once trained. (16) Will be in future. (19) Not yet.
102 (9) Project teams (AC) Our quality efforts have been pretty loosely defined.
We have used project teams to "re-engineer" specific processes.
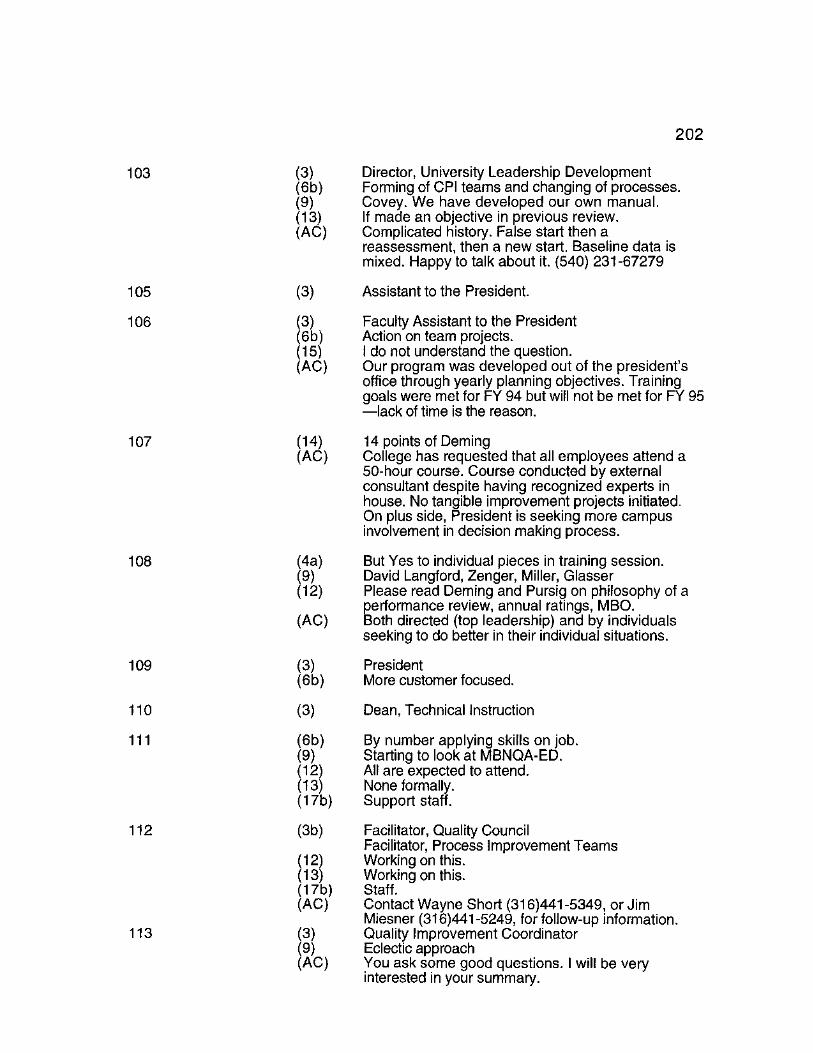
202
103 (3) Director, University Leadership Development (6b) Forming of CPI teams and changing of processes. (9) Covey. We have developed our own manual. (13) If made an objective in previous review. (AC) Complicated history. False start then a
reassessment, then a new start. Baseline data is mixed. Happy to talk about it. (540) 231 -67279
105 (3) Assistant to the President.
106 (3) Faculty Assistant to the President (6b) Action on team projects. (15) I do not understand the question. (AC) Our program was developed out of the president's
office through yearly planning objectives. Training goals were met for FY 94 but will not be met for FY 95 —lack of time is the reason.
107 (14) 14 points of Deming (AC) College has requested that all employees attend a
50-hour course. Course conducted by external consultant despite having recognized experts in house. No tangible improvement projects initiated. On plus side, President is seeking more campus involvement in decision making process.
108 (4a) But Yes to individual pieces in training session. (9) David Langford, Zenger, Miller, Glasser (12) Please read Deming and Pursig on philosophy of a
performance review, annual ratings, MBO. (AC) Both directed (top leadership) and by individuals
seeking to do better in their individual situations.
109 (3) President
(6b) More customer focused.
110 (3) Dean, Technical Instruction
111 (6b) By number applying skills on job. (9) Starting to look at MBNQA-ED. (12) All are expected to attend. (13) None formally. (17b) Support staff.
112 (3b) Facilitator, Quality Council Facilitator, Process Improvement Teams
(12) Working on this. (13) Working on this. (17b) Staff. (AC) Contact Wayne Short (316)441 -5349, or Jim
Miesner (316)441-5249, for follow-up information. 113 (3) Quality Improvement Coordinator
(9) Eclectic approach (AC) You ask some good questions. I will be very
interested in your summary.

203
114 (2) Not yet implemented. (13) Only as improved teaching or service results. (17a) This is our pilot. (19) All volunteers, 12 of 24 eligible. (AC) Improvements in the way meetings are conducted
have been noted.
117 (1) But see note under comments. (3) Dean, College of Engineering. (19) Not yet. (AC) We are just starting a quality management training
series from Eastman Chemical. This has been on hold a few months due to possible mergers of other programs into the college and possible resultant new key players. The other efforts are low key until we restart our major effort.
118 (3) Director—Total Quality Initiatives (9) All are used in varying degrees. (19) Is available via voluntary participation. (AC) Slow process, making progress. Have Quality
Council in place, Revamping "vision" statement. Also, have had process action teams in place—doing some good work
119 (6b) More custom oriented toward students.
120 (3) Director of Staff, Program Organization, and Development.
(6b) Asking about needs of internal customers. Defining process and using tools.
(17b) Computer Services. (AC) Partnerships with local industry has helped us in our
training.
121 (3) Margot Hirsch, and college presidents. (4) Varies. (5a) Many training programs. (5b) In some cases. (6b) Varies by college. (8a) Many varied programs. (8c) At District Office. (9) Eclectic—from almost all of them. (15) External, varies. (AC) Survey is exceptionally well done. I wish all surveys
we receive were this professional.
122 (15) In-house team is also an experienced consultant.
123 (3) Next year responsibility to be handled by a team. (7a) Don't know, not my job. (8a) In process. (8c) Cost of Quality—In Process. (10) Dean charts/conducts. Coaches training
CQI/Assessment in the classroom. (12) The entire program is voluntary.

204
123 (Cont'd.) (13) We have placed strong emphasis on the natural workplace team.
(AC) See attached information.
125 (3) VP, Industrial Advancement.
126 (3) VP, Spiritual Life. (AC) We are in our third year, much to be done. Our
coordinator died last month—will take time to re-start. Will take 5-9 years to fully implement beliefs—good luck!
127 (3) Assistant Vice President, CQI (9) Covey
128 (3) Staff training
129 (9) Glasser, mostly combination of about and others. (16) We don't have supervisors. (AC) We have recently formed a Continuous Improvement
Council to formalize our training program.
130 (3) Mine—Asst. Provost for Continuous Improvement
131 (3) Deming Project Initiatives (group of faculty and staff) (6b) Survey (8b) Registration (8c) Customer Sales (12) Dean required it for chairs in arts and sciences; Dean
of Engineering uses TQM (required by grant), Dean of Business Management is involved.
(15) Reach different groups (16) Depends (AC) The top administrative support gives small
grants to support teaching. The Deming Project is the main driver. Our units of faculty and staff. The new head of Language Dept. is a Deming convert. As is the Dean of Bus. Office. Applied the methodology to Math Dept. while I was chair 1989-92. Some of those initiatives remain (rather than dysfunctional dept. with 20 -30 years old schisms between people.)
132 (9) Institutional Effectiveness—SACS (AC) At TSTC-Harlingen TQM is accomplished through
the Institutional Effectiveness initiative.
133 (1) Some (2) Formally (3) Also one-half time Staff Development Director (10) Personality Inventory Meeting Skills (17b) University Affairs, Development, Graduate School,
Registrar's Office, Police Personnel 134 (7) By us? I assume you mean by SWT trainers.
The numbers you see here will be peoples guesses. I doubt they are meaningful as real percentages, just as perceptions.

205
134 (Cont'd.) (7a) Who knows. (10) Introduction to Quality, Reasoning Styles. (10b) These vary. (15) Whose? Ours? In general? (16) Unclear what you mean. (18) You probably mean something specific here, but
most people won't catch the distinction. (19) All people who attend voluntarily. We had 400+
trained.
135 (6b) Performance evaluations
136 (3) Associate Provost
137 (7) >0 but less than 10 for each group. (9) 1. Joiner
2. 7 basic tools 3. Brassard 7 planning and management tools.
(AC) Currently, formal training is outsourced and was provided by the UW System Quality Consultant. A consortium of education and government persons developed the Academy, which has assumed the training formerly provided by the Quality Consultant for the UW system.
138 (13) Depends on SP target area.
139 (3) Business and Management Professor
140 (7) Don't know. (13) Varies by department. (AC) Our philosophy is that adults learn in a variety of
ways, only one of which is through "training". The trust of our efforts is to learn through actively applying the concepts, guided by facilitators. The idea of training is integrated into the implementation process.
141 (1) Not active at this time. Under new leadership at college.
(3) I was the intended Quality Coordinator. (Use to be the 25% of time, but now services are contracted out through our Center for Business and Industry.
(AC) Our internal continuous improvement team (CIT) is now reorganizing and will be made up of all faculty, with our CEO (President) Dr. Robert Ernst as leader. I will continue to represent our president in a trainer and coordinator capacity. The 1994-95 school year has been a limbo year as far as training.
142 (3) Have had a part-time coordinator the last two years. Waiting for new Quality Improvement Coordinator
(8a) Focus Groups. (17b) Administrative Services

206
142 (Cont'd.) (AC) We did a lot of training the first two years. I am not anticipating a lot of additional training over the next few years. It is administration's hope that the principles and tools are being incorporated in the way we work.
143 (3) Director of Organizational Development (6b) Self disclosure. (10) Others are in the queue for next year. (12) Proposed for next year.
144 (9) Proctor and Gamble/Florida Power & Light
145 (6b) Annual reports/evaluations, self-assessment descriptions
(13) Optional of employees initiative/request.
146 (3) Individual Faculty member (4) Note: Those being trained are undergraduate
students. (6b) Performance Data Collection, PDSA cycle of
performance improvement. (8c) Student Outcomes (9) Quality Function Deployment (10) PDSA cycle of improvement (13) For students, yes (19) For students, yes (AC) My classes are the focus of research and
design conducted by a virtually integrated league of students, faculty, industry employees, industry practitioners and ind., final customers. Our results are transformed into improved education, process content and technology. These are shared nationally throughout our discipline and our industry.
147 (3) Coordinated efforts mainly by the Dean of College of Business and VP for students.
(AC) We have several small efforts in different divisions of the University. I feel a larger coordinated effort would gain significantly more benefit, but we need a high level champion.
148 (16) Now—1, Planned—8
149 (3) Senior VP, Administration (5a) Scheduled for Jung (6b) We are doing pilot projects with case studies as
evaluation methods. (7) Since we are using the approach of pilot projects, no
desire for institution wide training. (8a) Will have first formal review in June workshop. (8c) Cost of Quality depends on area (9) We have used the Arthur Andersen Corp. for
consultants and their quality framework. (11) Varies widely based on exposure to program. (12) If in one of the pilot project divisions.

207
149 (Cont'd.) (13) See #12 (19) When in their division 100% staged in workplace as
a team. (20) In the sense that in pilot (e.g., Bursar's Office) it is
happening to coordinate with change efforts. (AC) Our approach was to establish one pilot
project two years ago; expand to four this year. Goal was to work intensively with entire staff of pilot rather than to have an institution-wide training. In that sense this survey is difficult to respond to for any but affected areas.
150 (3) Director, Human Resources and Quality Improvement
(15) Equal.
151 (9) Team Handbook for Educators (18) Feedback after each session; participation in agenda
setting.
152 (3) It is not an institution wide program. It is among eight administrative units (250 staff)
(12) We don't really have formal performance reviews. (13) See #12 (14) Moving from external consultants to employees
and consultants. (15) No basis for judgement yet (17) We are the pilot (AC) We are just finishing a two-year training process that
involved eight administrative offices. We followed a Deming model led by an outside consultant, first learning and practicing Quality in daily work and then cross-functional action teams. We are now trying to institutionalize, analyze, and expand the process.
153 (9) Kahn, Acoff
155 (3) Assistant to the President (9) Peter Black, the Holy Bible (13) Just beginning to expect this.
156 (1) Within my department only—100 staff (8c) Too soon to tell. (9) USDoL Enterprise Council and Pioneer initiative. (13) Yet to be determined. (AC) We are part of the University Community Service
Division and are responsible for the JTPA Service and a Business Assistance Center. Response applies only to our programs, not the entire University.
157 (3) Dr. Carolyn Woo, Associate Executive (9) Motorola

208
158 (9) Covey (10) Systems thinking, visioning (17b) Cross-functional
159 (3) Administrative Division Heads (6b) Survey, Customer Focus (12) Performance review not tied to salary (AC) We initially attempted broad awareness
training—learning curves varied quite a bit so we've varied approach. Good luck.
160 (3) Executive Vice President
161 (3) Vice President, Finance and Administration (6b) Informal but people are applying process redesign
concepts to selected university projects.
162 (3) Director of Human Resources. (4) New program, some staff development over past
three years. (Not structured at this point). (7a) Some limited at professional Assoc. Meetings (7g) Will be trained this summer.
163 (2) Varies by unit/area
164 (6b) Self, peer, and supervisor's perceptions—performance standards.
(17b) Computing Services and Health Center Academy, Advising Admissions, Financial Aid.
165 (9) Joel Barker on Paradigms; Meg Wheatley on Chaos. (17) Support staff
166 (3) Business Division Chair
168 (3) Quality Manager (13) Being used more as a tool to drive improvement by
management. (AC) Iowa state is partnering with Texas Instruments.
- Tl has provided significant training resources to ISU.
- Co-develop and Co-deliver courses - Cooperative outreach Your persistence has paid off! Sorry for such slow response.
169 (3) College Development
170 (3) Quality Coordinator
171 (6b) We publish application examples (AC) We have various types of customized training for
faculty, staff and administrator in addition to a 36-hour 2 credit course that began in 1988.

209
172 (3) Total Quality Leadership Team (6b) Climate Surveys, Customer Satisfaction Surveys,
audits. (8c) Number of Meetings (14) With occasional outsiders
173 (3) All employees (8c) Perception (9) Crosby—originally (17b) Administration, Faculty, and Staff Union Leaders
174 (3) Connie Q.C. (6b) Culture Survey 1991 and 1994 (12) That's part of the problem faculty won't leave
classroom to attend training. (AC) Voluntary training is not working with faculty.
175 (3) Director of Student Services (8c) Cost of Quality—didn't know how you mean the
term, may have answered backwards.
176 (3) TQ Specialist, Just started 5 weeks ago, replacing the previous coordinator.
(4) Have not yet evaluated the entire program, only each class.
(5a) I have not (11a,c) Don't know (12) Don't know (13) Don't know (16) Working on developing this. (AC) Redesign of quality training program is now in
process. Last two years efforts focused on background and introduction. Redesign of courses will focus on partial application of using concepts, tools, and techniques on the job. Want to get rid of the "TQ" moniker and make this job "the way" we do our jobs—a regular part of our daily efforts.
177 (2) Although many of the things we did previously were very similar.
(3) Quality is everyone's responsibility. The Dean holds department heads responsible.
(4) 2-day faculty workshops on applying TQ concepts to education.
(6b) Current programs for unit self-assessment and institutional inventories and surveys are providing baseline data concerning academic practice and faculty attitudes.
(8a) On-going organizational climate survey has been used for last 8 years.
(8b) Gradual improvement over last 5 years. (10) Varied across functions, programs and departments. (13) Teaching portfolios are widely used. (15) Educational programs consultants such as Peter
Ewell, Jim Nichols, Cyndi Lynch have been very helpful but didn't provide quality training per se.

210
177 (Cont'd.) (17b) Education is our most important process, that's where we started.
(19) USAF policy (AC) We've worked to integrate quality improvement
perceptive and techniques into our normal way of doing things. This survey seems to assume quality is understood as a separate and distinct program. My guess is that this is one of the reasons quality initiatives are encountering so much resistance.
178 (3) Coordinator of Organizational Learning (6b) Viewing use; by personal discussion (9) Margaret Wheatley (10) Have not done "formal" training for a couple of years.
Will do again in 1995. (AC) Initially extensive campus-wide training. Now
people are integrated through their specific teams. Currently, setting up an in-house facilitator training for fall.
179 (3) Project Director II (5b) In process, too; use after each on-going training. (6b) Self-assessment, Supervisor assessment. (7) TQM is only in the Division of Administration and
Finance. (7g) Optional (12) In our division training is mandatory for all FTE. (13) Not specifically, but it's assumed staff are using this
skills. (14) Mostly our own for staff and outside consultants for
upper administration in our division. (16) Our trainers are mostly supervisors. (17b) Maintenance is in division of administration and
finance. (18) Assess every 2 years. (19) All FTE in our division
180 (8c) We are still working on these. (9) Covey Training. (14) With a few consultants. (AC) Before MPTC started our Quality program, everyone
was well advised of it; and our people who were going to do the training were well trained prior to conducting any Quality Courses.
181 (6b) Culture study, employee evaluation, customer feedback.
(9) Covey (12) Still being developed
182 (12) In different years (13) Depends on year
183 (AC) Wish our institution was doing more to train staff and had some plan to implement and measure its effectiveness.
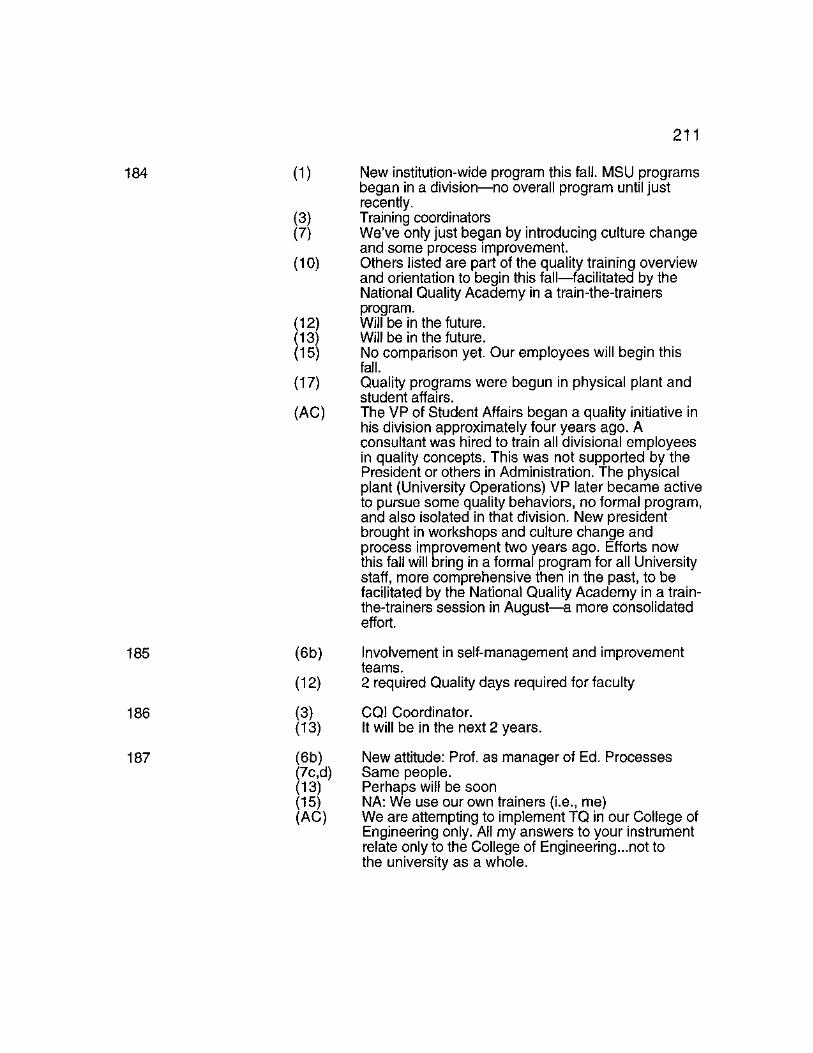
211
184 (1) New institution-wide program this fall. MSU programs began in a division—no overall program until just recently.
(3) Training coordinators (7) We've only just began by introducing culture change
and some process improvement. (10) Others listed are part of the quality training overview
and orientation to begin this fall—facilitated by the National Quality Academy in a train-the-trainers program.
(12) Will be in the future. (13) Will be in the future. (15) No comparison yet. Our employees will begin this
fall. (17) Quality programs were begun in physical plant and
student affairs. (AC) The VP of Student Affairs began a quality initiative in
his division approximately four years ago. A consultant was hired to train all divisional employees in quality concepts. This was not supported by the President or others in Administration. The physical plant (University Operations) VP later became active to pursue some quality behaviors, no formal program, and also isolated in that division. New president brought in workshops and culture change and process improvement two years ago. Efforts now this fall will bring in a formal program for all University staff, more comprehensive then in the past, to be facilitated by the National Quality Academy in a train-the-trainers session in August—a more consolidated effort.
185 (6b) Involvement in self-management and improvement teams.
(12) 2 required Quality days required for faculty
186 (3) CQI Coordinator. (13) It will be in the next 2 years.
187 (6b) New attitude: Prof, as manager of Ed. Processes (7c,d) Same people. (13) Perhaps will be soon (15) NA: We use our own trainers (i.e., me) (AC) We are attempting to implement TQ in our College of
Engineering only. All my answers to your instrument relate only to the College of Engineering...not to the university as a whole.
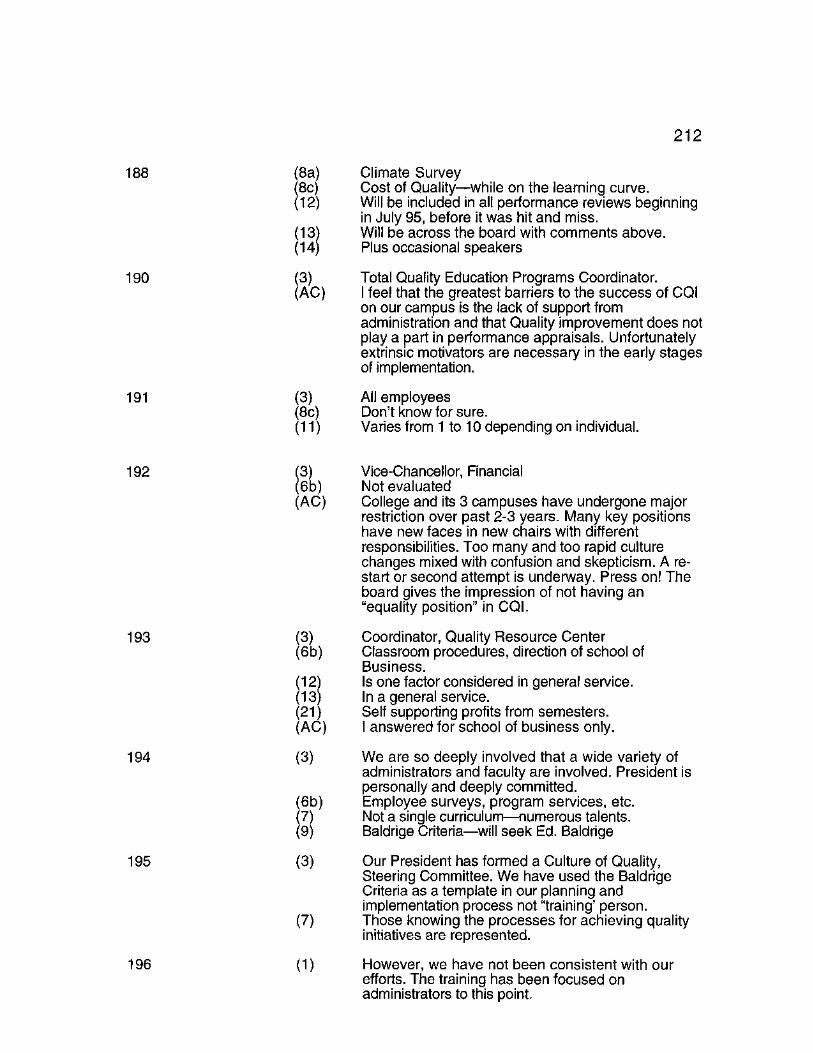
212
188 (8a) Climate Survey (8c) Cost of Quality—while on the learning curve. (12) Will be included in all performance reviews beginning
in July 95, before it was hit and miss. (13) Will be across the board with comments above. (14) Plus occasional speakers
190 (3) Total Quality Education Programs Coordinator. (AC) I feel that the greatest barriers to the success of CQI
on our campus is the lack of support from administration and that Quality improvement does not play a part in performance appraisals. Unfortunately extrinsic motivators are necessary in the early stages of implementation.
191 (3) All employees (8c) Don't know for sure. (11) Varies from 1 to 10 depending on individual.
192 (3) Vice-Chancellor, Financial (6b) Not evaluated (AC) College and its 3 campuses have undergone major
restriction over past 2-3 years. Many key positions have new faces in new chairs with different responsibilities. Too many and too rapid culture changes mixed with confusion and skepticism. A re-start or second attempt is underway. Press on! The board gives the impression of not having an "equality position" in CQI.
193 (3) Coordinator, Quality Resource Center (6b) Classroom procedures, direction of school of
Business. (12) Is one factor considered in general service. (13) In a general service. (21) Self supporting profits from semesters. (AC) I answered for school of business only.
194 (3) We are so deeply involved that a wide variety of administrators and faculty are involved. President is personally and deeply committed.
(6b) Employee surveys, program services, etc. (7) Not a single curriculum—numerous talents. (9) Baldrige Criteria—will seek Ed. Baldrige
195 (3) Our President has formed a Culture of Quality, Steering Committee. We have used the Baldrige Criteria as a template in our planning and implementation process not "training' person.
(7) Those knowing the processes for achieving quality initiatives are represented.
196 (1) However, we have not been consistent with our efforts. The training has been focused on administrators to this point.

213
196 (Cont'd.) (12) Voluntary at this stage! (AC) We are in the very early stages of evaluation and
implementation—stops and starts have characterized our efforts to date!
197 (3) Director—Institutional Research and Planning (9) Covey—for individuals (10) Personal effectiveness (AC) We depend on our follow up workshops:
personal effectiveness, improving learning in the classroom, team work improvement, and leadership improvement.
198 (3) Quality Improvement Coordinator (AC) Quality initiatives have not been implemented
from top down—efforts have been focused on selected administrative areas and training has been offered only to those employees whose directors or managers have expressed interest and commitment to quality improvement.
199 (3) Vice Chancellor for Planning/Improvement (8c) This question is not clear. (AC) Only a small group of CIs have been trained—those
in student enrollment services. For this questionnaire there's a mixture of questions, some of which pertain to the entire university, others of which seemed best answered for the small group. I may have misunderstood which was which. It's the weakness of many questionnaires designed to assess local implementation efforts.
200 (3) AsstV. P. for Academic Affairs (6b) See attached baseline information. This information is
broader than just training, but training is incorporated into it.
(7) Approximately 5,000 of the 10,000 employees have received some training.
(9) Greenleaf, Covey (13) It is beginning to be.
201 (3) We have a CQI committee (4) We have used several training programs; there is no
single program. (5b) My responses represent a global assessment of
all the training efforts used. (8c) We have not specifically assessed these. (10) Benchmarking
203 (1) In certain non-academic areas. (2) Rough, we are still not going at it hard. (3) I have worked with some in Business and Financial
Service "side". (4) Certain small areas, like a study in Business
Administration Bldg. (8c) Waste; we have a lot (all colleges and universities
do). Many no value added activities.

214
203 (cont'd.) (9) Again we only do a part here or there, as a statistician I believe in Deming and Ishikawa.
(10) This answer depends upon which group you are talking to. For NIS students in Quality Management we use Advanced. Stat. Tech., for others (customers) we talk about Q culture.
(11 d) In certain areas (12) Depends on which area (this is a big University).
Not evaluating faculty. (14) However I believe in using internal people. Most
external consultants are a waste. (15) In certain (small no's) areas, we use this
after a few have gone to outside programs. (16) Again restricted number of areas. (17) We are doing this now in physical plant. (19) We could not get it in the college of liberal arts.
(Business college is "thinking" about it.) (20) Very infrequent. (AC) Obviously Iowa has not gone into this much. Maybe
a new president who believes will help. The Vice Pres. for Business and Financial Services id the highest ranking official that believes and that is why we have tried a little on that side. NOTE: Our president who is leaving July 1 does not believe and so it has been difficult to get anything serious going, a little on nonacademic side like Physical Plant.
204 (1) On an area-by-area basis (see attached history) (3) Administrative Services has a full time Quality
Coordinator—Director, Quality Support. (5b) We have a climate survey but are not tying attitude
change to training in particular. (7a) Unknown (8c) In Administrative Services only (9) Flowcharts, Measurement, Focus Groups 10) Consensus, false consensus, meeting management,
personality types, communication, stages of group development.
(AC) I have enclosed a short summary of our quality improvement efforts here at Weber. Since the effort is not a University initiative most of my comments are from my perspective as Quality Coordinator for the Administrative Services Division.
205 (3) Director (6b) Participation in the Quality Action Teams. (9) Self-developed by a former Coordinator of Quality. (17) 4 pilot Classrooms.
206 (12) For high level managers. (13) From now on. (15) We have our own TQM experts. (AC) U.M. is extremely advanced in implementing TQM in
certain academic areas.

215
207 (7) During active years of program. (16) When we had quality program. (20) When we had program. (AC) We had a quality program several years. When a
new president came 2 years ago this has not been continued. Please understand that our program is not active now.
208 (3) No release time. (AC) We have just started, and we do not have data on
much of what you are looking for.
210 (2) Employees. (3) As above.
211 (AC) We recognize there is much more to be accomplished. Our efforts have laid a good foundation. Nonetheless a continuing focus on quality improvement should result in additional benefits.
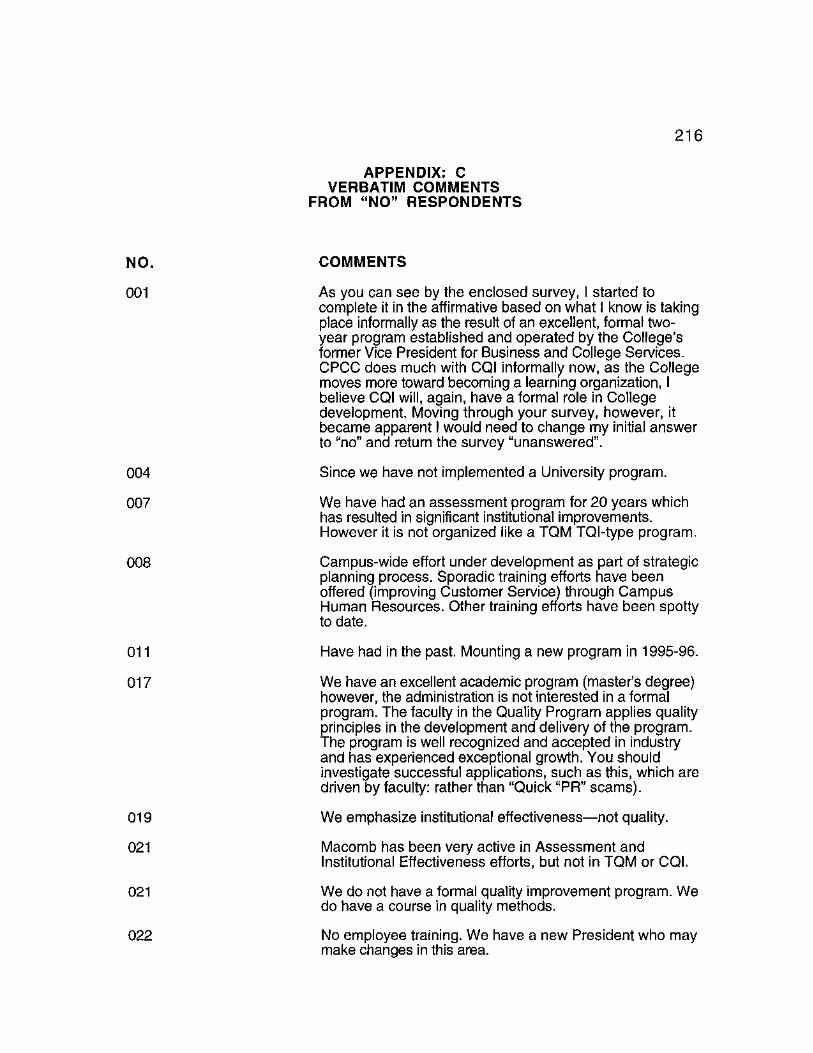
216
APPENDIX: C VERBATIM COMMENTS
FROM "NO" RESPONDENTS
NO. COMMENTS
001 As you can see by the enclosed survey, I started to complete it in the affirmative based on what I know is taking place informally as the result of an excellent, formal two-year program established and operated by the College's former Vice President for Business and College Services. CPCC does much with CQI informally now, as the College moves more toward becoming a learning organization, I believe CQI will, again, have a formal role in College development. Moving through your survey, however, it became apparent I would need to change my initial answer to "no" and return the survey "unanswered".
004 Since we have not implemented a University program.
007 We have had an assessment program for 20 years which has resulted in significant institutional improvements. However it is not organized like a TQM TQI-type program.
008 Campus-wide effort under development as part of strategic planning process. Sporadic training efforts have been offered (improving Customer Service) through Campus Human Resources. Other training efforts have been spotty to date.
011 Have had in the past. Mounting a new program in 1995-96.
017 We have an excellent academic program (master's degree) however, the administration is not interested in a formal program. The faculty in the Quality Program applies quality principles in the development and delivery of the program. The program is well recognized and accepted in industry and has experienced exceptional growth. You should investigate successful applications, such as this, which are driven by faculty: rather than "Quick "PR" scams).
019 We emphasize institutional effectiveness—not quality.
021 Macomb has been very active in Assessment and Institutional Effectiveness efforts, but not in TQM or CQI.
021 We do not have a formal quality improvement program. We do have a course in quality methods.
022 No employee training. We have a new President who may make changes in this area.

217
023 The college is currently defining its formal quality initiative. Much training has been done over the years, but nothing is designated a quality improvement process in a formal way. One of my job responsibilities is to assist the college with defining its quality initiative. We have just begun.
026 Budget cuts eliminated a formal CQI initiative before it had a
chance to have any meaningful impact.
031 Use TQM in classrooms. Students projects at a MBA level.
033 A few isolated efforts is the extent of it. We do teach the subject in Business and Engineering.
034 Individual departments have used quality improvement programs but we have no campus-wide effort.
039 We had a quality program several years. When a new president came two years ago this has not been continued.
042 We have no systematic program. We occasionally run classes.
046 No formal effort for the institution as a whole. A few individuals and units are doing their own thing to implement Ql.
049 Only in pockets—i.e. some units or subunits of the
university.
055 We are still in an exploratory stage of looking at Ql.
059 We do have a few areas within the university working with quality strategies, but no overall program.
064 We did in the past—trained people in the physical plant, the business school and the hospital. We are doing re-engineering now.
069 We have a strong two-year associate degree program in Quality Engineering Technology. The local industry is about 50-50 manufacturing: service.
074 New president in August 1993, ended TQM initiatives.
081 We have had a program, but funding was terminated last year.
088 We are just starting up this initiative. We would have more to say a year from now.
090 Not formally.

218
092 We have just completed an exhaustive two-year-long self-study as part of our Middle States reaccreditation process. Every constituency on campus has considerable input into self-criticism and suggestions for improvement. On top of this major effort, we have begun our third, 5-year cycle of strategic planning which, again, identifies goals and obstacles. Our president is acutely aware of TQM, but we consider our present operation to be a system of continuous improvement.
095 Rider has received training assistance from a corporation but does not conduct its own training program. Therefore most of this survey is not directly applicable to our situation.
100 Ambassador does not conduct on-going training programs on TQM or Ql; however several elements of the theory of TQM have crept into our every day practices.
108 We have no quality program. I use it in my classroom.
112 Stanford terminated all coordinated TQM-like efforts over a year ago.
113 The question is really not applicable for us. We are just now investigating possible involvement with quality principles.
114 Our efforts in TQM are in the embryonic stages and responses to the survey at this time would not be very useful.
115 We are not actually engaged in a quality process at U Mass, Boston.
117 The Cox School of Business did some quality work on curriculum. Not much is happening at the University level.
118 This is in the process of change at the moment; and therefore, the data is inaccurate when I try to respond to your questions. In another couple of months we could try again if you'd like.

REFERENCES
Anyaocha, A. O. (1984). An analysis of the application of quality circles
on education [CD-ROM]. Abstract from: ProQuest File: Dissertation Abstracts
Item: 8508769
Axland, S. (1991, October). Looking for a quality education? Quality
Progress. 24. (10), pp. 61-66.
Axland, S. (1992, October). A higher degree of quality. Quality Progress.
25* (10), pp. 41-61.
Baas, A. G. (1995). Quality service indicators and their importance to
student satisfaction in selected community colleges. (Doctoral Dissertation,
University of Minnesota, 1995). Dissertation Abstracts International. DAI-A
56/06, p. 2050, December, 1995.
Baugher, K. H. (1992). Student quality teams: Adapting Demino at
Samford University [CD-ROM]. Abstract from: ProQuest File: Dissertation
Abstracts Item: 9311125.
Bell, J. (1987). Doing your research project: A guide for first-time
researchers in education and social science. Philadelphia, PA: Open University
Press.
Bender, R. H. (1991, November). If you can count it, you can improve it.
The School Administrator. 48 (9), pp. 24-26.

220
Bonser, C. F. (1992, September). Total quality education? Public
Administration Review. 52 (5), pp. 504-512.
Bonstingl, J. J. (1992, November). The quality revolution in education.
Educational Leadership. 50. (3) pp. 4-9.
Borg, W. R. (1987). Applying educational research: A practical guide for
teachers. New York: Longman.
Borg, W. R. & Gall, M. D. (1989). Educational research: An introduction.
New York: Longman.
Brigham, S. E. (1993, May/June). TQM: Lessons we can learn from
industry. Change. 25. (3), pp. 42-48.
Brocato, R. C. (1994). Using TQM methods to teach TQM: A case study at
an evening education center of The Johns Hopkins University G.W.C. Whiting
School of Engineering [CD-ROM]. Abstract from: ProQuest File: Dissertation
Abstracts Item: 9526183.
Butler, M. (1990). Quality leadership equals quality service. The
Bureaucrat. 19. (2), pp. 44-46.
Butterfield, R. W. (1991, March). Deming's 14 points applied to service.
Training. 28. (3), pp. 50-59.
Calek, A. (1995, September). Quality Progress' fifth quality in education
listing. Quality Progress. 28. (9), pp. 27-77.
Carothers, R. L. (1992, November). Translating quality for the academy.
AAHE Bulletin. 45. (3), pp. 6-10.

221
Carroll, T. W. (1994). Total quality management in higher education:
implementation and barriers [CD-ROM], Abstract from: ProQuest File:
Dissertation Abstracts Item: 9523014.
Chaffee, E. E. (1990). On doing the right thing: ASHE presidential
address. Review of Higher Education. 14. (1), pp. 101-115.
Coate, L. E. (1990, November). TQM on campus. Implementing total
quality management in a university setting. Business Officer. 24. (6), pp. 26-35.
Coate, L. E. (1991, Fall). Implementing total quality management in a
university setting. In L. A. Sherr, & D. J. Teeter, (Eds.), New directions for
institutional research: Total quality management in higher education. 18. (3),
pp. 27-38. San Francisco: Jossey-Bass Publishers.
Coate, L. E. (1993, April). The introduction of Total Quality Management
at Oregon State University. Higher Education. 25. pp. 303-320.
Cook, B. M. (October 21,1991). Quality: The pioneers survey the
landscape. Industry Week, pp. 68-73.
Cornesky, R. A., (1989, September). Deming: New approaches for
enhancing academic quality, participatory management, and faculty morale.
School of Science, Management & Technologies, Edinboro University of
Pennsylvania, Edinboro, PA.
Cornesky, R., Baker, R., Cavanaugh, C., Etling, W., Lukert, M., McCool,
S., McKay, B., Min, A., Paul, C., Thomas, P., Wagner, D., & Darling, J. (1990).
Using Deming to improve quality in colleges and universities. Madison, Wl:
Magna Publications, Inc.
222
Cornesky, R., McCool, S., Byrnes, L., & Weber, R. (1991). Implementing
total quality management in higher education. Madison, Wl: Magna
Publications, Inc.
Cornesky, R. & McCool, S. (1992). Total quality improvement guide for
institutions of higher education. Madison, Wl: Magna Publications, Inc.
Cowles D. & Gilbreath, G. (1993, April). Total quality management at
Virginia Commonwealth University: an urban university struggles with the
realities of TQM. Higher Education. 25. pp. 281-302.
Crosby, P. B. (1979). Quality is free: The art of making quality certain.
New York: McGraw-Hill.
Crosby, P. B. (1984). Quality without tears: The art of hassle-free
management. New York: McGraw-Hill.
David, F. R. (1986). Fundamentals of strategic management. Columbus,
OH: Merrill Publishing Company.
DeCosmo, R. D., Parker, J. S., & Heverly, M. A. (1991, Fall). Total quality
management goes to community college. In L. A. Sherr, & D. J. Teeter (Eds.),
New directions for institutional research: Total quality management in higher
education. 18. (3), pp. 13-25. San Francisco: Jossey-Bass Publishers.
Deming, W. E. (1986). Out of the crisis. Cambridge, MA: MIT Center for
Advanced Engineering Study.
Dhiman, S. K. (1995). Leadership implications of total quality manage-
ment in higher education. (Doctoral dissertation, Pepperdine University, 1995).
Dissertation Abstracts International. DAI-A 56/07, p. 2051, January, 1996.

223
Drucker, P. F. (1973). Management: Tasks, responsibilities, practices.
New York: Harper & Rowe.
Edwards, D. (1991, December). Total quality management in higher
education. Management Services. 35. (12), pp. 18-20.
Entin, D. H. (1993, May/June). Case study number one: Boston—less
than meets the eye. Change. 25. (3), pp. 28-31.
Entin, D. H. (1994, May). Whither TQM?—A second look. AAHE Bulletin.
46. (9), pp. 3-7.
Entner, D. (1993, Spring). DCCC takes the TQM plunge . . . and tells how.
Educational Record. 74. (2) pp. 28-34.
Ewell, P. T. (1993, May/June). Total quality and academic practice: The
idea we've been waiting for? Change. 25. (3), pp. 49-55.
Feigenbaum, A. V. (1983). Total quality control (3rd ed.). New York:
McGraw-Hill.
Fields, J. (1993). Total quality for schools. ASQC Quality Press:
Wisconsin.
Filipzak, B. (1993, July). TQM: Dead or alive? Training. 7. (30), p. 63.
Fisher, D. C. (1995). Baldrige on campus: The assessment workbook for
higher education. New York: Quality Resources.
Fisher, J. L. (1993, Spring). TQM: A warning for higher education,
Educational Record.74. (2) pp. 15-19.
224
Fritz, S. M. (1993). A quality assessment using the Baldrige criteria: Non-
academic service units in a large university [CD-ROM]. Abstract from: ProQuest
File: Dissertation Abstracts Item: 9333964.
Geber, B. (1990, September). Improving the quality of white-collar work,
Training. 27. (9), pp. 29-34.
Gitlow, H. S. & Gitlow, S. J. (1987). The Demina guide to quality and
competitive position. Englewood Cliffs, New Jersey: Prentice-Hall.
Godfrey, A. B. (1993). Ten areas for future research in total quality
management. Quality Management Journal. 1. (1), pp. 47-70.
Green, R. T. (1994). Predictors of adoption of TQM by a research faculty:
The collision of professionalization of knowledge in the academy with TQM's
concept of deprofessionalizing knowledge [CD-ROM]. Abstract from: ProQuest
File: Dissertation Abstracts Item: 9500936.
Hendley, V. (1992, April 7). TQM: Colleges waging 'quality1 war to
improve education. The Community. Technical, and Junior College Times (63).
pp. 1,7.
Heverly, M. (1991). Total quality management: Institutional research
applications. Paper presented at the Annual Conference of the Eastern
Evaluation Research Society (14th, Princeton, NJ, May 20, 1991).
Holpp, L. (1989, October). 10 reasons why total quality is less than total,
Training. 43. (10), pp. 93-103.

225
Horine, J. E., Hailey, W. A. (1995, Fall). Challenges to successful quality
management implementation in higher education institutions. Innovative Higher
Education. 20. (1), pp. 7-17.
Horine, J. E. & Hailey, W. A., & Rubach, L. (1993, October). Shaping
America's future: Total quality management in higher education. Quality
Progress. 26. (10), pp. 41-60.
Howard, N. (1993, Summer). The role of the quality manager. In D. J.
Teeter & G. G. Lozier, (Eds.), New directions for institutional research. Pursuit of
quality in higher education: Case studies in Total Quality Management. 25. (2),
pp. 105-110.
Huang, C. (1994). Assessing the leadership styles and total quality
leadership behaviors of presidents of four-year universities and colleges that
have implemented the principles of total quality management [CD-ROM].
Abstract from: ProQuest File: Dissertation Abstracts Item: 9517022.
Imai, M. (1986). Kaizen. New York: Random House Business Division.
Ishikawa, K. (1986). Guide to quality control (rev. 2nd ed.). Tokyo: Asian
Productivity Organization.
Jones, J. & Timmerman, L. (1994). Total quality management
assessment, teaching and learning: Toward a campuswide language and
system. Community College Journal of Research and Practice. 18. (4),
pp. 411-418.
Juran, J. M. (1989). Juran on leadership for quality: An executive
handbook. New York: Macmillan, Inc.

226
Juran, J. M. (1992). Juran on quality by design: The new steps for
planning quality into goods and services. New York: The Free Press.
Kanuck, L. & Berenson, C. (1975, November). Mail surveys and response
rates: A literature review. Journal of Marketing and Research. 12. (11),
pp. 440-453.
Kaufman, R. (1991, December). Toward total quality 'plus'. Training. 28.
(12), pp. 50-54.
Kerlinger, F. N. (1979). Behavioral research: A conceptual approach.
New York: Holt, Rinehart, and Winston.
Kirkpatrick, D. L. (1975). Evaluating training programs. Madison, Wl:
American Society for Training and Development.
Krein, T. J. & Weldon, K. C. (1994, April). Making a play for training
evaluation. Training and Development. 48. (4), pp. 62-67.
Lazio, T. F. (1991). Transferability of the quality improvement process in
education: A case study of the 'quality improvement plan' at Lively area
vocational technical center [CD-ROM]. Abstract from: ProQuest File: Dissertation
Abstracts Item: 9130954.
Lewis, R. G. & Smith, D. H. (1994). Total quality in higher education.
Delray Beach, FL: St. Lucie Press.
Marchese, T. (1991, November). TQM reaches the academy. AAHE
Bulletin. 44. (3), pp. 3-9.
Marchese, T. (1992, November). TQM at Penn: A report on first
experiences. AAHE Bulletin. 45. (3), pp. 3-5, 14.

227
Marchese, T. (1993, May/June). TQM: A time for ideas. Change. 25. (3)
pp. 10-13.
Mangan, K. (1992, 12 August). TQM: Colleges embrace the concept of
"Total Quality Management". The Chronicle of Higher Education. 38. (49),
pp. A25-A26.
McCormack, S. P. (1992, June). TQM: Getting it right the first time.
Training and Development. 46. (6), pp. 43-46.
Michalak, D. F. & Yager, E. G. (1979). Making the training process work.
New York: Harper & Row, Publishers.
Miller, S. E. (1993). The applicability of the Malcolm Baldrige national
quality award criteria to assessing the quality of student affairs in colleges and
universities [CD-ROM]. Abstract from: ProQuest File: Dissertation Abstracts Item:
9330028.
Moore, S. H. (1994). Strategic planning, total quality management, and
quality conceptions institutions of higher education: A exploratory analysis [CD-
ROM]. Abstract from: ProQuest File: Dissertation Abstracts Item: 9433309.
Parker, R. & Rea, L. (1992). Designing and conducting survey research:
A comprehensive guide. San Francisco: Jossey-Bass Publishers.
Peters, T. J. & Waterman, R. H., Jr. (1982). In search of excellence:
Lessons from America's best-run companies. New York: Harper & Row,
Publishers.

228
Peterson, C. S. (1993). Continuous quality assurance: Adapting TQM for
community colleges. Washington, D.C.: American Association of Community
Colleges.
Port, O. & Smith G. (1992, November 30). Quality: Small and midsize
companies seize the challenge—not a moment too soon. Business Week. 30.
(3295), pp. 66-75.
Rea, L. M. & Parker, R. A. (1992). Designing and conducting survey
research. San Francisco: Jossey-Bass Publishers.
Robinson, J. D., Ill, Poling, H. A., Akers, J. F., Galvin, R. W., Artz, E. L. &
Allaire, P. A. (1991, November-December). An open letter: TQM on the campus.
Harvard Business Review. 69. (6), pp. 94-95.
Rubach, L. (1994, September). Quality Progress' fourth annual quality in
education listing. Quality Progress. 27. (9), pp. 27-78.
Rux, P. P. (1994). Benchmarking total quality management databases for
higher education [CD-ROM]. Abstract from: ProQuest File: Dissertation Abstracts
Item: 9429369.
Sax, G. (1979). Foundations of educational research. Englewood Cliffs,
NJ: Prentice-Hall.
Schargel, F. P. (1991, November/December). Promoting quality in
education. Schools can use total quality management concepts to boost student
performance. Vocational Education Journal. 66. (8), pp. 34-35, 77.
Scherkenbach, W. W. (1988). The Deming route to quality and
productivity. Rockville, Maryland: Mercury Press.

229
Scholtes, P. R. (1991). The team handbook. Wisconsin: Joiner
Associates, Inc.
Senge, P. (1990). The fifth discipline: The art and practice of the learning
organization. New York, NY: Doubleday/Currency.
Seymour, D. T. (1991, November) TQM on campus: What the pioneers
are finding. AAHE Bulletin. 44. (3), pp. 10-13, 18.
Seymour, D. & Collett, C. (1991). Total quality management in higher
education: A critical assessment. (Report No. 91.01). Methuen, MA: GOAL/QPC.
Seymour, D. T. (1992). On Q: Causing quality in higher education. New
York: Macmillan Publishing Company.
Seymour, D. T. (1993a, Spring). TQM: Focus on performance, not
resources. Educational Record. 74. (2), pp. 6-14.
Seymour, D. T. (1993b, May/June). Quality on campus: Three institutions,
three beginnings. Change. 25. (3), pp. 14-27.
Seymour, D. T. (1993c). The IBM - TQM partnership with colleges and
universities. Washington, D. C.: American Association for Higher Education.
Seymour, D. T. (1993d). Total quality management in higher education:
Clearing the hurdles. (Report No. 93.01). Methuen, MA: GOAL/QPC.
Seymour, D. T. (Ed.). (1994, Summer). New directions for higher
education. Total Quality Management on campus: Is it worth doing? San
Francisco: Jossey-Bass Publishers.
Seymour, D. T. (1995). Once upon a campus: Lessons for improving
quality and productivity in higher education. Phoenix, AZ: Oryx Press.

230
Seymour, D. T. (1996, April). The Baldrige in education: Why is it needed,
and what the first year pilot produced. AAHE Bulletin. 48. (8), pp. 9-14.
Shaw, K. A. (1993, Spring). Sunflower seeds at Syracuse. Educational
Record. 74. (2), pp. 20-27.
Sherr, L. A. & Lozier, G. (1991, Fall). Total quality management in higher
education. In L. A. Sherr, & D. J. Teeter, (Eds.), New directions for institutional
research. Total quality management in higher education. 18. (3), pp. 3-11.
Sherr, L. A. & Teeter, D. J. (Eds.). (1991, Fall). New directions for
institutional research. Total quality management in higher education. San
Francisco: Jossey-Bass Publishers.
Sloan, D. (1994, Summer). Total quality management in the culture of
quality in higher education. In Stark, J. (Ed.), The Review of Higher Education.
17, (4), pp. 447-464.
Spanbauer, S. J. (1987). Quality first in education . . .Why not?
Wisconsin: Fox Valley Technical College Foundation.
Spanbauer, S. J. (1992). A quality system for education. Milwaukee, Wl:
ASQC Quality Press.
Stampen, J. O. (Winter, 1987). Improving the quality of education: W.
Edwards Deming and effective Schools. Contemporary Education Review. 3.
(3), pp. 423-433.

231
Stieber, W. (1991). Implementation characteristics of effective quality
improvement training: A descriptive study. (Doctoral dissertation, Temple
University, Pennsylvania, 1991). Dissertation Abstracts International. DAI-A
52/09, p. 3204, March, 1992.
Stuelpnagel, T. R. (1988, Fall/1989, Winter). Total Quality Management in
business—and academia. Business Forum. 14. (1), pp. 4-9.
Thor, L. T. ( 1994, Summer). Value-added education: A president's
perspective. In D. Serymour (Ed.), New directions for higher education. Total
quality management on campus: Is it worth doing?. 22. (2), pp. 61-69. San
Francisco: Jossey-Bass Publishers.
Teeter, D. J. & Lozier, G. G. (Eds.). (1993, Summer). New directions for
institutional research. Pursuit of quality in higher education—Case studies in
Total Quality Management. San Francisco: Jossey-Bass Publishers.
Tracey, W. R. (1968). Evaluating training programs and development
systems. American Management Association, Inc.
Vaught, B. C., Hoy, F., & Buchanan, W. W. (1985). Employee
development programs: An organizational approach. Westport, CT: Quorum
Books.
Walton, M. (1986). The Deming management method. New York: The
Putnam Publishing Group.
Warwick, D. & Lininger, C. A. (1975). The sample survey: Theory and
practice. New York: McGraw-Hill.

232
Whittemore, M. (1990, January). Prize achievements. Nation's Business.
Z£L (1). P- 29.
Wilson, R. (1991, January 9). Undergraduates at large universities found
to be increasingly dissatisfied. The Chronicle of Higher Education. 37. pp. A1,
A37-A38.
Winter, R. S. (1991, Fall). Overcoming barriers to total quality
management in colleges and universities. In L. A. Sherr, & D. J. Teeter, (Eds.),
New directions for institutional research. Total quality management in higher
education. 18. (3), pp. 53-62.
Yates, R. E. (1992, October 14). Motorola extending its pursuit of
excellence to suppliers. Chicago Tribune. Sec. 2, p. 1.