Embed Size (px)
Citation preview

University of Groningen
No experimental evidence for local competition in the nestling phase as a driving force fordensity-dependent avian clutch sizeNicolaus, Marion; Both, C; Ubels, Richard; Edelaar, Pim; Tinbergen, Joost; Butler, Simon
Published in:Journal of Animal Ecology
DOI:10.1111/j.1365-2656.2009.01535.x
IMPORTANT NOTE: You are advised to consult the publisher's version (publisher's PDF) if you wish to cite fromit. Please check the document version below.
Document VersionPublisher's PDF, also known as Version of record
Publication date:2009
Link to publication in University of Groningen/UMCG research database
Citation for published version (APA):Nicolaus, M., Both, C., Ubels, R., Edelaar, P., Tinbergen, J. M., & Butler, S. (Ed.) (2009). No experimentalevidence for local competition in the nestling phase as a driving force for density-dependent avian clutchsize. Journal of Animal Ecology, 78(4), 828-838. DOI: 10.1111/j.1365-2656.2009.01535.x
CopyrightOther than for strictly personal use, it is not permitted to download or to forward/distribute the text or part of it without the consent of theauthor(s) and/or copyright holder(s), unless the work is under an open content license (like Creative Commons).
Take-down policyIf you believe that this document breaches copyright please contact us providing details, and we will remove access to the work immediatelyand investigate your claim.
Downloaded from the University of Groningen/UMCG research database (Pure): http://www.rug.nl/research/portal. For technical reasons thenumber of authors shown on this cover page is limited to 10 maximum.
Download date: 10-02-2018

Journal of Animal Ecology
2009,
78
, 828–838 doi: 10.1111/j.1365-2656.2009.01535.x
© 2009 The Authors. Journal compilation © 2009 British Ecological Society
Blackwell Publishing Ltd
No experimental evidence for local competition in the
nestling phase as a driving force for density-dependent
avian clutch size
Marion Nicolaus
1
, Christiaan Both
1
, Richard Ubels
1
, Pim Edelaar
2
and Joost M. Tinbergen
1
1
Animal Ecology Group, Centre for Ecological and Evolutionary Studies, University of Groningen, PO Box 14, 9750 AA Haren, The Netherlands; and
2
Department of Animal Ecology, Uppsala University, Norbyvagen 18D, SE-752 36 Uppsala,
Sweden
Summary
1.
In birds, local competition for food between pairs during the nestling phase may affect nestlinggrowth and survival. A decrease in clutch size with an increase in breeding density could be an adaptiveresponse to this competition. To investigate whether breeding density causally affected the clutchsize of great tits (
Parus major
), we manipulated breeding density in three out of eight study plots byincreasing nest-box densities. We expected clutch size in these plots to be reduced compared to thatin control plots.
2.
We analysed both the effects of variation in annual mean density (between-year comparisons)and experimental density (within-year comparison between plots) on clutch size variation, theoccurrence of second broods and nestling growth. We examined within-female variation in clutchsize to determine whether individual responses explain the variation over years.
3.
Over the 11 years, population breeding density increased (from 0·33 to 0·50 pairs ha
–1
) whileclutch size and the occurrence of second broods decreased (respectively from 10·0 to 8·5 eggs andfrom 0·39 to 0·05), consistent with a negative density-dependent effect for the whole population.Nestling growth showed a declining but nonsignificant trend over years.
4.
The decline in population clutch size over years was primarily explained by changes occurringwithin individuals rather than selective disappearance of individuals laying large clutches.
5.
Within years, breeding density differed significantly between manipulated plots (0·16 pairs ha
–1
vs.0·77 pairs ha
–1
) but clutch size, occurrence of second broods and nestling growth were not affectedby the experimental treatment, resulting in a discrepancy between the effects of experimental andannual variation in density on reproduction.
6.
We discuss two hypotheses that could explain this discrepancy: (i) the decline in breedingperformance over time was not due to density, but resulted from other, unknown factors. (ii) Density didcause the decline in breeding performance, but this was not due to local competition in the nestlingphase. Instead, we suggest that competition acting in a different phase (e.g. before egg laying or afterfledgling) was responsible for the density effect on clutch size among years.
Key-words:
breeding density, great tit, individual adjustment,
Parus major
, reproduction
Introduction
Density dependence is a key concept in ecology, since itexplains a large part of the regulation of populations (e.g.Murdoch 1994). Demographic traits that are affected bypopulation density include dispersal, survival and reproduction(Sinclair 1989; Newton 1998). The existence of density
dependence of avian reproduction is strongly supported bydescriptive time-series analyses (e.g. Both 2000; Wilkin
et al
.2006), yet little is known regarding the resources that birdsmust compete for and thus about the mechanisms involvedin density-dependent processes. Experiments that study thecausality of density-dependent relationships by manipulatingdensity have produced inconsistent results (see review inNewton 1998). Some of these experiments found a causalrelationship between density and demographic traits like
*Correspondence author. E-mail: [email protected]
Density dependence of avian clutch size
829
© 2009 The Authors. Journal compilation © 2009 British Ecological Society,
Journal of Animal Ecology
,
78
, 828–838
survival (Verhulst 1992) and reproduction (Kluijver 1951;Dhondt, Kempenaers & Adriaensen 1992; Both 1998b; Sillett,Rodenhouse & Holmes 2004), but others failed to find a causallink (Tompa 1967; Both & Visser 2000). This discrepancysuggests that the effects of density on demographic traitsdepend on the ecological circumstances of these differentpopulations.
Competition for limited resources (e.g. territories, mates, andfood) is often hypothesized as one of the main mechanismsbehind the density dependence of reproduction (Newton1998). The strength and the type of competition may differbetween the different phases of the annual cycle dependingon fluctuation in the availability of resources and the numberof competitors.
Competition for food before or during egg laying mayaffect the amount of energy allocated to reproduction (Lack1966) and could cause density dependence of reproduction.Experimental food supplementation during egg laying didincrease clutch size and offspring production in a number ofspecies (Arcese & Smith 1988; Soler & Soler 1996; Nager,Ruegger & van Noordwijk 1997) supporting this idea.
Breeding density manipulations have also revealed thatreproductive performance of birds generally decreased inexperimental high-density plots (Török & Toth 1988; Both1998b). The observation that not only clutch size but alsonestling growth was causally related to local densities suggeststhat nestlings in high-density areas received less food. Therefore,local competition for food during the nestling phase might beanother mechanism causing birds to adjust their reproductiverates (Both 1998b).
Finally, females may produce a number of offspringadjusted to the level of competition they will encounter afterfledging. If the density of birds is such that the level ofcompetition is raised, this decreases the chance for juvenilesto become recruited into the local population (Drent 1984).Therefore, the benefits of producing fewer but more com-petitive offspring may increase at high densities. Experimentsinvolving removal of breeding pairs showed that the new-comers were mainly young birds and that recolonizationoccurred often to the original population level, implyingthat the amount of available resources (including space toestablish territories) limits local densities (e.g. Watson &Jenkins 1968; Krebs 1970; but see Marra & Holmes 1997).
Variation in phenotypic traits is common in birds andpopulation changes in those traits can occur as a result ofwithin-individual changes or selective appearance or dis-appearance of certain phenotypes. Several studies on avianclutch size have shown that individuals tune their clutch sizeto both their local situation and their phenotypic qualityso that it maximizes their fitness (individual optimizationhypothesis; Pettifor, Perrins & McCleery 1988; Tinbergen &Daan 1990; Pettifor, Perrins & McCleery 2001), although notunder all circumstances (Both, Tinbergen & Van Noordwijk1998; Tinbergen & Both 1999; Tinbergen & Sanz 2004). Both
et al
(2000) also estimated that the fitness consequences ofclutch size changed with population density, shifting theclutch size with maximum fitness (optimal clutch size) to
lower values at higher breeding densities. Because thenegative effect of family size on nestling growth was strongerat higher population densities, the authors suggested that areduction of clutch size with density was generated by localcompetition for nestling food.
In studies on great tits (
Parus major
), where most of theevidence for density dependence of avian clutch size comesfrom (see review in Both 2000), it is usually assumed thatbreeding birds compete for caterpillars to feed to their off-spring, and that what drives density-dependent patterns inreproduction is the depletion of these caterpillars. However,in different ecological circumstances, there may be nocompetition for food during the chick-rearing phase, and adensity manipulation under these conditions may allow thedetection of alternative mechanisms that can cause densitydependence.
In this study, we investigated causal effects of breedingdensity on clutch size and nestling growth in great tits, studyingexperimental density effects within years in concert withnatural density effects between years. We performed a densityexperiment for 11 years in a growing population in the northof the Netherlands where flying insects rather than caterpillarsare an important component of the diet (personal observations).Woodlots carrying either a low or high density of nest boxeswere created. This experimental set up allowed us to analysesimultaneously the effect of the local experimental density(within-year comparison) and the effect of natural annualbreeding density variation (between-year comparisons) onreproduction in great tits. If local competition for food isthe mechanism behind the density dependence of clutchsize, local high densities are expected to negatively influenceclutch size, nestling growth and the probability of having asecond brood, as observed in another great tit population(Both 1998b). If birds can or have to adjust their clutch sizebetween breeding attempts as a response to changes inannual conditions (‘individual adjustment’; Both 1998a), weexpect the relationship between population clutch sizeand annual breeding density to result from within-individualchanges. In contrast, if the relationship between populationclutch size and annual breeding density results from theselective appearance or disappearance of certain phenotypes,selection may be involved.
Material and methods
STUDY
AREA
AND
STUDY
SPECIES
The study was carried out on a great tit population living in a mixeddeciduous forest in the Lauwersmeer area (53
°
20
′
N, 06
°
12
′
E), aregion in the north of the Netherlands that was reclaimed fromthe Wadden Sea in 1968 (see details in Tinbergen & Sanz 2004;Tinbergen 2005). At the start of the study in 1993, 80 nest boxeswere present, and 120 boxes were added from 1994 onwards. Fewnatural cavities were available in the study area so that virtually allthe breeding attempts occurred in the nest boxes. In our population,great tits laid on average 9·33 (SD = 1·71,
n
= 1209, 1994–2004) eggsfor the first clutches and 7·43 (SD = 1·32,
n
= 320) eggs for the secondclutches.

830
M. Nicolaus
et al.
© 2009 The Authors. Journal compilation © 2009 British Ecological Society,
Journal of Animal Ecology
,
78
, 828–838
DENSITY
EXPERIMENT
In 1994, five plots with low nest-box densities (from 0·11 to 0·83 nest-boxesha
–1
) and three plots with high nest-box densities (from 1·25 to 1·64 nest-boxes ha
–1
) were created (Fig. 1). We determined the experimentaldensities, especially those of the high-density plots, based on thenatural range of breeding densities recorded in other Dutch great titpopulations where negative density dependence of clutch size at apopulation level was found (Both 1998a, see also Fig. 7). Plots werespread over two main woodlots (‘north’ or ‘south’ areas) about 3·5 kmapart. Plots were all physically separated by open grass areas or woodlandsthat did not carry any nest boxes, except for the two adjacent plots 1and 2 (Fig. 1). The shortest distance between any nest box from plot 1and plot 2 was 107 m. We thus consider all the plots as being isolatedand did not treat females breeding on the edge of a plot differentlyfrom those breeding closer to the centre of a plot.
Ideally, we would have switched the density treatments betweenplots over time to control for clutch size differences between plots.However, we did not do this because it would conflict with otheraspects of our research. Therefore, we checked whether clutch sizein 1993, before the density treatment (when all plots still had lowbreeding densities), covaried with the later plot treatment. We didthis using a mixed model where plots and females were fitted asrandom effects and geographical location (north/south) and laterexperimental density treatment (low/high) were fitted as fixed effects.This analysis revealed that in 1993, the plots in the north had smallerclutches than plots in the south. Clutch size, however, did not covarywith the later density treatment (mixed model: intercept: –0·74 ± 0·26;location:
β
= 1·29 ± 0·33,
χ
2
= 15·46, d.f. = 1,
P
< 0·001; experimentaltreatment:
β
= 0·51 ± 0·32,
χ
2
= 2·58, d.f. = 1,
P
= 0·108). The densitytreatment for each plot was thus sufficiently uncorrelated with respectto the original clutch size over the plots.
We defined local breeding density as the number of breeding pairsper surface area (pairs/hectare) for each plot with either low- or
high-density treatment. Annual breeding density was defined as thenumber of breeding pairs per surface area (pairs/ hectare) in thewhole study area. Annual breeding densities were separated intofirst brood breeder densities and second brood breeder densities(see definition of first and second broods in the section ‘data selection’)and were calculated for every study year.
DATA
COLLECTION
From the beginning of April, nest boxes were checked weekly andparameters such as laying date (date of the first egg in the nest,back-calculated assuming that one egg was laid per day) and clutchsize were monitored. Before expected hatching, nest boxes were checkeddaily to determine hatching date (day 0). At day 7, all chicks wereringed and both parents were caught with a spring trap in the nestbox, measured (wing length, tarsus length and mass) and ringedfor identification if necessary. At day 14, juveniles were weighed(mass ± 0·1 g) and measured (tarsus ± 0·1 mm and length of thethird primary feather from the outside ± 0·5 mm). First broodaverages for juveniles between 1994 and 2004 were 16·6 ± 1·7 g formass, 19·6 ± 0·8 mm for tarsus length and 33·0 ± 4·2 mm for winglength (
n
= 3859).
DATA
SELECTION
We used data from 11 years (1994 to 2004) of the study, with the exceptionof the nestling growth parameters, for which 10 years (1995 to 2004)were available. First broods were defined as clutches started within30 days after the start of the earliest clutch in that year. For investi-gations at the population level, second broods were also analysed,excluding repeat clutches after failure of the first clutch. Secondbroods were thus defined as broods laid by females that were knownto have successfully fledged a first brood. Clutches were excludedfrom the analysis when the female was unknown, or when theywere smaller than 5 eggs and larger than 15 eggs because these areoften the result of a disturbed situation (desertion or multiple femaleslaying in the same box). For nestling growth and within-female analyses,nests with clutch size or brood size manipulations or manipulationof the parents were excluded from the analyses.
DATA
ANALYSIS
Clutch size and nestling growth
The analyses of clutch size and nestling growth were conducted intwo main steps. First, to account for sources of interdependencybetween measurements, models based on hierarchical data structuredistinguishing between variance on two or three levels (mixedmodels) were built using multilevel modelling in
mlwin
version 2·02(Rasbash
et al.
2004). Second, the year estimates given by thesemodels were regressed on annual breeding density using
statistica
version 7 (StatSoft Inc. 2004). Significance level was set at
P
< 0·05.For clutch size (CS) and the probability of producing a second clutch,
variation was estimated simultaneously at a plot level (denoted
i
)where the density experiment was performed, at the female level(denoted
ij
) grouped within plots, and at the within-female level(denoted
ijk
) (equations 1 and 3). This was carried out becauseseveral females bred repeatedly in the same plot in different years.For the nestling growth parameters (NGP), variation at a plot level(denoted
i
), variation at a brood level (denoted
ij
) and variation at anindividual chick level (denoted
ijk
) were estimated simultaneously
Fig. 1. Map of the study area with the eight nest-box plots. Dark greyareas are wooded areas without nest boxes. Light grey areas representwater. Woodlots 1, 3, 5, 6 and 8 carried a low density of nest boxes andwoodlots 2, 4 and 7 carried a high density of nest boxes.
Density dependence of avian clutch size
831
© 2009 The Authors. Journal compilation © 2009 British Ecological Society,
Journal of Animal Ecology
,
78
, 828–838
(equation 2). The dependent variables were standardized by subtractingfrom the individual trait value the mean trait value of the populationcalculated for all the years together and then dividing this differenceby the standard deviation of the population trait. All the explanatoryvariables that were continuous were centred on the population meanby subtracting the mean trait value of the population from theindividual trait value. We used normal response models because clutchsize and nestling growth parameters were distributed normally. Wetested the significance of the explanatory variables ‘experimentaldensity treatment’ (‘exp. treat.’: low or high), ‘location’ (‘loc.’: northor south),’year’ (categorical variable) and interactions with year(year
×
loc. and year
×
exp. treat.) in the models (equations 1 and 3).We included geographical location because the two areas differed intheir soil structure, which is important for the quality of habitat andcan explain part of the clutch size variation. The random effectsregression models for clutch size variation tested were as follows:
CS
ijk
=
β
0
+
β
1
* exp. treat. (0/1)
i
+
β
2
* loc. (0/1)
i
+
β
3–13
* year
ijk
+
β
14–34
* interactions
ijk
+
u
0
i
+
e
0
ij
+
v
0
ijk
(eqn 1)
All the
β
’s represent the fixed parts of the model while
u
0
i
,
e
0
ij
and
v
0
ijk
are the random parts of the model and refer to the errors at eachlevel of variation denoted
i
,
ij
and
ijk
. Experimental density is con-sidered to have an effect on CS if
β
1
is significantly different from 0.For the descriptive analysis of natural density on clutch size, we
regressed the annual estimates for clutch size controlled for treatment,location and interactions with year in this model on the annualbreeding density. We used the annual breeding density of the firstbrood breeders to explain the variation in first clutches and the annualbreeding density of the first as well as the second brood breeders toexplain the variation in second clutches.
For nestling growth, the year estimates were controlled for clutchsize, because chicks from larger broods usually grow less well:
NGP
ijk
=
β
0
+
β
1
* exp. treat. (0/1)
i
+
β
2
* loc. (0/1)
i
+
β
3–13
* year
ij
+
β
14
* clutch size
ij
+
β
15–33
* interactions
ij
+
u
0
i
+
e
0
ij
+
v
0
ijk
(eqn 2)
Probability of having a second clutch
To analyse the probability of producing a second clutch in relationto variation in density, we used a binomial response model with a logitlink function based on hierarchical data structure distinguishingbetween variance at a plot level (denoted
i),
at a female level(denoted
ij
) and at a within female level (denoted
ijk
). As for theprevious models, we tested the significance of the explanatoryvariables ‘experimental density treatment’ (‘exp. treat.’: low or high),‘location’ (‘loc.’: north or south) and ‘year’ (categorical variable) inthe model:
P(second clutch) =
β
0
+
β
1
* exp. treat. (0/1)
i
+
β
2
* loc. (0/1)
i
+
β
3–13
* year
ijk
+
u
0
i
+
e
0
ij
+ v0ijk (eqn 3)
We were not able to test the interactions with year due to an over-parameterization of the model. The year estimates for the probabilityof having a second brood size controlled for treatment, location andyear in this model were then regressed on the annual breeding densityof early breeders after a back transformation exp(z)/[1 + exp(z)](z being equation 3).
Laying date
The effect of local and annual year density on laying date was testedthe same way as for clutch size. Laying date did present significant
year variation; however, it did not significantly covary with localexperimental density nor with annual year density (results notshown). Thus, results concerning laying date will not be discussedhere and we will focus on the effect of density on clutch size andgrowth parameters.
Within-female analysis
With this analysis, we tested to what extent the change in mean annualclutch size can be statistically explained by individual adjustmentsof clutch size to density. The analyses of clutch size variation (CS)within individuals was carried out using a normal response modelbased on hierarchical data structure distinguishing between varianceat the between-individual level (denoted i) and the within-individuallevel (denoted ij). The structure of the models took into accountthe fact that measurements for the same individual were notindependent. For the analyses, female clutch sizes were standardizedand the density values centred on the population mean. We used allfirst brood breeding females in the analysis including birds thatbred only once.
We included annual breeding density (D) in the model to test forindividual adjustment in relation to a change in year density (variationwithin individuals; level ij) as well as the quadratic term D2 to test fora nonlinear effect of annual breeding density. We also incorporatedthe mean lifetime density experienced by a female (mD) to test forbetween-individual changes (level i) as well as the age of the female(α) and its quadratic term (α2) (level ij) to correct for an effect ofsenescence known in the great tit (Kluijver 1951). Age of the femaleswas included as a continuous variable.
The significance of the explanatory variables ‘annual breedingdensity (D)’, ‘mean lifetime density (mD)’, ‘age’ (α) and the quadraticterms ‘D2’ and ‘α2’ was tested in the model (equation 4) as follows:
(eqn 4)
As for the previous models, all the β’s are the fixed parts of themodel and u0i and e0ij are the random parts of the model.
Results
EXPERIMENTAL LOCAL DENSITY VS. ANNUAL BREEDING DENSITY
Local breeding density differed significantly between thetwo density treatments (paired t-test across years: t = −20·85,d.f. = 10, P < 0·01) meaning that our experiment did affectthe distribution of the birds. In the low nest-box density areas,the local breeding density was on average 0·17 pairs ha–1
(SD = 0·02, n = 11), compared to an average breeding densityof 0·77 pairs ha–1 in the high-density nest-box areas (SD = 0·01,n = 11). Between years, local breeding densities were positivelycorrelated between the treatments (r = 0·71), suggesting thatother factors than the local nest-box density also affectedthe local breeding densities. Nest-box occupancy rate differedmarkedly between the density treatments (paired t-test:t = 8·02, d.f. = 10, P < 0·01), with a higher occupancy in thelow-density treatment (mean occupation rate low density:69·14% SD = 10·26; high density: 51·69% SD = 7·52, n = 11).Furthermore, variance in local breeding densities also differedbetween treatments, with lower variance in the low nest-box
CSij ij ij i i ijD mD D u eij ij * * = + + + + + +β β β α β β β α0 1 2 3 42
52
0 0
832 M. Nicolaus et al.
© 2009 The Authors. Journal compilation © 2009 British Ecological Society, Journal of Animal Ecology, 78, 828–838
group (variance low density: 0·001; high density: 0·012),probably because of the higher nest-box occupancy.
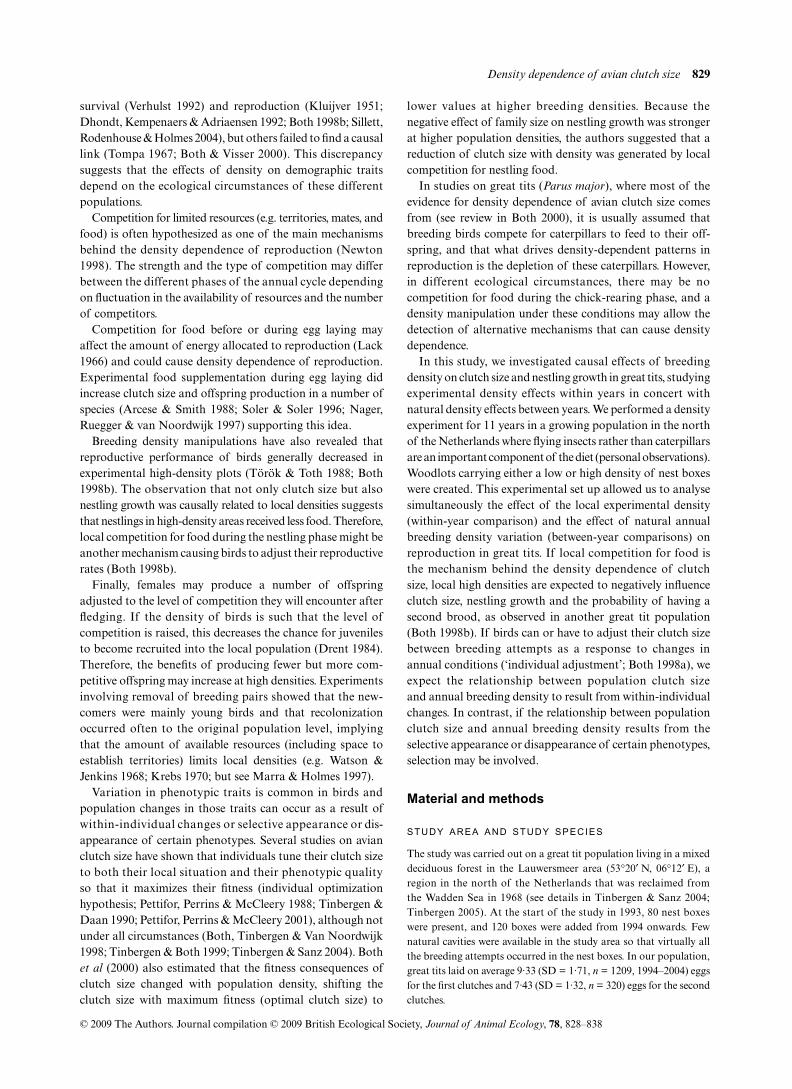
We found that the local breeding density of the first broodbreeders, but not of the second brood breeders, significantlyincreased over the course of our 11-year study [group (first/second brood breeders): F1,22 = 17·72, P < 0·01; years: F1,22 = 1·94,P = 0·180; group × years: F1,22 = 8·64, P < 0·01; Fig. 2a.]. Wealso found that the local breeding densities of both low- andhigh-density plots significantly increased with years in asimilar way (using log-densities: density treatment (low/high):F1,22 = 280·94, P < 0·01; years: F1,22 = 28·08, P < 0·01; densitytreatment × years: F1,22 = 0·09, P = 0·762, Fig. 2b).
CLUTCH SIZE – F IRST BROODS
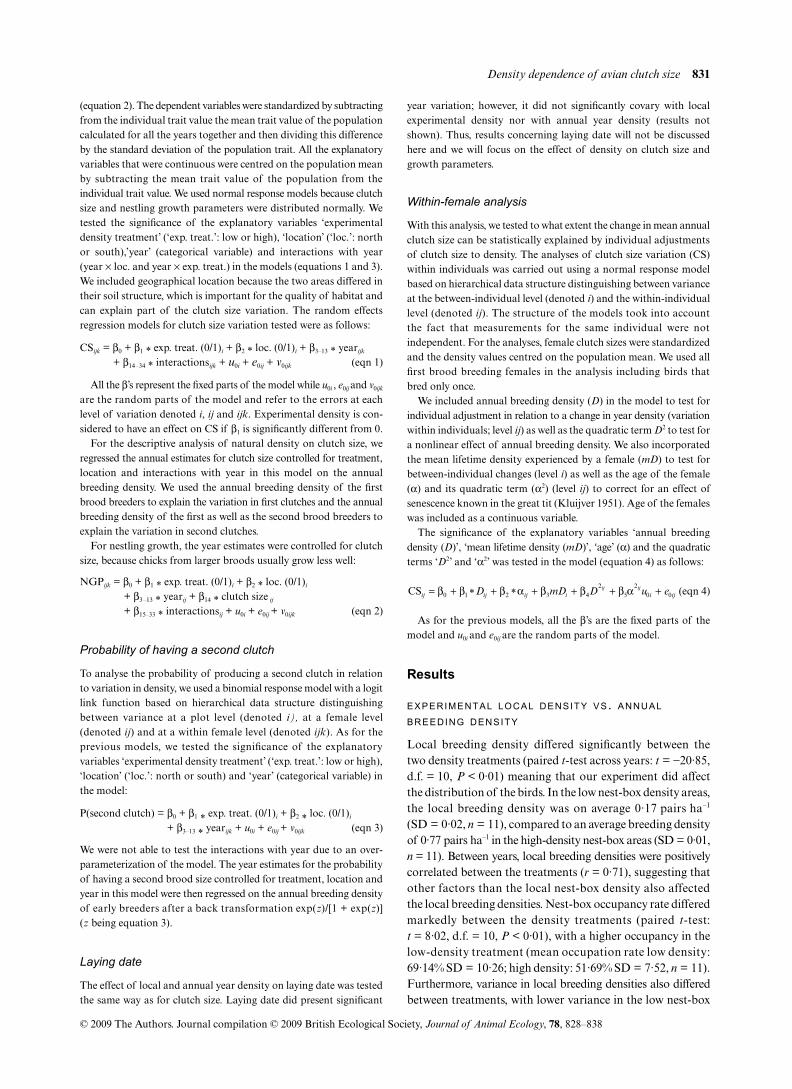
Clutch size was slightly higher in the low-density treatment,but the difference was far from significant. (Table 1; Fig. 3a).It, however, did vary significantly with year (but not withtreatment × year), location and location × year (Table 1). Theclutch size estimates obtained for each year and controlled fortreatment, location and for the year interactions did correlatenegatively with the annual breeding density of the first broodbreeders. This correlation was significant for both low- andhigh-density plots (all: F1,11 = 18·91, P < 0·01, Fig. 3b; low-density plots: F1,11 = 33·83, P < 0·01; high-density plots:F1,11 = 13·83, P < 0·01).
CLUTCH SIZE – SECOND BROODS
Clutch size of second broods did not differ significantly betweenexperimental density treatments and did not significantly varywith location, year and the interactions with year (Table 1).The clutch size estimates obtained for each year and controlledfor location, experimental treatment and the year interactionsdid not significantly relate to the annual density of the firstbrood breeders. This remained the case when looking atlow- and high-density treatments separately (all: F1,11 = 0·19,P = 0·675; low-density plots: F1,11 < 0·001, P = 0·985; high-density plots: F1,11 = 0·22, P = 0·647). The clutch size estimates,however, positively correlated with the annual density ofsecond brood breeders. This correlation was significantfor the high-density plots only (all: F1,11 = 6·13, P = 0·035;low-density plots: F1,11 = 0·20, P = 0·660; high-density plots:F1,11 = 11·56, P < 0·01).
PROBABIL ITY OF HAVING A SECOND BROOD
The probability of having a second brood was not affected bythe experimental density treatments, nor by the location. Itdiffered significantly however between years (Table 2). Theprobability estimates back-transformed and controlled for
Fig. 2. (a) Variation in the annual density of first and second broodbreeders between years. (b) Variation in the annual density of birdsbreeding in low- and high-density plots over the 11 years of the study.
Fig. 3. (a) Within-year relationship between the mean populationclutch size (± SE) and the local breeding density treatments (lowdensity: closed circles; high density: open circles). (b) Relationshipbetween the mean population clutch size (± SE) and the annualbreeding density over the years.

Density dependence of avian clutch size 833
© 2009 The Authors. Journal compilation © 2009 British Ecological Society, Journal of Animal Ecology, 78, 828–838
experimental treatment and location correlated significantlyand negatively with annual density of first brood breeders.This correlation was significant for both low- and high-density plots (all: F1,11 = 5·818, P = 0·039; low-density plots:F1,11 = 6·020, P = 0·036; high-density plots: F1,11 = 5·777,P = 0·040).
NESTLING GROWTH
Nestlings from larger clutches grew less than from smallerclutches, and none of the growth parameters differed betweenexperimental density treatments (Table 3, Fig. 4a). None ofthe nestling growth parameters was related to the location
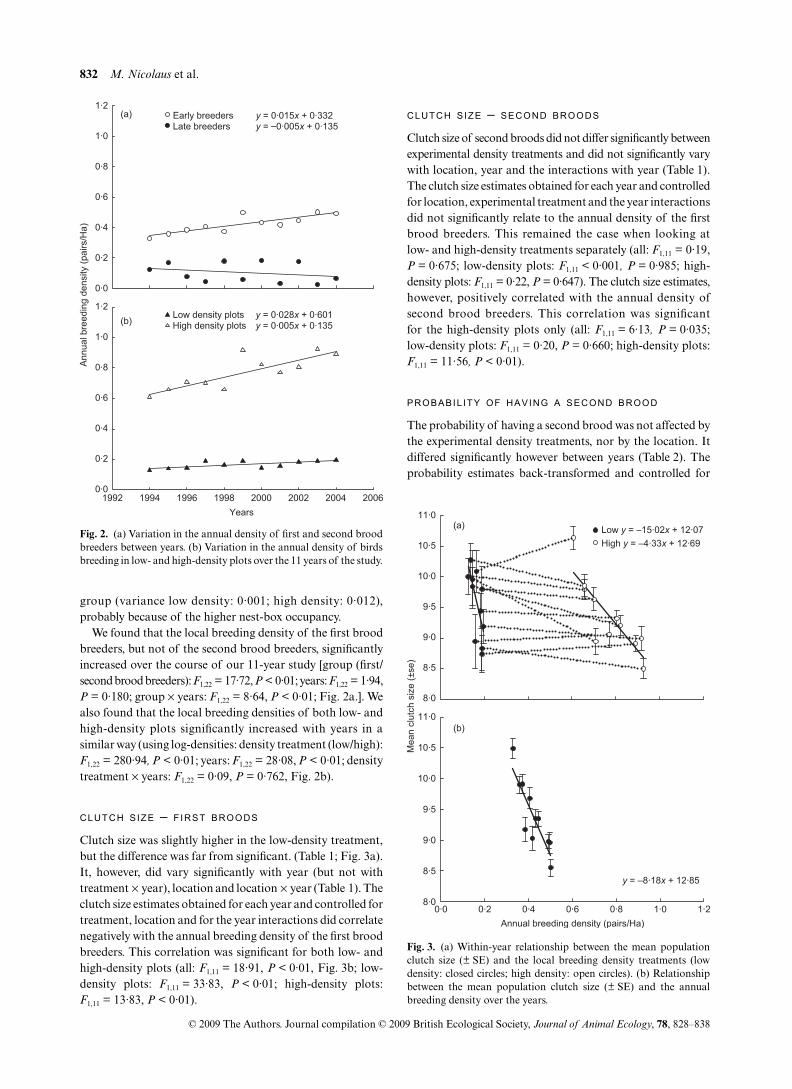
(north/south). Wing length, however, varied significantlywith year. For mass, the interactions experimental densitytreatments × year and location × year were significant (Table 3).The estimates of nestling growth parameters controlled forexperimental density treatments, location, clutch size and theyear interactions did not decrease significantly with annualdensity apart from the wing length in low-density plots (mass:all: F1,10 = 1·67, P = 0·232; low-density plots: F1,10 = 1·31,P = 0·286; high-density plots: F1,10 = 1·37, P = 0·275; Fig. 4b;wing length: all: F1,10 = 3·157, P = 0·113; low-density plots:F1,10 = 9·725, P = 0·014; high-density plots: F1,10 = 2·186,P = 0·177; tarsus: all: F1,10 = 0·659, P = 0·440; low-densityplots: F1,10 = 0·953, P = 0·357; high-density plots: F1,10 = 0·295,
Table 1. Model summary examining clutch size of the great tit for first (n = 1119 females) and second broods (n = 267 females) in relation toexperimental density treatment, location (north or south), year, experimental density treatment × year and location × year. Significant valuesare shown in bold
Parameter
Standardized clutch size
β SE (β) χ2 d.f. P
First broodsIntercept 0·360 0·250Experimental density treatment 0·093 0·276 0·113 1 0·737Location 1·256 0·263 14·276 1 <0·001Year 33·673 10 <0·001Experimental density treatment × year 10·431 10 0·403Location × year 22·959 10 0·011Random effects
0·018 0·015 1·558 1 0·212 0·347 0·041 71·852 1 <0·001 0·441 0·031 198·684 1 <0·001
Second broodsIntercept 0·775 0·444Experimental density treatment –0·798 0·488 2·668 1 0·102Location –0·426 0·468 0·828 1 0·363Year 16·994 10 0·074Experimental density treatment × year 12·043 10 0·282Location × year 13·501 10 0·197Random effects
0·069 0·053 0·712 1 0·399 0·123 0·116 1·124 1 0·289 0·663 0·123 29·157 1 <0·001
σplot2
σfemale2
σwithin female2
σplot2
σfemale2
σwithin female2
Table 2. Model summary examining the probability of having a second brood (n = 1119 females) in relation to experimental density treatments,location (north or south) and year. Significant values are shown in bold
Parameter Probability of having a second brood
β SE (β) χ2 d.f. P
Intercept –0·361 0·378Experimental density treatment –0·504 0·323 2·433 1 0·119Location 0·149 0·360 1·350 1 0·245Year 131·165 10 <0·001Random effects
0·087 0·092 0·892 1 0·345 1·436 0·330 18·888 1 <0·001– – – – –
σplot2
σfemale2
σwithin female2

834 M. Nicolaus et al.
© 2009 The Authors. Journal compilation © 2009 British Ecological Society, Journal of Animal Ecology, 78, 828–838
P = 0·601). For nestling mass, however, the pattern changedwhen we analysed the data without the year 2001 when themean nestling mass was much lower. Without 2001, nestlingmass significantly decreased with an increase of annualdensity of the first brood breeders (Fig. 4b), but not when lookingat low- and high-density plots separately (all: F1,10 = 5·78,P = 0·047; low-density plots: F1,10 = 1·12, P = 0·325; high-density plots: F1,10 = 4·93, P = 0·062).
WITHIN FEMALES
Individual females reduced their clutch size when annual Dincreased between breeding attempts, consistent with the‘individual adjustment’ hypothesis (Table 4). This effect wasnonlinear and significant also after correcting for age (Table 4).Females seemed to lay larger clutches in their ‘middle’ age,consistently with senescence pattern known in this species butthe effect remained far from significant. The mean lifetimedensity experienced by a female did not explain the variationin individual clutch size.
Discussion
In great tits, the negative correlation between annual meanclutch size and annual breeding density is ubiquitous (Both
2000). Breeding densities for our population at the Lauwersmeerare within the density range where density dependence ofclutch size occurred in other populations, and indeed ournon-experimental results confirm the general pattern (Both1998a, Fig. 5). There is also some evidence that nestling mass(but not size) related negatively to annual breeding density.
Table 3. Model summary examining growth parameters (mass, wing length and tarsus) of day 14 great tit nestlings in relation to experimentaldensity treatment, location (north or south), nest clutch size, year, experimental density treatment × year and location × year (n = 3859nestlings). The random effects reported are those from the mass model but the wing length and tarsus models gave similar values. Significantvalues are shown in bold
Parameter β SE (β) χ2 d.f. P
Standardized massIntercept 0·144 0·244Experimental density treatment 0·225 0·293 0·589 1 0·443Location 0·343 0·321 1·137 1 0·286Centred clutch size –0·113 0·021 30·257 1 <0·001Year 7·031 9 0·634Experimental density treatment × year 20·110 9 0·017Location × year 17·142 9 0·046
Standardized wing lengthIntercept 0·906 0·213Experimental density treatment 0·008 0·245 0·001 1 0·975Location 0·145 0·276 0·274 1 0·601Centred clutch size –0·042 0·020 4·290 1 0·038Year 37·884 9 <0·001Experimental density treatment × year 16·627 9 0·055Location × year 7·255 9 0·611
Standardized tarsus lengthIntercept 0·233 0·207 Experimental density treatment 0·049 0·242 0·041 1 0·839Location –0·075 0·269 0·078 1 0·780Centred clutch size –0·057 0·019 8·892 1 0·003Year 10·351 9 0·323Experimental density treatment × year 15·450 9 0·079Location × year 17·781 9 0·072
Random effects0·064 0·039 2·647 1 0·1040·482 0·034 202·202 1 <0·0010·369 0·009 1677·330 1 <0·001
σplot2
σnest2
σindividual2
Table 4. Model summary examining clutch size variation withinindividual female in relation to the annual breeding density and itsquadratic term, the mean individual lifetime density, the age of thefemale and its quadratic term. Only first broods are analysed (n = 962females). Significant values are shown in bold
Parameter
Standardized clutch size
β SE (β) χ2 d.f. P
Intercept –0·300 0·137Annual breeding density –4·453 1·130 15·516 1 <0·001Annual breeding density2 35·794 11·92 9·019 1 0·003Mean lifetime density –0·034 1·307 0·001 1 0·975Age 0·179 0·137 1·693 1 0·193Age2 –0·025 0·030 0·698 1 0·407Random effects
0·457 0·053 74·777 1 <0·001 0·475 0·038 154·495 1 <0·001
σfemale2
σwithin female2
Density dependence of avian clutch size 835
© 2009 The Authors. Journal compilation © 2009 British Ecological Society, Journal of Animal Ecology, 78, 828–838
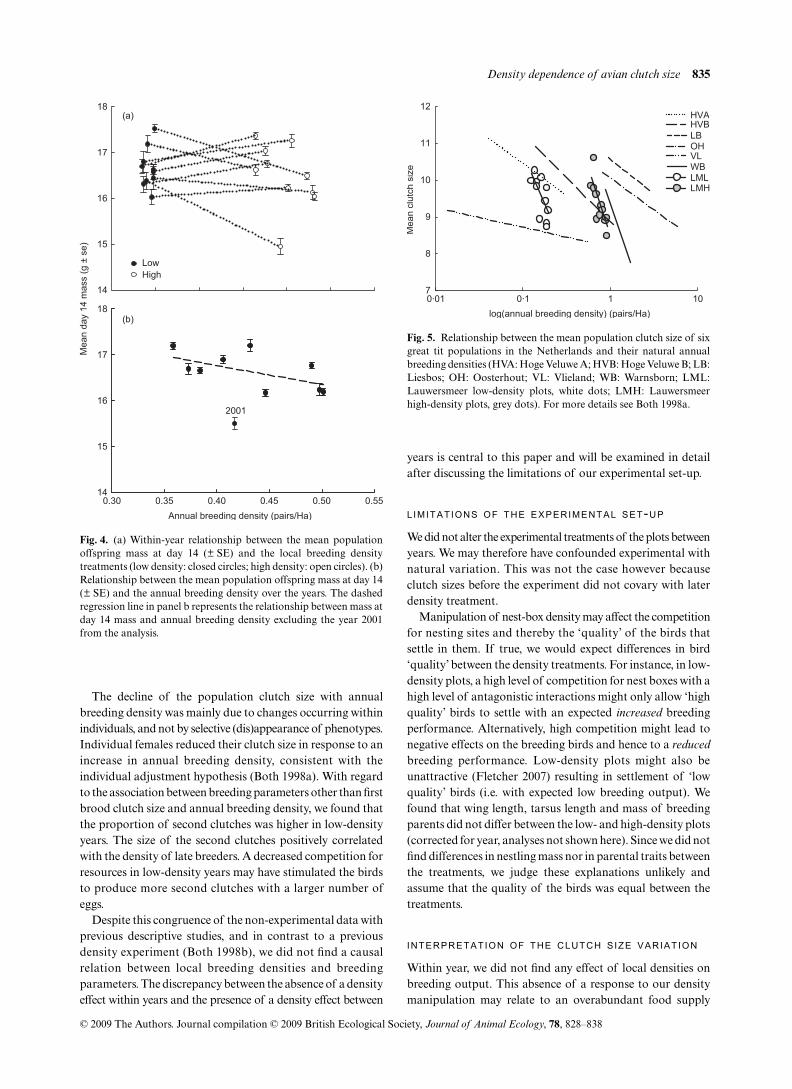
The decline of the population clutch size with annualbreeding density was mainly due to changes occurring withinindividuals, and not by selective (dis)appearance of phenotypes.Individual females reduced their clutch size in response to anincrease in annual breeding density, consistent with theindividual adjustment hypothesis (Both 1998a). With regardto the association between breeding parameters other than firstbrood clutch size and annual breeding density, we found thatthe proportion of second clutches was higher in low-densityyears. The size of the second clutches positively correlatedwith the density of late breeders. A decreased competition forresources in low-density years may have stimulated the birdsto produce more second clutches with a larger number ofeggs.
Despite this congruence of the non-experimental data withprevious descriptive studies, and in contrast to a previousdensity experiment (Both 1998b), we did not find a causalrelation between local breeding densities and breedingparameters. The discrepancy between the absence of a densityeffect within years and the presence of a density effect between
years is central to this paper and will be examined in detailafter discussing the limitations of our experimental set-up.
L IMITATIONS OF THE EXPERIMENTAL SET-UP
We did not alter the experimental treatments of the plots betweenyears. We may therefore have confounded experimental withnatural variation. This was not the case however becauseclutch sizes before the experiment did not covary with laterdensity treatment.
Manipulation of nest-box density may affect the competitionfor nesting sites and thereby the ‘quality’ of the birds thatsettle in them. If true, we would expect differences in bird‘quality’ between the density treatments. For instance, in low-density plots, a high level of competition for nest boxes with ahigh level of antagonistic interactions might only allow ‘highquality’ birds to settle with an expected increased breedingperformance. Alternatively, high competition might lead tonegative effects on the breeding birds and hence to a reducedbreeding performance. Low-density plots might also beunattractive (Fletcher 2007) resulting in settlement of ‘lowquality’ birds (i.e. with expected low breeding output). Wefound that wing length, tarsus length and mass of breedingparents did not differ between the low- and high-density plots(corrected for year, analyses not shown here). Since we did notfind differences in nestling mass nor in parental traits betweenthe treatments, we judge these explanations unlikely andassume that the quality of the birds was equal between thetreatments.
INTERPRETATION OF THE CLUTCH SIZE VARIATION
Within year, we did not find any effect of local densities onbreeding output. This absence of a response to our densitymanipulation may relate to an overabundant food supply
Fig. 4. (a) Within-year relationship between the mean populationoffspring mass at day 14 (± SE) and the local breeding densitytreatments (low density: closed circles; high density: open circles). (b)Relationship between the mean population offspring mass at day 14(± SE) and the annual breeding density over the years. The dashedregression line in panel b represents the relationship between mass atday 14 mass and annual breeding density excluding the year 2001from the analysis.
Fig. 5. Relationship between the mean population clutch size of sixgreat tit populations in the Netherlands and their natural annualbreeding densities (HVA: Hoge Veluwe A; HVB: Hoge Veluwe B; LB:Liesbos; OH: Oosterhout; VL: Vlieland; WB: Warnsborn; LML:Lauwersmeer low-density plots, white dots; LMH: Lauwersmeerhigh-density plots, grey dots). For more details see Both 1998a.

836 M. Nicolaus et al.
© 2009 The Authors. Journal compilation © 2009 British Ecological Society, Journal of Animal Ecology, 78, 828–838
during the nestling phase relative to the breeding density.However, judging from the mean nestling mass in ourpopulation this was not the case, especially in the later years,because it was comparable to the Hoge Veluwe population(Both et al. 2000). Both clutch size and breeding density in theLauwersmeer area were also comparable to the other Dutchpopulations (Fig. 5). This indicates that the ecologicalcircumstances of the Lauwersmeer must have differed fromthe other populations. Food during the nestling phase in theLauwersmeer did not generate local competition.
Over the years, mean clutch size and the probability ofproducing a second clutch decreased while annual breedingdensity increased. Because annual breeding density and yearwere significantly correlated, any parameter changing overtime may have caused the negative relation between clutchsize and annual breeding density. We separately discuss therole of factors other than breeding density and annualbreeding density to explain the annual clutch size variationin our population.
Hypothesis 1: environmental effects other than annual breeding density
Factors other than annual breeding density may have causedthe observed decline in the clutch size and the occurrence ofsecond clutches in our population over time. The decrease ofnestling mass with annual breeding density (when 2001 wasexcluded) but not with local density might indicate thatenvironmental conditions during the nestling phase havechanged over time. Intraspecific variation in nestling growthoften relates to environmental factors (e.g. Richner, Oppliger& Christe 1993; Keller & van Noordwijk 1994; Thessing 2000;Verboven, Tinbergen & Verhulst 2001). Our study was carriedout in a young mixed deciduous forest reclaimed from theWadden Sea in 1968 and planted 20 years before the start ofour research. Consequently, the increase in breeding densityover the years has coincided with the maturation of the forestand birds might thus have reacted to cues related to thismaturation (e.g. change of food type) by decreasing theirclutch size. Alternatively, other habitat properties (e.g. salinityof water or spring temperature) may have changed overtime causing the decline in population clutch size. Detailedquantification and experimental manipulation of habitatparameters is needed if we want to judge causation because, asit is, any factor changing gradually over time may potentiallybe involved.
Hypothesis 2: density dependence at a landscape scale
The decrease of the population clutch size, of nestling massand of the occurrence of second broods with an increase ofannual population density between years may have resultedfrom a density-dependent process (e.g. review in Both 2000).Yet the fact that we did not find any effects of local densitieson reproductive traits during the nestling phase contrasts withthe experiment conducted by Kluijver in the same species(Liesbosch population; Both 1998b). In that experiment,
both clutch size and nestling growth were lower in the high-density treatment, suggesting that these reproductiveparameters were affected by local competition. Moreover,Both et al. (2000) found that in the Hoge Veluwe population,the brood size maximizing fitness as estimated from broodsize experiments differed with annual breeding density. Theysuggested that optimal density-dependent clutch size wasmostly affected by the effect of density during the nestlingstage.
The absence of an experimental effect on clutch size inour study implies that the density dependence of clutch sizebetween years was not caused by local competition during thereproductive phase (when parents use restricted areas). Thefact that selection on brood size was stabilizing in the HogeVeluwe population (Tinbergen & Daan 1990) whereas it waspositive in the Lauwersmeer population (Tinbergen & Sanz2004; Tinbergen 2005) suggests that brood size was primarilylimited by the amount of food parents can bring to theirchicks in the Hoge Veluwe (Tinbergen & Dietz 1994) but notin the Lauwersmeer. The negative fitness effect of clutchenlargement in the Lauwersmeer (de Heij, van den Hout &Tinbergen 2006) also suggests that the parents were limited inthe incubation phase rather than in the nestling phase in thispopulation. Yet in this study, no effect of experimental localdensities was found on clutch size, which we would expect iffemale condition determined by local competition duringincubation would affect the fitness cost and benefits related toclutch size. We feel that this is an important result because itled us to the idea that competition acting at a landscape scalerather than a local scale could be involved.
To understand how a discrepancy between the effects ofdensity within and between years on clutch size can arise, wedepict in Fig. 6 the relationship between population clutchsize and local density under variable competition levels atthe landscape scale. If competition at the landscape scale isconstant, independent of annual density (only one dotted lineexists, Fig. 6), population clutch size would decrease withlocal density alone. As a consequence, within-year densityvariation and between-year density variation would yieldsimilar patterns. In contrast, if competition at a landscapescale would increase with annual density (represented bydifferent dotted curves relating clutch size to local density,Fig. 6), a discrepancy between the effects of local density(within years) and annual density (between years) wouldappear and may become apparent especially at the lowerdensities. The detection of density dependence may thendepend on the range of densities studied. This is consistentwith our findings.
In the Lauwersmeer population, competition at a landscapescale before or after the nestling phase may thus affect theclutch size-related fitness curve either via a parental or via anoffspring component. In winter or early spring, food availabilityis low and birds can use large foraging areas leaving scope forcompetition at a large scale. Because great tit densities vary inparallel over large geographical areas according to large-scalevariation in winter food abundance (Perrins 1965; Perdeck,Visser & Van Balen 2000; Saether et al. 2007), these birds will

Density dependence of avian clutch size 837
© 2009 The Authors. Journal compilation © 2009 British Ecological Society, Journal of Animal Ecology, 78, 828–838
encounter similar densities in winter or early spring. If thesedensities affect female condition in early spring, and femalecondition in spring affects the clutch size related fitness curve,this may explain why females adjust their clutch size more tolandscape density than to local density. Furthermore, whenspace is limited, the acquisition of a territory can be an importantfactor for population regulation and individual fitness becauseexcluded individuals may not participate in reproduction(Begon, Harper & Townsend 1990). When annual breedingdensity increases, competition for space reduces the recruit-ment chance of juveniles that are subdominant to older birds(Sandell & Smith 1991). Therefore, it might pay for parentsto adjust their clutch size and the number of broods theyproduce to the overall annual breeding density, in anticipation ofthe level of competition that juveniles will experience duringsettling. In this way, they may produce fewer but morecompetitive offspring that are more likely to recruit. Becausenatal dispersal can be considerable (Greenwood & Harvey1982), this effect is likely to play out at a landscape scale.Such effects could provide the selective density dependentforce that is consistent with our findings.
Conclusions
We did not find an experimental effect of local breedingdensity on reproductive parameters of great tits, whereasothers did (Klujver 1951; Dhondt et al. 1992; Both 1998b).However, clutch size of first broods, the proportion of secondbroods, and possibly also fledgling mass, all declined withincreasing annual breeding density. If annual breedingdensity was causing the decline in clutch size of first broods
and the proportion of second broods in our population, in theabsence of local competition we conclude that competitionmust have taken place at a landscape scale before or duringegg laying or after fledging. Competition at a landscape scaleis likely to be a general phenomenon acting simultaneouslywith competition at a local scale, but its relative importancewould depend on ecological settings.
Acknowledgments
We are grateful to André A. Dhondt for his useful feedback on an earlier version ofthe manuscript. We thank Staatsbosbeheer and the ‘Koninklijke Landmacht’for their permission to work in the Lauwersmeer area. We are grateful to all thestudents and field assistants that helped in collecting data from 1993 onwards.We also thank Nicholas P. C. Horrocks for the improvement of the English.Finally, we thank the University of Groningen for funding our project.
References
Arcese, P. & Smith, J.N.M. (1988) Effects of population density and supplementalfood on reproduction in Song Sparrows. Journal of Animal Ecology, 57,119–136.
Begon, M., Harper, J.L. & Townsend, C.R. (1990) Ecology: Individuals,Populations and Communities. Blackwell, Oxford, UK.
Both, C. (1998a) Density dependence of clutch size: habitat heterogeneity orindividual adjustment? Journal of Animal Ecology, 67, 659–666.
Both, C. (1998b) Experimental evidence for density dependence of reproductionin great tits. Journal of Animal Ecology, 67, 667–674.
Both, C. (2000) Density dependence of avian clutch size in resident and migrantspecies: is there a constraint on the predictability of competitor density?Journal of Avian Biology, 31, 412–417.
Both, C. & Visser, M.E. (2000) Breeding territory size affects fitness: anexperimental study on competition at the individual level. Journal of AnimalEcology, 69, 1021–1030.
Both, C., Tinbergen, J.M. & Van Noordwijk, A.J. (1998) Offspring fitness andindividual optimization of clutch size. Proceedings of the Royal Society B:Biological Sciences, 265, 2303–2307.
Both, C., Tinbergen, J.M. & Visser, M.E. (2000) Adaptive density dependenceof avian clutch size. Ecology, 81, 3391–3403.
de Heij, M.E., van den Hout, P.J. & Tinbergen, J.M. (2006) Fitness cost ofincubation in great tits (Parus major) is related to clutch size. Proceedings ofthe Royal Society B: Biological Sciences, 273, 2353–2361.
Dhondt, A.A., Kempenaers, B. & Adriaensen, F. (1992) Density-dependentclutch size caused by habitat heterogeneity. Journal of Animal Ecology, 61,643–648.
Drent, P.J. (1984) Mortality and dispersal in summer and its consequencesfor the density of great tits Parus major at the onset of autumn. Ardea, 72,127–162.
Fletcher, R.J. (2007) Species interactions and population density mediatethe use of social cues for habitat selection. Journal of Animal Ecology, 76,598–606.
Greenwood, P.J. & Harvey, P.H. (1982) The natal and breeding dispersal ofbirds. Annual Review of Ecology and Systematics, 13, 1–21.
Keller, L.F. & van Noordwijk, A.J. (1994) Effects of local environmentalconditions on nestling growth in the Great Tit Parus major l. Ardea, 82,349–362.
Kluijver, H.N. (1951) The population ecology of the Great Tit, Parus m. majorL. Ardea, 39, 1–135.
Krebs, J.R. (1970) Territory and breeding density in Great Tit, Parus major l.Ecology, 52, 2–22.
Lack, D. (1966) Population Studies of Birds. Oxford University Press, Oxford, UK.Marra, P.P. & Holmes, R.T. (1997) Avian removal experiments: do they test for
habitat saturation or female availability? Ecology, 78, 947–952.Murdoch, W.W. (1994) Population regulation in theory and practice – the Robert
H. MacArthur award lecture. Ecology, 75, 271–287.Nager, R.G., Ruegger, C. & van Noordwijk, A.J. (1997) Nutrient or energy
limitation on egg formation: a feeding experiment in great tits. Journal ofAnimal Ecology, 66, 495–507.
Newton, I. (1998) Population Limitation in Birds. Academic Press, London.Perdeck, A.C., Visser, M.E. & Van Balen, J.H. (2000) Great tit Parus major
survival, and the beech-crop cycle. Ardea, 88, 99–108.
Fig. 6. Theoretical graph representing the relationship between optimalclutch size (i.e. associated with the highest fitness) and local breedingdensities during the nestling phase under three different levels ofcompetition at a landscape scale (dotted lines). At low densities, clutchsize hardly varies with local density (our within-year effect, solid lines).There is no local competition for food. However, when density increasesat a landscape scale, optimal clutch size decreases (dashed line) becauseof an increase in competition at a larger scale (in our data the between-year effect, dashed line). Variation in the strength of competition atdifferent scales may thus explain a discrepancy between the effects oflocal density (within years) and annual density (between years) onobserved clutch size especially at low local densities.

838 M. Nicolaus et al.
© 2009 The Authors. Journal compilation © 2009 British Ecological Society, Journal of Animal Ecology, 78, 828–838
Perrins, C.M. (1965) Population fluctuations and clutch size in the great tit,Parus major l. Journal of Animal Ecology, 34, 601–647.
Pettifor, R.A., Perrins, C.M. & McCleery, R.H. (1988) Individual optimizationof clutch size in great tits. Nature, 336, 160–162.
Pettifor, R.A., Perrins, C.M. & McCleery, R. (2001) The individual optimizationof fitness: variation in reproductive output, including clutch size, meannestling mass and offspring recruitment, in manipulated broods of great titsParus major. Journal of Animal Ecology, 70, 62–79.
Rasbash, J., Steele, F., Browne, W. & Prosser, B. (2004) A User’s Guide tomlwin. Institute of Education, London.
Richner, H., Oppliger, A. & Christe, P. (1993) Effect of an ectoparasite onreproduction in great tits. Journal of Animal Ecology, 62, 703–710.
Saether, B.E., Engen, S., Grotan, V., Fiedler, W., Matthysen, E., Visser, M.E.,Wright, J., Moller, A.P., Adriaensen, F., Van Balen, H., Balmer, D.,Mainwaring, M.C., McCleery, R.H., Pampus, M. & Winkel, W. (2007) Theextended Moran effect and large-scale synchronous fluctuations in thesize of great tit and blue tit populations. Journal of Animal Ecology, 76, 315–325.
Sandell, M. & Smith, H.G. (1991) Dominance, prior occupancy, and winterresidency in the great tit (Parus major). Behavioral Ecology and Sociobiology,29, 147–152.
Sillett, T.S., Rodenhouse, N.L. & Holmes, R.T. (2004) Experimentally reducingneighbor density affects reproduction and behavior of a migratory songbird.Ecology, 85, 2467–2477.
Sinclair, A.R.E. (1989) Population regulation in animals. Ecological Concepts(ed. J.M. Cherrett), pp. 197–241. Blackwell, Oxford.
Soler, M. & Soler, J.J. (1996) Effects of experimental food provisioning onreproduction in the Jackdaw Corvus monedula, a semi-colonial species. Ibis,138, 377–383.
Thessing, A. (2000) Growth and final size of willow tit Parus montanus underdifferent environmental conditions. Ardea, 88, 215–224.
Tinbergen, J.M. (2005) Biased estimates of fitness consequences of brood size
manipulation through correlated effects on natal dispersal. Journal ofAnimal Ecology, 74, 1112–1120.
Tinbergen, J.M. & Both, C. (1999) Is clutch size individually optimized?Behavioral Ecology, 10, 504–509.
Tinbergen, J.M. & Daan, S. (1990) Family planning in the great tit (Parusmajor) – optimal clutch size as integration of parents and offspring fitness.Behaviour, 114, 161–190.
Tinbergen, J.M. & Dietz, M.W. (1994) Parental energy expenditure duringbrood rearing in the great tit (Parus major) in relation to body mass,temperature, food availability and clutch size. Functional Ecology, 8,563–572.
Tinbergen, J.M. & Sanz, J. (2004) Strong evidence for selection for larger broodsize in a great tit population. Behavioral Ecology, 15, 525–533.
Tompa, F.S. (1967) Reproductive success in relation to breeding density in piedflycatchers, Ficedula hypoleuca. Acta Zoologici Fennici, 118, 1–28.
Török, J. & Toth, L. (1988) Density dependence in reproduction of the collaredflycatcher (Ficedula albicollis) at high population levels. Journal of AnimalEcology, 57, 251–258.
Verboven, N., Tinbergen, J.M. & Verhulst, S. (2001) Food, reproductive successand multiple breeding in the great tit Parus major. Ardea, 89, 387–406.
Verhulst, S. (1992) Effects of density, beech crop and winter feeding on survivalof juvenile great tits; an analysis of Kluyver’s removal experiment. Ardea, 80,285–292.
Watson, A. & Jenkins, D. (1968) Experiments on population control byterritorial behaviour in red grouse. Journal of Animal Ecology, 37, 595–&.
Wilkin, T.A., Garant, D., Gosler, A.G. & Sheldon, B.C. (2006) Densityeffects on life-history traits in a wild population of the great tit Parus major:analyses of long-term data with GIS techniques. Journal of Animal Ecology, 75,604–615.
Received 23 September 2008; accepted 2 February 2009Handling Editor: Simon Butler