Embed Size (px)
Citation preview

ABVABVc
NYSE
No Boundaries to GrowthNo Boundaries to GrowthJune 2005

2ABVABVc
NYSE
ContentsNo Boundaries to Growth
AmBev Overview
2004, A Crucial Year
Culture, Values and Pillars
Growth Opportunities
1Q 2005, A Good Start

3ABVABVc
NYSE
2004 Highlights
109MM HL of beverages sold
US$1,551 million EBITDA (R$4,537 million)
37.8% EBITDA margin
Operations in 13 countries
Dominant position in Brazil, Argentina, Bolivia, Paraguayand Uruguay
Skol (leader in the Brazilian market) is the world’s thirdlargest selling brand
AmBev is PepsiCo’s largest bottller outside the US
~US$15 billion market cap
AmBev Overview

4ABVABVc
NYSE
TimelineAmBev Overview
Brahma Turnaround
AmBevCreation
Quinsa/AmBev
LatamExpansion
FromPatagoniato Alaska
89 99 02 03 04

5ABVABVc
NYSE
1989~99 – Turnaround of Brahma brewerAmBev Overview
Brahma NYSE listing (1996)Volume CAGR of 5.6%EBITDA CAGR of 30.9%
Cost Reduction, Production Expertise& Marketing Know-How
First steps abroad (1994)
Skol and Brahma brands established as the leaders in BrazilMarket share stable at 50.0%
Beer Brazil generated +95.0% of consolidated EBITDA
EBITDA margin expansion of 1,910bps
DownsizingDistribution network restructuringBrahma #1 & Skol Goes Down Roundlymarketing campaigns
6ABVABVc
NYSE
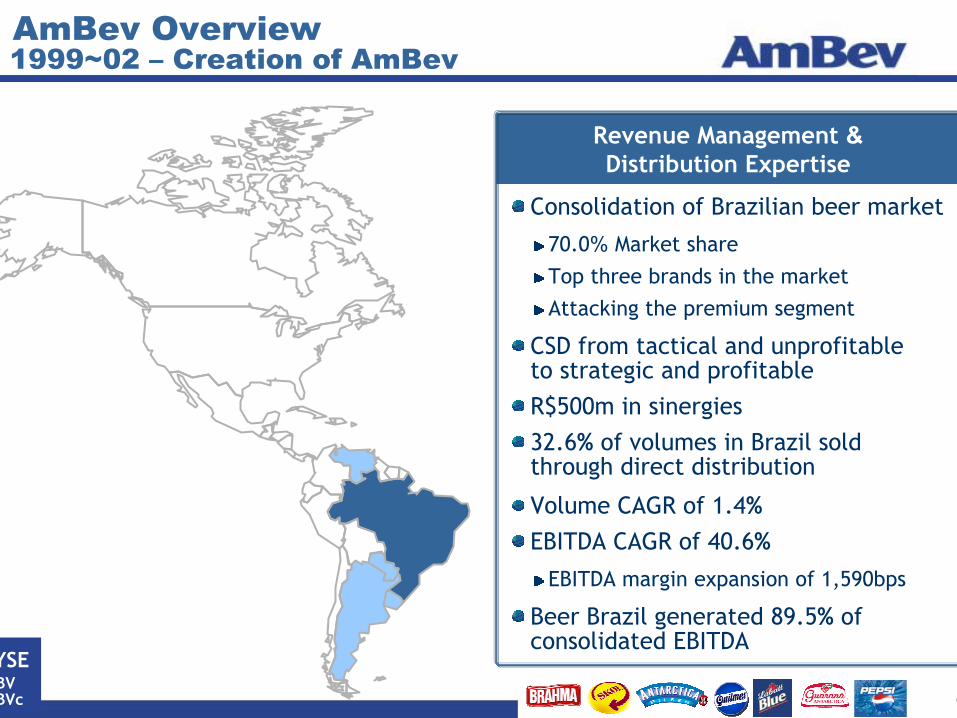
1999~02 – Creation of AmBevAmBev Overview
EBITDA margin expansion of 1,590bps
Revenue Management &Distribution Expertise
Consolidation of Brazilian beer market
70.0% Market shareTop three brands in the marketAttacking the premium segment
Volume CAGR of 1.4%EBITDA CAGR of 40.6%
Beer Brazil generated 89.5% of consolidated EBITDA
CSD from tactical and unprofitableto strategic and profitableR$500m in sinergies32.6% of volumes in Brazil soldthrough direct distribution

7ABVABVc
NYSE
2002~03 – Quinsa-AmBev business combinationAmBev Overview
Beer and CSD together94.4 million HL of beverages soldin 2003Beer Brazil generated 81.4% ofconsolidated EBITDA
Scale & Best Practices
2003 pro forma EBITDA growth of108.0% in the Southern Cone regionMore sinergies and fasterimplementation
Leading brewer in Argentina, Bolívia, Paraguay and Uruguay
Consolidation of the Southern Cone beer market

8ABVABVc
NYSE
2003~04 – Expansion throughout LatamAmBev Overview
Four new operations in theNorth of Latin America
Growth
Significant market share gain
Best practices standardized
EBITDA margin expansion of 1,400 bps to 29.3% in theBrazilian Soft Drinks business
43.7% of volumes in Brazil soldthrough direct distribution
Beer Brazil generated 63.9% ofconsolidated EBITDA
Revenue pool equivalent to~US$3 bn per yearLeverage of Pepsi distribution system

9ABVABVc
NYSE
2004 – The American Beverage CompanyAmBev Overview
Cost reduction through benchmarking
Cross licensing agreements with InBev
Best Practices & Sinergies
Merger of Labatt’s operationsinto AmBev
One of the highest net sales/hl
Growth in a mature market
~30% of pro forma consolidatedEBITDA generated in hard currency
Significant potential for earnings growth
Investment grade rating granted by S&PImproved balance sheet
Beer Brazil generated 63.9% ofconsolidated EBITDA

10ABVABVc
NYSE
2004 Highlights
109MM HL of beverages sold
US$1,551 million EBITDA (R$4,537 million)
37.8% EBITDA margin
Operations in 13 countries
Dominant position in Brazil, Argentina, Bolivia, Paraguayand Uruguay
Skol (leader in the Brazilian market) is the world’s thirdlargest selling brand
AmBev is PepsiCo’s largest bottller outside the US
~US$15 billion market cap
AmBev Overview

11ABVABVc
NYSE
62%
63%
64%
65%
66%
67%
68%
69%
70%
71%
jan/01 jan/02 jan/03 jan/04 jan/05
Dominance reaffirmed in Brazil
Our culture has been the key driver to both maximizing opportunities and quickly
rebounding from trouble
2004, A Crucial Year
Sucess achieved throughdisciplined operations
Market shareback at 68.2%
DiagnosisDiagnosis
LearningsLearnings
ActionsActions
TargetRange

12ABVABVc
NYSE
How we reach our goalsCulture, Values and Pillars
People & Culture
Top Line Growth
Top Line Growth
Excellence in
Distribution
Excellence in
Distribution
Permanent Cost
Reduction
Permanent Cost
ReductionFinancial DisciplineFinancial Discipline
Strategic Pillars
Revenues
(-) COGS
(-) Oper. Exp.
(=) Oper. Profit
PayoutLeverage
Capital Structure

13ABVABVc
NYSE
Talented people, strong culture drive the businessCulture, Values and Pillars
Strong commitment with recruiting, training and developing leaders
“Talents are developed at home”Best peopleBest people
30% to 90% of total compensation linkedto aggressive operating targetsOwnersOwners
220 top executives hold 1.8 billion non voting shares(3,3% of the company)AlignmentAlignment

14ABVABVc
NYSE
“Hands On” Managerial ModelCulture, Values and Pillars
3 Yr Strat Plan+
1 Yr Budget
3 Yr Strat Plan+
1 Yr Budget
Detailed TargetCascading
Detailed TargetCascading
DisciplinedPerformance
Review
DisciplinedPerformance
Review
RESULTS!!
Involvement of the whole senior management
Multi-functional approach
3,000 individual goals + 15,000 collective goals
Monthly performance reviews
Targets are to be achieved, not revised
Corporate targets broken down into detailed operating goals
Commitment built across the whole organization
Action plans required when forecasts indicateunderperformance (“red light”)
In 13 out of 15 years AmBev / Brahma deliveredon stretched targets
15ABVABVc
NYSE
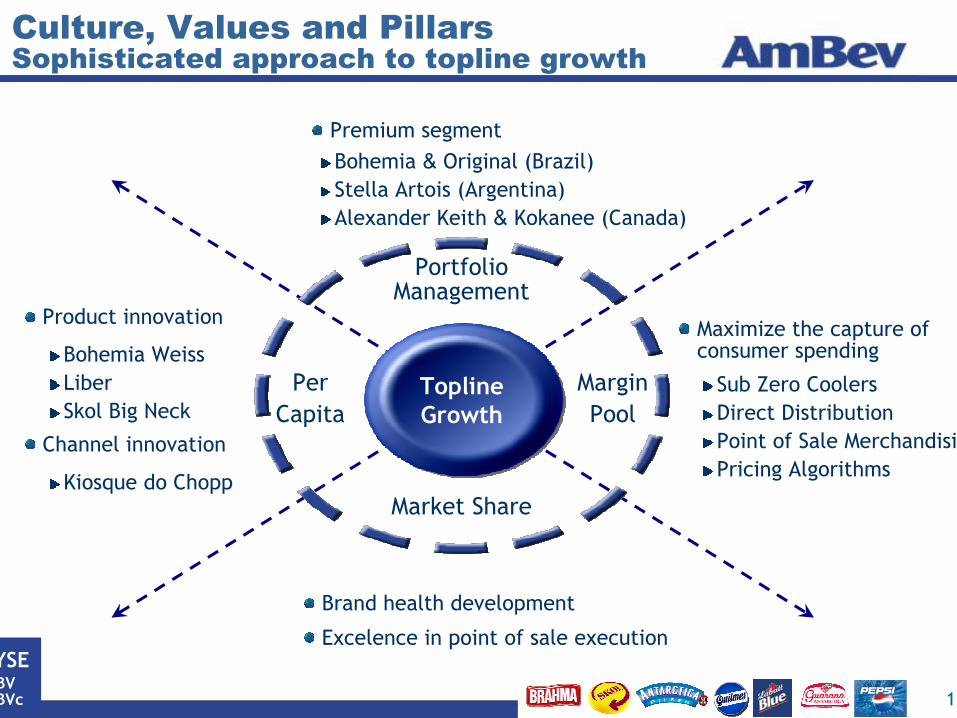
Sophisticated approach to topline growth
Brand health development
Excelence in point of sale execution
Culture, Values and Pillars
Channel innovation
Product innovation
Bohemia WeissLiberSkol Big Neck
Kiosque do Chopp
Sub Zero CoolersDirect DistributionPoint of Sale MerchandisingPricing Algorithms
Maximize the capture of consumer spending
ToplineGrowth
PortfolioManagement
MarginPool
Market Share
PerCapita
Premium segmentBohemia & Original (Brazil)Stella Artois (Argentina)Alexander Keith & Kokanee (Canada)
16ABVABVc
NYSE
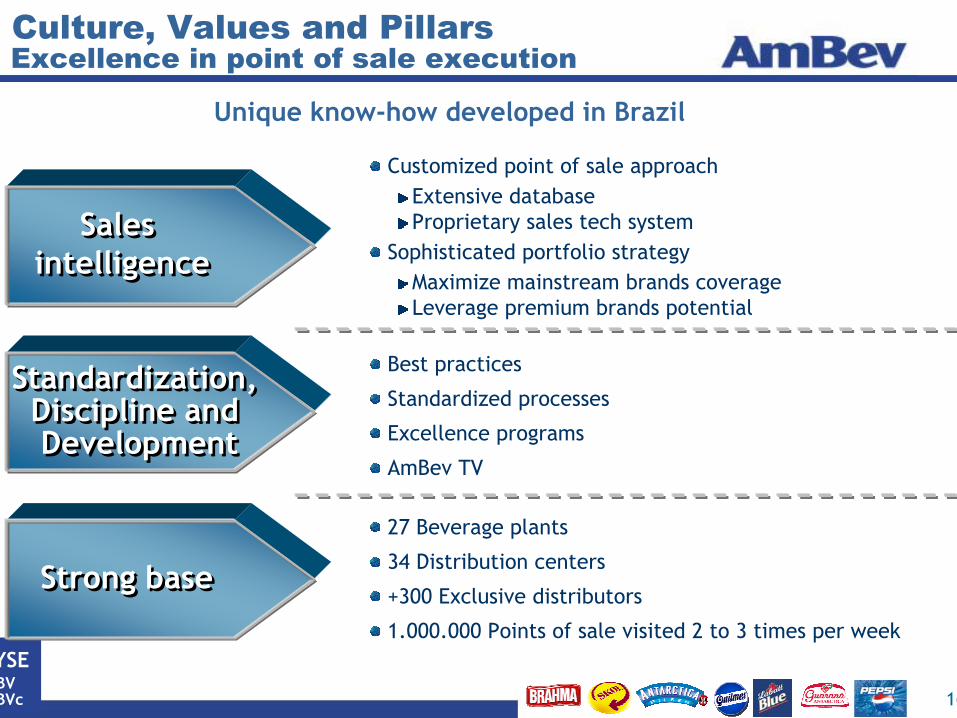
Excellence in point of sale execution
Unique know-how developed in Brazil
Culture, Values and Pillars
Best practices
Standardized processes
Excellence programs
AmBev TV
Standardization, Discipline and Development
Standardization, Discipline and Development
Customized point of sale approach
Sales intelligence
Sales intelligence
Maximize mainstream brands coverageLeverage premium brands potential
Extensive databaseProprietary sales tech system
Sophisticated portfolio strategy
Strong baseStrong base
27 Beverage plants
34 Distribution centers
+300 Exclusive distributors
1.000.000 Points of sale visited 2 to 3 times per week

17ABVABVc
NYSE
Obsessive cost reduction CultureCulture, Values and Pillars
Actual COGS N+1
Management challenge
Hyp. COGS N+1
Commodities
Exchange rate
Inflation
COGS N
“To Be Beaten” approach
Zero tolerance with unnecessaryexpenditures
Detailed mapping of cost andconsumption drivers
Top-down cost reduction targets
ZBB targets eliminatory for bonus payment
Zero Base Budget (ZBB)

18ABVABVc
NYSE
178292 337
502
998
1.327
7 11
247356 313
1.607
1999 2000 2001 2002 2003 2004
Maximizing shareholder returns
Share buyback programs Dividends
R$ Million R$ Million
Culture, Values and Pillars
Payout(% on Net Income)
114%
33%
55%
Stronger Balance Sheet minimizing cash balance requirementBenefiting from Interest on Own Capital (IOC) tax deductibilityResulting in higher dividend yied
1999 2000 2001 2002 2003 2004

19ABVABVc
NYSE
Significant improvement in taxbreak provided by IOC
Well executed tax planning
0%
10%
20%
30%
40%
50%
60%
1Q03 2Q03 3Q03 4Q03 1Q04 2Q04 3Q04 4Q04 1Q05
Effective Income Tax RateEffective Income Tax Rate before GoodwillNominal Rate
Effective Tax Rate beforeGoodwill below 34%
39,0 40,8 35,9 35,7 33,4
71,3
129,6
73,8
37,0
1Q03 2Q03 3Q03 4Q03 1Q04 2Q04 3Q04 4Q04 1Q05
R$ Million
Culture, Values and Pillars

20ABVABVc
NYSE
16,9 16,1 18,9 19,426,1
39,0
50,9
70,9
81,0 83,128,6%
24,7% 23,8%21,1%
27,8% 28,7%30,5%
37,0%35,4%
37,8%
0,0
20,0
40,0
60,0
80,0
100,0
1995 1996 1997 1998 1999 2000 2001 2002 2003 2004
0,0%
5,0%
10,0%
15,0%
20,0%
25,0%
30,0%
35,0%
40,0%
EBITDA per share EBITDA margin
Consistent track record
R$
CAGR: 19,4%
Culture, Values and Pillars

21ABVABVc
NYSE
Best positioned for long term growth
Young and seasoned management team
Growth Opportunities
Leader in Brazil and in the Southern Cone
Solid growth platform in the North of Latin America
Revenue pool larger than US$3 bn per year
Significant potential to earnings growth in Canada
Stronger and smarter after 2003 hit
Good macroeconomic perspectives – GDP, income and employment
Price and Share
US$60m in annual cost reduction identified
Still more of the same (ZBB, Direct Distribution, Margin Pool)

22ABVABVc
NYSE
1Q05 EBITDA Breakdown2005, A Good Start
399
78
67
544
Brazil North America* HILA Total*US$ Million
25.2% 39.3%32.5%45.9%EBITDAmarginEBITDAmargin
41.6% 49.6%24.7%56.6%GrowthGrowth
* Pro forma basis

23ABVABVc
NYSE
No Boundaries to Growth
ABVABVcABVABVc
NYSENYSEAMBV4AMBV3AMBV4AMBV3
BovespaBovespa