Embed Size (px)
Citation preview

Strive • Lead • Excel | To Make a Difference
Report of the Auditor-General No. 9 of 2013-14Auditor-General’s Report on the Financial Statements of State entities
Volume 5
State entities 30 June and 31 December 2013, matters relating to 2012-13 audits and key performance indicators
May 2014
1
2014 PARLIAMENT OF TASMANIA
REPORT OF THE AUDITOR-GENERAL No. 9 of 2013-14
Volume 5
State entities 30 June and 31 December 2013, matters relating to 2012-13 audits and key performance indicators
MAY 2014
Presented to both Houses of Parliament in accordance with the requirements ofSection 29 of the Audit Act 2008
2014 (No. 4)

2
© Crown in Right of the State of Tasmania May 2014
Auditor-General’s reports are available from the Tasmanian Audit Office, Hobart. This report and other recent reports published by the Office can be accessed via the Office’s home page. For further information please contact:
Tasmanian Audit Office
GPO Box 851 Hobart TASMANIA 7001
Phone: (03) 6226 0100, Fax (03) 6226 0199
Email: [email protected]
Home Page: http://www.audit.tas.gov.au
ISSN 1327 2608

3
H M Blake Auditor-General
7 May 2014
President Legislative Council HOBART
Speaker House of Assembly HOBART
Dear Mr President
Dear Madam Speaker
Report of the Auditor-General No. 9 of 2013-14, Auditor-General’s Report on the Financial Statements of State entities, Volume 5 – State entities 30 June and 31 December 2013, matters relating to 2012-13 audits and key performance indicators.
In accordance with the requirements of Section 29 of the Audit Act 2008, I have pleasure in presenting my Report on the audit of the financial statements of state entities 30 June 2013 and 31 December 2013, matters relating to 2012-13 audits and key performance indicators.
Yours sincerely
Level 4, Executive Building, 15 Murray Street, Hobart, Tasmania, 7000Postal Address GPO Box 851, Hobart, Tasmania, 7001
Phone: 03 6226 0100 | Fax: 03 6226 0199Email: [email protected]
Web: www.audit.tas.gov.au
To provide independent assurance to the Parliament and Community on the performance and accountability of the Tasmanian Public sector.Professionalism | Respect | Camaraderie | Continuous Improvement | Customer Focus
Strive | Lead | Excel | To Make a Difference
4 Foreword
forewordThis Report is the fifth and final volume in our series planned for advising Parliament on the outcome of audits for the 2012-13 financial year and the 2013 calendar year (the 2012-13 audit cycle). It deals with two statutory authorities reporting at 30 June 2013 and five State entities which reported at 31 December 2013. The most significant entity covered by this volume is the University of Tasmania which incurred an Underlying Deficit of $9.070m (2012, $28.406m) before tax and non-operating items and a Comprehensive Surplus of $41.391m ($39.422m) for the year ended 31 December 2013.
As it relates to the 2012-13 audit cycle, this Report includes:
• a summary of common audit findings which noted more than 330 audit findings reported to 70 State entities, the most serious of which related to non-current physical assets, expenditure and accounts payable, employee expenses, information systems, revenue and receivables and cash and financing
• a summary outlining the timeliness and quality of financial reporting
• brief information about acquittal audits conducted in relation to natural disaster claims
• an update on new accounting and auditing standards
• audits dispensed with and how we set audit fees for conducting audits of financial statements.
This Report also includes three matters about which separate comment is warranted:
• A trial project my Office has initiated regarding key performance indicators. I note the lack of reporting by selected departments of indicators of efficiency and, in trying to promote the benefits of reporting such information; I recommend a number of efficiency indicators that could be considered for inclusion in annual reports. This trial was initiated following three performance audits about key performance indicators which resulted in little action by departments as it relates to their efficiency. I plan to build on this work in future reports.
• Ministerial Orders issued under the Local Government Act 1993 became effective on 19 February 2014. These deal with audit panels, strategic planning and reporting indicators of financial sustainability. This Chapter was included to outline our approach to these initiatives.
• An audit of the disposal of firearms or ammunition by Tasmania Police under section 149 of the Firearms Act 1996. This Act requires me to annually audit this information and to report thereon to the Parliament. However, audits have not been conducted since 2009 and, while there are records that audits were conducted prior to this, I can find no record of any reporting to Parliament as required by this section. For this I apologise to the Parliament and to the community. Audits are now up to date with findings noted in this Report.
H M Blake
Auditor-General
7 May 2014

5Table of Contents
Table of ConTenTs
foreword 4
key poinTs 6
inTroduCTion 12
reporTing key performanCe indiCaTors - Trial projeCT 14
loCal governmenT minisTerial orders 2014 33
disposal of firearms and ammuniTion 39
Timeliness and qualiTy of finanCial sTaTemenTs 42
findings from 2013 audiTs 44
granT aCquiTTal audiTs 50
basis for seTTing audiT fees 51
audiTs dispensed wiTh 55
aCCounTing and audiTing sTandards - developmenTs in finanCial reporTing 58
31 deCember audiTs 62
Anzac Day Trust 63The Solicitors’ Trust 65Tasmanian Qualif ications Authority 68Theatre Royal Management Board 70University of Tasmania (including University Foundation and AMC Search) 73
30 june audiTs 92
Legal Aid Commission of Tasmania 93 National Trust of Australia (Tasmania) 97
appendix 1 - guide To using This reporT 104
appendix 2 - audiT sTaTus 111
appendix 3 - aCronyms and abbreviaTions 118
appendix 4 - reCenT reporTs 121
vision and purpose 122
6 Key Points
key poinTs
page
reporting key performance indicators – Trial project 14
Tasmania has had an output based budgeting framework since 1997. Despite this there is a lack of public reporting of indicators of efficiency. Other jurisdictions are leading the way.
The Chapter provides suggestions on indicators of efficiency for selected departments.
This trial is aimed at establishing relevant and appropriate efficiency Key Performance Indicators (KPIs) for reporting by departments.
Recommendation
We recommend that all departments consider the indicators in this Chapter or design other suitable indicators of efficiency for inclusion in budget papers and annual reports.
All departments have responded to our recommendation and their individual responses are included in the Chapter.
local government ministerial orders 2014 33
In February 2014, Orders were gazetted requiring local government councils to establish audit panels, develop long-term financial and long-term asset management strategies, policies and plans and report certain financial sustainability indicators in the notes to annual financial statements.
The financial sustainability indicators must be included in the notes to annual financial statements at 30 June 2014.
Other than the Asset renewal funding ratio, we will audit reported financial sustainability indicators at 30 June 2014.
In the case of the Asset renewal funding ratio, where reported, we will ensure these are in line with approved long-term financial and long-term asset management plans but we will not form an audit opinion on this ratio.
We anticipate that where a council does not report the Asset renewal funding ratio, reasons will be provided along with details as to when compliance will be achieved.
We anticipate that councils will set targets for each financial sustainability indicator and explain variations from target.
We anticipate that information about financial sustainability indicators will include trend data over more than two financial periods.

7Key Points
disposal of firearms and ammunition 39
We found the actual processes and control activities leading to the disposal of firearms to be appropriate and based on our audit work we concluded the requirements of the Firearms Act 1996 in relation to the disposal of firearms were complied with.
The current practice of recording the quantity of ammunition was inadequate and were not able to conclude on compliance with the Firearms Act 1996 in relation to the disposal of ammunition.
Recommendations
We made the following recommendations to the Department of Police and Emergency Management:
• it should review its current processes with the view to implementing a practical control over the recording of ammunition, which would address the risk of ammunition being inadvertently misplaced or lost through theft or fraud
• it should develop formal policies and procedures which would address all activities leading to the disposal of firearms and ammunition
• it should ensure that controls around the disposal of firearms and ammunition are monitored through a combination of ongoing activities and separate evaluations.
The Department accepted our recommendations and its response is included in the Chapter.
Timeliness and quality of financial statements 42
During the 2012-13 audit cycle, nine State entities failed to meet the statutory deadline of submitting their signed annual financial statements for audit within 45 days from the end of the financial year.
One set of financial statements submitted for audit was rejected.
On the whole the quality of financial reports initially submitted was of a high standard.
findings from 2013 audits 44
In excess of 330 audit matters were raised, with recommendations made to 70 State entities during the 2012-13 financial audit cycle.
The majority of matters raised related to non-current physical assets, expenditure and accounts payable, employee expenses, information systems, revenue and receivables and cash and financing.
The use of residual values for long-lived infrastructure assets in local government councils were reviewed by an independent expert and reported in Report of the Auditor-General No. 5 2013-14 Infrastructure Financial Accounting in Local Government tabled in December 2013. The Report concluded that the manner in which some local government councils used residual values did not comply with accounting standards. That report made 23 recommendations relating to long-lived infrastructure management.

8 Key Points
The use of cloud computing by a State entity appeared to provide efficiencies, but there were aspects of the application that were unknown by the entity. We recommended completion of full risk assessments prior to implementing this product.
grant acquittal audits 50
The Auditor-General is responsible for audits of numerous grant acquittal financial statements. These audits are carried out in addition to audits of the annual financial statements of State entities.
An audit of the State claim to the Australian Government under the Natural Disaster Relief and Recovery Arrangements for costs incurred relating to the January 2013 bushfires was completed on 8 April 2014.
basis for setting fees 51
Fees, and the accountable authority liable to pay the fee for financial audits, are determined by the Auditor-General pursuant to section 27 of the Audit Act 2008.
Fees are set for each State entity commensurate with the size, complexity and risks of the engagement.
Charge rates are based on the principle of the Office being able to recover its costs of operation. Charge rates comprise two parts, direct salary cost and overhead recovery.
Where circumstances surrounding an engagement have materially changed, additional audit fees may be sought from that State entity.
A matrix (audit fee scale) has been developed to provide a guide for determining the expected time to be taken on an audit. The level of fee, and any change, experienced by individual State entities may vary according to individual circumstances and the risks each entity faces.
dispensed with audits 55
The Auditor-General has the authority to dispense with the audits of State entities, but must consult with the Treasurer prior to granting such dispensation.
Audits are dispensed with on the condition that the relevant State entity annually demonstrates appropriated financial reporting and the existence of appropriate alternative audit arrangements.
In 2012-13, 36 audits were dispensed.
accounting and auditing standards – developments in financial reporting 58
AASB 13 Fair Value Measurement is applicable for financial reporting at 30 June 2014. It clarifies valuation techniques to be applied when reporting assets and liabilities at fair value and will require additional disclosures.
AASB 119 Employee Benefits is also applicable for financial reporting at 30 June 2014. It includes new provisions relating to the valuation of employee leave and defined benefit superannuation obligations.

9Key Points
Entities that have entered into arrangements with subsidiaries or joint entities, or who are not sure of whether or not these arrangements apply, need to familiarise themselves with AASB 10, 11, 12, 127 and 128.
Standards setters are finalising a new standard dealing with Revenue but consideration on a new leasing standard is ongoing.
other state entities – 31 december 2013 62
Anzac Day Trust 63
The Trust had a bank balance of $0.020m at 31 December 2013, which was $0.016m higher than last year. This was mainly due to the payment to Legacy Tasmania approved in 2013, not being made until after 31 December 2013. No payments were made to Legacy clubs in 2013.
The Solicitors’ Trust 65
The Trust earned interest revenue $3.015m (2012, $3.203m).
It distributed $3.671m ($2.534m) to law related entities.
The Trust’s cash balances at 31 December 2013 exceeded the prescribed balance requirements of the Guarantee Fund.
Tasmanian Qualifications Authority 68
The Authority reported an excess of payments over receipts of $0.032m this year, in contrast to the excess receipts over payment of $0.025m in 2012.
Despite the excess payments, at 31 December 2013 it had a cash balance of $0.616m.
Theatre Royal Management Board 70
The Board recorded a Net surplus of $0.050m in 2013, a contrast to the two previous years of Net deficits. This was largely attributed to an increase in ticket sales and decrease in depreciation expense.
At 31 December 2013, the Board’s Net assets totalled $1.353m with its most significant asset being Investments of $2.244m. Its most significant liability was advanced ticket sales of $1.260m.
We noted that banking passwords were being shared between users. This matter has been reported to, and is being addressed by management.
University of Tasmania 73
The University incurred an underlying deficit of $9.070m, 68% better than the 2012 result, and a comprehensive surplus of $41.391m, consistent with 2012.
Commonwealth funding accounted for 66.6% of total revenue, inclusive of investment and capital revenues, in 2013. This remains above the Commonwealth benchmark of ‘not more than’ 65% reliant on the Commonwealth.

10 Key Points
The largest component of expenditure for 2013 was Salary related costs, $298.941m, which represented 59.7% of Total Expenses. These costs increased by 6.4% in 2013 despite insignificant change in total employee numbers. The restructure initiated in 2012 has ensured employee numbers have remained steady while student enrolments have grown 16% over the past two years. However, in the last three months of 2013, FTE declined by more than 100.
At 31 December 2013, the University’s total assets were $1.084bn and its Net Assets amounted to $872.155m, an increase of $92.656m from 2012.
Property, plant and equipment, $665.906m, continued to represent the majority of total assets, comprising 61.4% at 31 December 2013.
Cash, short and long term investments, $341.576m, were also significant, representing 31.5% of total assets at 31 December 2013.
Approval of a ten year unsecured loan of $130.000m with TASCORP for the construction of student accommodation under the National Rent Affordability Scheme (NRAS). The University had not previously had any form of borrowings. The project will be funded by rental income earned, which is partially funded through the Federal Government NRAS scheme and the University are making a $25.000m contribution. However, because Federal funding will not be received until the projects are complete and until rental income is being generated, the University must fund construction in full resulting in the TASCORP loan.
Receipt of $11.000m from the Education Investment Fund for the construction of the Academy of Creative Industries and Performing Arts (ACIPA) centre in Campbell Street, Hobart.
An additional $8.420m was spent on finalising the Menzies Research Institute/Health Sciences Collocation project during 2013.
Further development of the Institute for Marine and Antarctic Studies (IMAS) building. An additional $23.917m was spent during 2013. Practical completion of this project occurred during November 2013, with a total commissioned cost of $44.203m.
Continued development of the Technology One Student Management System (SLIMS) project. A further $9.826m was spent in 2013 and the total amount in work in progress at 31 December 2013 was $20.788m. The total budget for this project is $36.900m with the expectation it will be commissioned in September 2014.
other state entities – 30 june 2013 92
Legal Aid Commission of Tasmania 93
The Commission reported an Underlying Deficit of $1.253m in 2012-13. This was $0.581m higher compared to last year.
Over 90% of the Commission’s funding was provided by Australian and State Governments.
It received $0.780m from The Solicitors’ Trust to fund various projects.

11Key Points
Net Assets totalled $2.520m at 30 June 2013. The Commission had $2.838m in cash at that date.
Total Equity decreased as a result of underlying deficits recorded in the past two years and the Commission needs to closely monitor its financial performance.
The Commission has responded in detail to our observations. Its comments are included in the Chapter.
National Trust of Australia (Tasmania) 97
A qualified audit report was issued on 23 October 2013. The report also included an emphasis of matter paragraph.
A comprehensive deficit of $0.025m was recorded for the year.
The Trust experienced significant cash flow difficulties in recent years and will receive additional financial assistance from the State Government to address its 2013-14 budget deficit.
We continue to recommend the Trust take appropriate action to ensure its restoration appeal liability is fully cash backed.
For the third consecutive year, the Trust failed to comply with Section 17(1) of the Audit Act 2008 by again submitting its financial statements after the statutory deadline.
Recommendations
1. The Trust will need to improve its year end reporting processes to ensure it complies with statutory financial reporting requirements in future.
2. Given the nature of the restoration appeal funds, we continue to recommend the Trust take appropriate action to ensure its restoration appeal liability is fully cash backed.
3. While asset sales and government support will generate cash in the short-term, they are not a long-term solution to the Trust’s cash situation and the Board needs to take action to ensure that it achieves a more sustainable long term solution to its cash flow difficulties.
The Trust has responded in detail to our observations. Its comments are included in the Chapter.
12 Introduction
inTroduCTionThis Report is Volume 5 of our suite of reports outlining audit outcomes and financial analysis resulting from audits of the financial statements of State entities for the 2012-13 and calendar 2013 periods. This is our final report in this series. It contains:
• Key points
• Reporting Key Performance Indicators – trial project
• Local government ministerial orders 2014
• Disposal of firearms and ammunition
• Timeliness and quality of financial statements
• Findings from audits
• Grant acquittal audits
• Basis of setting audit fees
• Audits that were dispensed with
• Accounting and auditing standards - developments in financial reporting
• Analysis of financial information from completed financial statement audits of five State entities with a year end of 31 December 2013
• Analysis of financial information from completed financial statement audits of two State entities reporting for the financial year ended 30 June 2013.
We changed the format and contents of financial analysis chapters this year to shorten the Report and provide a high level summary of key information.
As it relates to chapters dealing with State entities, this Report differs from its equivalent in 2013 with these chapters now comprising:
• snapshot summary of key points at the beginning of each Chapter
• concise outline of key developments and audit findings
• key areas of audit attention and how we addressed those areas during the audit
• greater use of charts to display information previously presented in textual format
• financial statements and analysis tables, where significant, moved into Chapter appendices.
Our Report includes details of individual entity operations and matters raised with entity management during the course of audits, but only where the matter(s) raised warrant it. The rationale for inclusion rests on our perception of the public interest in each point.
All entities addressed in this Report were provided the opportunity to comment on matters raised. Where comments were provided, these are included in individual chapters.
Comments provided are not subject to audit nor the evidentiary standards required in reaching an audit conclusion. Responsibility for the accuracy, fairness and balance of these comments rests solely with those who provided the response or comment.
sTaTus of audiTsAudits of all State entities for the years ended 30 June 2013 and 31 December 2013 have now been completed. Statutory financial reporting outcomes for the entities included in this Report are detailed in the Chapter headed ‘Timeliness and quality of financial statements’.
Unless specifically indicated, comments in this Report were current as at 17 April 2014.

13Introduction
Appendix 2 provides details of the status of the audit of the financial statements of State entities for the 2012-13 and calendar 2013 periods.
resourCesThe total cost of this Report excluding production costs is estimated to be $35 000.

14 Local Government Ministerial Orders 2014
loCal governmenT minisTerial orders 2014
snapshoT• In February 2014 Orders were gazetted requiring local government councils to establish
audit panels, develop long-term financial and long-term asset management strategies, policies and plans and report certain financial sustainability indicators in the notes to annual financial statements.
• The Orders were unclear as to timeframes by when councils are expected to comply although the financial sustainability indicators must be included in the notes to annual financial statements at 30 June 2014.
• The Orders were clear as to the establishment of audit panels and the content of long-term financial and long-term asset management strategies, policies and plans and the financial sustainability indicators to be reported.
• Other than the Asset renewal funding ratio, we will audit reported financial sustainability indicators at 30 June 2014.
• In the case of the Asset renewal funding ratio, where reported, we will ensure these are in line with approved long-term financial and long-term asset management plans but we will not form an audit opinion on this ratio.
• We anticipate that where a council does not report the Asset renewal funding ratio, reasons will be provided along with details as to when compliance will be achieved.
• We anticipate that councils will set targets for each financial sustainability indicator and explain variations from target.
• We anticipate that information about financial sustainability indicators will include trend data over more than two financial periods.
• We will assess, not audit, compliance with the other Orders.
• Any findings will be reported to respective councils and to the Parliament.
our roleWe were consulted during the development of the Orders referred to in this Chapter. However, apart from work we must do as outlined in section 6 of this Chapter, we have no ongoing role. In particular, we play no regulatory function. This is a matter for the Local Government Division in the Department of Premier and Cabinet.
objeCTive behind inClusion of This ChapTer in This reporTIn February 2014, Orders were gazetted requiring local government councils to establish audit panels, develop long-term financial and asset management strategies, policies and plans and report certain financial sustainability indicators (referred to as management indicators) in annual financial statements. These Orders took effect immediately and councils are expected to comply, although, apart from the management indicator which are to be included in 30 June 2014 financial reports, the Orders contain no guidance as to when compliance is to be achieved.
Based on our previous reports we believe it likely that some councils will find it difficult to fully implement all of the new requirements in the short term and probably not by 30 June 2014. For example, our reporting about audit committees and existence of long-term financial and long-term

15Local Government Ministerial Orders 2014
asset management plans indicates some councils will need time to implement these Orders in full. We consider this a reasonable expectation in the circumstances.
The objective behind including this Chapter in this Report is to set out how we will assess council responses to these Orders in the financial year ending 30 June 2014 bearing in mind our above noted ‘reasonable expectation’, and to note our anticipation that all councils will report all of the management indicators which will then be subjected to audit.
However, we expect that by 30 June 2015 all councils will comply in full with all Orders.
baCkgroundFollowing consultation and building on the work of our Office, the Local Government (Miscellaneous Amendments) Act 2013 (Amendment Act) received Royal Assent on 19 November 2013. Part 4 of the Amendment Act requires councils to:
• maintain long-term financial and asset management plans, financial and asset management strategies and an asset management policy
• maintain an audit panel
• report financial and asset management sustainability indicators in their financial statements, and
• provides a power for the Minister for Local Government to make Ministerial Orders outlining the detail and minimum requirements of the financial and asset management reforms detailed above.
Commencement of Part 4 of the Amendment Act was delayed to allow for the development of the Ministerial Orders which outline the detail and minimum requirements of the financial and asset management reforms.
Part 4 of the Amendment Act was proclaimed on 7 February 2014. Subsequently, the then Minister for Local Government made the following Ministerial Orders under Sections 70F, 84 (2A) and 85B of the Local Government Act 1993:
• the Local Government (Contents of Plans and Strategies) Order 2014
• the Local Government (Audit Panels) Order 2014 and
• the Local Government (Management Indicators) Order 2014.
These Orders were effective on the day of their gazettal which occurred on 19 February 2014.
primary funCTions or purposeThe primary purpose and or functions of each order are:
audit panelsClause 4 of Local Government (Audit Panels) Order 2014 notes the following matters that an audit panel is to consider as part of keeping relevant council’s performance under review:
(a) whether the annual financial statements of the council accurately represent the state of affairs of the council;
(b) whether and how strategic plan, an annual plan, a long-term financial management plan or a long-term strategic asset management plan of a council are integrated and the processes by which, and assumptions under which, those plans were prepared;
(c) the accounting, internal control, anti-fraud, anti-corruption and risk management policies, systems and controls that the council has in relation to safeguarding its long-term financial position;

16 Local Government Ministerial Orders 2014
(d) whether the council is complying with the provisions of the Act and any other relevant legislation;
(e) whether the council has taken any action in relation to previous recommendations provided by the audit panel to the council and, if it has so taken action, what that action was and its effectiveness.
Contents of plans and strategiesThis Order outlines required content and strategies of the following plans, which must be prepared under sections 70 and 70A to 70E of the Act:
(a) long-term financial management plan
(b) financial management strategy
(c) long-term strategic asset management plan
(d) asset management policy
(e) asset management strategy.
It also details those classes of assets that are referred to as major assets for purposes of section 70 of the Act.
management indicators (referred to by us as financial sustainability indicators)Section 84 subsection (2A) authorises that the Minister, by order, may specify that annual financial statements of councils include:
(a) financial management indicators; and
(b) asset management indicators.
The Order requires inclusion of the following indicators in the notes to the annual financial statements of each council:
• asset consumption ratio
• asset renewal funding ratio
• asset sustainability ratio
• net financial liabilities
• net financial liabilities ratio
• underlying surplus or deficit
• underlying surplus ratio.
Appendix 1 to this Chapter provides a definition of each of these indicators.
whaT CounCils will need To doaudit panelsTwo situations are evident:
1. Those councils that have already established audit committees will need, assuming they have not already done so, to ensure their charters, member appointment, meeting and annual work plan arrangements satisfy the new Order.

17Local Government Ministerial Orders 2014
2. Those councils who currently have no audit committees in place, of which at 30 June 2013 there were a number, will need to take steps to appoint committees/panels in line with the Order.
plans and strategiesAgain, two situations are evident:
1. Those councils that have already developed the required strategies, policies and plans will, if they have not already done so, need to ensure these are integrated and approved by respective audit panels.
2. Those councils who currently have no strategies, policies and plans in place, will need to take steps to ensure these documents are in line with the Order.
financial sustainability (management) indicatorsCouncils will need to calculate these ratios and include them in the notes to the annual financial statements signed by their general managers and presented for audit commencing 30 June 2014. Where, due to the possible lack of long-term asset management of financial management plans for example, councils are unable to calculate all ratios, we anticipate reasons for this will be provided along with steps as to actions being taken to address this.
whaT we will need To doAuditing standard ASA 250 Consideration of Laws and Regulations in relation to an Audit of a Financial Report requires notes that the objectives of the auditor are (our emphasis by underlining):
(a) To obtain sufficient appropriate audit evidence regarding compliance with the provisions of those laws and regulations generally recognised to have a direct effect on the determination of material amounts and disclosures in the financial report;
(b) To perform specified audit procedures to help identify instances of non-compliance with other laws and regulations that may have a material effect on the financial report; and
(c) To respond appropriately to non-compliance or suspected non-compliance with laws and regulations identified during the audit.
This standard defines non-compliance as (our emphasis by underlining):
acts of omission or commission by the entity, either intentional or unintentional, which are contrary to the prevailing laws or regulations. Such acts include transactions entered into by, or in the name of, the entity, or on its behalf, by those charged with governance, management or employees. Non- compliance does not include personal misconduct (unrelated to the business activities of the entity) by those charged with governance, management or employees of the entity.
The three Orders will have the following impacts on our audits for the year ending 30 June 2014:
• audit panels – it is our expectation that by 30 June 2014 all councils will have established, or will have progressed establishment of, audit (or equivalent) panels with charters consistent with the Order. Where we find that this is not the case, we will report to the council and to Parliament accordingly. However, non-compliance will not impact our audit opinion on the financial statements.
• content of plans, policies and strategies – page 38 in Report of the Auditor-General No. 4 of 2012-13 Auditor-General’s Report on the Financial Statements of State Volume 3 Part I Local Government Authorities 2012-13 notes that at 30 June 2013 seven councils had not developed long-term asset management plans and four had not developed long-term financial management plans. However, and as indicated in that Report, developed plans had not been audited.1
1. That report did not address the existence of asset management or financial management policies or strategies
nor did it set out to.

18 Local Government Ministerial Orders 2014
It is not our intention to audit long-term asset management or financial management plan. These are ‘forward looking’ with our focus being on ‘historical’ financial information. However, our audits for the 2013-14 financial year will:
○ inquire into the existence of these plans or progress towards their development
○ establish whether they have been reviewed and reported on (reported to council) by audit panels (the Audit Panels Order makes this a requirement)
○ inquire into the extent of reporting by management on compliance with, achievement of, these plans and evidence their regular review and update.
Our findings will be reported to councils and to Parliament. However, other than any potential impacts on the asset renewal funding ratio referred to below, non-compliance will not impact our audit opinion on the financial statements.
• Management indicators – our reports to Parliament regarding councils have for some time now included all of the indicators required by this Order and we anticipate, other than for the asset renewal funding ratio, that councils will report all of these indicators in the notes to their 2013-14 financial statements. We will then audit these indicators and form an opinion on them along with our opinion on the financial statements as a whole. Any non-compliance, which we expect will be rare, will be reported to respective councils and to Parliament. Where there is non-compliance, we will also assess the materiality thereof and any implications of our audit opinion.
Asset renewal funding ratio – this is a ‘forward looking’ ratio requiring completion of long-term asset management and long-term financial management plans at least for the next ten years. As noted in the previous dot point, we will inquire into the existence of these plans, their adoption and so on. We will also ensure the mathematical accuracy of the plans but we will not attempt to form a view regarding other matters such as assumptions and judgements made, priorities chosen, systems implemented, etc. As a result, our audit report will include the following sentence:
My audit is not designed to provide assurance on the accuracy and appropriateness of the budget information or the asset renewal funding ratio in Council’s financial report.
However, we will test the calculation of the ratio.
The outcomes of our work will be reported to respective councils and to the Parliament. We anticipate instances where, due to lack of long-term asset management and long-term financial management plans some councils may not report the asset renewal funding ratio. Where we find this is the case, we:
○ anticipate that reasons for not calculating the ratio will be provided along with details as to when it will be included
○ will report to the council and to Parliament accordingly. However, non-compliance will not impact our audit opinion on the financial statements.
our expeCTaTions regarding The managemenT indiCaTorsIn the previous section we note our approach to auditing the financial sustainability indicators required to be reported annually. While not a requirement of the Management Indicators Order, we anticipate that, in order for alderman, councillors and general managers to be fully responsible for the governance and accountability of their respective councils, they set targets for each ratio and explain achievements both better and worse than target.
In addition, we anticipate that:
• targets be set in line with those established by the Institute of Public Works Engineers. Doing this ensures councils set similar targets which are based on those recommended by an independent body.
• councils include in their financial statements comparative performance over periods longer than two years.
19Local Government Ministerial Orders 2014
our expeCTaTions regarding ComplianCe wiTh all Three orders in 2014-15 and subsequenT yearsIt is our expectation that by 30 June 2015 all councils will have complied with all three Orders in full.
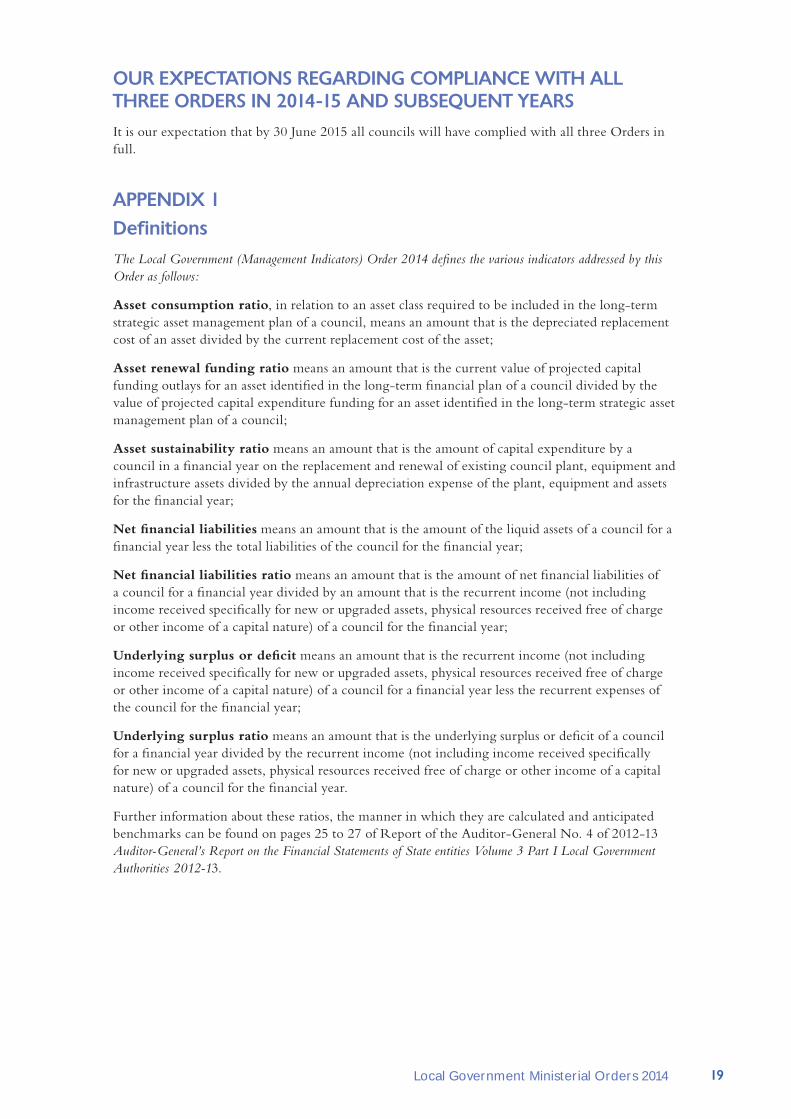
appendix 1definitionsThe Local Government (Management Indicators) Order 2014 defines the various indicators addressed by this Order as follows:
Asset consumption ratio, in relation to an asset class required to be included in the long-term strategic asset management plan of a council, means an amount that is the depreciated replacement cost of an asset divided by the current replacement cost of the asset;
Asset renewal funding ratio means an amount that is the current value of projected capital funding outlays for an asset identified in the long-term financial plan of a council divided by the value of projected capital expenditure funding for an asset identified in the long-term strategic asset management plan of a council;
Asset sustainability ratio means an amount that is the amount of capital expenditure by a council in a financial year on the replacement and renewal of existing council plant, equipment and infrastructure assets divided by the annual depreciation expense of the plant, equipment and assets for the financial year;
Net financial liabilities means an amount that is the amount of the liquid assets of a council for a financial year less the total liabilities of the council for the financial year;
Net financial liabilities ratio means an amount that is the amount of net financial liabilities of a council for a financial year divided by an amount that is the recurrent income (not including income received specifically for new or upgraded assets, physical resources received free of charge or other income of a capital nature) of a council for the financial year;
Underlying surplus or deficit means an amount that is the recurrent income (not including income received specifically for new or upgraded assets, physical resources received free of charge or other income of a capital nature) of a council for a financial year less the recurrent expenses of the council for the financial year;
Underlying surplus ratio means an amount that is the underlying surplus or deficit of a council for a financial year divided by the recurrent income (not including income received specifically for new or upgraded assets, physical resources received free of charge or other income of a capital nature) of a council for the financial year.
Further information about these ratios, the manner in which they are calculated and anticipated benchmarks can be found on pages 25 to 27 of Report of the Auditor-General No. 4 of 2012-13 Auditor-General’s Report on the Financial Statements of State entities Volume 3 Part I Local Government Authorities 2012-13.
20 Reporting Key Performance Indicators - Trial Project
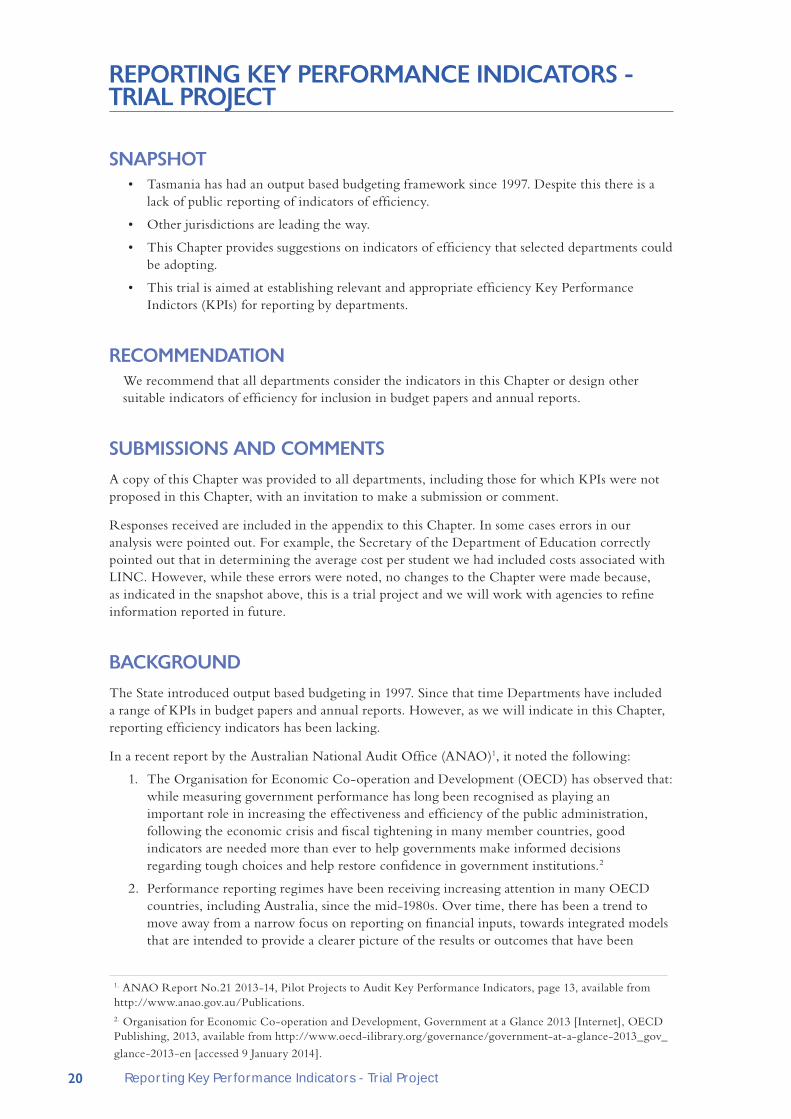
reporTing key performanCe indiCaTors - Trial projeCT
snapshoT• Tasmania has had an output based budgeting framework since 1997. Despite this there is a
lack of public reporting of indicators of efficiency.
• Other jurisdictions are leading the way.
• This Chapter provides suggestions on indicators of efficiency that selected departments could be adopting.
• This trial is aimed at establishing relevant and appropriate efficiency Key Performance Indictors (KPIs) for reporting by departments.
reCommendaTionWe recommend that all departments consider the indicators in this Chapter or design other suitable indicators of efficiency for inclusion in budget papers and annual reports.
submissions and CommenTsA copy of this Chapter was provided to all departments, including those for which KPIs were not proposed in this Chapter, with an invitation to make a submission or comment.
Responses received are included in the appendix to this Chapter. In some cases errors in our analysis were pointed out. For example, the Secretary of the Department of Education correctly pointed out that in determining the average cost per student we had included costs associated with LINC. However, while these errors were noted, no changes to the Chapter were made because, as indicated in the snapshot above, this is a trial project and we will work with agencies to refine information reported in future.
baCkgroundThe State introduced output based budgeting in 1997. Since that time Departments have included a range of KPIs in budget papers and annual reports. However, as we will indicate in this Chapter, reporting efficiency indicators has been lacking.
In a recent report by the Australian National Audit Office (ANAO)1, it noted the following:
1. The Organisation for Economic Co-operation and Development (OECD) has observed that: while measuring government performance has long been recognised as playing an important role in increasing the effectiveness and efficiency of the public administration, following the economic crisis and fiscal tightening in many member countries, good indicators are needed more than ever to help governments make informed decisions regarding tough choices and help restore confidence in government institutions.2
2. Performance reporting regimes have been receiving increasing attention in many OECD countries, including Australia, since the mid-1980s. Over time, there has been a trend to move away from a narrow focus on reporting on financial inputs, towards integrated models that are intended to provide a clearer picture of the results or outcomes that have been
1. ANAO Report No.21 2013-14, Pilot Projects to Audit Key Performance Indicators, page 13, available from http://www.anao.gov.au/Publications.2. Organisation for Economic Co-operation and Development, Government at a Glance 2013 [Internet], OECD Publishing, 2013, available from http://www.oecd-ilibrary.org/governance/government-at-a-glance-2013_gov_
glance-2013-en [accessed 9 January 2014].

21Reporting Key Performance Indicators - Trial Project
achieved from the expenditure of public money – in other words, whether the outcomes or the impacts sought by government are being realised. With the current focus on budget and policy priorities, performance information, particularly concerning the impact of government policies where such information is available, can be expected to be a key input into decisions by both government and government agencies.
3. Measuring the impact of programs, or outcomes, can have many benefits and provides performance information that measurement of inputs (resources invested) and outputs (deliverables) alone cannot. Importantly, outcome measurement provides information about the effectiveness of programs or services and supports the longer-term evaluation of programs. In addition, performance information can also inform decisions on the efficiently of delivery models adopted to achieve desired policy outcomes.
4. In essence, performance measurement can:
○ help clarify government objectives and responsibilities;
○ promote analysis of the relationships between agencies;
○ make performance more transparent, and enhance accountability;
○ provide governments with indicators of their policy and program performance over time;
○ inform the wider community about government performance; and
○ encourage ongoing performance improvements in service delivery and effectiveness, by highlighting improvements and innovation.3
We concur with these observations.
inTroduCTionWe have carried out performance audits of reported KPIs in recent years as follows:
• Special Report No.72 - Public sector performance information, April 2008. This report noted improvements were needed in reporting of indicators of efficiency and effectiveness and our expectation that, consistent with the State’s output based funding model, departments would annually report relevant and appropriate indicators of their effectiveness and efficiency.
• Special Report No. 92 - Public sector productivity a ten year comparison, October 2010. In the Forword to that report the Auditor-General noted: ‘At the same time, difficult though this may be, there is I believe a need for the public sector to be able to demonstrate how productive or efficient it is in providing its services and functions. Of relevance is that efficiency is not only about ‘cost’ — a service can cost more but be more efficient. Also of relevance is the need to balance accessibility of public services and their costs particularly in education and health.’
• Report No.11 of 2012-13, Volume 5, Other State entities 30 June 2012 and 31 December 2012 included a Chapter on the Department of Health and Human Services’ output based expenditure. It highlighted the shift from input to output based reporting by departments and the need for them to establish relevant and appropriate indicators of efficiency, effectiveness and access (or equity) and targets to be attained.
That report included the following recommendation:
‘That Tasmanian State entities be required to annually report relevant and appropriate indicators of their effectiveness and efficiency and that these be audited.’
It is disappointing that despite these reports, there has been little take-up by departments in reporting their efficiency.
3. Steering Committee for the Review of Government Service Provision, Report on Government Services 2014, Volume A: Approach to performance reporting, Productivity Commission, Canberra 2014, P.1.4.

22 Reporting Key Performance Indicators - Trial Project
publiC aCCounTs CommiTTee (paC)The PAC followed-up Special Report 72 and in its 2013 report recommended that a framework be implemented supporting and mandating the Auditor-General to annually audit the KPIs of an Agency disclosed in the Agency’s annual report.
We support this recommendation but note that it has not, to date, resulted in action.
praCTiCes in oTher ausTralian jurisdiCTionsThe reporting of KPIs in other jurisdictions and levels of government is at varying stages of development. At the Commonwealth level, the Productivity Commission each year issues its Report on Government Services (ROGS). However, while ROGs is an excellent report, information reported can be, for good reasons, 12 months or more later than annual reports prepared by agencies. In addition, the ANAO has now completed two reports on this subject being;
• Report No.28 2012-13 The Australian Government Performance Measurement and Reporting Framework, Pilot Project to Audit Key Performance Indicators
• Report No.21 2013-14 Pilot Project to Audit Key Performance Indicators
At the State level, Western Australia has a mature KPI reporting environment, having reported KPIs across all its agencies and departments for approximately twenty years. In that jurisdiction, reporting relevant and appropriate KPIs is compulsory and they are subject to audit. Reporting KPIs in selected sectors also occurs in Queensland and Victoria.
At the local government level, all Tasmanian councils will, for the year ending 30 June 2014, be required to disclose in their annual financial report certain financial and asset management indicators. (Refer to the Local Government Ministerial Orders 2014 Chapter in this Report)
reporTing frameworkOne of the biggest inhibitors to performance reporting is the lack of a generally recognised reporting framework. The International Public Sector Accounting Standards Board (IPSASB) has recognised this deficiency and is currently researching improvements in reporting performance information. An exposure draft presenting a proposed Recommended Practice Guide is currently seeking comments which close on 31 May 2014 meaning that it is likely to be some time before the Guide is issued.
However, while formal guidance in Australian jurisdictions may be some time off; the IPSASB has recognised that users are seeking service performance information to enhance decision-making.
developmenTs in TasmaniaIn addition to the existing Outputs Based Budgeting framework in Tasmania, two other programs are relevant.
statsmatter programTasmanian Government agencies are currently working towards building more robust data and statistical information for critical decisions to direct resources and services. The ‘StatsMatter’ program is managed by the Departments of Premier and Cabinet (DPAC) and the Department of Treasury and Finance (Treasury) in collaboration with other agencies. It recognises that ‘Government decisions are underpinned by accessible, high quality and relevant statistical and special data.’ The development and reporting of KPIs by agencies are one of the indicators of success of the program.

23Reporting Key Performance Indicators - Trial Project
performance contractsAnother project under way is the development of KPIs to inform Heads of Agencies’ performance agreements.
Current reportingAlso, we note that departments have included KPIs:
• in budget papers although the focus has been on indicators of effectiveness
• in annual reports but again focussing on effectiveness.
work we have been doingIn addition to the reports to Parliament on this subject referred to in the introduction to this Chapter, and in the absence of reporting by government departments of efficiency indicators, in the first half of financial year 2013-14 we conducted a research project aimed at establishing what we regarded as relatively straightforward efficiency KPIs for the main agencies charged with delivery of services to the public. Draft proposals were presented to Heads of Agencies in November 2013 with the intention that details be reported in this Chapter. The selected agencies were:
• Department of Education
• Department of Infrastructure, Energy and Resources
• Department of Primary Industries, Parks, Water and the Environment
• Department of Health and Human Services
• Department of Justice
• Department of Police and Emergency Management
• Department of Economic Development, Tourism and the Arts.
The selected efficiency KPIs are detailed later in this Chapter. They were selected to demonstrate their usefulness in assessing performance by users not able to demand access to information.
Information used in the KPIs identified was drawn from the previous four or five year periods using publicly available and comparable data to identify trends. Both nominal and real costs adjusting for inflation, Consumer Price Index (CPI), are shown. We have not tried to explain, or seek explanations for variations in efficiency evident in each graph. Our intent is to demonstrate the types of performance information that could be reported and explained by agencies in assessing their own efficiency. The graphs are limited to actual performance compared over time. We have not included targets or inter-jurisdictional comparatives although including this information would enhance information about efficiency.
effiCienCy indiCaTors should assess ToTal performanCeIdeally, indicators selected should address all of an agency’s activities and be reconcilable to expenditure in financial reports. This will not be easy in the first instance and some agencies will find it difficult to develop KPIs that address the entirety of their operations. This can be particularly challenging for multi-faceted departments. In this Chapter we have only focused on selected areas within each agency included.

24 Reporting Key Performance Indicators - Trial Project
a word of CauTionCollecting and reporting KPIs is not an exact science and it must be noted that the KPIs selected are just that – indicators of performance. Many factors often need to be taken into account when selecting KPIs and when assessing the performance they purport to demonstrate.
Difficulties also arise in the establishment of systems to collect the data upon which KPIs are based. This can be expensive and time consuming, with care needed in selecting the most appropriate, relevant and beneficial indicators.
Trial projeCT This Chapter is provided as a starting point to highlighting the important role that reported efficiency indicators can play in assessing performance in the public sector. This is a journey towards improved reporting and accountability for us and departments.
We acknowledge that some of the KPIs presented in this Chapter may not be perfect but in the absence of reporting efficiency KPIs by agencies, we decided we needed to start somewhere. Efficiency reporting is an important area of public accountability that warrants greater prominence in public sector reporting. Although still in its infancy in our State, it is an area we will continue to focus on in reporting on public sector performance.
department of educationFocus - To measure average expenditure per student in providing educational services in Tasmania.
This measure was derived by dividing the total expenditure for the Department by the total number of full time equivalent (FTE) students in Government schools. The procedure was applied for each of the Department’s Output Groups – Pre-Year 10 (Output Group 1) and Post-Year 10 education (Output Group 2). Output Group 1 includes early years programs and K-10 education. Output Group 2 includes the consolidation of the Polytechnic and Academy in 2010-11 and 2011-12. The main source for the measure was the Department of Education’s Annual Reports that are publicly available. The Australian Bureau of Statistics was also utilised for some supporting information.
Comparing expenditure to the number of students provides a meaningful indicator as it allows readers to judge the average cost of providing education in Tasmania. The indicator is easy to understand as it produces a simple line graph that is not complex and demonstrates the trend at a glance. It is acknowledged that the indicator has no quality dimension.

25Reporting Key Performance Indicators - Trial Project
Figure 1: Total average cost per student
Figure 2: Average cost per student in Output Group Ome: includes early years programs and K-10 education
2008-09 2009-10 2010-11 2011-12 2012-13Nominal Average Cost $14 756 $16 154 $16 875 $17 125 $17 185Real Average Cost $14 756 $15 741 $15 981 $15 853 $15 728Number of Students FTE 61 484 61 013 61 037 61 320 60 832
60 000
60 500
61 000
61 500
62 000
$14 000
$15 000
$16 000
$17 000
$18 000
Num
ber o
f Stu
dent
s FTE
Aver
age
Cost
Nominal Average Cost Real Average Cost Number of Students FTE
2008-09 2009-10 2010-11 2011-12 2012-13Nominal Average Cost $12 452 $13 009 $14 198 $14 771 $14 972Real Average Cost $12 452 $12 677 $13 447 $13 675 $13 703Number of Students FTE 54 798 53 910 53 232 53 072 52 551
51 000
52 000
53 000
54 000
55 000
$10 000
$12 000
$14 000
$16 000
$18 000
Num
ber o
f Stu
dent
s FTE
Aver
age
Cost
Nominal Average Cost Real Average Cost Number of Students FTE

26 Reporting Key Performance Indicators - Trial Project
Figure 3: Average cost per student in Output Group Two: Post-year 10 education including the consolidation of Polytechnic and Academy in 2010-11 and 2011-12
Our observations
We anticipate that the Department of Education would explain why:
• average real cost per student increased in 2009-2011 but declined thereafter
• average cost per student in output group two increased in 2009-10 but declined significantly thereafter. We anticipate, for example, that this was connected with reforms associated with the Academy and the Polytechnic.
department of infrastructure, energy and resources Focus – Roads maintenance, as part of the Capital Investment Program.
This measure was derived by dividing total maintenance costs expended as part of the capital investment program by roads per kilometre of road length.
This indicator allows readers to gauge the cost of works performed on the State road system. These roads are utilised by a large portion of the population, so having a measure addressing roads gives a meaningful indicator to the public. It shows movements in maintenance expenditure on roads.
2008-09 2009-10 2010-11 2011-12 2012-13Nominal Average Cost $27 302 $30 568 $27 349 $26 383 $26 543Real Average Cost $27 302 $29 788 $25 901 $24 424 $24 293Number of Students FTE 6 686 7 103 7 805 8 248 8 281
6 000
7 000
8 000
9 000
$22 000
$24 500
$27 000
$29 500
$32 000
Num
ber o
f Stu
dent
s FTE
Aver
age
Cost
Nominal Average Cost Real Average Cost Number of Students FTE

27Reporting Key Performance Indicators - Trial Project
Figure 4: Cost to Maintain One Kilometre of Road
Our observations
We anticipate that DIER would explain why:
• in real terms costs declined over the period 2009-10 to 2010-11, but increased thereafter.
department of primary industries, parks, water and the environmentFocus – Parks and Wildlife Service, average cost of services per hectare of parks and reserves.
The measure was calculated by taking the expenditure of the Parks and Wildlife Services and dividing it by the total area of parks and reserves. It presents the dollar value expended by the department per hectare of parks and reserves.
Figure 5: Average Cost of services per hectare (ha) of parks and reserves
2009-10 2010-11 2011-12 2012-13Nominal Average Cost $13 342 $11 864 $12 366 $13 780Real Average Cost $13 342 $11 530 $11 747 $12 942Road Length (km) 3 651 3 660 3 661 3 732
3 500
3 600
3 700
3 800
$8 000
$10 000
$12 000
$14 000
$16 000
Road
Len
gth
(km
)
Aver
age
Cost
Nominal Average Cost Real Average Cost Road Length (km)
2007-08 2008-09 2009-10 2010-11 2011-12 2012-13Nominal Ave Cost per ha $16.77 $17.43 $19.94 $22.31 $20.30 $18.65Real Ave Cost per ha $16.77 $16.94 $18.90 $20.54 $18.27 $16.60Total Hectares 2 586 031 2 586 031 2 586 031 2 586 031 2 586 031 2 586 031
$10
$15
$20
$25
$30
Aver
age
Cost
Nominal Ave Cost per ha Real Ave Cost per ha

28 Reporting Key Performance Indicators - Trial Project
Our observations
We anticipate that DPIPWE would explain the increase in average cost to 2010-11 and decline thereafter.
department of health and human servicesAreas within the Department considered included:
• Ambulance Tasmania
• Hospitals
• Housing Tasmania.
Ambulance Tasmania
Focus – Average cost per ambulance response and average response per FTE.
These measures were derived using response data and comparing it respectively to total expenditure and the number of ambulance officers. We acknowledge these measures have no quality dimension.
Figure 6: Average Cost per Ambulance Response and Total Responses
*Response information form Ambulance Tasmania FYI reporting)
Our observations
We anticipate that Ambulance Tasmania would explain why responses increased in 2012-13 despite a real decline in costs.
2007-08 2008-09 2009-10 2010-11 2011-12 2012-13Nominal Ave Cost per Response $600 $670 $686 $777 $828 $781Real Ave Cost per Response $600 $652 $650 $715 $745 $695Total Responses * 61 020 61 165 67 396 70 314 71 879 76 342
60 000
65 000
70 000
75 000
80 000
$500
$600
$700
$800
$900
Tota
l Res
pons
es
Aver
age
Cost
Nominal Ave Cost per Response Real Ave Cost per Response Total Responses *
29Reporting Key Performance Indicators - Trial Project
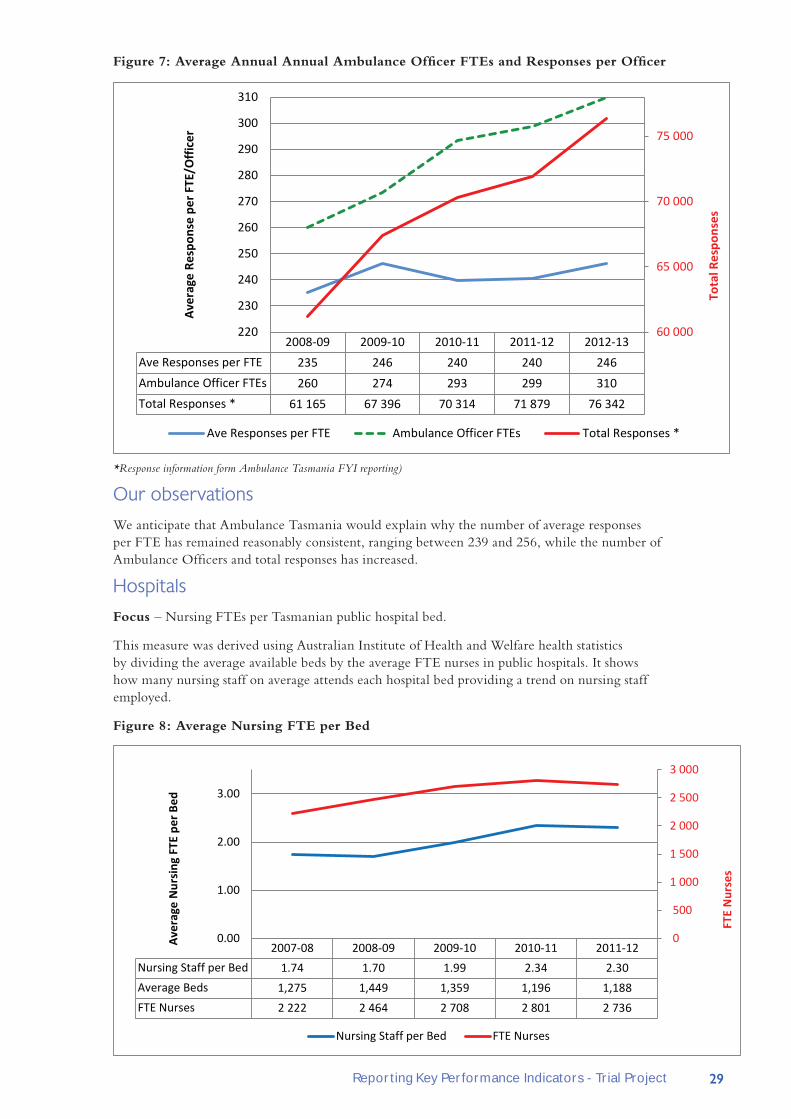
Figure 7: Average Annual Annual Ambulance Officer FTEs and Responses per Officer
*Response information form Ambulance Tasmania FYI reporting)
Our observations
We anticipate that Ambulance Tasmania would explain why the number of average responses per FTE has remained reasonably consistent, ranging between 239 and 256, while the number of Ambulance Officers and total responses has increased.
Hospitals
Focus – Nursing FTEs per Tasmanian public hospital bed.
This measure was derived using Australian Institute of Health and Welfare health statistics by dividing the average available beds by the average FTE nurses in public hospitals. It shows how many nursing staff on average attends each hospital bed providing a trend on nursing staff employed.
Figure 8: Average Nursing FTE per Bed
2008-09 2009-10 2010-11 2011-12 2012-13Ave Responses per FTE 235 246 240 240 246Ambulance Officer FTEs 260 274 293 299 310Total Responses * 61 165 67 396 70 314 71 879 76 342
60 000
65 000
70 000
75 000
220
230
240
250
260
270
280
290
300
310
Tota
l Res
pons
es
Aver
age
Resp
onse
per
FTE
/Offi
cer
Ave Responses per FTE Ambulance Officer FTEs Total Responses *
2007-08 2008-09 2009-10 2010-11 2011-12Nursing Staff per Bed 1.74 1.70 1.99 2.34 2.30Average Beds 1,275 1,449 1,359 1,196 1,188FTE Nurses 2 222 2 464 2 708 2 801 2 736
0
500
1 000
1 500
2 000
2 500
3 000
0.00
1.00
2.00
3.00
FTE
Nur
ses
Aver
age
Nur
sing
FTE
per
Bed
Nursing Staff per Bed FTE Nurses

30 Reporting Key Performance Indicators - Trial Project
Our observations
We anticipate that DHHS would explain why average nursing FTE per bed increased over the period 2008-09 to 2010-11 and then declined slightly.
Other indicators to consider:
Average costs of providing:
• Dental Services
• Royal Flying Doctor Service
• Palliative Care
• Weighted separations
• Cost per weighted separation against National Efficient Price (from 1 July 2014)
• Emergency department attendances.
Housing Tasmania
Focus – Dwelling revenues and costs.
By using both revenue and cost measures we can demonstrate that efficiency KPIs are not only for measuring costs. They can also be used for measuring average revenues. This can be done by reporting rental income per dwelling and tenant contribution per dwelling.
Possible indicators for reporting could include:
• Annual Potential Rental Income per Dwelling
• Annual Tenant Contribution per Dwelling
• Direct Property Cost per Dwelling
• Operating Cost per Dwelling
• Maintenance Cost per Dwelling.
However we only selected Maintenance Cost per Dwelling for demonstration.
Figure 9: Maintenance Cost per Dwelling
We anticipate that Housing Tasmania would explain the increase in maintenance costs per dwelling from 2009-10 onwards.
2007-08 2008-09 2009-10 2010-11 2011-12 2012-13Nominal Recurrent Cost $2 388 $3 081 $2 413 $2 782 $2 672 $3 056Real Recurrent Cost $2 388 $2 995 $2 286 $2 561 $2 405 $2 719Dwellings 12 563 12 645 13 082 13 243 13 441 13 441
12 500
12 750
13 000
13 250
13 500
$1 000
$2 000
$3 000
$4 000
Dwel
lings
Recu
rren
t Cos
t
Nominal Recurrent Cost Real Recurrent Cost Dwellings
31Reporting Key Performance Indicators - Trial Project
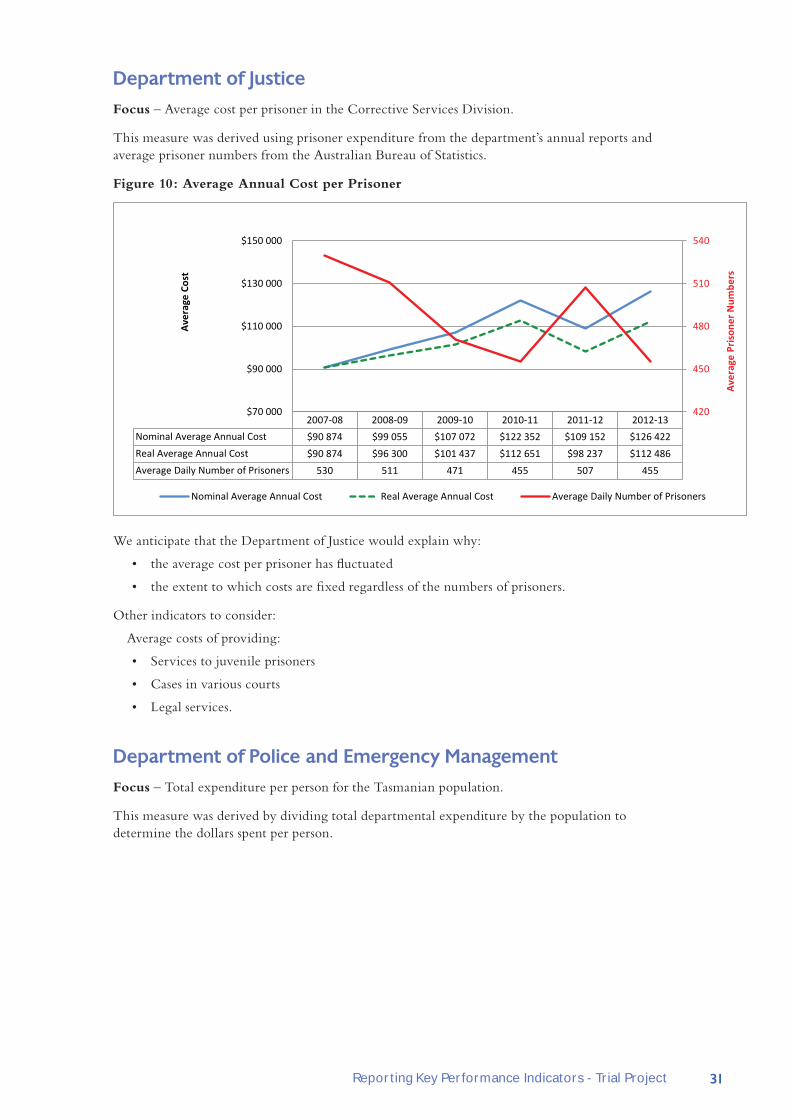
department of justiceFocus – Average cost per prisoner in the Corrective Services Division.
This measure was derived using prisoner expenditure from the department’s annual reports and average prisoner numbers from the Australian Bureau of Statistics.
Figure 10: Average Annual Cost per Prisoner
We anticipate that the Department of Justice would explain why:
• the average cost per prisoner has fluctuated
• the extent to which costs are fixed regardless of the numbers of prisoners.
Other indicators to consider:
Average costs of providing:
• Services to juvenile prisoners
• Cases in various courts
• Legal services.
department of police and emergency managementFocus – Total expenditure per person for the Tasmanian population.
This measure was derived by dividing total departmental expenditure by the population to determine the dollars spent per person.
2007-08 2008-09 2009-10 2010-11 2011-12 2012-13Nominal Average Annual Cost $90 874 $99 055 $107 072 $122 352 $109 152 $126 422Real Average Annual Cost $90 874 $96 300 $101 437 $112 651 $98 237 $112 486Average Daily Number of Prisoners 530 511 471 455 507 455
420
450
480
510
540
$70 000
$90 000
$110 000
$130 000
$150 000
Aver
age
Pris
oner
Num
bers
Aver
age
Cost
Nominal Average Annual Cost Real Average Annual Cost Average Daily Number of Prisoners

32 Reporting Key Performance Indicators - Trial Project
Figure 11: Expenditure on Police Services per Person
We anticipate that the DPEM would explain the increase in expenditure per person to 2010-11 and the decline thereafter.
Other indicators to consider, which are used in other jurisdictions:
• hourly costs to provide various police services
• average cost per investigation.
department of economic development, Tourism and the artsAreas within the department considered included Tourism Tasmania.
Tourism Tasmania
Focus – Average Cost per visitor to the State.
The measure was derived by dividing total expenditure incurred by Tourism Tasmania by the number of visitors, excluding Events Tasmania. (Events Tasmania was separated from Tourism Tasmania in July 2011.)
Figure 12: Average cost per Visitor excluding Events Tasmania
2008-09 2009-10 2010-11 2011-12 2012-13Population 497 529 503 292 507 643 511 195 513 958Expenditure per Person $393 $415 $438 $431 $415
$380
$400
$420
$440
Expenditure per Person
Expe
nditu
re p
er P
erso
n
2008-09 2009-10 2010-11 2011-12 2012-13Nominal Average Cost $37.98 $36.03 $34.27 $28.58 $25.35Real Average Cost $37.98 $35.11 $32.46 $26.46 $23.20Total Number of Visitors 907 300 910 200 895 400 855 200 961 600
800 000
840 000
880 000
920 000
960 000
$10
$20
$30
$40
$50
Tota
l Num
ber o
f Vis
itors
Aver
age
Cost
per
Vis
itor
Nominal Average Cost Real Average Cost Total Number of Visitors
33Reporting Key Performance Indicators - Trial Project
We anticipate that Tourism Tasmania would explain why:
• average costs per visitor have been declining even though visitor numbers have fluctuated
• the reason for the improvement in 2012-13 despite the lower spend.
Another indicator to consider is the advertising/promotional cost per visitor.
reCommendaTionWe recommend that all departments consider the indicators in this Chapter or design other suitable indicators of efficiency for inclusion in budget papers and annual reports.
reporTing key performanCe indiCaTors - Trial projeCTsubmissions and comments received from departmentsDepartment of Premier and Cabinet
Thank you for your letter of 2 April inviting comments on a draft chapter for inclusion in a Report to Parliament dealing with the reporting by Tasmanian Government agencies of key performance indicators (KPIs).
The Department of Premier and Cabinet (DPAC) supports the intent of the trial project that you are undertaking to develop efficiency measures that can be used for public reporting purposes. DPAC notes your recommendation that all departments consider the indicators in the draft chapter or design other more suitable indicators of efficiency for inclusion in budget papers and annual reports.
DPAC also notes that the efficiency measures included in the draft chapter are provided as examples only. It will be important for agencies to ensure they develop efficiency measures that can accurately represent their performance in delivering outcomes for which they are responsible. For instance, with regard to the Department of Education’s examples, the methodology used to calculate the total average cost per student does not appear to recognise the differential funding formulas that are applied to differing student cohorts in the education system.
As part of future work, I consider that it would be useful to discuss with agencies ways of measuring public sector productivity and efficiency more broadly.
Thank you for the opportunity to comment on the draft material.
Greg Johannes
Secretary
Department of Treasury and Finance
Treasury is supportive of the reporting of key performance indicators which lead to greater accountability for Government expenditure. Departments already prepare indicators on performance for publication in budget documents and annual reports. Further refining these indicators to ensure relevance and consistency with is undoubtedly necessary, however data accuracy, completeness and validity continue to be issues of concern for many agencies. To be of value it is important that information presented is reliable and of high quality.
To drive performance improvements, indicators should be chosen which are useful for normal departmental management purposes, rather than solely produced for annual reporting purposes. As

34 Reporting Key Performance Indicators - Trial Project
such, individual departments are best placed to determine appropriate indicators of performance. Appropriate explanations of variations and context are also important to assist user understanding.
Another important consideration is the basis of comparison of key performance indictors or appropriate benchmarking. The basis of comparison needs to be relevant and meaningful.
It is accepted that these issues are not easily addressed but that is not a reason not to pursue them. Indeed the Stats Matter project is also aimed at increasing the relevance, accountability and quality of statistical information produced, used and reported by Government.
I encourage departments to give serious attention to the refinement and development of key performance indicators, particularly efficiency KPIs.
Tony Ferrall
Secretary
Department of Education
The Department places a strong emphasis on Key Performance Indicators (KPIs) as evidenced by a range of KPIs in its annual report as well as being subject to a range of national frameworks for efficiency and effectiveness measures. In respect of efficiency measures in particular, the Department references details in its Annual Report on Government expenditure per student in government schools (refer page 148 of 2012-13 Annual Report). That reference is provided via a link to data published in the Australian Government Productivity Commission Report on Government Services (ROGS).
With the established national framework in place for ROGS it is considered that introducing other efficiency KPIs, such as those proposed in this report, would create confusion. In addition, the basis of calculation for the KPIs in this report are considered problematic for the following reasons:
• Figure 1 - Total Average Cost Per Student: includes expenditure for Output Group 3 LINC Tasmania which is not relevant for the KPI;
• Figure 2 - Total Average Cost Per Student for Output Group 1: includes expenditure for Output 1.4 Early Years which is not relevant for the KPI as it is not student related expenditure; and
• Figure 3 - Total Average Cost Per Student for Output Group 2: for vocational education training students the FTE student number used in the divisor only captures those students who are defined as being of school age. That is, the calculation includes expenditure for vocational education training students who are not of school age (at the former Polytechnic, Tasmanian Skills Institute or private Registered Training Organisations) but does not include the enrolment FTE number in the calculation. In addition, if the KPI were to be used it would be considered more appropriate to split it into two components, the first being Senior Secondary Education and the second being Vocational Education and Training. The latter would also normally be measured as a cost per delivery hour.
In summary, the Department’s view is that while existing well established KPI measures are reported on, I support in principle the direction taken in this report.
Colin Pettit
Secretary

35Reporting Key Performance Indicators - Trial Project
Department of Infrastructure, Energy and Resources
The Department strongly supports the recommendation of your report which provides a basis to move forward with the public reporting of performance indicators that measure efficiency. The publication of these performance indicators in documents such as budget papers is important in the accountability and measurement of the effectiveness of Departments and the Government.
It is noted that the indicators proposed in your report as a starting point are largely based upon cost. As cost on its own is not a reliable indicator of efficiency your proposal has spurred us to thinking of how it can be used in conjunction with other indicators for example that measure the condition of the road. In addition, we need to think about how accounting treatments can affect the cost base and in turn the reliability of the measure, for example maintenance projects that are expensed instead of capitalised, which is project dependent.
The Department will consider current and development of new performance indicators in the light of your report in preparation for future budgets in consultation with portfolio ministers. I have no doubt that your report will assist in setting the reporting foundations of the new Department of State Growth as we move forward.
Bob Rutherford on behalf of Kim Evans
Acting Secretary
Department of Primary Industries, Parks, Water and the Environment
Thank you for your letter of 2 April 2014 inviting comments on the draft chapter concerning key performance indicators for inclusion in your forthcoming Report to Parliament.
The Department will adopt the suggested indicator for the Parks and Wildlife Service.
As recently noted in DPIPWE’s response to the Tasmanian Audit Office’s follow up of Special Report No. 92, the Department is also in the process of developing additional efficiency indicators.
The Department’s Audit Committee, which has been monitoring the issue of efficiency indicators since Auditor-General’s Special Report No. 92, Public sector productivity: a ten-year comparison, has been informed about this matter.
John Whittington
Acting Secretary
Department of Health and Human Services
The Department of Health and Human Services (DHHS) welcomes the key performance indicator trial project recommendations on efficiency indicators. The further development of appropriate efficiency indicators is a priority for DHHS.
DHHS appreciates the cautions expressed by the Tasmanian Audit Office and their advice that this is a trial project. Nevertheless, DHHS is very pleased with the progress the Tasmanian Audit Office has made in what is a complex and often difficult task.
Work to develop good quality measures of efficiency is expensive and often needs to overcome considerable technical and measurement challenges. The Stats Matter initiative and national initiatives, such as work to develop hospital efficiency measures under the National Performance and Accountability Framework, help to mobilise the expertise needed for this work and to share the burden of resourcing this work.

36 Reporting Key Performance Indicators - Trial Project
The Department does not have any instant solutions to overcome this deficiency in performance reporting and acknowledges the current state of affairs means there is a lack of efficiency measures of sufficient validity and meaningfulness for inclusion in important official documents, such as the Budget and Annual Reports. The Department would welcome the opportunity to participate in a broader government program to improve measures of efficiency, including their initial publication in a research context. Such work might be progressed collaboratively through the Stats Matter program.
Ambulance Tasmania
The following efficiency measures will be more suitably applied to Ambulance Tasmania:
i) Cost per patient treated
ii) Cost per capita
Both of these measures:
• compare outputs against cost – rather than inputs and
• are used (tailored for the particular reporting area) in other areas of your report e.g. education cost per student, justice cost per prisoner etc.
The nominal and real cost figures used in these charts have been taken from your report. A range of indices are available to inflate past dollars to present value – the CPI used in your report is not necessarily the most appropriate to use when analysing ambulance expenditure. If more time were available we could go through some of the options with you – particularly that used by the Productivity Commission in the Emergency Services section of the Report on Government Services.
The Report should acknowledge for Ambulance Tasmania, as it is for Education, that these indicators have no quality dimension. If more time was available Ambulance Tasmania could assist with the development of quality and effectiveness KPIs.
And finally - reference is made in the report to developing indictors for the Royal Flying Doctor Service (RFDS).
The Royal Flying Doctor Service provides a contracted service to Ambulance Tasmania.
The Royal Flying Doctor Service should not be included in any Tasmanian Government efficiency report.
Housing Tasmania
The attachment ‘Reporting Key Performance Indicators – Trial Project’ includes a demonstration of a measure of efficiency for Housing Tasmania - Recurrent Maintenance Costs per Dwelling.
Whilst this is a cost measure, it is not an ideal measure of efficiency. Housing Tasmania has significant deferred maintenance costs due to an ageing and misaligned stock portfolio. It is not ideal that maintenance costs are reduced, and this may not be possible over time without significant capital investment in realignment of the portfolio.
The Report outlines other possible indicators for reporting could include:
• Annual Potential Rental Income per Dwelling
• Annual Tenant Contribution per Dwelling
• Direct Property Cost per Dwelling
• Operating Cost per Dwelling.

37Reporting Key Performance Indicators - Trial Project
Housing Tasmania proposes that good Key Performance Indicators that demonstrate efficiency include:
• Net recurrent cost per dwelling
○ This is a measure of cost effectiveness and efficiency.
○ It is also a measure of sustainability of the service model.
○ This figure has been declining over time and reflects positive performance by the Department.
• Average time to house priority applicants
○ This is an indicator of service delivery efficiency for housing people most in need.
• Rent collection rate
○ This is an indicator of efficiency in terms of rental collection and appropriate arrears management.
Matthew Daly
Secretary
Department of Justice
The Secretary has advised the Auditor-General that he supports the intent of the trial and that he continues to explore improvements to information reported.
Simon Overland
Secretary
Department of Police and Emergency Management
Thank you for your letter of 2 April 2014 inviting comment on the Trial Project being carried out by the Tasmanian Audit Office. The Department of Police and Emergency Management (DPEM) welcomes this initiative. The Department strongly supports the development of suitable measures of efficiency of service delivery and performance.
The initial measure proposed by the Audit Office is Expenditure on Police Services per Person. This measure is similar to one developed by the Australian Government Productivity Commission and Published in the Report on Government Services (ROGS), although a different formula is used. The measure is not currently used as a performance indicator by DPEM because it is a measure of cost only and does not include a consideration of the outputs and outcomes achieved from the expenditure incurred.
The measure is also greatly affected by Government policy in relation to staff numbers. The reduction in expenditure since 2010 is probably largely explained by the Government policy of reducing police and state service numbers. The cessation of payroll tax from October 2012 also contributed to the reduction. It is anticipated that the expenditure will rise in the near future as a result of the incoming Government’s policy of increasing police numbers. The fall and expected rise are not indicators of any change in Departmental efficiency or performance.
Two additional indicators are proposed by the Audit Office but they also have difficulties associated with them:
Hourly costs to provide various police services – This indicator would be useful but very difficult to obtain. The services provided by Police and Emergency Services are extremely varied and therefore difficult to define or measure.

38 Reporting Key Performance Indicators - Trial Project
Hours of operation is probably the only measure of services that could be determined without a large amount of additional effort but it is a measure of activity and not a measure of output or outcome. It would not be a true measure of efficiency or performance.
Average cost per investigation – This indicator would be heavily influenced by the size of the investigations performed as they vary considerably. In a larger jurisdiction, the average size of investigations could be assumed to be roughly constant over time but that assumption could not be made in Tasmania where there are a small number of large investigations each year that cause considerable annual fluctuation in the average size of investigations . As these large investigations are of considerable importance to public safety, it would be undesirable to reduce the relative effort applied to them even though they adversely affect the average cost per investigation.
I appreciate the value of a good performance measurement framework in monitoring and managing the Department effectively and our framework is reviewed each year. While there are difficulties with the indicators as proposed in this report, I will ensure that the suggestions of the Audit Office are considered when the framework is next reviewed.
D L Hine
Commissioner of Police
Department of Economic Development, Tourism and the Arts
Thank you for the opportunity to comment on the Auditor-General’s draft report on Reporting Key Performance Indicators – trial project. The Department supports the recommendation noting the need to identify and report suitable outcome based indicators of efficiency and effectiveness and that doing so is important in assessing accountability.
The indicator proposed in the draft report – Average cost per visitor to the State – seems like a reasonable starting point but covers only a small part of the Department’s overall activities. We look forward to working with the Auditor-General in developing appropriate indicators once structural changes occurring currently are finalised and as part of setting objectives for the new Department of State Growth.
Jonathan Wood on behalf of Kim Evans
Acting Secretary

39Disposal of Firearms and Ammunition
disposal of firearms and ammuniTion
snapshoT• The Firearms Act 1996 requires the Auditor-General to arrange for an independent audit
of all firearms or ammunition disposed of under that Act and to table in both Houses of Parliament a report on the audit.
• We found the actual processes and control activities leading to the disposal of firearms to be appropriate and based on our audit work we concluded the requirements of the Firearms Act 1996 in relation to the disposal of firearms were complied with.
• The current practice of recording the quantity of ammunition was inadequate and we were not able to conclude on compliance with the Firearms Act 1996 in relation to the disposal of ammunition.
• We made the following recommendations to the DPEM:
○ it should review its current processes with the view to implementing a practical control over the recording of ammunition, which would address the risk of ammunition being inadvertently misplaced or lost through theft or fraud
○ it should develop formal policies and procedures which would address all activities leading to the disposal of firearms and ammunition
○ it should ensure that controls around the disposal of firearms and ammunition are monitored through a combination of ongoing activities and separate evaluations.
inTroduCTionAll aspects of gun ownership in Tasmania were tightened up in the Firearms Act 1996 (the Act) that replaced the earlier and less stringent Guns Act 1991 and Guns Amendment Acts 1993 and 1996.
Section 149 of the Act requires the Auditor-General to arrange for an independent audit, to be carried out once every year, of all firearms or ammunition disposed of under the Act and to table in both Houses of Parliament a report on the audit.
The DPEM is charged with the responsibility for disposal of firearms and ammunition under the Act. Firearms destruction encompasses not only firearms and ammunition, but also knives and other weapons. There are several ways by which weapons are seized, but most weapons are handed in by their owners. Section 129 of the Act provides for a permanent amnesty when firearms are voluntarily surrendered.
authority to disposeFirearms and ammunition surrendered or seized under the Act can be disposed of under an order from a magistrate. A magistrate may also order that a firearm or ammunition be forfeited to the Crown. Following an amendment to the Act in 2007, the Minister was given discretion to determine the form of disposal if the magistrate’s order to forfeit the firearm or ammunition to the Crown was made because of a breach of safekeeping provisions in the Act. The DPEM obtained a continuing delegation from the Minister that all firearms and ammunition forfeited to the Crown for firearms offences or by court order be destroyed, unless:
• the firearm and/or ammunition is required by the Ballistics Library for evidentiary purposes
• an application is received from the owner for the return of a firearm or ammunition.
40 Disposal of Firearms and Ammunition
what does ‘disposed of’ mean?The Act does not define what ‘disposal’ means. The Macquarie Dictionary defines disposal as ‘the act of disposing of ’, which means ‘to get rid of ’. The Act does not prevent the sale of firearms or ammunition if the Minister determines that it is an appropriate method of disposal. However, it is our view that the sale of surrendered or seized firearms and ammunition is not in keeping with the spirit of the Act and the prevention of violence and self-harm in general. We have therefore accepted the view that ‘disposed of ’, unless otherwise authorised, means physical destruction.
audit objectiveThe objective of the audit is to provide independent assurance to the Parliament and community that the process of disposing of firearms and ammunition is managed in compliance with the Act.
audiT of ComplianCe wiTh The aCTassessment of Control frameworkThe destruction of firearms and ammunition is managed by Firearms Services, a unit within the Operations Support division of DPEM. As part of the audit, we reviewed procedures and made enquiries of relevant personnel in the unit to obtain an understanding of activities which lead to the physical destruction of firearms and ammunition. We also visited a destruction site and observed firearms being destroyed.
We found the actual processes and control activities leading to the disposal of firearms to be appropriate.
Ammunition is handled in the same way as firearms. However, we found that there is no prescribed unit of measure (for example number of cartridges or their weight) used to record and track the quantities of ammunition handed in or seized and then disposed. The current practice of recording the quantity of ammunition varies, which increases the risk that ammunition could inadvertently be misplaced or lost through theft or fraud without this being detected. Accordingly, our procedures with respect to the disposal of ammunition were restricted and as a result we are unable to report whether all ammunition surrendered or seized under the Act (or other legislation) was disposed of in accordance with the Act (or other legislation).
We recommend that the DPEM reviews its current processes with the view to implementing a practical control over the recording of ammunition, which would address the risk of ammunition being inadvertently misplaced or lost through theft or fraud.
We also found that the control framework was deficient in the following areas:
• There are no documented policies and procedures.
• There was a lack of monitoring controls. Monitoring is an important element of any risk management framework. It provides feedback to management on whether the controls they designed to mitigate risks continue to be fit for purpose, are property implemented and understood by employees and being used and complied with. Monitoring also assists those charged with governance in discharging their compliance responsibilities.
We recommend that DPEM:
• develops formal policies and procedures which address all activities leading to the disposal of firearms and ammunition
• ensures that controls around the disposal of firearms and ammunition are monitored through a combination of ongoing activities and separate evaluations.

41Disposal of Firearms and Ammunition
management responsesA copy of this Chapter was provided to the Department for comment and response. The Department’s full response is provided. The comments and submissions provided were not subject to the audit nor the evidentiary standards required in reaching an audit conclusion. Responsibility for the accuracy, fairness and balance of these comments rests solely with the Department.
The DPEM acknowledges the recommendations contained in the report of the Auditor-General and will review current processes in relation to the recording of ammunition seized, surrendered or forfeited to police to ensure that the risk of ammunition being misplaced through loss, theft or fraud is further minimised.
The DPEM will review its existing policies and guidelines and implement measures to ensure that further direction is provided to staff involved in the disposal of firearms and ammunition.
The DPEM will ensure that controls around the disposal of firearms and ammunition continue to be monitored through ongoing activities, separate evaluations and management review.
accuracy of information on firearms and ammunition disposedFirearms Services maintain records of all weapons (includes firearms, crossbows and parts of firearms) and ammunition surrendered or seized and processed. Annual statistics on firearms received for disposal, disposed of and held for disposal are published in the DPEM’s annual report.
We are required to audit firearms or ammunition disposed of under the Act. Firearms and ammunition come into police possession through a variety of means and the way they are dealt with depends on the requirement of the specific legislation. In some cases, the receipt of a weapon and its subsequent disposal can be dealt under different acts. We were unable to accurately separate firearms disposed under the Act from firearms disposed under other legislation. Accordingly, we are unable to report the number of firearms and ammunition disposed specifically under the Act. Instead, we report the total number of firearms and ammunition disposed under the Act and other legislation. Table 1 below summarises firearms and ammunition disposed of under various pieces of legislation, not just the Act.
Table 1: Firearms and ammunition disposed of in financial years ended 30 June 2009 to 30 June 2013
2008-09 2009-10 2010-11 2011-12 2012-13
F A F A F A F A F A
Held as at beginning of year 0 0 0 0 0 1 2 1 1 1
Received 1 227 450 1 274 327 1 097 366 1 100 409 1 585 337
Total Held 1 227 450 1 274 327 1 097 367 1 102 410 1 586 338
Destroyed 1 220 20 1 269 326 1 076 366 1 093 409 1 543 337
Returned to owner 0 0 0 0 2 0 0 0 1 0Transferred to Ballistics Reference Library 7 430 5 0 17 0 8 0 30 0Donated to museums etc. for display 0 0 0 0 0 0 0 0 0 0
Total Disposed 1 227 450 1 274 326 1 095 366 1 101 409 1 574 337
Held as at End of Year 0 0 0 1 2 1 1 1 12 1
F - Firearms, A - Ammunition
Note: Figures may differ from those published in the DPEM’s annual reports as a result of our audit.
Conclusion as to compliance with the actBased on the audit procedures performed, we concluded the DPEM complied with the requirements of the Act in relation to the disposal of firearms. We were unable to conclude on the DPEM’s compliance with the Act in relation to the disposal of ammunition.

42 Timeliness and Quality of Financial Statements
Timeliness and qualiTy of finanCial sTaTemenTs
snapshoT• In the 2012-13 financial audit cycle, nine State entities failed to submit their financial
statements for audit within the statutory deadline of 45 days from the end of the financial year.
• One set of financial statements submitted for audit was rejected.
• On the whole the quality of financial reports initially submitted was of a high standard.
sTaTuTory finanCial reporTing and audiTing Timing requiremenTsUnder section 17 of the Audit Act 2008 (the Audit Act) specific dates are set by when accountable authorities of State entities are to provide financial statements to the Auditor-General to formally allow the audit process to commence. The requirement is that financial statements are submitted for audit within 45 days after the end of the financial year.
Our responsibility under section 19 of the Audit Act is to complete our audit within 45 days of receiving financial statements from State entities. In most cases, entities have a 30 June financial year-end making 15 August (this will be 14 August in 2013-14) the statutory date by which financial statements are to be submitted with our deadline 30 September (this will be 28 September in 2013-14). For entities with a 31 December financial year-end, the statutory deadline for submitting their financial statements to the Auditor-General is 15 February (this will be 14 February in 2015). The deadline for completing those audits is 31 March (this will continue to be 31 March in 2015).
These dates were set to allow sufficient time for audits to be completed and for accountable authorities to prepare annual reports for tabling in Parliament.
Listed below are entities whose signed financial statements were not received by the statutory deadline of 45 days from the end of the financial year. The list includes all State entities, not just the entities covered by this Report, for the financial years ended 30 June 2013 and 31 December 2013. Dates shown in brackets represent the date signed financial statements were received:
• Financial year end 30 June 2013:
○ Cradle Coast Authority (14 October 2013)
○ Dulverton Regional Waste Management Authority (22 August 2013)
○ Glamorgan-Spring Bay Council (30 August 2013)
○ Latrobe Council (21 August 2013)
○ Legal Aid Commission of Tasmania (17 September 2013)
○ National Trust of Australia (Tasmania) (27 September 2013)
○ Royal Tasmanian Botanical Gardens (30 August 2013)
○ Tasmanian Affordable Housing Limited (30 October 2013)
○ WorkCover Tasmania Board (20 August 2013).
These entities were reminded of their obligation to report within the prescribed deadline in future.
• Financial year end 31 December – all State entities reporting at 31 December submitted their financial statements on time.

43Timeliness and Quality of Financial Statements
sTeps Taken by audiT To faCiliTaTe earlier finanCial reporTingWe continue to assist State entities to achieve early financial reporting. This is done in a number of ways including:
• where possible early planning of audits. As part of planning audits discussions are held with management, and where relevant those charged with governance, and agreements reached on financial reporting and auditing timeframes. These agreements are always aimed at completion within statutory reporting deadlines
• preparation of detailed completion plans for components of the financial statements
• where financial systems allow, conducting audit testing of selected balances prior to balance date thus minimising work post balance date.
ComplianCe wiTh finanCial reporTing sTandardsThe Audit Act requires all State entities to prepare financial statements in accordance with Australian Accounting Standards. In some cases, in particular for smaller State entities, we accepted preparation of Specific Purpose Financial Reports (SPFR). There were no instances where these standards were not complied with or where SPFR failed to satisfy our requirements.
qualiTy of finanCial reporTingSection 17 of the Audit Act also provides for the Auditor-General to determine whether signed financial statements submitted are complete in all material respects. Upon receipt of signed financial statements we immediately review and evaluate them utilising a checklist, to ensure they are complete and presentation complied with Australian Accounting Standards. We also confirm the accuracy of comparatives, cross references and ensure the statements are arithmetically correct.
During the 2012-13 financial reporting cycle, only one set of financial statements submitted for audit was rejected. This indicates that on the whole the quality of financial reports initially submitted was of a high standard.

44 Findings from 2013 Audits
findings from 2013 audiTs
snapshoT• In excess of 330 audit matters were raised, with recommendations made to 70 State entities
during the 2012-13 financial audit cycle.
• The majority of matters raised related to non-current physical assets, expenditure and accounts payable, employee expenses, information systems, revenue and receivables and Cash and financing.
• The use of residual values for long-lived infrastructure assets in local government councils were reviewed by an independent expert and reported in Report of the Auditor-General No. 5 2013-14 Infrastructure Financial Accounting in Local Government tabled in December 2013. The Report concluded that the manner in which some local government councils used residual values did not comply with accounting standards. That report made 23 recommendations relating to long-lived infrastructure management.
• A significant change to 2013-14 financial reporting requirements includes the new Australian Accounting Standard AASB 13 Fair Value Measurement.
• The use of cloud computing by a State entity appeared to provide efficiencies, but there were aspects of the application that were unknown by the entity. We recommended completion of full risk assessments prior to implementing this product.
inTroduCTion The comments in this Chapter apply to our audits of all State entities, not just the entities covered by this Report, for the financial years ended 30 June 2013 and 31 December 2013. In this Chapter we refer to these periods as the 2012-13 financial audit cycle.
audiT maTTersWe identified in excess of 330 audit matters and made recommendations to 70 State entities during the 2012-13 financial audit cycle. We communicate all weaknesses identified during an audit to management at an appropriate level of responsibility. Significant matters are detailed in a written report, which also includes our recommendations for improvements and management responses. The report is then communicated to those charged with governance, for example the Secretary, chairperson of the Board of Directors or Mayor, with a copy sent to the responsible minister.
We also report significant matters to Parliament in Auditor-General’s Reports on the Financial Statements of State entities.
We categorise each matter as high, moderate or low risk, depending on its potential impact, as shown in the following table.

45Findings from 2013 Audits
Table 2: Risk categories for audit findings
Risk Category Client Impact
High • Matters which pose a significant business or financial risk to the entity.
• Matters that have resulted or could potentially result in a modified or qualified audit opinion if not addressed as a matter of urgency by the entity.
Moderate • Matters of a systemic nature that pose a moderate business or financial risk to the entity if not addressed as high priority within the current financial year.
• Matters that may escalate to high risk if not addressed promptly.
• Low risk matters which have been reported to management in the past but have not been satisfactorily resolved or addressed.
Low • Matters that are isolated, non-systemic or procedural in nature.
• Matters that reflect relatively minor administrative shortcomings and could be addressed in the context of the entity’s overall control environment
Source: Integrated Public Sector Audit Methodology
matters raised by category of riskFigure 13 below provides a breakdown of matters raised during the 2012-13 financial audit cycle by the risk categories outlined in Table 2.
Figure 13: Matters Raised by Risk Category
Source: Tasmanian Audit Office
Figure 13 shows that the majority of matters, 50%, were categorised as moderate, posing a moderate business or financial risk to the entity, but which may escalate to high risk status if not addressed promptly. 7% of matters were assessed as high risk. High risk matters pose a significant business or financial risk to the entity and could potentially result in a modified or qualified audit opinion if not addressed as a matter of urgency by the entity. Such issues included the use of residuals in valuing long-
High
Moderate
Low

46 Findings from 2013 Audits
lived infrastructure assets, valuations not being kept up to date, insufficient evidence to support asset valuations, authorisation of credit card transactions, information systems access and management, Electronic Funds Transfer (EFT) payment access and authorisation, compliance with legislative requirements for tendering, inadequate segregation of duties and weaknesses in internal controls.
management actionThe majority of matters reported to management or those charged with governance are generally resolved or management have agreed to undertake corrective actions.
‘Undertaking corrective action’ means that the issue had not been satisfactorily resolved at the time the audit is finalised, but management is implementing, or has agreed to implement, our recommendation or an alternative resolution. These issues include such items as internal control weaknesses that cannot be readily rectified. Such items may require further management reviews, procedural modifications or policy changes. In these cases we follow-up those matters in subsequent audits to ensure they have been adequately addressed.
‘Resolved’ means that management had successfully implemented a corrective action. These issues include such items as readily rectifiable control weaknesses, account mis-classification, presentation and general financial statement items or issues reported in previous years which had been rectified in the current year.
Where management disagree with a finding or, in our view, the corrective action proposed by management does not adequately address the matter, we categorise the finding as ‘unresolved’. In such a situation, we still report the matter and management response to those charged with governance in the year when it came to our attention. We then adapt our audit plan to address the risk of financial statements being misstated due to the identified weakness.
We consider all matters raised with management in the following year as part of a risk assessment when planning an audit. Where issues are corrected, this is noted and not raised again in a subsequent year, although we may perform audit testing to confirm this.
maTTers raised by TypeTo assist us in the identification of trends and management of audit risks, we categorise issues raised according to their type and the system they relate to. Figure 2 depicts issues raised by the most common types or systems during the 2010-11, 2011-12 and 2012-13 financial audit cycles and includes all audit findings – high, moderate and low risk.
Figure 14: Matters by Type
Source: Tasmanian Audit Office
0% 5% 10% 15% 20% 25%
Non-Current Physical Assets
Expenditure & Accounts Payable
Employee Expenses
Information Systems
Revenue & Receivables
Cash & Financing
2012-13 2011-12 2010-11

47Findings from 2013 Audits
information systems (21%)Matters raised centred on deficiencies in policy frameworks governing information systems, such as user access rights and management, application monitoring, password sharing and change management. Other matters raised in this area related mainly to the management of user access and insufficient segregation of duties of administrator or super users. Lack of security, disaster recovery and continuity plans in some entities continued to be of concern.
The significant increase in matters during 2012-13 was primarily due to a change in our internal information system program, with the majority of matters being identified in medium to small entities.
expenditure and accounts payable (18%)Matters raised in this area related mainly to:
• the absence of appropriate authorisation of transactions
• missing supporting documentation
• lack of adequate segregation of non-compatible duties.
A number of matters were raised over controls and authorisation of corporate credit card expenditure. In particular, credit cards held by management. There is a risk that expenditure on credit cards may not directly relate to business activities and all entities need to ensure they implement strict controls over their use.
non-Current physical assets (12%)For non-current physical assets the key matters raised were in relation to appropriate and timely valuations and the application of residual values to long-lived infrastructure assets. This remains a key area of concern because lack of timely valuations and inaccurate information can lead to wrong decisions with potentially long-term implications.
Other matters included a lack of policies relating to valuation models, errors in the calculation of depreciation, variances between subsidiary asset registers and general ledger control accounts and asset registers being maintained on spreadsheets.
Cash and financing (10%)A major matter in this area related to controls over the on-line banking systems used for electronic funds transfer. In particular, access and authorisation privileges to the on-line system, including:
• export files can be amended before disbursement
• one officer having the ability to authorise payment from a bank account
• multiple access users, which included terminated staff.
Other matters included the timely completion of bank reconciliations and the lack of review by a person independent from the preparer.
employee expenses (8%)Matters identified in this category highlighted control weaknesses in payroll processing, errors in calculations of leave provisions and termination payments, and excessive leave balances.
revenue and receivables (7%)Matters in this area included:
• the absence of timely reconciliations between receivables subsidiary ledgers and the general ledger
• absence of independent reconciliations over cash collection

48 Findings from 2013 Audits
• the determination of impairment provisions
• lack of processes and/or controls over revenue completeness.
other mattersOther matters included:
• general journals lacked supporting documentation and were not independently authorised
• annual reports did not include our audit report
• late submission of financial statements
• the calculation of remediation and aftercare provisions
• risk registers and management frameworks not current.
maTTers whiCh impaCT mulTiple enTiTies and emerging issuesMatters arising which impacted, or could potentially impact, multiple entities and emerging issues are summarised here.
valuation of non-Current physical assetsThe majority of issues identified in this area related to appropriate and timely valuation of land and buildings. As we have stated in previous reports, it is our view that fair value is the most relevant measurement for long-lived non-current physical assets. Fair value can be determined by reference to market based evidence or in its absence, an income approach or a depreciated replacement cost basis. In any case, entities should ensure that carrying amounts keep pace with prevailing market conditions, cost of construction etc. This can be achieved through periodic assessments by a qualified valuer.
Accounting standards require entities measuring assets at fair value to carry out revaluations with sufficient regularity to ensure that the carrying amount does not differ materially from that which would be determined using fair value at reporting date. While it is not practical or cost effective for all entities to revalue assets annually, the application of appropriate indices in intervening periods between formal valuations can ensure compliance with the requirements of accounting standards. Other ways to manage the cost of valuations include implementation of revaluations on a rolling basis (provided revaluation of the class of assets is completed within a short period and provided the revaluations are kept up to date) or to value representative samples from a population of assets.
Another issue in this area is the use of residual values for long-lived infrastructure assets. As indicated in Report No. 4 of 2012-13 an independent expert was appointed to review approaches to road assets valuation and depreciation by local government councils. The outcomes of this review were reported in Report of the Auditor-General No. 5 2013-14 Infrastructure Financial Accounting in Local Government tabled in December 2013. The Report included 23 recommendations, including:
• Residual values for property, plant and equipment assets be recognised only where the estimated amount to be received from disposal of the asset is greater than the cost of disposal of the asset.
• Assets should be recognised at cost based on a modern equivalent asset.
• Donated or contributed assets should be recognised at fair value in accordance with Accounting Standards.
• Periodic revaluations of infrastructure assets should be based on the amount required currently to replace the service capacity of the asset.
• Assets subject to planned ‘optimal’ renewal methods be componentised to recognise the different useful lives estimated for each part of the asset.
• The componentised assets be revalued as modern equivalent assets being the cost that is required currently to replace the service capacity of an asset.

49Findings from 2013 Audits
revised financial reporting standardsFor the 2013-14 financial reporting period, there are some significant changes to reporting requirements in the public sector. A key change arising from the new Australian Accounting Standard AASB 13 Fair Value Measurement is in relation to the reporting of assets and liabilities measured at fair value. The impacts of the new standard are disclosed in the Chapter headed: Accounting and Auditing Standards – Developments in Financial Reporting.
Cloud ComputingDuring the year, an issue was raised in relation to the need for a full risk assessment on business data security and business continuity at a State entity using a ‘cloud based’ accounting package. We observed that the new product was providing efficiencies to the entity, but there were some aspects of the ‘cloud based’ application that were unknown.
We expect, in the future, other entities will examine the possibility of using ‘cloud based’ accounting packages and suggest:
• a full assessment of the risks associated with the product
• a review of the terms and conditions (service level agreement) to ensure an entity is not exposed to any unacceptable risk.

50 Grant Acquittal Audits
granT aCquiTTal audiTs
snapshoT• The Auditor-General is responsible for audits of numerous grant acquittal financial
statements. These audits are carried out in addition to audits of the annual financial statements of State entities.
• An audit of the State claim to the Australian Government under the Natural Disaster Relief and Recovery Arrangements for costs incurred relating to the January 2013 bushfires was completed on 8 April 2014.
inTroduCTionIn addition to audits of the financial statement of State entities, we also perform various grant acquittal audits. The purpose of these audits varies depending on the terms of each funding agreement although they are normally aimed at giving fund providers a reasonable level of assurance that:
• funding was expended in accordance with the funding agreement
• the acquittal report is prepared, in all material respects, in accordance with specified financial reporting requirements.
audiTs CompleTedIn the 2012-13 year, we issued audit opinions on numerous grant acquittal financial statements. Examples are:
• Roads to Recovery Program funding received by local government councils
• projects such as Fox Free Tasmania, Eradication of Rabbits and Rodents on Macquarie Island and Aboriginal Trainee Ranger Program for which funding was received by the Department of Primary Industries, Parks, Water and Environment from the Australian Government
• funding received by the three regional water corporations under the Water Metering Tasmania program towards the roll-out of water meters across the State.
financial assistance under national disaster relief and recovery arrangementsFollowing the January 2013 bushfires, effected local government councils sought financial assistance for infrastructure restoration, clean-up and other costs under the State Natural Disaster Relief and Recovery Arrangements. It is a requirement that each claim must be audited and we have completed audits of all claims submitted to us by local government councils.
At the national level, States are eligible for assistance from the Australian Government under the Natural Disaster Relief and Recovery Arrangements (NDRRA). The States are also required to have their claims independently audited. In 2012-13, Tasmania’s claim for assistance in connection with floods that occurred in the previous year totalled $7.237m. The actual expenditure totalled $21.704m and related mainly to the cost of repairs to roads and bridges. We issued our audit report on the claim on 17 January 2013.
In 2013-14, Tasmania claimed for assistance in connection with the January 2013 bushfires. Eligible expenditure incurred by the State in respect of this natural disaster totalled $36.792m, of which $13.787m will be paid by the Commonwealth under the NDRRA. We issued an unqualified audit report on the claim on 8 April 2014.

51Basis for Setting Audit Fees
basis for seTTing audiT fees
snapshoT• Fees, and the accountable authority liable to pay the fee for financial audits, are determined
by the Auditor-General pursuant to section 27 of the Audit Act 2008.
• The basis for setting fees is to be described in a report to Parliament dealing with the results of financial audits of State entities. This Chapter fulfils that requirement.
• Fees are set for each State entity commensurate with the size, complexity and risks of the engagement.
• Charge rates are based on the principle of the Office being able to recover its costs of operation. Charge rates comprise two parts, direct salary cost and overhead recovery.
• Fees are determined on the basis of no material change to State entities’ operations or other factors affecting engagement risk.
• Where circumstances surrounding the engagement have materially changed, additional audit fees may be sought from the State entity.
• A matrix (audit fee scale) has been developed to provide a guide for determining the expected time to be taken on an audit. The level of fee, and any change, experienced by individual State entities may vary according to individual circumstances and the risks each entity faces.
• In certain circumstances, we may need to use staff with specialist skills in order to review specific local issues. Where this is the case, it can result in higher costs being incurred which may be added to the fee determined by the Auditor-General.
baCkgroundSection 27 of the Audit Act 2008 (Audit Act) provides that:
‘(1) The Auditor-General is to determine whether a fee is to be charged for an audit carried out by the Auditor-General under this Division and, if so –
(a) the amount of that fee; and
(b) the accountable authority liable to pay that fee.’
In relation to the tabling of Auditor-General’s reports on audits of the financial statements of State entities the Audit Act also requires the following at section 29(3):
‘(3) A report under subsection (1) is to describe the basis on which audit fees are calculated.’
To comply with section 29(3), the basis for setting audit fees for conducting audits of the financial statements of State Entities is detailed in this Chapter. Audit fees are not charged for performance audits, compliance audits or investigations.
deTerminaTionWe have determined that an audit fee will be charged for the audits of the financial statements of all State entities other than the University of Tasmanian Foundation Inc.

52 Basis for Setting Audit Fees
prinCiple for audiT fee deTerminaTionFees are set for each State entity commensurate with the size, complexity and risks of the engagement. These factors affect the mix of staff we assign to each audit and therefore the overall fee. Staff are assigned hourly charge rates for use in determining the allocation of work on the audit and in computing the fee.
There is an expectation that audits of similar complexity and risks will have a similar mix of staff.
prinCiple for deTermining Charge raTesCharge rates are based on the principle of the Office being able to recover its costs of operation. Charge rates comprise two parts, direct salary cost and overhead recovery. Direct travel time and costs attributable to each audit are billed separately and do not form part of our charge rates.
basis of feesFees are calculated on the basis that:
• current accounting systems will be operating throughout the year with a satisfactory appraisal of internal control
• no errors or issues requiring significant additional audit work will be encountered
• the standard period-end general ledger reconciliations will be available at the commencement of our year-end audit
• assistance for our staff will be provided with respect to reasonable requests for additional schedules and analysis throughout the audit
• agreed timetables will be met within reason, particularly with regards to the preparation of the financial statements
• the financial statements presented for audit are complete and do not require ongoing changes/adjustments
• additional work (including new accounting standards or issues associated with key risks and other matters arising) will be billed separately if it cannot be absorbed into the existing fee
• the nature of the entity’s business and scale of operations will be similar to that of the previous financial year
• fees incorporate financial statement disclosure and other specific audit related advice.
addiTional audiT feesIf the circumstances outlined under the section headed ‘Basis of Fees’ change in a year, we would seek additional fees from the entity. Any future impact of agreed additional fees would be assessed in terms of the ongoing audit fee.
adjusTmenT To feesFees may be adjusted in the following circumstances:
• changes to the size and nature of the entity and its operations
• changes to the risks associated with a particular engagement
• changes to accounting and auditing standards requiring greater effort on our part
• unavoidable increases in costs of maintaining our Office.

53Basis for Setting Audit Fees
There may also be circumstances where, based on our assessment of size, complexity and risks of the engagement, our fees may be reduced. Fees may also take into account our assessment of the relevance to our audits of work conducted by internal auditors.
In all cases, fees are communicated to each accountable authority prior to audit commencement or during the planning phase.
TransparenCy of individual audiT feesWe have chosen to make the fee setting process for individual State entities transparent. As a consequence, our staff are now required to explain:
• the specific factors taken into account in proposing the fee (particularly the risk assessment)
• the assumptions upon which the fee is based in terms of, for example, the standard of the entity’s control environment, coverage of internal audit, quality of working papers and so on
• what is included in the fee and what is not included
• what specific actions the client could take to reduce the level of its audit fee in the future
• the processes for agreeing additional fees if circumstances change or the assumptions upon which the fee is based are not met.
audiT fee sCalesA matrix (audit fee scale) has been developed to provide a guide for determining the expected time to be taken on an audit. The scales are based on the following key variables:
• the size of the entity based on its expected gross turnover. This was used to determine the base amount of time required to conduct the audit. Turnover was based on the client’s actual income and expenditure for the preceding financial year, adjusted for any known factors (fixed element).
• the risk and complexity profiles for each entity determined by our staff. These profiles include the corporate structure, complexity of systems, operations and financial statement reporting requirements. The time bands applied range from 40 per cent below to 40 per cent above the base time (variable element).
The fee scales take account of:
• changes to Australian Auditing or Accounting Standards
• in some cases, particularly audits returning from contract, a change in scope of work being performed in line with our audit approach whereby selected probity matters will be considered during the course of all audits.

54 Basis for Setting Audit Fees
Fee scales are as follow:
Turnover* Base hoursVariable
component
<$100 000 15 +/-40%
$101 000 to $1.5m 30 +/-40%
$1.5m to $10m 100 +/-40%
$10m to $55m 155 +/-40%
$55m to $121m 270 +/-40%
$121m to $200m 460 +/-40%
$200m to $410m 610 +/-40%
$410m to $1bn 830 +/-40%
>$1bn 1 350 +/-40%
* may be adjusted in line with CPI movements.
Bandings are based on current cost experience in conducting audits.
After applying the above model, the hours to undertake the audit are allocated according to the staff mix necessary to conduct the audit. The respective staff charge rates are then applied to the allocated hours so as to determine a dollar amount (the audit fee). Where applicable, travel and other direct costs (out of pocket expenses) are added to the audit fee on a full cost recovery basis.
fee seTTingIt is emphasised that the fee scales only provide a framework within which we set the actual fees charged to individual State entities.
The level of fee, and any change, experienced by individual State entities will therefore vary according to local circumstances and the risks each entity faces.
In certain circumstances, for example where a State entity faces a particular challenge to manage high risks or there are particular local circumstances, a fee may fall outside the noted bands. In these cases, the audit fee will be determined in discussion between our staff and entity management, to reflect our assessment of risk and the extent and complexity of the audit work required.
skill-relaTed fee sCalesIn certain circumstances, we may need to use staff or contractors with specialist skills in order to review specific local issues. Where this is the case, it can result in higher costs being incurred. In these circumstances, the fee to be charged will be determined in discussion between our staff and entity management and will reflect the size, complexity or any other particular difficulties in respect of the audit work required.
addiTional audiT workIn carrying out additional audit work, including government grant acquittals and other similar returns, we will recover, in respect of such work, an amount that covers the full cost of the relevant work undertaken.

55Audits Dispensed With
audiTs dispensed wiTh
snapshoT• The Auditor-General has the authority to dispense with the audits of State entities but must
consult with the Treasurer prior to such dispensation.
• Audits are dispensed with on the condition that the relevant State entity annually demonstrates appropriated financial reporting and the existence of appropriate alternative audit arrangements.
• In 2012-13, 36 audits were dispensed.
inTroduCTionThe Auditor-General has the discretion under the Audit Act to dispense with certain audits if considered appropriate in the circumstances. The dispensation is subject to conditions determined by the Auditor-General who has imposed the following conditions:
• that the entity must demonstrate to us that its financial reporting and auditing arrangements are appropriate. To satisfy this condition, the dispensed with audit entities are required to submit their audited financial statements to us each year. The financial statements are reviewed and, where necessary, feedback on information presented in the financial statements is provided to the entity or
• that the entity is a subsidiary of a State entity and whose financial transactions and balances are audited as part of the preparation of the consolidated financial statements of the controlling entity or
• grants made to a category of entities are properly managed under Treasurer’s Instruction 709 ‘Grant Management Framework’ (discussed further under the heading ‘Categories of audits and Non-Government Organisations’ later in this Chapter).
It is important to note that dispensation of the audit does not limit any of the Auditor-General’s functions or powers given under the Audit Act.
The Audit Act also requires the Auditor-General to consult with the Treasurer before exercising the power to dispense with audits. Following consultation with the Treasurer, the audits of the annual financial statements of the following specific audits or categories of audits were dispensed with:
speCifiC audiTsControlled Subsidiaries – Year Ended 30 June 2013 (controlling entity shown in brackets)
• Auroracom Pty Ltd (Aurora Energy Pty Ltd)
• Bell Bay Three Pty Ltd (Hydro Tasmania)
• Devonport Maritime & Heritage Authority (Devonport City Council)
• Ezikey Group Pty Ltd (Aurora Energy Pty Ltd)
• Flinders Island Ports Corporation Pty Ltd (Tasmanian Ports Corporation Pty Ltd)
• Heemskirk Holdings Pty Ltd (Hydro Tasmania)
• Heemskirk Wind Farm Pty Ltd (Hydro Tasmania)
• Heritage Building Solutions Pty Ltd (Southern Midlands Council)
• Heritage Education & Skills Centre Pty Ltd (Southern Midlands Council)

56 Audits Dispensed With
• HT Wind Developments Pty Ltd (Hydro Tasmania)
• HT Wind New Zealand Pty Ltd (Hydro Tasmania)
• Hydro Tasmania Consulting (Holding) Pty Ltd
• Kingborough Waste Services Pty Ltd (Kingborough Council)
• King Island Ports Corporation Pty Ltd (Tasmanian Ports Corporation Pty Ltd)
• Metro Coaches (Tas) Pty Ltd (Metro Tasmania Pty Ltd)
• Newood Holdings Pty Ltd (Forestry Tasmania)
• Newood Energy Pty Ltd (Newood Holdings Pty Ltd)
• Newood Huon Pty Ltd (Newood Holdings Pty Ltd)
• Newood Smithton Pty Ltd (Newood Holdings Pty Ltd)
• RBF Property Pty Ltd (Retirement Benefits Fund Board)
• RBF Direct Pty Ltd (Retirement Benefits Fund Board).
• Schools Registration Board (Department of Education)
• Woolnorth Bluff Point Holdings Pty Ltd (Hydro Tasmania)
• Woolnorth Studland Bay Holdings Pty Ltd (Hydro Tasmania).
Foreign Controlled Subsidiaries – Year Ended 30 June 2013 (controlling entity shown in brackets)
For these entities the Auditor-General is not the auditor and, therefore, there is no dispensation. However, the financial results are audited as part of the consolidation process:
• Hydro Tasmania Consulting India Private Limited
• Hydro Tasmania South Africa (Pty) Ltd
• Hydro Tasmania Neusberg (Pty) Ltd.
Drainage Trusts – Year Ended 30 June 2013• Egg Lagoon Drainage Trust
• Elizabeth Macquarie Irrigation Trust.
• Forthside Irrigation Water Trust
• Lake Nowhere-Else Dam/Whitehawk Creek Irrigation Trust
• Lawrenny Irrigation Trust
• Mowbray Swamp Drainage Trust
• Richmond Irrigation Trust.
Drainage Trusts – Year Ended 30 June 2012• Egg Lagoon Drainage Trust.
Other Boards and Authorities - Year Ended 30 June 2013• Tasmanian Pharmacy Authority
• Tasmanian Timber Promotion Board.
Controlled Subsidiaries – Year Ended 31 December 2013 (controlling entity shown in brackets)• UTASAT Pty Ltd (University of Tasmania).
Other Boards - Year Ended 31 December 2013• Board of Architects.
Non-Trading State Entities - Year Ended 30 June 2013 (therefore no financial statements expected)
• Tasmanian Water and Sewerage Corporation Pty Ltd.

57Audits Dispensed With
Categories of audits and Non-Government Organisations
The definition of State entities may encompass public bodies and Non-Government Organisations that traditionally are in receipt of Government grants. Agencies managing these grants are subject to the provisions of Treasurer’s Instruction 709 – ‘Grant Management Framework’.
Compliance with the requirements of Treasurer’s Instruction 709 should ensure appropriate reporting and auditing requirements are satisfied. It is our intention to keep the status quo, that is, those agencies dispensing the funds will be responsible for implementing and monitoring the requirements of the above Treasurer’s Instruction.
As a result, separate audits of these entities were not conducted by our Office and we have not specifically dispensed with each of these audits.
Entities the audits of which were dispensed with in the past but where dispensation is now being reconsidered
As indicated in the introductory section of this Chapter, audits are dispensed with on the condition that the entity must demonstrate to us that its financial reporting and auditing arrangements are appropriate. To satisfy this condition, the dispensed with audit entities are required to submit their audited financial statements to us each year. To date we have not received audited financial statements from the entities listed below as a result of which dispensation is being reconsidered:
• Brittons Swamp Drainage Trust
• Brittons Swamp Water Board
• Togari Drainage Trust.

58 Accounting and Auditing Standards - Developments in Financial Reporting
aCCounTing and audiTing sTandards - developmenTs in finanCial reporTing
snapshoT• AASB 13 Fair Value Measurement is applicable for financial reporting at 30 June 2014. It
clarifies valuation techniques to be applied when reporting assets liabilities at fair value and will require additional disclosures
• AASB 119 Employee Benefits is also applicable for financial reporting at 30 June 2014. It includes new provisions relating to the valuation of leave obligations and the valuation of defined benefit superannuation obligations
• Entities that have entered into arrangements with subsidiary or joint entities , or who are not sure of whether or not these arrangements apply, need to familiarise themselves with AASB 10, 11, 12, 127 and 128
• Standards setters are finalising a new standard dealing with revenue but consideration on a new leasing standard is ongoing.
developmenTs in finanCial reporTingreporting in 2013-14 For the 2013-14 financial reporting period, there are some significant changes to reporting requirements in the public sector. Two key changes arising from new and revised Australian Accounting Standards effective this year are in relation to the reporting of assets and liabilities measured at fair value and the treatment of certain employee benefits.
AASB 13 Fair Value Measurement is broader than previous requirements and applies to both financial and non-financial assets and liabilities measured at fair value. In general, we do not anticipate changes in how financial and non-financial items are measured, but disclosures in financial reports will need to be more extensive.
Of the changes in AASB 119 Employee Benefits, the most significant is the change to an actual discount rate of return, from an expected rate. Where the actual discount rate is lower than the expected rate of return, there will be an increase in costs recognised in profit or loss. This will likely result in increased volatility in the profit or loss for entities with defined benefit obligations.
The standard also changes the definition of short-term employee benefits. Short-term employee benefits not expected to be wholly settled within 12 months are required to be discounted. This may impact the valuation of vested leave such as annual leave for some entities, however balance sheet classification remains a current liability since there is no unconditional right to defer settlement of the obligation.
All significant changes arising from these and other general improvements issued by the Australian Accounting Standards Board for the 2013-14 reporting period will be considered for illustration in the Local Government model accounts prepared by us and in the Model financial statements to be prepared by the Department of Treasury and Finance. All State entities are encouraged to review the impact of these changes as they apply to them.
reporting in 2014-15Progressively over future reporting periods, there are a number of new accounting standards that will become effective for the first time. State entities are encouraged to monitor and consider implementation of reporting requirements over the next few reporting periods to ensure smooth transition.

59Accounting and Auditing Standards - Developments in Financial Reporting
Consolidations and similar transactionsThe following ‘package of five’ standards issued in 2011 encompass consolidation. They introduce broader concepts of control and outline the accounting requirements for consolidated entities, joint arrangements and ‘off balance sheet’ entities:
• AASB 10 Consolidated Financial Statements, which retains the focus of the control principle in determining whether an entity needs to consolidate another entity. The Standard revises the definition of ‘control’, with three key criteria including:
○ power over the investee’s relevant activities
○ exposure, or rights, to variable returns from an investee
○ investor’s ability to use its power to affect the amount of investee’s returns.
The wider definition of control in AASB 10 may increase the number of entities defined as controlled and therefore consolidated.
• AASB 11 Joint Arrangements eliminates the option for joint ventures to be proportionately consolidated as was previously allowed under AASB 131 Interests in Joint Ventures. The standard requires each party to a joint arrangement to recognise its rights and obligations arising from the arrangement. An assessment of the following is required:
○ legal structure
○ the existence of joint and several liability
○ other facts and circumstances surrounding the arrangement.
• AASB 12 Disclosure of Interests in Other Entities, which requires extensive disclosure of information that enables users of financial statements to evaluate the nature of, and risks associated with, interests in other entities and the effects of those interests on the financial statements.
• AASB 127 Separate Financial Statements, which prescribes the accounting and disclosure requirements for investments in subsidiaries, joint ventures and associates when an entity prepares separate financial statements.
• AASB 128 Investments in Associates and Joint Ventures, which prescribes the accounting for investments in associates and sets out the requirements for the application of the equity method when accounting for investments in associates and joint ventures. The revision to AASB 128 aligns with the requirements for joint ventures introduced in AASB 11.
For entities that report on a calendar year basis, the above five standards became effective from 1 January 2014. However, for most not-for-profit entities the five standards will be applicable from the 2014-15 reporting period onwards. Entities are urged to review/reassess the relationships they have with other entities and the potential reporting implications, in light of the transition requirement set out in the standards.
looking further forwardInternationally accounting standard setters have been working on a number of important projects which have the potential to significantly impact financial reporting going forward. The two most significant of these deal with the treatment of leases and revenue recognition.
The leasing project aims to establish principles that lessees and lessors shall apply to report useful information to users of financial statements. The most significant of these, with the exception of lease terms less than 12 months, being the proposal to recognise leased assets and liabilities on the balance sheet. Following responses received on the revised exposure draft, this project is currently being redeliberated.
60 Accounting and Auditing Standards - Developments in Financial Reporting
The revenue recognition project is further progressed, with a new standard planned for release in 2014. The new standard is expected to have a significant impact on how entities recognise, record and disclose revenue. Some of the proposed changes include:
• identifying different performance obligations within a contract and accounting for the components differently – for example, where goods and services are sold in bundles
• increased use of judgement in selling price estimates where there is no observable stand-alone selling price or when consideration is variable
• allocating transaction prices to separate performance obligations by reference to relative stand-alone selling prices instead of the residual method used under the current standard
• withdrawal of the percentage of completion method
• capitalising costs directly attributable to obtaining a contract which are expected to be recovered
• adjusting a transaction’s price for the effect of the time value of money when there is a significant financing component, including where the customer pays in advance
• applying the proposed standard to the transfer of a non-financial asset that is not an output of the entity’s ordinary activities
• more extensive disclosure requirements, such as disaggregation of revenue, reconciliations of contract asset and contract liability balances, information about performance obligations including maturity analysis. Disclosures will also include explanation of significant judgments, such as timing of satisfaction of performance obligations, determination of the transaction price and allocations to performance obligations.
Dividends received and revenues from non-contractual royalties are outside the scope of the proposed standard. The tentative date for application is for reporting periods beginning on or after 1 January 2017.
Entities can prepare for the impact of the new standard by:
• establishing a complete and accurate register of contracts
• considering potential changes that may be required to revenue recognition
• considering whether changes need to be made to the organisation’s IT systems and recording and recognition of revenue transactions
• planning appropriate training for affected staff
• discussing concerns about the impact of the proposed requirements with financial advisors and/or auditors.
developmenTs in finanCial audiTing Auditors are also faced with the prospect of significant changes in future in particular to the way we report. Both the International Auditing and Assurance Standards Board and the Public Company Accounting Oversight Board are pursuing changes to the way auditors report. While retaining the current basic elements of the auditor’s report, the proposed changes would require the auditor to report on a wider range of information specific to the particular audit and auditor.
These changes have in part resulted as an outcome to the global financial crisis. This spurred users, in particular institutional investors and financial analysts, to want to know more about individual audits and to gain further insights into the audited entity and its financial statements.
The new requirements, if determined as currently proposed, would result in auditors commenting on key or critical audit matters to help financial statement users better understand an entity and what the auditor found to be challenging during the course of an audit. Communicating key or critical audit matters would provide users with previously unknown information. Indications are that any proposed standard and amendments would not be effective until after December 2015.

61Accounting and Auditing Standards - Developments in Financial Reporting
In anticipation of this change, our annual ‘Auditor-General’s Reports’ commenced in November 2013 including details of risk factors taken into account in audits.
oTher guidanCesuperannuation guarantee levyFollowing the 2013 Federal Budget, the Superannuation Guarantee Levy will increase progressively from 9 per cent to 12 per cent from 1 July 2013 to 1 July 2019. State entities should take into account these changes when estimating and measuring their employee benefits liabilities and expenses for financial reporting and in future budget estimates. The levy is being phased in as follows:
Date Levy
1 July 2013 9.25%
1 July 2014 9.50%
1 July 2015 10.00%
1 July 2016 10.50%
1 July 2017 11.00%
1 July 2018 11.50%
1 July 2019 12.00%

62 31 December 2013 Audits
31 deCember 2013 audiTs

63Anzac Day Trust
anzaC day TrusT (The Trust)
snapshoT• The Trust had a bank balance of $0.020m at 31 December 2013, which was $0.016m higher
than last year. This was mainly due to the payment to Legacy Tasmania approved in 2013, not being made until after 31 December 2013. No payments were made to Legacy clubs in 2013.
• It derived its receipts principally from Section 10 Grants. Receipts were consistent with 2012.
The audit was completed satisfactorily with no major items outstanding.
inTroduCTionThe Anzac Day Observance Act 1929 (the Act) legislates for 25 April each year to be observed as a public holiday, known as Anzac Day, in commemoration of serving and ex-servicemen and women. The Act specifies what activities may or may not occur on Anzac Day including race meetings, sporting events, and public entertainment activities. The Act also creates the Anzac Day Trust, the role of which is to promote the welfare of veterans and their dependents by providing financial assistance through the Anzac Day Trust Fund. In exchange for allowing sporting events, such as race meetings, on Anzac Day, the RSL negotiated that a portion of profits from those race meetings would be provided to the Fund. However it was very rare that Anzac Day race meetings resulted in a net profit. Because of this, the legislation was changed to allow a payment in lieu of the sum derived from race meetings.
The Trust’s special purpose financial statement is prepared on a cash basis, which is in accordance with Section 14 of the Act.
The Responsible Minister is the Minister of Veterans’ Affairs.
audiT of The 2013 finanCial sTaTemenTsSigned financial statements were received on 24 January 2014, in compliance with the statutory reporting deadline, and an unqualified audit report was issued on 11 February 2014.
The audit was completed satisfactorily with no major items outstanding.
key findings, developmenTs and areas of audiT aTTenTionThere were no major findings or developments in 2013.

64 Anzac Day Trust
summary of finanCial resulTs
2013 2012$’000s $’000s
Opening Cash Balance 4 1
Total Receipts 23 25 Total Payments (7) (22)Closing Cash Balance 20 4
The increase in the Closing Cash Balance of $0.016m was primarily due to the payment to Legacy Tasmania, approved in 2013, not being made until after 31 December 2013. Payments mainly comprised grants to Vietnam Veterans Association of Australia Tasmanian Branch, $0.003m, and National Serviceman’s Association of Australia, Tasmania $0.001m.

65The Solicitors’ Trust
The soliCiTors’ TrusT (The Trust)
snapshoT• The Trust earned interest revenue $3.015m (2012, $3.203m).
• It distributed $3.671m ($2.534m) to law related entities.
• The Trust settled a compensation payment claim, which resulted in a decreased in provision for guaranteed fund claims for $1.346m to $nil.
• Cash balances at 31 December 2013 exceeded the prescribed balance requirements of the Guarantee Fund.
The audit was completed satisfactorily with no matters outstanding.
inTroduCTionThe Trust operates within the Legal Profession Act 2007 (the Act). The Trust consists of three Trustees appointed by the Governor, comprising two legal practitioners nominated by the Law Society and a recognised accounting professional nominated by the Minister. Its function is to administer and manage the Solicitors Guarantee Fund (the Fund). The primary purpose of the Fund is to provide compensation to clients of legal firms for the loss of money or other property held in trust as a result of default in specified circumstances.
The Fund is utilised for operations prescribed under the Act including operation of the Legal Profession Board and the Disciplinary Tribunal, compensation of claimants, administration and for any other purpose approved by the Minister.
Monies deposited into the Fund include:
• interest earned on:
○ statutory deposits made by legal practitioners
○ trust accounts operated by legal practitioners and
○ on funds held
• monies that remains unclaimed 12 months after the date of an annual publication by the Trust of an advertisement detailing unclaimed money paid by legal practitioners since the previous advertisement.
Statutory Deposits from funds contributed by law firms are in accordance with quarterly calculations prescribed by the Act. These funds are administered, but not owned or controlled by the Trust and are available for recall by the law firms at any time. The Statutory Deposits earn interest which is either deposited to the Trust’s operating account or reinvested on maturity.
The Trust invests funds in accordance with the Trustee Act 1898 and applies income arising from funds invested to meet operational expenses and to maintain the Fund. The Fund is currently required to be maintained at a minimum of $5.500m. The Trust is required to advise the Minister if the Fund exceeds the minimum, prescribed amount, and the Minister may then invite law bodies, such as the Legal Aid Commission of Tasmania, Law Foundation of Tasmania, Legal Profession Board or any other law related entity to make application for a grant of money from the surplus in the Fund.
The Trust reports on a calendar year basis.
The Responsible Minister is the Attorney-General.

66 The Solicitors’ Trust
audiT of The 31 deCember 2013 finanCial sTaTemenTsSigned financial statements were received on 14 February 2014 with amended financial statements received on 20 March 2014. An unqualified audit report was issued on 24 March 2014.
key findings and developmenTsThe audit was completed satisfactorily with no matters outstanding.
summary of finanCial resulTsstatement of income and expenditure
2013 2012
$’000s $’000s
Income 3 017 3 273
Administration expenditure 128 114 Guarantee fund expenditure 192 443 Section 361 Distributions 3 671 2 534
Net Surplus (Deficit) (974) 182
statement of financial position
2013 2012
$’000s $’000s
Cash 7 807 9 969 Accounts receivable 999 1 104 Accrued interest 440 481 Other assets 2 3 Total Assets 9 248 11 557
Payables 17 21 Provision for costs 372 357 Provision for guarantee fund claims 0 1 346 Total Liabilities 389 1 724
Net Assets 8 859 9 833
Total Equity 8 859 9 833
In 2013, the Trust reported a Net Deficit of $0.974m (2012, surplus $0.182m). The deficit included $3.671m in distributions to law related bodies, including the Legal Profession Board $0.929m and the Legal Aid Commission $0.851m. Distributions increased by $1.137m in 2013. Excluding the distributions, the Trust’s Net Surplus after Administration and Guarantee fund expenditure was $2.697m ($2.716m).
Total Assets comprised predominantly Cash and investments, $7.807m (2012, $9.969m) and Accounts receivable, $0.999m ($1.104m). Liabilities at 31 December 2013 consisted primarily of the Provision for costs $0.372m ($0.357m). The significant movement in the Provision for guarantee fund claims, a decrease of $1.346m to nil at 31 December 2013, was due to settlement of an outstanding compensation payment claim of $1.346m.

67The Solicitors’ Trust
At balance date the Trust administered $37.752m, (2012, $27.153m) of Statutory Deposits. This balance is dependent upon the level funds held in trust by legal practitioners. These funds are not controlled by the Trust and are not recognised as balances in the financial statements, but are disclosed by way of note.

68 Tasmanian Qualifications Authority
Tasmanian qualifiCaTions auThoriTy (The authority)
snapshoT• The Authority reported an excess of payments over receipts of $0.032m this year, in contrast
to the excess receipts over payment of $0.025m in 2012.
• Despite the excess payments, at 31 December it had a cash balance of $0.616m.
The audit was completed satisfactorily with no issues outstanding.
inTroduCTionThe Authority was established under the Tasmanian Qualifications Authority Act 1985. Its functions include providing consolidation statements of qualifications to students, conducting and moderating assessments for senior secondary courses and issuing the Tasmanian Certificate of Education. The Authority also accredits relevant courses and registers Vocational Education and Training and non-university higher education organisations.
The Responsible Minister is the Minister for Education.
audiT of The 31 deCember 2013 finanCial sTaTemenTsSigned financial statements weree received on 13 February 2014 and an unqualified audit opinion was issued on 24 March 2014.
key findings, developmenTs and areas of audiT aTTenTionThere were no high risk findings identified during the year however we did recommend that the Authority consider preparing its financial statements on an accruals rather than a cash basis which it has agreed to do.
There were no key developments reported in 2013.
The audit was completed satisfactorily with no issues outstanding.
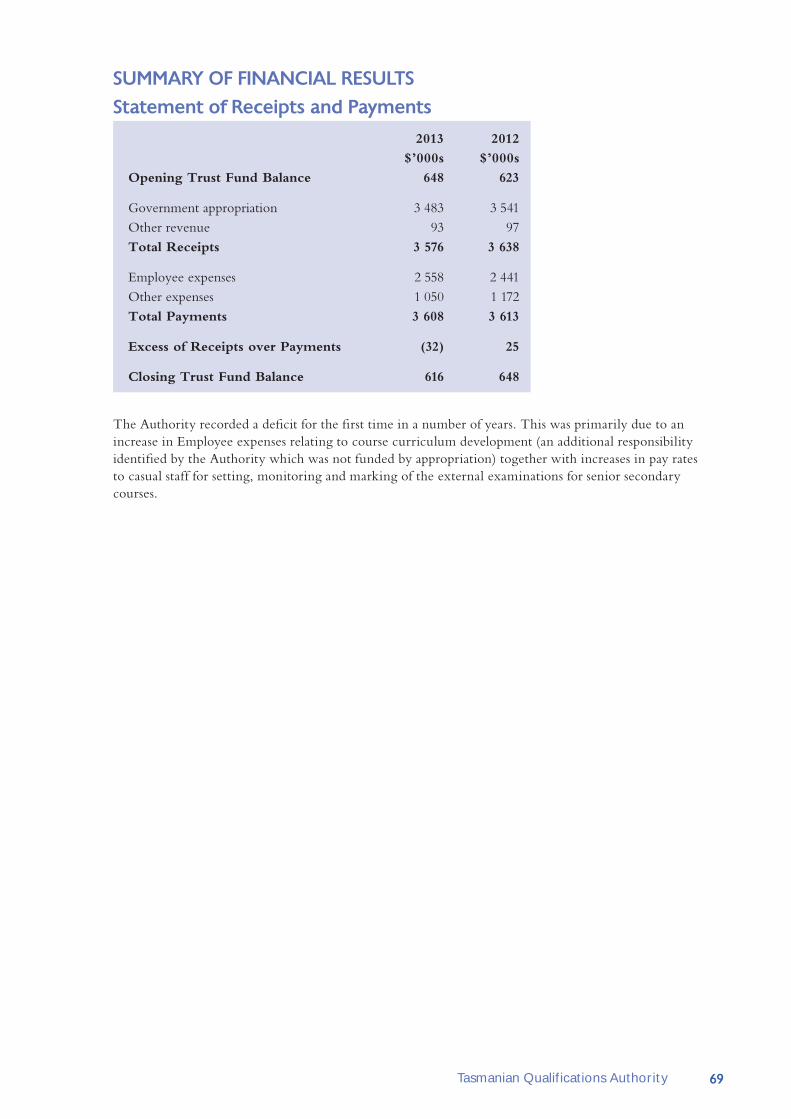
69Tasmanian Qualifications Authority
summary of finanCial resulTsstatement of receipts and payments
2013 2012
$’000s $’000s
Opening Trust Fund Balance 648 623
Government appropriation 3 483 3 541 Other revenue 93 97 Total Receipts 3 576 3 638
Employee expenses 2 558 2 441 Other expenses 1 050 1 172 Total Payments 3 608 3 613
Excess of Receipts over Payments (32) 25
Closing Trust Fund Balance 616 648
The Authority recorded a deficit for the first time in a number of years. This was primarily due to an increase in Employee expenses relating to course curriculum development (an additional responsibility identified by the Authority which was not funded by appropriation) together with increases in pay rates to casual staff for setting, monitoring and marking of the external examinations for senior secondary courses.

70 Theatre Royal Management Board
TheaTre royal managemenT board (The board)
snapshoT• The Board recorded a Net Surplus of $0.050m in 2013, a contrast to the two previous years
of net deficits. This can largely be attributed to an increase in ticket sales and decrease in Depreciation expense.
• As at 31 December 2013, the Board’s Net Assets totalled $1.353m with its most significant asset being Investments of $2.244m. Its most significant liability was advanced ticket sales of $1.260m.
• We noted that banking passwords were being shared between users. This matter has been reported to, and is being addressed by management.
The audit was completed satisfactorily with no outstanding issues.
inTroduCTionThe Board was established under the Theatre Royal Management Act 1986 (the Act). Its functions include management of the Theatre Royal (the Theatre) as a place of theatre and performing arts, and to arrange for, organise and promote performing arts in the Theatre and other places in Tasmania.
The Theatre employees seven full time staff, three part time staff, and a number of casual employees during the year.
The Responsible Minister is the Minister of the Arts.
audiT of The 2013-14 finanCial sTaTemenTsSigned financial statements were received on 13 February 2014 and an unqualified audit report was issued on 17 February 2014.
Note 15 to the financial statements, Economic Dependency includes the comment that:
‘The Theatre Royal Management Board’s entrepreneurial program has been assisted through funding received from Arts Tasmania by the Minister for the Arts. The nature of this and future entrepreneurial programs is dependent on the receipt of this funding. At the date of this report the Board has no reason to believe that the State Government will not continue to support the Theatre Royal Management Board.’
As a result, the financial statements were prepared on the basis that the Theatre is a going concern.
The audit was completed satisfactorily with no outstanding issues.
key findings, developmenTs and risksA key finding was noted, in that EFT passwords are being shared between users. It was recommended that management review their delegation structure and replace it with one that enforces dual authorisation without the need for password sharing.
The Board created the position of Finance Manager in 2013 partly to address completing their financial statements internally and to mitigate the lack of segregation of duties.
The audit was completed satisfactorily with no outstanding issues.

71Theatre Royal Management Board
summary of finanCial resulTsstatement of Comprehensive income
2013 2012
$’000s $’000s
Program revenue 873 874 Grants and contributions 331 308 Donations 2 6 Other operating revenue 737 640 Total Revenue 1 943 1 828
Salaries and operating expenses 1 871 1 909 Depreciation 22 76 Total Expenses 1 893 1 985
Net underlying surplus/(deficit) before: 50 (157)Transfer of Property to the Crown 0 (703)
Net Surplus/(Deficit) 50 (860)
Comprehensive Surplus/(Deficit) 50 (860)
statement of financial position
2013 2012
$’000s $’000s
Cash 217 191 Investments 2 244 1 221 Receivables 155 136 Other 96 100 Total Current Assets 2 712 1 648
Capital WIP 0 70 Equipment 12 13 Leasehold improvements 194 140 Total Non-Current Assets 206 223
Payables 1 402 417 Provisions - employee benefits 71 65 Total Current Liabilities 1 473 482
Provisions - employee benefits 92 87 Total Non-Current Liabilities 92 87
Net Assets 1 353 1 302
Accumulated surpluses 1 353 1 303 Total Equity 1 353 1 303
In 2013 the Board recorded a Net operating surplus of $0.050m, compared to a Net operating deficit of $0.157m in 2012. This was largely attributed to an increase in ticket sales and decrease in Depreciation expense.
A decrease in Depreciation of $0.054m was the result of the previous year’s Transfer of Property to the Crown of $0.703m, effectively lowering depreciable assets controlled by the Board.

72 Theatre Royal Management Board
Equity increased by the Comprehensive Surplus of $0.050m to $1.353m at 31 December 2013.
The increase in Investments from prior year, $1.023m, was predominantly due to cash received in advance for shows not yet performed. This is reflected by the increase in Payables and Other liabilities of $0.985m, mainly represented by the increase in revenue received in advance of $1.008m, and partially offset by a decrease in trade payables, $0.032m.
statement of Cash flows
2013 2012
$’000s $’000s
Government grants 364 307 Receipts from customers 2 696 1 200 Payments to suppliers and employees (2 059) (1 885)Interest received 52 90 Cash from Operations 1 053 (288)
Withdrawals from investments 2 135 316 Payments for fixed assets (4) (74)Payments for leasehold improvements 0 0 Deposits to investments (3 158) 0 Cash from (used in) Investing Activities (1 027) 242
Repayment of borrowings 0 0 Cash (used in) Financing Activities 0 0
Net Increase (Decrease) in Cash 26 (46)
Cash at the beginning of the year 191 237 Cash at end of the Year 217 191
financial analysis
Bench Mark 2013 2012
Financial Performance
Result from operations ($'000s) 50 (157)(before capital grant)Operating margin* >1.0 1.03 0.92 Underlying result ratio 2.6% (47.0%)Self financing ratio* 54.2% (15.8%)Own source revenue (%)* 44.9% 47.8%
Financial Management
Current ratio >1.0 1.84 3.42
* For commentary on these indicators refer to the financial results section of this Chapter.

73University of Tasmania
universiTy of Tasmania (The university)
snapshoT• The University incurred an Underlying Deficit of $9.070m, 68% better than the 2012 result, and a
comprehensive surplus of $41.391m, consistent with 2012.
• Commonwealth funding accounted for 66.6% of Total Revenue, inclusive of investment and capital revenues, in 2013. This remains above the Commonwealth benchmark of ‘not more than’ 65% reliant on the Commonwealth.
• The largest component of expenditure for 2013 was Salary related costs, $298.941m, which represented 59.7% of Total Expenses. These costs increased by 6.4% in 2013 despite insignificant change in total employee numbers. The restructure initiated in 2012 has ensured employee numbers have remained steady while student enrolments have grown 16% over the past two years. However, in the last three months of 2013, FTE declined by more than 100.
• At 31 December 2013, the University’s total assets were $1.084bn and its Net Assets amounted to $872.155m, an increase of $41.391m from 2012.
• Property, plant and equipment, $665.906m, continue to represent the majority of total assets, comprising 61.4% at 31 December 2013.
• Cash, short and long term investments, $341.576m, were also significant, representing 31.5% of total assets at 31 December 2013.
Key developments this year included:
• Approval of a ten year unsecured loan of $130.000m with TASCORP for the construction of student accommodation under the National Rent Affordability Scheme (NRAS). The University had not previously had any form of borrowings. The project will be funded by rental income earned, which is partially funded through the Federal Government NRAS scheme and the University are making a $25.000m contribution. However, because Federal funding will not be received until the projects are complete and until rental income is being generated, the University must fund construction in full resulting in the TASCORP loan.
• Receipt of $11.000m from the Education Investment Fund for the construction of the Academy of Creative Industries and Performing Arts (ACIPA) centre in Campbell Street, Hobart.
• An additional $8.420m was spent on finalising the Menzies Research Institute/Health Sciences Co-location project during 2013.
• Further development of the Institute for Marine and Antarctic Studies (IMAS) building. An additional $23.917m was spent during 2013. Practical completion of this project occurred during November 2013, with a total commissioned cost of $44.203m.
• Continued development of the Technology One Student Management System (SLIMS) project. A further $9.738m was spent in 2013 and the total amount in work in progress at 31 December 2013 was $20.788m. The total budget for this project is $36.900m with the expectation it will be commissioned in September 2014.
Major variations between the 2012 and 2013 years were:
• The University recorded Restructure costs of $23.250m and a provision for restructure of $16.197m in their financial statements in 2012. A total of 135 employees departed during 2013 requiring payment of $11.847m and an additional 11 employees were accrued during 2013 totalling $1.915m. The balance of the provision at 31 December 2013 was for 50 employees totalling $5.845m.
• Capital grants received were $12.631m less in 2013 primarily due to a $15.000m contribution received in 2012 from the state government towards the construction of Menzies 2.

74 University of Tasmania
The audit was completed satisfactorily with the following issue noted. Management identified two agreements entered into during 2013 that were assessed as finance leases. Under the University of Tasmania Act 1992 (Act), the Treasurer must approve any borrowings undertaken by the University which had not occurred. This matter has since been resolved by pay-out of the leases and policies have been implemented to mitigate the risk of such transaction occurring again.
inTroduCTionThe University is administered under the provisions of the University of Tasmania Act 1992. It relies predominantly on Commonwealth support for its recurring activities.
The Consolidated financial report comprises the financial statements of the University, being the parent entity, and entities under its control during the financial year. Controlled entities are:
• University of Tasmania Foundation Inc.
• AMC Search Limited
• UTASAT Pty Ltd as trustee for the University Asset Trust, which did not operate during 2013.
The Commonwealth Department of Education (EDUCATION) formerly the Department of Industry, Innovation, Science, Research and Tertiary Education (DIISRTE) sets financial reporting guidelines that Universities must adhere to. These requirements are consistent with Australian Accounting Standards and the University complies with these guidelines and standards.
The University reports on a calendar year basis, hence the financial results relate to the year ended 31 December 2013. The results reported in this Chapter relate to the University’s consolidated financial performance.
The Responsible Minister is the Minister for Education.
key areas of audiT aTTenTion
Area of Audit Attention Impact on our Audit Approach
Restricted funds
Restricted funds are utilised for specified expenditure purposes only.
We reviewed and tested expenditure from restricted funds to ensure payments complied with approved purposes.
Long-term investment portfolio
The University and University of Tasmania Foundation Inc. have a long-term investment portfolio.
A professional accounting firm provide advice and administration to assist the University in making investing decisions. The University manages the portfolio in-house.
We confirmed investments with fund managers and where applicable reconciled the number of units and unit prices at 31 December.
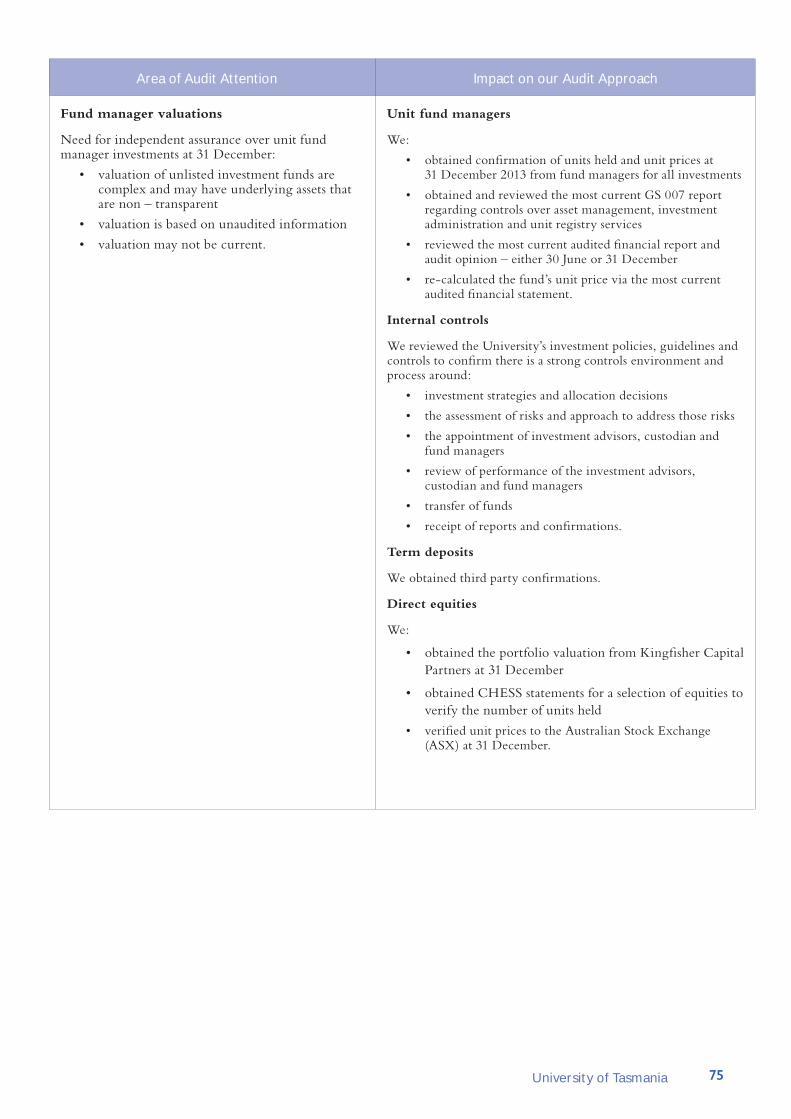
75University of Tasmania
Area of Audit Attention Impact on our Audit Approach
Fund manager valuations
Need for independent assurance over unit fund manager investments at 31 December:
• valuation of unlisted investment funds are complex and may have underlying assets that are non – transparent
• valuation is based on unaudited information
• valuation may not be current.
Unit fund managers
We:
• obtained confirmation of units held and unit prices at 31 December 2013 from fund managers for all investments
• obtained and reviewed the most current GS 007 report regarding controls over asset management, investment administration and unit registry services
• reviewed the most current audited financial report and audit opinion – either 30 June or 31 December
• re-calculated the fund’s unit price via the most current audited financial statement.
Internal controls
We reviewed the University’s investment policies, guidelines and controls to confirm there is a strong controls environment and process around:
• investment strategies and allocation decisions
• the assessment of risks and approach to address those risks
• the appointment of investment advisors, custodian and fund managers
• review of performance of the investment advisors, custodian and fund managers
• transfer of funds
• receipt of reports and confirmations.
Term deposits
We obtained third party confirmations.
Direct equities
We:
• obtained the portfolio valuation from Kingfisher Capital Partners at 31 December
• obtained CHESS statements for a selection of equities to verify the number of units held
• verified unit prices to the Australian Stock Exchange (ASX) at 31 December.

76 University of Tasmania
Area of Audit Attention Impact on our Audit Approach
Capital Expenditure
The University was undertaking a number of capital projects. Significant capital expenditure projects during 2013 included:
• Continued development of the IMAS building adjacent to CSIRO on the Hobart waterfront. Practical completion was due on 30 November 2013.
• Finalisation of the Health Sciences Co-location Stage 2.
• Ongoing development of the SLIMS project due for completion in September 2014.
We tested transactions and allocation of expenditure between capital and expenditure. In addition, we reviewed tender procedures to ensure the University complied with its procurement procedures.
In addition we:
• verified material capital expenditure
• verified capital work-in-progress at year end
• reviewed the disclosure of future commitments
• reviewed the status report from the SLIMS Project Manager and/or project reviews undertaken by Deloitte
• reviewed SLIMS project work in progress balance against budget for possible impairment
• ensured the asset register correctly reflects capital expenditure.

77University of Tasmania
Area of Audit Attention Impact on our Audit Approach
Commonwealth Accommodation Program
The University secured funding through the NRAS to build 770 self-contained apartments at a cost of approximately $118.600m. This will comprise:
• Newnham Campus – budget $18.401m, 120 units
• Hobart CBD – budget $75.913m, 430 units
• Launceston CBD (Inveresk) – budget $19.650m, 180 units
• Cradle Coast Campus – budget $4.636m, 40 units.
Construction for the Newnham Campus in Launceston started during 2013. Construction in Melville Street Hobart is still in the design phase. Construction for Inveresk and Cradle Coast are in the planning phase.
At 30 September 2013, when our planning was completed, $6.945m had been spent on these projects, including $2.391m of capitalised interest. The University have determined that the projects meet the definition of a qualifying asset in accordance with AASB 123 Borrowing Costs.
The project will be funded by the rental income, which is partially funded by the Federal Government. The University are making a $25.000m contribution to the project. However, because Federal funding will not be received until the projects are complete and until rental income is being generated, the University will have to fund construction in full. As a result, the University have entered into a loan agreement with TASCORP, to borrow a maximum $130.000m in interim funding.
Borrowings are repayable over a ten year period.
The University have drawn down $93.600m and invested these funds into term deposits with the Commonwealth Bank of Australia and NAB. The term deposits have varying maturity dates which coincide with the cash outflows for each project.
We:
• verified material capital expenditure and capital work-in-progress at year end
• reviewed the disclosure of future commitments
• confirmed the balance of the loan at year end and allocation between current and non-current
• reviewed the allocation between interest capitalised and expensed
• reviewed the processes and controls over tendering for capital contracts.

78 University of Tasmania
Area of Audit Attention Impact on our Audit Approach
Academy of Creative Industries and Performing Arts
The University are in the progress of constructing an ACIPA adjacent to Theatre Royal in Campbell Street, Hobart. The project is currently in its planning phase.
The budget for this project is $75.200m comprising funding from the Commonwealth $37.000m, State $15.300m (including an in kind donation of land, $3.200m) and internal funding $22.900m.
Practical completion is expected in December 2017.
The University received Commonwealth funding of $11.000m during 2013.
We:
• reviewed the recognition and disclosure of the grant revenue received in advance
• tested any costs capitalised by 31 December 2013
• confirmed disclosure of commitments in the notes to the financial statements.
Redundancy Program
The University commenced making redundancy payments and charging these against the provisions established for this purpose at 31 December 2012.
We tested payments and their allocations in the general ledger.
Asset Management
Discussions were held in 2012 regarding potentially ageing building infrastructure and calculation of various asset sustainability ratios included in our report to Parliament.
Discussions with management indicated they acknowledge the existence of a backlog and that this will be addressed progressively in particular once current high capital expenditure programs slow down. However, infrastructure was fairly presented in the financial statements at 31 December 2013.
Tasmanian University Union Incorporated
Management indicated it expects to determine a position regarding control of the Tasmanian University Union Incorporated (TUU) as defined by AASB 10 Consolidated Financial Statements during 2014. Such determination will impact whether or not TUU is consolidated. Should the University consolidate the financial information of TUU, it will need to treat the change retrospectively and amend the 2013 comparative balances.
We will review management’s assessment during 2014.
audiT of The 2013 finanCial sTaTemenTsFinancial statements signed by the University Council were received on 14 February 2014 and an unqualified audit report was issued on the same date.
The audit of the University’s financial statements, and those of its subsidiary entities that were subjected to audit, were completed successfully with no matters outstanding.

79University of Tasmania
key findingfinance leasesManagement identified two agreements entered into during 2013 that were assessed as finance leases. Under the University of Tasmania Act 1992 (Act), the Treasurer must approve any borrowings undertaken by the University. The definition of borrowings extends to include finance leases. Action was taken to settle these liabilities and procedures have been put in place to ensure the University does not breach its borrowings restrictions in future.
key developmenTs national rent affordability scheme – borrowings During 2013 TASCORP approved a ten year unsecured loan of $130.000m to the University. The purpose of this loan is to construct student accommodation under NRAS. The University will construct 770 self-contained apartments at a cost of approximately $118.600m, comprising:
• Newnham Campus – budget $18.401m, 120 units
• Hobart CBD – budget $75.913m, 430 units
• Launceston CBD (Inveresk) – budget $19.650m, 180 units
• Cradle Coast Campus – budget $4.636m, 40 units.
At 31 December 2013, the University had drawn down $93.600m of this loan and spent a total of $14.442m on these projects. The interest incurred to 31 December 2013 was $3.937m. The University invested the funds drawn down into short term and long term deposits which coincide with the expected cash flows of each project. The funds invested earned interest of $1.966m. The net interest capitalised on these projects during 2013 was $1.971m.
overdraft facilityThe University arranged for an overdraft facility of $50.000m with TASCORP for operational requirements, if needed. This facility was unused at 31 December 2013.
academy of Creative industries and performing artsThe University received $11.000m from the Education Investment Fund for the construction of the ACIPA adjacent to the Theatre Royal in Campbell Street, Hobart. The budget for this project is $75.200m comprising funding from the Commonwealth $37.000m, State $15.300m (including an in kind donation of land, $3.200m) and internal funding $22.900m.
The project is currently in its design phase with the University having spent $0.994m to 31 December 2013. Practical completion is expected in December 2017.
menzies stage 2An additional $8.420m was spent on the Menzies Research Institute/Health Sciences Co-location project (referred to as Menzies stage 2) during 2013 to finalise this project. This building was commissioned in 2012.
institute for marine and antarctic studiesDevelopment of the IMAS building adjacent to CSIRO on the Hobart waterfront continued in 2013 with a further $23.917m this year. Practical completion of this project occurred during November 2013, with a total commissioned cost of $44.203m.

80 University of Tasmania
Technology one student management systemDevelopment of the SLIMS project, which has a budget of $36.900m, continued in 2013. A further $9.738m was spent this year and the total amount in work in progress at 31 December was $20.788m. This project is being closely monitored by Council.
finanCial analysisThe underlying deficit reported by the University’s parent entity in 2013 was $4.241m (2012; $3.734m deficit) and was referred to in the audited financial statements as the ‘core activities’. This is different to the underlying deficit reported in this Chapter of $9.070m ($28.406m) due primarily to three factors:
• restructure costs, $1.915m (2012, $23.250m), and commonwealth grant scheme and HECS adjustments, $0.631m (2012, $2.870m), both of which we have included as ‘core’ activities in this Chapter and
• our analysis is based on the group position, not the parent (the parent is the University).
The University incurred an underlying deficit, before taxation and non-operating items, of $9.070m (2012, $28.406m deficit) but a Comprehensive surplus of $41.391m ($39.422m). The higher underlying deficit in 2012 was mainly attributable to higher restructure costs of $21.335m in that year.
At 31 December 2013, the University’s net assets totalled $872.155m, an increase of $41.391m on 2012 being the Comprehensive surplus for the year. The Comprehensive surplus was $50.461m stronger than the underlying result due to strong investment earnings and capital grants received offset by a decline in restricted funds earned.
The following 10 graphs summarise key ratios highlighting important aspects of the University’s financial performance over the past five years. Where applicable, in each graph the benchmark is represented by the black line with the red line being the actual performance trend line and, where relevant, formulae used by EDUCATION are applied.
Note: In this graph revenue includes capital and investment revenues
Total Revenue growth, expressed in percentage terms, was high in 2009 and 2012 when investment gains were particularly. The decline in 2011 was mainly due to:
• lower Australian Government financial assistance for capital funding
• lower Investment revenue due to adverse investment conditions
• total student enrolment growth in 2011 was low, 1.1%.
Total Revenue in 2013 was consistent with 2012, an increase of only 1.16%.
(10%)
(5%)
0%
5%
10%
15%
20%
2009 2010 2011 2012 2013
Total Revenue Growth

81University of Tasmania
Note: This graph includes investment gains, capital and research funding.
The University’s reliance on Commonwealth Government funding increased over the 2009 to 2011 period but declined in 2012 and 2013 primarily due to strong investments gains and higher contributions from the State government in these years.
The DIISRTE benchmark is for less than 65% reliance on the Commonwealth with the graph indicating the University continue to be reliant on the Commonwealth for more than 65% of its funding although not significantly. This high reliance exposes the University to changes in Commonwealth government policy.
Note: The operating margin is calculated excluding investment returns, capital revenues and movements in
restricted revenues earned.
The Operating margin approximated the benchmark of one in 2009 and 2010 but declined slightly in 2011, 2012 and 2013 consistent with underlying deficits before taxation and non-operating items in these three years. Excluding restructure costs, the margin for 2012 would be 0.99.
0.90
0.94
0.98
1.02
2009 2010 2011 2012 2013
Operating Margin
60%
65%
70%
75%
80%
2009 2010 2011 2012 2013
Proportion of Total Commonwealth Government
Funding Including HECS
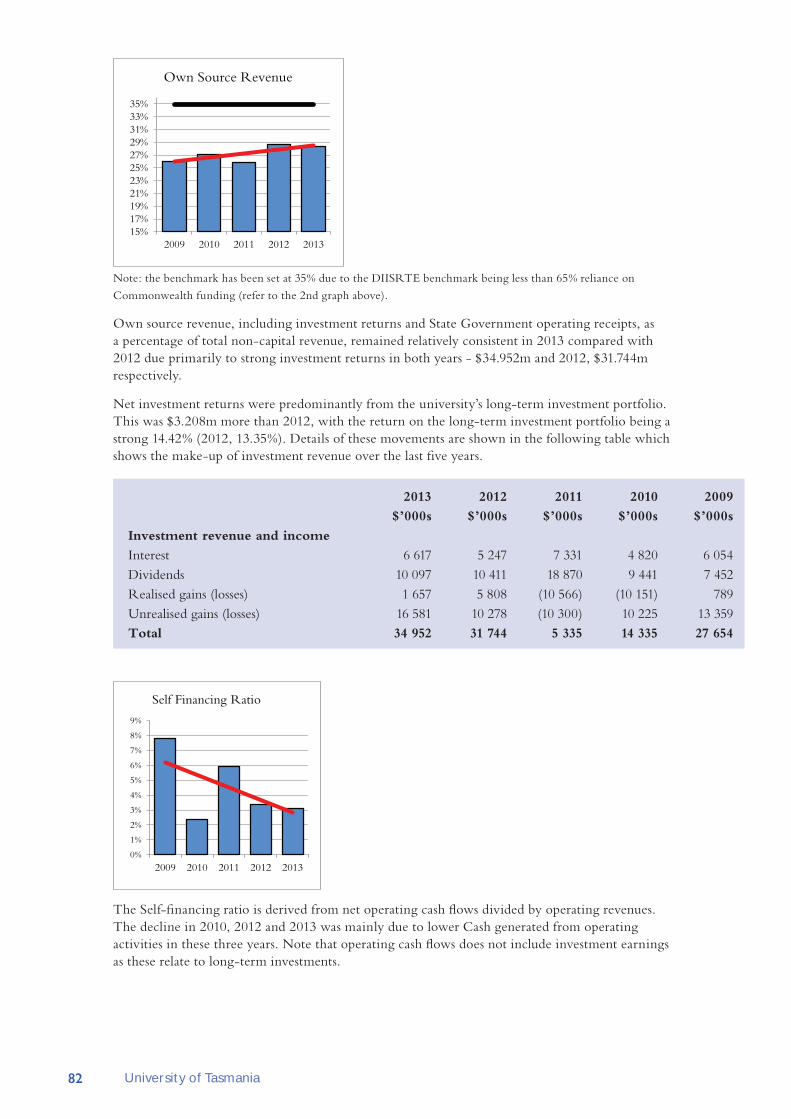
82 University of Tasmania
Note: the benchmark has been set at 35% due to the DIISRTE benchmark being less than 65% reliance on
Commonwealth funding (refer to the 2nd graph above).
Own source revenue, including investment returns and State Government operating receipts, as a percentage of total non-capital revenue, remained relatively consistent in 2013 compared with 2012 due primarily to strong investment returns in both years - $34.952m and 2012, $31.744m respectively.
Net investment returns were predominantly from the university’s long-term investment portfolio. This was $3.208m more than 2012, with the return on the long-term investment portfolio being a strong 14.42% (2012, 13.35%). Details of these movements are shown in the following table which shows the make-up of investment revenue over the last five years.
2013 2012 2011 2010 2009
$’000s $’000s $’000s $’000s $’000s
Investment revenue and income
Interest 6 617 5 247 7 331 4 820 6 054 Dividends 10 097 10 411 18 870 9 441 7 452 Realised gains (losses) 1 657 5 808 (10 566) (10 151) 789 Unrealised gains (losses) 16 581 10 278 (10 300) 10 225 13 359 Total 34 952 31 744 5 335 14 335 27 654
The Self-financing ratio is derived from net operating cash flows divided by operating revenues. The decline in 2010, 2012 and 2013 was mainly due to lower Cash generated from operating activities in these three years. Note that operating cash flows does not include investment earnings as these relate to long-term investments.
15%17%19%21%23%25%27%29%31%33%35%
2009 2010 2011 2012 2013
Own Source Revenue
0%
1%
2%
3%
4%
5%
6%
7%
8%
9%
2009 2010 2011 2012 2013
Self Financing Ratio

83University of Tasmania
The Liquidity Ratio was above the benchmark in all five years indicating the University was able to meet short-term commitments. The ratio was also above the DIISRTE benchmark of ‘greater than one’, resulting in the University being in a low risk category for this measure. The reduction in 2012 was primarily due to lower Cash and short-term deposits due to capital works programs and restructure costs. The increase in 2013 was primarily due to NRAS borrowings of $63.426m being held in cash and short-term deposits.
This ratio represents the University’s utilisation of its building assets. It indicates the extent to which buildings have been consumed as indicated by accumulated depreciation compared to the gross revaluation amount plus additions since the most recent revaluation. Data above the green line benchmark indicated a low risk rating, below the blue line a high risk rating and between the two lines a moderate risk rating.
A ratio of 54% in the current year indicates that at 31 December 2013, 46% of the University’s buildings had been ‘consumed’. The ratio is within our benchmark of between 40% and 60% and is improving, mainly due to high levels of investment in new buildings during the 2010-13 period. Overall, at 31 December 2013, the University’s building assets had sufficient capacity to continue to provide services.
0.00
1.00
2.00
3.00
4.00
5.00
6.00
2009 2010 2011 2012 2013
Liquidity Ratio
0%
10%
20%
30%
40%
50%
60%
70%
80%
2009 2010 2011 2012 2013
Buildings Consumption Ratio

84 University of Tasmania
Note: the information for 2009 was unavailable.
The building sustainability ratio, which measures the University’s investment in existing buildings compared to depreciation on those buildings, declined to 66% in 2013, below our benchmark of 100%. However, on average over the past four years the ratio was 121%.
Conclusions about building sustainability and consumption need to be considered together and in light of the University’s capital, and on-going maintenance, programs. Details of the University’s repairs and maintenance expenses over the last four years are noted in the following table:
2013 2012 2011 2010
$’000s $’000s $’000s $’000s
Repairs and Maintenance
Buildings and ground 15 074 13 859 14 019 11 729 Equipment 2 072 2 547 2 374 2 702 Total 17 146 16 406 16 393 14 431
Note: the information for 2009 was unavailable.
Staff numbers remained constant in 2013 with non-academic numbers increasing by only four FTEs and academic by six FTEs.
0%
50%
100%
150%
200%
250%
2010 2011 2012 2013
Building Sustainability Ratio
900
1 100
1 300
1 500
1 700
1 900
$50 000
$60 000
$70 000
$80 000
$90 000
$100 000
$110 000
$120 000
$130 000
$140 000
$150 000
$160 000
$170 000
2009 2010 2011 2012 2013
Em
ploy
ee N
umbe
rs
Sala
ries
Year
Salaries and Employee Numbers
Salaries: Non-Academic Salaries: Academic
Staff numbers (FTEs) Non-Academic Staff numbers (FTEs) Academic

85University of Tasmania
Academic salary costs increased over the five year period. In 2013 the higher salary costs were due primarily to:
• EBA increment of 2.2%, effective 1 July 2013 (previously 4.0%)
• incremental progressions for employees within their salary classifications
• higher superannuation contributions due to higher salaries.
Non-academic salary costs increased in line with the increase in FTE with the higher salary costs in 2013 primarily caused by the same reasons as for non-academic staff.
restructure Costs/provision (not included in the salary discussions above)The University recorded Restructure costs of $23.250m and a provision for restructure of $16.197m in their financial statements for the first time in 2012.
The following is a reconciliation of the movement in the provision between 2012 and 2013:
• 74 employees took redundancies prior to 31 December 2012
• 174 employees were accrued at 31 December 2012 amounting to $16.197m
• 135 employees departed during 2013 costing $11.847m which was allocated to the provision
• accrued internal project costs paid in 2013 were $0.420m
• 11 new employees were accrued during 2013 amounting to $1.915m, expensed in 2013
• the balance of the provision at 31 December 2013 was 50 employees totalling $5.845m.
Employees departing via the formal expressions of interest program were unable to be re-employed for a period of 12 months from departure date either in a part-time, casual or full-time capacity. The University has internal controls in place to ensure human resource staff are aware of this.
Evident from this analysis is that the University’s restructure program has resulted in employee numbers being held constant through a period of sustained growth for the University. In the past two years, enrolments have increased 7% in 2012 and 9% in 2013. However, in the last three months of 2013, more than 100 FTE left the University under its restructure program.
The budgeted 2013 on-shore student load was 17 115 Equivalent Full-time Student Load (EFTSL) which included a Commonwealth supported load of 13 346 EFTSL.
Total student numbers steadily increased over the four year period. The University continues to target student growth and in 2013 the total on shore load of 17 251 was 136 above target.
The increase of 1 253 students (on-shore and off-shore) in 2013 or 7.3% was significantly higher than 2012 (increase of 697 students or 4.1%). The University is highly dependent on student numbers for Commonwealth funds to finance its operations.
12 000
13 000
14 000
15 000
16 000
17 000
18 000
19 000
2009 2010 2011 2012 2013
EFT
SL
Equivalent full time student load (EFTSL)
Students

86 University of Tasmania
In 2013 the University received an additional $28.532m in Commonwealth grant scheme funding and HECS-HELP (Higher Education Loan Program) due to increased Commonwealth supported students of 1 173.
amC searCh lTd (amC searCh)AMC Search is a specialised organisation, providing maritime related training and consultancy for a wide range of international and Australian organisations and individuals.
Total Revenue in 2013 was $6.779m, down $1.037m on 2012, and Total Expenditure was $6.124m, down by $0.784m on 2012.
At 31 December 2013, Net Assets were $4.188m, down $0.084m on 2012.
AMC Search’s contribution to the University in 2013 was $0.726m (2012, $0.992m) based on 80% of AMC Search’s 2012 surplus.
On 5 June 2013, AMC Search entered into a service agreement with the Department of Defence for the provision of the pacific patrol boat training course for the next four years. A condition of the agreement is the holding of a $1.000m guarantee by a third party financial institution. These funds, while recognised on AMC Search’s balance sheet, are restricted for the period of the agreement.
The loss of the patrol boat training revenue between December 2012 and June 2013, while a new service agreement was negotiated, was the significant factor in AMC Search’s lower revenue and expenditure in 2013.
AMC Search was in a sound financial position at each balance date.
universiTy of Tasmania foundaTion inC (foundaTion)The Foundation’s purpose is to generate donations and bequest income for the purpose of making scholarship and bursary payments to approved recipients.
The Foundation generated operating surpluses in all four years under review.
Its Total Revenue in 2013 was $15.798m (2012, $13.658m), which mainly comprised donations received, $9.157m ($8.186m), and investment revenue, $4.820m ($4.000m). In 2013, the Foundation received $5.436m ($5.153m) in donations for the Medical Sciences Building and transferred $7.863m ($4.000m) of this to the University.
The Foundation’s other main expense was Scholarships, bursaries and other payments of $1.821m ($1.332m) which fluctuate from year to year depending upon fund availability or decisions when to offer scholarships and grants.

87University of Tasmania
ChapTer appendiCiesstatement of Comprehensive income
2013 2012 2011 2010
$’000s $’000s $’000s $’000s
State Government grants 11 568 16 110 14 078 12 946 Commonwealth grants 290 116 278 374 262 662 235 454 Higher Education Contributions scheme 69 574 58 367 51 480 50 092 User charges and fees 73 052 73 926 69 395 63 344 Other operating revenue 47 662 50 224 48 966 54 403 Deferred Government superannuation contributions* 0 0 (356) 90 Total Revenue 491 972 477 001 446 225 416 329
Academic salary costs 163 475 153 527 144 178 130 933 Non-academic salary costs 135 466 127 435 117 001 109 227 Depreciation and amortisation 25 580 22 316 20 256 19 828 Repairs and maintenance 17 146 16 406 16 393 14 431 Research sub-contractors 23 983 31 810 27 378 29 341 Scholarships and prizes 22 575 21 458 20 671 21 467 Consultancy and advisory services 22 434 18 327 15 401 13 508 Other operating expenses 87 509 93 659 90 896 78 022 Restructure costs 1 915 23 250 0 0 Deferred superannuation expense 959 (2 781) (356) 90 Total Expenses 501 042 505 407 451 818 416 847
Net Surplus (Deficit) Before Taxation and Non-Operating Adjustments (9 070) (28 406) (5 593) (518)
Income Tax Expense (Benefit) 0 0 0 2 Net Surplus (Deficit) After Taxation, Before Non-Operating Adjustments (9 070) (28 406) (5 593) (520)
Investment gains - including dividends and interest received 34 952 31 744 5 335 14 335 Capital grants received from the State, Commonwealth and industry 21 750 34 381 27 202 55 832 Current year movement in restricted funds (7 212) 3 434 (814) (5 711)Take up of leave provision adjustments 0 0 (2 542) (4 923)Surplus for the Year 40 420 41 153 23 588 59 013
Gain (loss) on revaluation of land, buildings and leasehold improvements (163) 0 (10 082) 39 191 Gain (loss) on revaluation of art 0 0 0 757 Net actuarial gain (loss) from superannuation plans* 1 134 (1 731) 0 0 Total Comprehensive Income 41 391 39 422 13 506 98 961
* Changes to accounting for defined benefit plans, effective 1 January 2013, require actuarial gains and losses to be recognised in other
comprehensive income. The figures for 2010 and 2011 have not been amended.

88 University of Tasmania
statement of financial position
2013 2012 2011 2010
$’000s $’000s $’000s $’000s
Cash and short-term investments 71 706 31 369 78 825 77 569 Receivables 24 616 22 087 18 881 12 834 Investments 0 0 0 (63)Inventories 904 920 967 737 Other 6 888 5 062 3 904 10 577 Total Current Assets 104 114 59 438 102 577 101 654
Payables 24 619 16 209 14 084 13 273 Provisions 50 619 52 261 36 423 29 835 Other 15 017 14 166 18 021 14 510 Total Current Liabilities 90 255 82 636 68 528 57 618
Net Working Capital 13 859 (23 198) 34 049 44 036
Investments 253 870 227 683 198 868 211 371 Property, plant and equipment 665 906 619 839 558 691 530 174 Receivables 8 894 10 527 8 521 10 426 Long-term deposits 16 000 0 0 0 Intangibles 34 923 28 888 18 902 9 194 Total Non-Current Assets 979 593 886 937 784 982 761 165
Provisions 27 697 32 975 27 689 27 365 Borrowings 93 600 0 0 0 Total Non-Current Liabilities 121 297 32 975 27 689 27 365
Net Assets 872 155 830 764 791 342 777 836
Restricted Funds 138 021 138 208 123 032 99 870 Reserves 269 232 269 395 269 395 279 477 Retained surpluses 464 902 423 161 398 915 398 489 Total Equity 872 155 830 764 791 342 777 836

89University of Tasmania
statement of Cash flows
2013 2012 2011 2010
$’000s $’000s $’000s $’000s
State Government grants 12 725 34 221 19 336 14 241 Commonwealth grants and funding 351 710 317 835 311 200 285 636 Receipts from customers 152 889 143 927 133 126 130 433 Payments to suppliers and employees (503 094) (483 493) (438 764) (423 784)Dividends and interest received 1 143 3 586 1 563 3 320 Cash from Operations 15 373 16 076 26 461 9 846
Investment earnings 13 223 9 015 22 503 10 875 Commonwealth capital grant funding 13 073 15 381 21 702 55 832 State capital grant funding 0 15 000 3 500 0 Other capital funding 8 677 4 000 2 000 0 Net proceeds on disposal from (payments for) investments (23 949) (12 729) (8 426) (29 031)Payments for property, plant and equipment and intangibles (79 030) (95 092) (69 196) (41 077)Proceeds from sale of property, plant and equipment 1 034 1 414 649 1 425 Other investing cash flows (1 664) (521) 2 063 1 221 Cash (used in) Investing Activities (68 636) (63 532) (25 205) (755)
Proceeds form borrowings 93 600 0 0 0 Cash from Investing Activities 93 600 0 0 0
Net Increase (Decrease) in Cash 40 337 (47 456) 1 256 9 091
Cash at the beginning of the year 31 369 78 825 77 569 68 478 Cash at End of the Year 71 706 31 369 78 825 77 569

90 University of Tasmania
financial analysis
Bench Mark 2013 2012 2011 2010
Financial Performance
Total Revenue Growth* >5 1.16% 13.44% (1.59%) 7.47%Proportion of Total Commonwealth Govt Funding* <65 65.56% 64.83% 71.30% 70.17%Result from operations before tax & non-operating adjustments ($'000s) (9 070) (28 406) (5 593) (518)Operating margin* >1.0 0.98 0.94 0.99 1.00 State grants as a % of operating income 2.4% 3.4% 3.2% 3.1%HECS as a % of operating income 14% 12% 12% 12%Self financing ratio* 3.1% 3.4% 5.9% 2.4%Own source revenue (%)* 28% 29% 26% 27%
Financial Management
Liquidity ratio* >1.0 3.91 2.44 4.81 4.77 Debt collection 30 days 43 41 38 29 Creditor turnover 30 days 50 33 30 30
Capital Management Buildings
Building assets sustainability ratio* 100% 66% 80% 141% 196%Building assets investment ratio >100% 507% 864% 478% 312%Building assets Consumption ratio* >60% 54% 52% 48% 47%
Other Information
Salaries and related expenditure as a % of operating income 50 - 70% 61% 59% 58% 58%Academic staff numbers (FTEs) 1 059 1 053 1 029 1 004 Non-academic staff numbers (FTEs) 1 351 1 347 1 343 1 253 Total staff numbers (FTEs) (excluding casual staff) 2 410 2 400 2 372 2 257 Average staff costs ($'000s) 124 117 110 106 Average leave balance per FTE ($'000s) 23 20 19 16
Student Numbers**
Research Higher Degree 567 566 574 607 Domestic - HECS 13 725 12 552 11 716 11 623 Fee Paying Domestic 314 229 187 193 Fee Paying Overseas 2 645 2 585 2 490 2 362 Off-shore 1 116 1 182 1 468 1 472 Total 18 367 17 114 16 435 16 257
* For commentary on these indicators refer to the Financial Results section of this Chapter.
** Equivalent full-time student load (EFTSL).

91University of Tasmania
amC search ltd financial statements
2013 2012 2011 2010
$’000s $’000s $’000s $’000s
Total revenue 6 779 7 816 8 368 8 236 Total expenses 6 124 6 908 7 129 7 107 Net Surplus 655 908 1 239 1 129
Total assets 5 717 5 781 5 502 5 791 Total liabilities 1 529 1 508 1 145 1 690 Net Assets 4 188 4 273 4 357 4 101
Opening Total Equity 4 273 4 357 4 101 3 564
Net surplus 655 908 1 239 1 129 Asset revaluation reserve (14) 0 (5) 0 Contributions to the University (726) (992) (978) (592)Closing Total Equity 4 188 4 273 4 357 4 101
Contributions to the University 726 992 978 592
university of Tasmania foundation inc. financial statements
2013 2012 2011 2010
$’000s $’000s $’000s $’000s
Income Statement
Revenue
Donations and bequests income 3 721 3 033 5 092 5 806 Donation - Medical Sciences Building Campaign 5 436 5 153 2 500 1 Other income 1 821 1 472 1 832 531 Investment income 4 820 4 000 (333) 1 391 Total Revenue 15 798 13 658 9 091 7 729
Expenditure
Scholarships, bursary and other payments 1 821 1 332 1 259 2 304 Faculty scholarships and research 718 678 950 313 Transfer - Medical Sciences Building Campaign 7 863 4 000 2 000 0 Other expenses 2 220 1 807 2 023 1 701 Total Expenditure 12 622 7 817 6 232 4 318
Net Surplus 3 176 5 841 2 859 3 411
Balance Sheet
Cash and Investments 42 813 39 637 33 797 30 938
Equity 42 813 39 637 33 797 30 938

92 30 June 2013 Audits
30 june 2013 audiTs

93Legal Aid Commission of Tasmania
legal aid Commission of Tasmania (The Commission)
snapshoT• The Commission reported an Underlying Deficit of $1.253m in 2012-13. This was $0.581m
higher compared to last year.
• Over 90% of funding was provided by Australian and State Governments.
• It received $0.780m from The Solicitors’ Trust to fund various projects.
• Net Assets totalled $2.520m at 30 June 2013. The Commission had $2.838m in cash at that date.
• Total Equity decreased as a result of underlying deficits recorded in the past two years and the Commission needs to closely monitor its financial performance.
The Commission submitted its financial statements 34 days after the statutory deadline.
We made a number of recommendations in areas of accounting for non-current assets and outstanding loans. Not all recommendations made in previous years were implemented. Management have agreed to address all these matters.
The current funding agreement, being the National Partnership Agreement on Legal Assistance Services between the Australian and State Governments, will expire in 30 June 2014.
inTroduCTionThe Commission is an independent statutory body established by the Legal Aid Commission Act 1990. It is principally funded by the State and Australian Governments.
The Commission seeks to increase access to justice for all Tasmanian by the provision of legal representation, advice, information and referral services. It ensures that within the limits of funds available, no person is denied access to the law by reason of financial or social disadvantage.
The responsible Minister is the Attorney-General.
audiT of The 2012-13 finanCial sTaTemenTsSigned financial statements were received on 17 September 2013, which was 34 days after the statutory reporting deadline. An unqualified audit report was issued on 30 October 2013. The Commission is addressing the factors which led to the late submission of the financial statements.
key findings, developmenTs and areas of audiT aTTenTionaudit findingsWe made a number of recommendations relating to:
• accounting for non-current assets and
• the need for the Commission to review annually the recoverability of all outstanding Civil Disbursement Fund loans.

94 Legal Aid Commission of Tasmania
We also followed-up matters reported in previous years and found that not all recommendations were implemented.
Management have agreed to address all these matters.
financial reporting risksKey financial reporting risks impacting the audit are the lack of segregation of duties and key personnel dependency. We mitigated the risk relating to limited segregations to an acceptable level by the nature and extent of audit testing we performed. We recommended that the Commission reviews its current processes in the finance area with the view to improve segregation of incompatible duties.
In this respect it is noted that even entities that have only a few employees in their finance area may be able to assign responsibilities to achieve appropriate segregation or, if that is not possible, to use management oversight of incompatible activities to achieve control objectives.
We noted that the current National Partnership Agreement on Legal Assistance Services between the Australian and State Governments expires on 30 June 2014.
submissions and CommenTs reCeivedA copy of this Chapter was provided to the Commission for comment and response. An extract of the response is provided below. The comments and submission provided are not subject to audit nor the evidentiary standards required in reaching an audit conclusion. Responsibility for the accuracy, fairness and balance of those comments rests solely with those who provided a response or comment.
Deficits and financial performance
Your report records that LACT [Commission] reported a deficit last year and needs to closely monitor its financial performance. We accept the correctness of that statement and note:
• the deficit was part of a long-standing policy for a planned reduction of reserves;
• each of LACT’s budgets in recent years have been approved by the Attorney-General at the relevant time with the knowledge of the Department of Justice. The planned reduction of reserves was a closely monitored policy by management and Wise Lord and Ferguson during its implementation period. Without the planned reduction in reserves there would have been a lower capacity to meet in part the very strong demand for grants of aid during that period;
• the policy of reducing reserves has achieved its goals, and has come to an end: 2013-14 will be the last year in which reserves can be run down;
• the commitment of funds to grants is now reviewed daily, weekly, and monthly by management to ensure it remains within budget as a consequence of no longer being in reduction phase; and
• we are currently reviewing our budget with a view to maintaining sustainable accounting and budgetary arrangements in a context of very low funding against strong demand for legal aid grants.
Recommendations of previous years
The LACT is fully committed to implementing recommendations that have come from your Office where practical and appropriate in small organisations.
We note:
• at the last meeting where the Auditor-General, Norman Reaburn (the then Director) and the writer met there did not appear to be outstanding compliance or regulatory issues;
• in accordance with your recommendation, we intended to move asset reporting away from the existing (but unsupported) ACCESS database. We intended to do this in June 2013 but the unexpected illness of the Finance Manager slowed this reform, which we now expect to complete by May 2014;
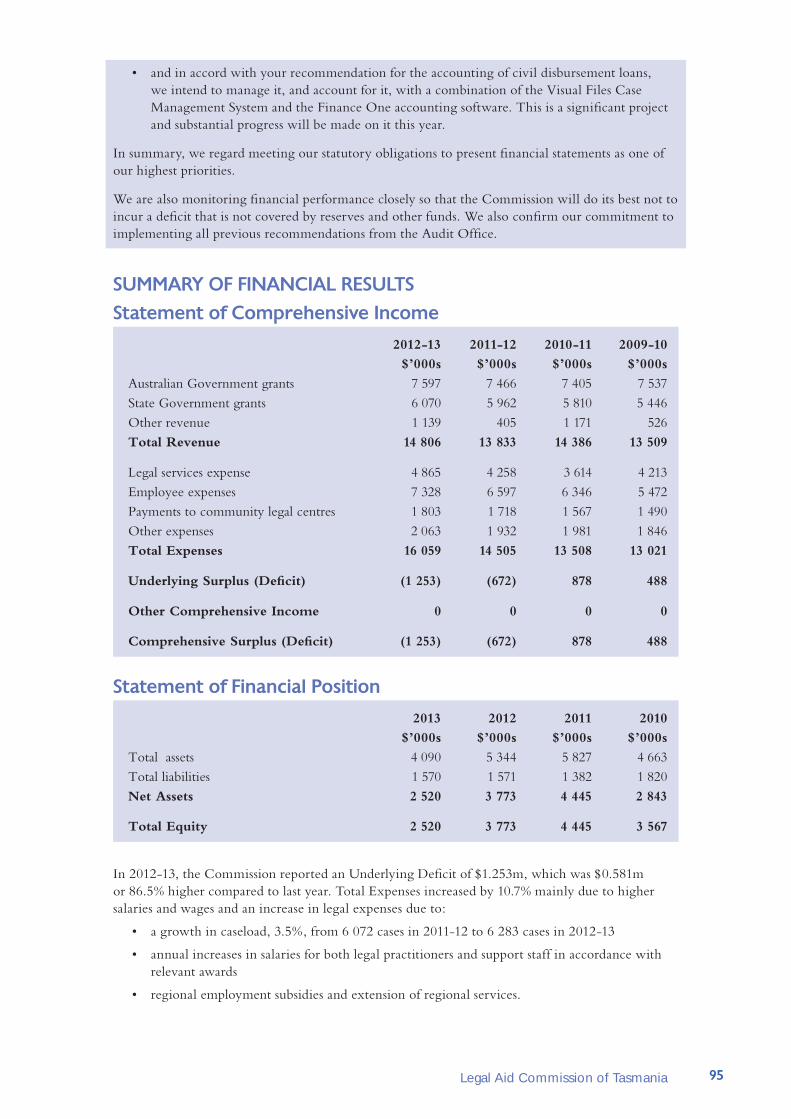
95Legal Aid Commission of Tasmania
• and in accord with your recommendation for the accounting of civil disbursement loans, we intend to manage it, and account for it, with a combination of the Visual Files Case Management System and the Finance One accounting software. This is a significant project and substantial progress will be made on it this year.
In summary, we regard meeting our statutory obligations to present financial statements as one of our highest priorities.
We are also monitoring financial performance closely so that the Commission will do its best not to incur a deficit that is not covered by reserves and other funds. We also confirm our commitment to implementing all previous recommendations from the Audit Office.
summary of finanCial resulTsstatement of Comprehensive income
2012-13 2011-12 2010-11 2009-10
$’000s $’000s $’000s $’000s
Australian Government grants 7 597 7 466 7 405 7 537State Government grants 6 070 5 962 5 810 5 446Other revenue 1 139 405 1 171 526Total Revenue 14 806 13 833 14 386 13 509
Legal services expense 4 865 4 258 3 614 4 213Employee expenses 7 328 6 597 6 346 5 472Payments to community legal centres 1 803 1 718 1 567 1 490Other expenses 2 063 1 932 1 981 1 846Total Expenses 16 059 14 505 13 508 13 021
Underlying Surplus (Deficit) (1 253) (672) 878 488
Other Comprehensive Income 0 0 0 0
Comprehensive Surplus (Deficit) (1 253) (672) 878 488
statement of financial position
2013 2012 2011 2010
$’000s $’000s $’000s $’000s
Total assets 4 090 5 344 5 827 4 663Total liabilities 1 570 1 571 1 382 1 820Net Assets 2 520 3 773 4 445 2 843
Total Equity 2 520 3 773 4 445 3 567
In 2012-13, the Commission reported an Underlying Deficit of $1.253m, which was $0.581m or 86.5% higher compared to last year. Total Expenses increased by 10.7% mainly due to higher salaries and wages and an increase in legal expenses due to:
• a growth in caseload, 3.5%, from 6 072 cases in 2011-12 to 6 283 cases in 2012-13
• annual increases in salaries for both legal practitioners and support staff in accordance with relevant awards
• regional employment subsidies and extension of regional services.

96 Legal Aid Commission of Tasmania
The Commission relies on funding from Australian and State Governments for over 90% of its Total Revenue. In 2013-14, the Australian and State Governments contributed $7.597m and $6.070m respectively. Other income is derived from the recovery of legal costs in successful cases, contributions from legally assisted clients, interest on invested monies and distributions from the Solicitors’ Trust. In the current year, the Commission received $0.780m from the Solicitors’ Trust for various projects including regional employment subsidies, extension of regional services and production of community education materials.
Net Assets totalled $2.520m at 30 June 2013. The Commission had $2.838m in cash at that date. Total Equity decreased as a result of underlying deficits recorded in the past two years and the Commission needs to closely monitor its financial performance.

97National Trust of Australia (Tasmania)
naTional TrusT of ausTralia (Tasmania) (The Trust)
snapshoT• A qualified audit report was issued on 23 October 2013. The report also included an
emphasis of matter paragraph.
• A comprehensive deficit of $0.025m was recorded for the year.
• The Trust experienced significant cash flow difficulties in recent years and will receive additional financial assistance from the State Government to address its 2013-14 budget deficit.
• We continue to recommend the Trust take appropriate action to ensure its restoration appeal liability is fully cash backed.
• For the third consecutive year, the Trust failed to comply with Section 17(1) of the Audit Act 2008 by again submitting its financial statements after the statutory deadline.
Except for the audit qualification, emphasis of matter, failure to meet reporting deadlines and other findings, the audit was completed satisfactorily with no other major matters outstanding.
reCommendaTionsWe recommend that:
1. The Trust improve its year end reporting processes to ensure it complies with statutory financial reporting requirements in future.
2. Given the nature of the restoration appeal funds, we continue to recommend the Trust take appropriate action to ensure its restoration appeal liability is fully cash backed.
3. While asset sales and government support will generate cash in the short-term, they are not a long-term solution to the Trust’s cash situation and the Board needs to take action to ensure that it achieves a more sustainable long term solution to its cash flow difficulties.
submissions and CommenTs reCeivedA copy of this Chapter was provided to the Trust for comment and response. An extract of the response is provided below. The comments and submission provided are not subject to audit nor the evidentiary standards required in reaching and audit conclusion. Responsibility for the accuracy, fairness and balance of those comments rests solely with those who provided a response or comment.
managemenT responses1. The National Trust acknowledges reporting mechanisms in place have lacked efficiency
resulting in material not being available in a timely fashion to comply with statutory financial reporting mechanisms. The National Trust has engaged a professional external provider to fully review financial systems and we will be upgrading systems to automate reporting mechanisms, minimise duplication of data entry and reduce inefficiencies culminated over many years of minimal financial systems review. A policy is being introduced where the audit committee reports to the Board on system efficiencies/inefficiencies on a monthly basis and the financial system will be reviewed by an external provider on an annual basis and provides recommendations. Changes being introduced

98 National Trust of Australia (Tasmania)
include upgrading MYOB, specific programming for system self-generation of reports and real time based data availability via the cloud.
2. Restoration funds – the deficit in these funds has been a long standing issue for the Trust. The Board has a policy to restore funds as the organisation is able.
3. Going concern – management and the Board have been very focussed on ensuring that the organisation is operated as a going concern – actions taken to not replace staff who leave the organisation without a review of the position have resulted in a saving of in excess of 100K FTE, work on developing increased revenue from operations has been undertaken and improvements in revenue are expected to be realised in the 2014-15 financial year.
inTroduCTionThe Trust is administered under the National Trust Act 2006 (the Act), which came into effect on 22 December 2006. Pursuant to the Act, the Trust’s objectives are:
• acquiring, promoting or ensuring the preservation and maintenance for the public benefit of places and objects of beauty or that have a historical, scientific, artistic, architectural or cultural interest
• encouraging and promoting, among the public, knowledge of, interest in and respect for those places and objects
• promoting or ensuring the provision and maintenance of amenities and services to facilitate the enjoyment by the public of those places and objects
• protecting and preserving the natural features of, and conserving the fauna and flora on, any place referred to in paragraph (a) and acquired by, or under the control of, the Trust
• encouraging and promoting public appreciation, knowledge and enjoyment of, respect for and interest in any land, buildings, works, structures or articles
• co-operating with the Crown or with any corporation, body or society, either within or outside Tasmania, having objects wholly or substantially similar to the objects of the Trust, in promoting the objects of the corporation, body or society or the Trust.
The Trust’s primary aim is to promote community awareness and appreciation of Tasmania’s built heritage. It is a member organisation of the Australian Council of National Trusts.
The Act provides for the appointment of a board of seven directors appointed by the Minister. The Board includes the Trust’s Managing Director.
The Responsible Minister is the Minister for Environment, Parks and Heritage.
audiT of The 30 june 2013 finanCial sTaTemenTsSigned financial statements were received on 27 September 2013 and a qualified audit report including an emphasis of matter on economic dependency was issued on 23 October 2013. The audit report contained the following ‘except for’ audit qualification and emphasis of matter:
Qualification
The Trust possesses certain heritage collections referred to in Note 1(j) of the financial statements, but these assets have not been fully recognised in the financial statements. Due to the nature of the assets, it is not possible to quantify the financial effects of the Trust’s failure to comply with Australian Accounting Standards AASB 116 Property, Plant and Equipment.
Emphasis of Matter
I draw attention to Note 1(b) to the financial report, which describes the Trust’s economic dependency on the State Government for continued financial support. My opinion is not modified in respect of this matter.

99National Trust of Australia (Tasmania)
key findings and developmenTs audit findingsSubmission of financial statements
Section 17(1) of the Audit Act 2008, requires financial statements to be submitted to the Auditor-General within 45 days of the end of each financial year. For the third consecutive year, the Trust failed to comply with this timeframe.
The Trust will need to improve its year end reporting processes to ensure it complies with the requirements in future.
Restoration provision
The Trust held current investments of $0.421m at 30 June 2013 (2011-12, $0.342m), which related directly to restoration appeal funds held for specific purposes which were not available to meet general operating costs. The Trust administers these appeal monies on behalf of individual restoration appeals. The shortfall between investments held and the provision for restoration appeal funds at 30 June 2013 was $0.095m. This represented an improvement on the shortfall recorded at 30 June 2012 of $0.118m.
However, given the nature of the funds, we continue to recommend the Trust take appropriate action to ensure the restoration appeal liability is fully cash backed.
Other findings
During the audit there where a number of other finding which included:
• A review of opening balances on 1 July 2012 identified discrepancies compared with prior year audited financial statements. Management agreed to implement processes to ensure balances rolled over into 2013-14 correctly reflect the 2012-13 audited financial statements.
• Attendance at stocktakes revealed the Trust does not maintain a record of its stock on hand. Management agreed to consider implementation of a stock management system.
Except for the audit qualification, emphasis of matter, failure to meet reporting deadlines and other findings, the audit was completed satisfactorily with no other major matters outstanding.
developmenTs Cash flow difficulties and going concern implications
The Trust has experienced significant operating cash flow difficulties in recent years. In 2012-13 it recorded a net decrease in total cash of $0.091m resulting in a net overdraft position of $0.112m at 30 June 2013. To address this the Trust resolved to list Oak Lodge for sale. This met with community resistance and in January 2013 the Premier supported a statewide appeal to raise one million dollars to save the property.
The Trust subsequently decided in February 2013 to delay the proposed sale for six months until the outcome of the appeal was apparent. The property remains unlisted for sale but is closed to the public.
In October 2013, the Board received a grant from the State Government for $0.200m to meet operational budgetary shortfalls in 2013-14. The grant will be paid in four equal instalments. This has assisted in ensuring the Trust can continue as a going concern in the short-term.
The Trust’s net assets at 30 June 2013 totalled $9.270m indicating it has no going concern problem. However, each of the following factors indicates the need for the Board to carefully monitor the Trust’s financial position:

100 National Trust of Australia (Tasmania)
• its Net Working Capital was negative in each of the past three years
• operating cash flows were negative over the same period
• underlying deficits were incurred over the same period
• cash at bank declined significantly over the past four years.
While asset sales and government support will generate cash in the short-term, they are not a long-term solution to the Trust’s cash situation and the Board needs to take action to ensure that it achieves a more sustainable long-term solution to its cash flow difficulties.
oTher developmenTsOther developments included:
• the appointment of a new Chair on 8 November 2012
• abolishment of the Trust’s Remuneration and Nomination Committee. These functions are now performed by the Board
• successfully launching the Fly Fishing Museum located at Clarendon House in May 2013.
key areas of audiT aTTenTion
Area of Audit Attention Impact on our Audit Approach
Property, plant and equipment include heritage collections with complex valuations.
Property, plant and equipment constitute a significant balance in the financial statements.
We reviewed valuation reports, calculations and underlying assumptions supporting fair values of assets.
The depreciation expense was tested and assessed for reasonableness.
The Trust has an investment balance that is highly liquid and susceptible to fraud.
We reviewed the bank reconciliation and investments balances at 30 June 2013 and verified balances to external bank confirmations.
Lack of a sustainable funding model. We reviewed current and budgeted financial results and assessed likelihood that the Trust will meet its liabilities when they fall due.
We obtained assurances from the Board and State government that additional funding would be provided.

101National Trust of Australia (Tasmania)
summary of finanCial sTaTemenTsabridged balance sheet
2013 2012 2011 2010
$’000s $’000s $’000s $’000s
Cash 74 164 215 605
Receivables 92 105 18 71 Inventories 65 68 68 63 Investments 421 342 274 472 Other assets 0 0 0 0 Total Current Assets 652 679 575 1 211
Payables 145 127 127 441 Bank overdraft 186 185 0 149 Borrowings 0 60 177 0 Employee benefit provisions 130 103 92 83 Restoration fund provision 319 321 370 512 Total Current Liabilities 780 796 766 1 185
Net Working Capital (128) (117) (191) 26
Property, plant and equipment 9 695 9 551 9 421 5 319 Total Non-Current Assets 9 695 9 551 9 421 5 319
Borrowings 100 0 0 234Employee benefit provisions 0 0 0 0Restoration fund provision 197 139 17 75Total Non-Current Liabilities 297 139 17 309
Net Assets 9 270 9 295 9 213 5 036
Accumulated surpluses 7 097 7 187 7 105 3 314 Reserves 2 173 2 108 2 108 1 722 Total Equity 9 270 9 295 9 213 5 036

102 National Trust of Australia (Tasmania)
analysis of Cash generaTed from operaTions
Financial performance and going concern
The Trust recorded Underlying Deficits in three successive years and a small Underlying Surplus in 2010. This indicates that the Trust’s operations are not generating sufficient revenue to meet operating expenditure.
In addition, we noted that:
• the Trust is budgeting for an Underlying Deficit of $0.097m in 2013-14,
• its creditor turnover was 72 days at 30 June 2013, indicating it is having difficulties paying suppliers in a timely manner
• it reported negative Net Working Capital in each of the past three years
• operating cash flows were also negative in each of the past three years
• employee costs have risen due to a 4% increase in staff salaries and the engagement of temporary staff to assist on projects and prepare grant submissions
• The National Trust Act 2006 places restrictions on the Board’s ability to dispose of property vested in the Trust without the prior approval of the Attorney General.
All of these factors indicate that the Trust will in 2013-14 continue to struggle to meet its liabilities as they fall due. We were satisfied that the Trust can continue as a going concern in 2013-14 on the basis of a grant from the State Government for $0.200m to meet operational budgetary shortfalls.
Despite the above observations, we noted that the Trust’s Net Surplus (Deficit) results were consistently better than its Underlying Surplus (Deficits) for the period under review. This was due to the recognition of donated assets as well as the first time recognition of some heritage assets in 2010-11.
Assets received
In 2010-11 the Trust received titles to Runnymede and the Penitentiary Chapel Historical Site from the State Government. These properties were recognised based on the Valuer-General’s valuation of $3.190m less leasehold improvement costs of $0.481m previously recognised by the Trust when it managed both sites. These transactions were the primary reason for the strong net surplus in 2010-11.
(600)
(400)
(200)
0
200
400
600
2010 2011 2012 2013
$'00
0s
Operating Cash Flow Net cash (including overdraft) Debt

103National Trust of Australia (Tasmania)
Objects register and impact on our audit report
The Trust updated its objects register and the valuation of an assortment of furniture held in a number of its properties in 2010-11. The valuation of these items was, in most cases, undertaken by an external antiques expert. The recognition of these assets resulted in a revenue item of $1.227m in that financial year. However, as noted earlier in this Chapter, the Trust’s audit report was qualified as all of its heritage assets had yet to be recognised because the objects register was not fully complete.
The recognition of the above mentioned properties and items recorded in the objects register also resulted in a $3.938m increase in Property, plant and equipment in 2011.
Liabilities
Total Liabilities fell at 30 June 2011 due to the repayment of $0.117m of loans. The repayment was financed through the sale of Ellis House for $0.195m. Total Liabilities increased by $0.142m at 30 June 2013 due to:
• an additional $0.040m loan taken out to fund on-going operations
• an increase in employee provisions of $0.027m due to changes in the award rate as at 1 July 2012
• increase in the restoration fund liability of $0.047m.
Cash management
The Trust’s cash position decreased by $0.091m in the 2012-13 period. Net cash included an overdraft of $0.112m at 30 June 2013. Operating cash flows were in deficit for the past three years driven mainly by a fall in receipts from customers with $0.947m generated in 2009-10 compared to $0.607m in 2012-13, a drop of $0.340m. The Trust has made significant reductions in costs over the period under review with payments to suppliers and employees falling from $1.205m in 2009-10 to $0.984m in 2012-13, a fall of $0.221m.
The problems with the Trust’s cash position are illustrated in the cash from operations graph above, which identifies negative operating cash flows, a deficit cash position and increasing debt.

104 Appendix 1 - Guide to Using this Report
appendix 1 - guide To using This reporTThis Report is prepared under section 29 of the Audit Act 2008 (the Audit Act), which requires the Auditor-General, on or before 31 December in each year, to report to Parliament in writing on the audit of State entities and audited subsidiaries of State entities in respect of the preceding financial year. The issue of more than one report titled the Auditor-General’s Report on the Financial Statements of State Entities, comprising five volumes, satisfies this requirement each year. The volumes are:
• Volume 1 – Executive and Legislature, Government Departments, Tasmanian Health Organisations, Other General Government Sector State Entities, Other State Entities and Superannuation Funds
• Volume 2 – Government Businesses, Other Public Non-Financial Corporations and Water Corporations
• Volume 3 – Local Government Authorities
• Volume 4 – Analysis of the Treasurer’s Annual Financial Report
• Volume 5 - Other State entities 30 June 2013 and 31 December 2013.
Where relevant, State entities are provided with the opportunity to comment on any of the matters reported. Where they choose to do so, responses are detailed within that particular section.
formaT of The finanCial analysisEach entity’s financial performance is analysed by discussing the Comprehensive Income Statement, Statement of Financial Position and Statement of Cash Flows supplemented by financial analysis applying the indicators documented in the Financial Performance sections of this Report. The layout of some of these primary statements has been amended from the audited statements to, where appropriate:
• make the statements more relevant to the nature of the entity’s business
• highlight the entity’s working capital, which is a useful measure of liquidity.
Departments are required to present budget amounts on the face of their primary statements. As a consequence details and commentary in relation to these amounts have been included in this Report.
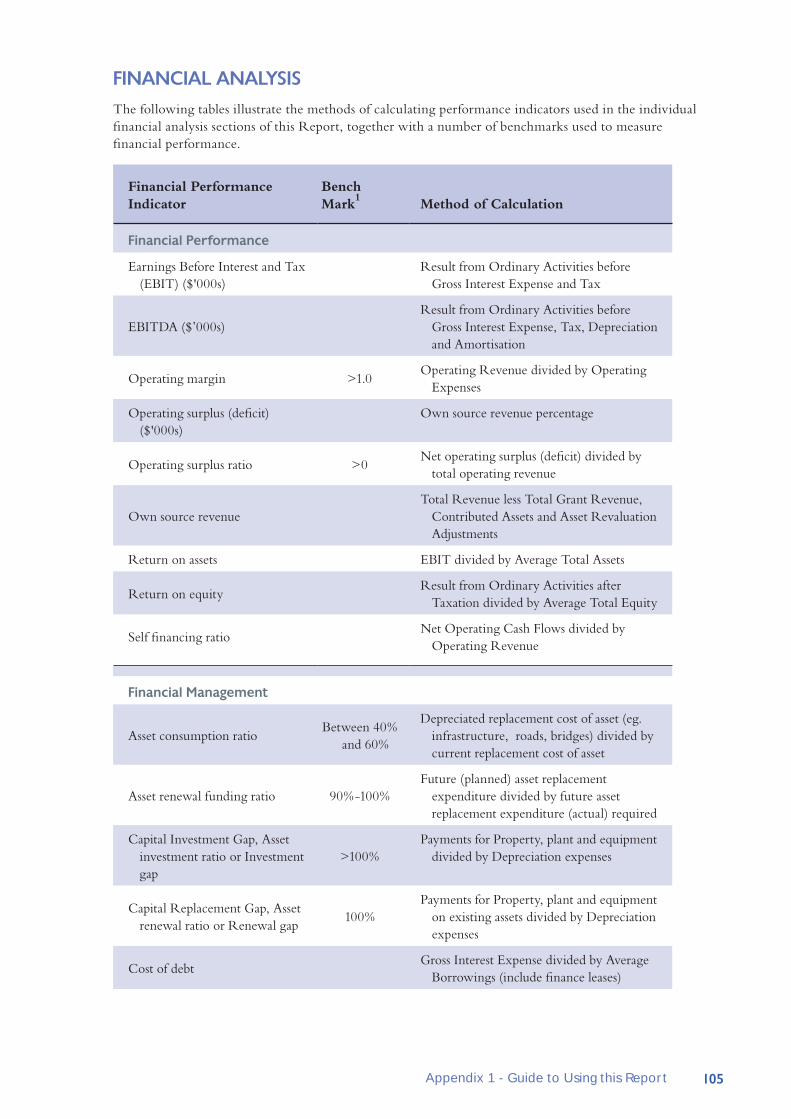
105Appendix 1 - Guide to Using this Report
finanCial analysisThe following tables illustrate the methods of calculating performance indicators used in the individual financial analysis sections of this Report, together with a number of benchmarks used to measure financial performance.
Financial Performance Indicator
Bench Mark1 Method of Calculation
financial performance
Earnings Before Interest and Tax (EBIT) ($'000s)
Result from Ordinary Activities before Gross Interest Expense and Tax
EBITDA ($’000s)Result from Ordinary Activities before
Gross Interest Expense, Tax, Depreciation and Amortisation
Operating margin >1.0Operating Revenue divided by Operating
Expenses
Operating surplus (deficit) ($'000s)
Own source revenue percentage
Operating surplus ratio >0Net operating surplus (deficit) divided by
total operating revenue
Own source revenueTotal Revenue less Total Grant Revenue,
Contributed Assets and Asset Revaluation Adjustments
Return on assets EBIT divided by Average Total Assets
Return on equityResult from Ordinary Activities after
Taxation divided by Average Total Equity
Self financing ratioNet Operating Cash Flows divided by
Operating Revenue
financial management
Asset consumption ratioBetween 40%
and 60%
Depreciated replacement cost of asset (eg. infrastructure, roads, bridges) divided by current replacement cost of asset
Asset renewal funding ratio 90%-100%Future (planned) asset replacement
expenditure divided by future asset replacement expenditure (actual) required
Capital Investment Gap, Asset investment ratio or Investment gap
>100%Payments for Property, plant and equipment
divided by Depreciation expenses
Capital Replacement Gap, Asset renewal ratio or Renewal gap
100%Payments for Property, plant and equipment
on existing assets divided by Depreciation expenses
Cost of debtGross Interest Expense divided by Average
Borrowings (include finance leases)

106 Appendix 1 - Guide to Using this Report
Financial Performance Indicator
Bench Mark1 Method of Calculation
Creditor turnover 30 daysPayables divided by credit purchases
multiplied by 365
Current ratio >1 Current Assets divided by Current Liabilities
Debt collection 30 daysReceivables divided by billable Revenue
multiplied by 365
Debt to equity Debt divided by Total Equity
Debt to total assets Debt divided by Total Assets
Indebtedness ratioNon-Current Liabilities divided by Own
Source Revenue
Interest coverage ratioNet operating cashflows less interest and
tax payments divided by Net interest payments
Interest cover – EBIT >2 EBIT divided by Gross Interest Expense
Interest cover – EBITDA >2 EBITDA divided by Gross Interest Expense
Interest cover – Funds from Operations
>2Cash from Operations plus Gross Interest
Expense divided by Gross Interest Expense
Liquidity ratio 2:1Liquid assets divided by current liabilities
other than provisions
Net financial assets (liabilities)($’000s)
Total liquid assets less financial liabilities
Net financial liabilities ratio 0 – (50%)Liquid assets less total liabilities divided by
total operating income
returns to government
CSO funding ($’000)Amount of community service obligation
funding received from Government
Dividend payout ratio 50%Dividend divided by Result from Ordinary
Activities after Tax
Dividend to equity ratioDividend paid or payable divided by Average
Total Equity
Dividends paid or payable ($'000s)
Dividends paid or payable that relate to the year subject to analysis
Effective tax rate 30%Income Tax paid or payable divided by
Result from Ordinary Activities before Tax
Government guarantee fees ($’000)
Amount of guarantee fees paid to owners (usually Government)
Income tax paid ($'000s)Income Tax paid or payable that relates to
the year subject to analysis
Total return to equity ratio Total Return divided by Average Equity

107Appendix 1 - Guide to Using this Report
Financial Performance Indicator
Bench Mark1 Method of Calculation
Total return to the State ($'000s) or total return to owners
Dividends plus Income Tax and Loan Guarantee fees
other information
Average leave per FTE ($'000s)Total employee annual and long service
leave entitlements divided by Staff Numbers
Average long service leave balance
Not more than 100
days
Actual long service leave provision days due divided by average FTEs
Average recreational leave balance
20 days 3
Actual annual leave provision days due divided by average FTEs
Average staff costs (2)
($'000s)
Total employee expenses (including capitalised employee costs) divided by Staff Numbers
Employee costs (2)
as a % of operating expenses
Total employee costs divided by Total Operating Expenses
Employee costs capitalised ($'000s)
Capitalised employee costs
Employee costs expensed ($'000s)
Total employee costs per Income Statement
Operating cost to rateable property
Operating expenses plus finance costs divided by rateable properties per valuation roll
Rates per capitaPopulation of council area divided by rates
revenue
Rates per operating revenueTotal rates divided by operating revenue
including interest income
Rates per rateable propertyTotal rates revenue divided by rateable
properties per valuation rolls
Staff numbers FTEs Effective full time equivalents
1 Benchmarks vary depending on the nature of the business being analysed. For the purposes of this Report, a single
generic benchmark has been applied.
2 Employee costs include capitalised employee costs, where applicable, plus on-costs.
3 May vary in some circumstances because of different award entitlement
An explanation of most financial performance indicators is provided below:
finanCial performanCe• Earnings before interest and tax (EBIT) – measures how well an entity can earn a
profit, from its operations, regardless of how it is financed (debt or equity) and before it has to meet external obligations such as income tax. This is a measure of how well it goes about its core business.
108 Appendix 1 - Guide to Using this Report
• Earnings before income tax, depreciation and amortisation (EBITDA) – measures how well an entity can generate funds without the effects of financing (debt or equity), depreciation and amortisation and before it has to meet external obligations such as income tax. This measure is of particular relevance in cases of entities with large amounts of non-current assets as the distortionary accounting and financing effects on the entity’s earnings are removed, enabling comparisons to be made across different entities and sectors.
• Operating margin – this ratio serves as an overall measure of operating effectiveness.
• Operating Surplus (Deficit) or Result from operations – summarises revenue transactions and expense transactions incurred in the same period of time and calculates the difference.
• Operating surplus ratio – a positive result indicates a surplus with the larger the surplus the stronger surplus and therefore stronger assessment of sustainability. However, too strong a result could disadvantage ratepayers. A negative result indicates a deficit which cannot be sustained in the long-term.
• Own source revenue – represents revenue generated by a council through its own operations. It excludes any external government funding, contributed assets and revaluation adjustments.
• Return on assets – measures how efficiently management used assets to earn profit. If assets are used efficiently, they earn profit for the entity. The harder the assets work at generating revenues, and thus profit, the better the potential return for the owners.
• Return on equity – measures the return the entity has made for the shareholders on their investment.
• Self financing ratio – this is a measure of council’s ability to fund the replacement of assets from cash generated from operations.
finanCial managemenT• Asset consumption ratio – shows the depreciated replacement cost of an entity’s
depreciable assets relative to their ‘as new’ (replacement) value. It therefore shows the average proportion of new condition left in the depreciable assets.
• Asset renewal funding ratio – measures the capacity to fund asset replacement requirements. An inability to fund future requirements will result in revenue, expense or debt consequences, or a reduction in service levels. This is a most useful measure relying on the existence of long-term financial and asset management plans.
• Asset sustainability ratio – provides a comparison of the rate of spending on existing infrastructure, property, plant and equipment through renewing, restoring and replacing existing assets, with depreciation. Ratios higher than 100% indicate that spending on existing assets is greater than the depreciation rate. This is a long-term indicator, as capital expenditure can be deferred in the short-term if there are insufficient funds available from operations and borrowing is not an option.
• Capital Investment Gap, Asset investment ratio or Investment gap – indicates whether the entity is maintaining its physical capital by reinvesting in or renewing non-current assets (caution should be exercised when interpreting this ratio for entities with significant asset balances at cost as the level of depreciation may be insufficient).
• Capital Replacement Gap, Asset renewal ratio or Renewal gap – indicates whether the entity is maintaining its physical capital by reinvesting in or renewing existing non-current assets. (Caution should be exercised when interpreting this ratio as the amount of capital expenditure on existing assets has largely been provided by the respective councils and not subject to audit).
• Cost of debt – reflects the average interest rate applicable to debt.

109Appendix 1 - Guide to Using this Report
• Creditors turnover – indicates how extensively the entity utilises credit extended by suppliers.
• Current ratio – current assets should exceed current liabilities by a ‘considerable’ margin. It is a measure of liquidity that shows an entity’s ability to pay its short term debts.
• Debt collection – indicates how effectively the entity uses debt collection practices to ensure timely receipt of monies owed by its customers.
• Debt to equity – an indicator of the risk of the entity’s capital structure in terms of the amount sourced from borrowings and the amount from Government.
• Debt to total assets – an indicator of the proportion of assets that are financed through borrowings.
• Interest cover – EBIT – an indicator of the ability to meet periodic interest payments from current profit (before interest expense). The level of interest cover gives a guide of how much room there is for interest payments to be maintained in the face of interest rate increases or reduced profitability.
• Interest cover – Funds from operations – examines the exposure or risk in relation to debt, an indicator of the ability to meet periodic interest payments from funds from operations (before interest expense). The level of interest cover gives a guide of how much room there is for interest payments to be maintained in the face of interest rate increases or reduced funds from operations.
• Net financial liabilities ratio – indicates the extent to which net liabilities can be met by operating income. A falling ratio indicates that the entity’s capacity to meet its financial obligations from operating income is strengthening.
reTurns To governmenT• Dividend payout ratio – the amount of dividends relative to the entity’s net income.
• Dividend to equity ratio – the relative size of an entity’s dividend payments to shareholders’ equity. A low dividend to equity ratio may indicate that profits are being retained by the entity to fund capital expenditure.
• Dividends paid or payable – payment by the entity to its shareholders (whether paid or declared as a payable).
• Effective tax rate – is the actual rate of tax paid on profits.
• Income tax paid – tax payments by the entity to the State in the year.
• Total return to equity ratio – measures the Government’s return on its investment in the entity.
• Total return to the State – the funds paid to the Owners consisting of income tax, dividends and guarantee fees.
oTher informaTion• Average leave balance per FTE ($’000s) – indicates the extent of unused leave at balance
date.
• Average long service leave balance or days long service leave due – records the average number of days long service leave accumulated per staff member. In general public servants cannot accrue more than 100 days annual leave.
• Average recreational leave balance or days annual leave due – records the average number of days annual leave accumulated per staff member. In general public service employees accrue 20 days annual leave per annum.
• Average staff costs – measures the average cost of employing staff in the entity for the year.

110 Appendix 1 - Guide to Using this Report
• Employee costs as a percentage of operating expenses - indicates the relative significance of employee costs compared to other operating expenses.
• Employee costs capitalised ($’000s) – represents employee costs that have been capitalised rather than expensed.
• Employee costs expensed ($’000s) – represents the level of employee costs expensed, ie. included in the Income Statement. This together with the Employee costs capitalised will provide a total employee cost figure for use in other related ratios.
• Staff numbers FTEs – as at the end of the reporting period the number of staff employed expressed as full-time equivalents (FTEs).
The above indicators are used because they are commonly applied to the evaluation of financial performance. Care should be taken in interpreting these measures, as by definition they are only indicators, and they should not be read in isolation.
audiT finding – risk CaTegories In reporting audit finding to clients, we determine three risk categories. These categories are based on their significance and potential impact on the client. Details are provided in the Chapter: Findings from 2013 Audits.

111Appendix 2 - Audit Status
appendix 2 - audiT sTaTusFin
anci
al s
tate
men
tsT
imel
ines
s of au
dit o
pin
ion
issu
e fr
om
bal
ance
dat
e
Enti
tyB
alan
ce
Dat
e
Fin
anci
al
Sta
tem
ent
dea
dline
Sig
ned
Fin
anci
al
Sta
tem
ents
R
ecei
ved
Re-
signed
/A
men
ded
Fin
anci
al
Sta
tem
ents
R
ecei
ved
Cle
ar
opin
ion
issu
ed
Em
phas
is
of M
atte
rA
udit o
pin
ion
signed
< 8
w
eeks
8 to
10
wee
ks
10 t
o
12
wee
ks
12
to 1
4 w
eeks
14 t
o
16
wee
ks> 1
6 w
eeks
Ex
EC
UT
IVE A
ND
LEG
ISLA
TU
RE, G
OV
ER
NM
EN
T D
EPA
RT
MEN
TS A
ND
OT
HER
GEN
ER
AL G
OV
ER
NM
EN
T S
EC
TO
R S
TA
TE E
NT
ITIT
ES
Ex
EC
UT
IVE &
LEG
ISLA
TU
RE
Hou
se o
f Ass
embl
y30
June
201
315
Aug
ust 2
013
12 A
ugus
t 201
3P
15 S
epte
mbe
r 20
13P
Legi
slat
ive
Cou
ncil
30 Ju
ne 2
013
15 A
ugus
t 201
314
Aug
ust 2
013
P16
Sep
tem
ber
2013
P
Legi
slat
ure-
Gen
eral
30 Ju
ne 2
013
15 A
ugus
t 201
315
Aug
ust 2
013
P13
Sep
tem
ber
2013
P
Offi
ce o
f the
Gov
erno
r30
June
201
315
Aug
ust 2
013
15 A
ugus
t 201
3P
27 S
epte
mbe
r 20
13P
MIN
IST
ER
IAL D
EPA
RT
ME
NT
S
Dep
artm
ent o
f Eco
nom
ic D
evel
opm
ent,
Tou
rism
and
the
Art
s30
June
201
315
Aug
ust 2
013
15 A
ugus
t 201
3P
30 S
epte
mbe
r 201
3P
Tas
man
ia D
evelo
pmen
t and
Res
ource
s30
June
201
315
Aug
ust 2
013
15 A
ugus
t 201
3P
30 S
epte
mbe
r 201
3P
Tou
rism
Tas
man
ia30
June
201
315
Aug
ust 2
013
15 A
ugus
t 201
3P
26 S
epte
mbe
r 201
3P
Tas
man
ian
Mus
eum
and
Art
Gal
lery
30 Ju
ne 2
013
15 A
ugus
t 201
315
Aug
ust 2
013
P26
Sep
tem
ber 2
013
P
Dep
artm
ent o
f Edu
cati
on30
June
201
315
Aug
ust 2
013
15 A
ugus
t 201
3P
30 S
epte
mbe
r 201
3P
Dep
artm
ent o
f Hea
lth a
nd H
uman
Ser
vice
s30
June
201
315
Aug
ust 2
013
15 A
ugus
t 201
326
Sep
tem
ber 2
013
P30
Sep
tem
ber 2
013
P
Am
bula
nce
Tas
man
ia30
June
201
315
Aug
ust 2
013
15 A
ugus
t 201
326
Sep
tem
ber 2
013
P30
Sep
tem
ber 2
013
P
Hou
sing
Tas
man
ia30
June
201
315
Aug
ust 2
013
15 A
ugus
t 201
326
Sep
tem
ber 2
013
P27
Sep
tem
ber 2
013
P
Tas
man
ian
Affo
rdab
le H
ousin
g L
imite
d30
June
201
315
Aug
ust 2
013
30 O
ctob
er 2
013
P30
Oct
ober
201
3P
Dep
artm
ent o
f Inf
rast
ruct
ure,
Ene
rgy
and
Res
ourc
es30
June
201
315
Aug
ust 2
013
15 A
ugus
t 201
316
Sep
tem
ber 2
013
P18
Sep
tem
ber 2
013
P
Abt
Rai
lway
Min
ister
ial C
orpo
ratio
n30
June
201
315
Aug
ust 2
013
15 A
ugus
t 201
3P
18 S
epte
mbe
r 20
13P
Dep
artm
ent o
f Jus
tice
30
June
201
315
Aug
ust 2
013
13 A
ugus
t 201
3P
20 A
ugus
t 201
3P
Dep
artm
ent o
f Pol
ice
and
Em
erge
ncy
Man
agem
ent
30 Ju
ne 2
013
15 A
ugus
t 201
315
Aug
ust 2
013
P16
Sep
tem
ber 2
013
P
Dep
artm
ent o
f Pre
mie
r an
d C
abin
et30
June
201
315
Aug
ust 2
013
13 A
ugus
t 201
3P
3 Se
ptem
ber 2
013
P
Dep
artm
ent o
f Pri
mar
y In
dust
ries
, Par
ks,
Wat
er a
nd E
nvir
onm
ent
30 Ju
ne 2
013
15 A
ugus
t 201
314
Aug
ust 2
013
3 Se
ptem
ber 2
013
P5
Sept
embe
r 20
13P
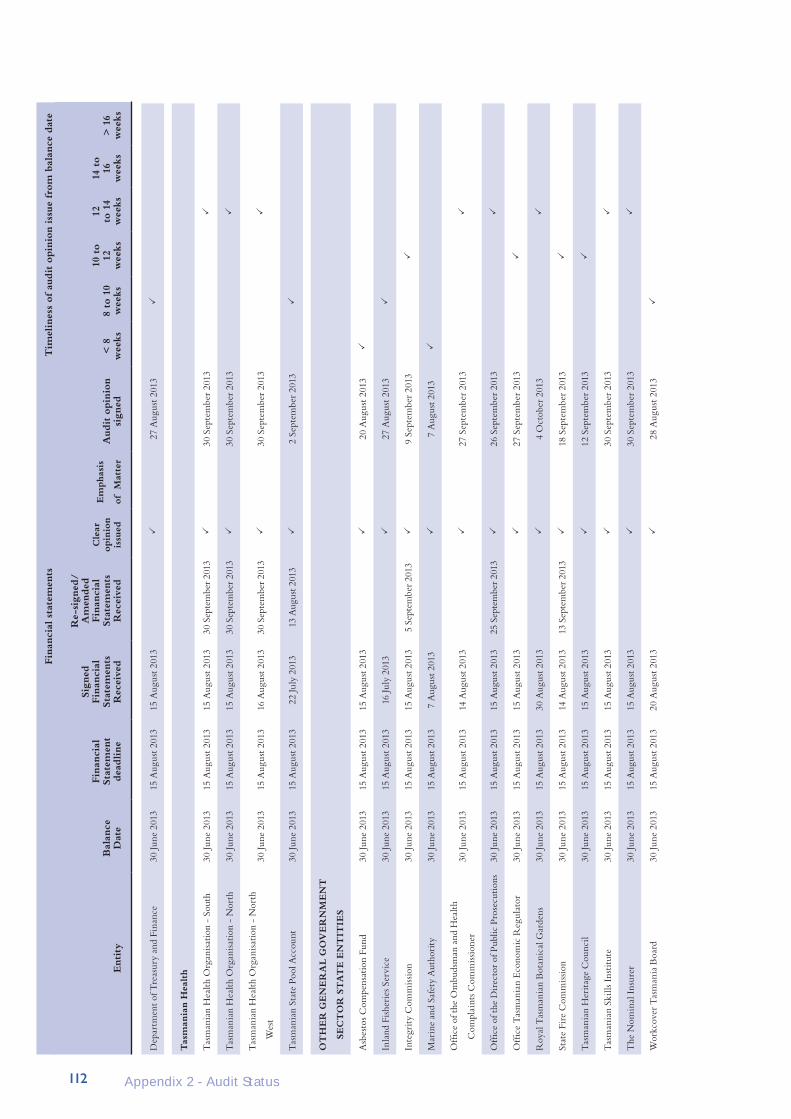
112 Appendix 2 - Audit Status
Dep
artm
ent o
f Tre
asur
y an
d Fi
nanc
e30
June
201
315
Aug
ust 2
013
15 A
ugus
t 201
3P
27 A
ugus
t 201
3P
Tas
man
ian
Hea
lth
Tas
man
ian
Hea
lth O
rgan
isat
ion
- So
uth
30 Ju
ne 2
013
15 A
ugus
t 201
315
Aug
ust 2
013
30 S
epte
mbe
r 201
3P
30 S
epte
mbe
r 20
13P
Tas
man
ian
Hea
lth O
rgan
isat
ion
- N
orth
30 Ju
ne 2
013
15 A
ugus
t 201
315
Aug
ust 2
013
30 S
epte
mbe
r 201
3P
30 S
epte
mbe
r 20
13P
Tas
man
ian
Hea
lth O
rgan
isat
ion
- N
orth
Wes
t30
June
201
315
Aug
ust 2
013
16 A
ugus
t 201
330
Sep
tem
ber 2
013
P30
Sep
tem
ber
2013
P
Tas
man
ian
Stat
e Po
ol A
ccou
nt30
June
201
315
Aug
ust 2
013
22 Ju
ly 2
013
13 A
ugus
t 201
3P
2 Se
ptem
ber
2013
P
OT
HE
R G
EN
ER
AL G
OV
ER
NM
EN
T
SEC
TO
R S
TA
TE E
NT
ITIE
S
Asb
esto
s Com
pens
atio
n Fu
nd30
June
201
315
Aug
ust 2
013
15 A
ugus
t 201
3P
20 A
ugus
t 201
3P
Inla
nd F
ishe
ries
Ser
vice
30 Ju
ne 2
013
15 A
ugus
t 201
316
July
201
3P
27 A
ugus
t 201
3P
Inte
grit
y C
omm
issio
n30
June
201
315
Aug
ust 2
013
15 A
ugus
t 201
35
Sept
embe
r 201
3P
9 Se
ptem
ber
2013
P
Mar
ine
and
Safe
ty A
utho
rity
30
June
201
315
Aug
ust 2
013
7 A
ugus
t 201
3P
7 A
ugus
t 201
3P
Offi
ce o
f the
Om
buds
man
and
Hea
lth
Com
plai
nts C
omm
issio
ner
30 Ju
ne 2
013
15 A
ugus
t 201
314
Aug
ust 2
013
P27
Sep
tem
ber
2013
P
Offi
ce o
f the
Dir
ecto
r of
Pub
lic P
rose
cuti
ons
30 Ju
ne 2
013
15 A
ugus
t 201
315
Aug
ust 2
013
25 S
epte
mbe
r 201
3P
26 S
epte
mbe
r 20
13P
Offi
ce T
asm
ania
n E
cono
mic
Reg
ulat
or30
June
201
315
Aug
ust 2
013
15 A
ugus
t 201
3P
27 S
epte
mbe
r 20
13P
Roy
al T
asm
ania
n B
otan
ical
Gar
dens
30 Ju
ne 2
013
15 A
ugus
t 201
330
Aug
ust 2
013
P4
Oct
ober
201
3P
Stat
e Fi
re C
omm
issio
n30
June
201
315
Aug
ust 2
013
14 A
ugus
t 201
313
Sep
tem
ber 2
013
P18
Sep
tem
ber
2013
P
Tas
man
ian
Her
itage
Cou
ncil
30 Ju
ne 2
013
15 A
ugus
t 201
315
Aug
ust 2
013
P12
Sep
tem
ber
2013
P
Tas
man
ian
Skill
s Ins
titu
te30
June
201
315
Aug
ust 2
013
15 A
ugus
t 201
3P
30 S
epte
mbe
r 20
13P
The
Nom
inal
Ins
urer
30 Ju
ne 2
013
15 A
ugus
t 201
315
Aug
ust 2
013
P30
Sep
tem
ber
2013
P
Wor
kcov
er T
asm
ania
Boa
rd30
June
201
315
Aug
ust 2
013
20 A
ugus
t 201
3P
28 A
ugus
t 201
3P
Fin
anci
al s
tate
men
tsT
imel
ines
s of au
dit o
pin
ion
issu
e fr
om
bal
ance
dat
e
Enti
tyB
alan
ce
Dat
e
Fin
anci
al
Sta
tem
ent
dea
dline
Sig
ned
Fin
anci
al
Sta
tem
ents
R
ecei
ved
Re-
signed
/A
men
ded
Fin
anci
al
Sta
tem
ents
R
ecei
ved
Cle
ar
opin
ion
issu
ed
Em
phas
is
of M
atte
rA
udit o
pin
ion
signed
< 8
w
eeks
8 to
10
wee
ks
10 t
o
12
wee
ks
12
to 1
4 w
eeks
14 t
o
16
wee
ks> 1
6 w
eeks

113Appendix 2 - Audit Status
OT
HE
R S
TA
TE E
NT
ITIE
S
Abo
rigi
nal L
and
Cou
ncil
30 Ju
ne 2
013
15 A
ugus
t 201
315
Aug
ust 2
013
P13
Sep
tem
ber
2013
P
Cou
ncil
of L
aw R
epor
ting
30 Ju
ne 2
013
15 A
ugus
t 201
315
Aug
ust 2
013
21 A
ugus
t 201
3P
29 A
ugus
t 201
3P
Fore
st P
ract
ices
Aut
hori
ty30
June
201
315
Aug
ust 2
013
14 A
ugus
t 201
3P
20 S
epte
mbe
r 20
13P
Jim
Bac
on F
ound
atio
n30
June
201
315
Aug
ust 2
013
7 A
ugus
t 201
3P
30 A
ugus
t 201
3P
Lega
l Aid
Com
mis
sion
of T
asm
ania
30 Ju
ne 2
013
15 A
ugus
t 201
317
Sep
tem
ber
2013
P30
Oct
ober
201
3P
Lega
l Pro
fess
ion
Boa
rd30
June
201
315
Aug
ust 2
013
14 A
ugus
t 201
3P
26 A
ugus
t 201
3P
Nat
iona
l Tru
st o
f Aus
tral
ia (
Tas
man
ia)
30 Ju
ne 2
013
15 A
ugus
t 201
327
Sep
tem
ber
2013
23
Oct
ober
201
3P
Prop
erty
Age
nt B
oard
30 Ju
ne 2
013
15 A
ugus
t 201
315
Aug
ust 2
013
30 S
epte
mbe
r 201
3P
30 S
epte
mbe
r 20
13P
Prop
erty
Age
nt T
rust
30 Ju
ne 2
013
15 A
ugus
t 201
315
Aug
ust 2
013
30 S
epte
mbe
r 201
3P
30 S
epte
mbe
r 20
13P
Riv
er C
lyde
Tru
st30
June
201
315
Aug
ust 2
013
14 A
ugus
t 201
325
Sep
tem
ber 2
013
P26
Sep
tem
ber
2013
P
Tas
man
ian
Bee
f Ind
ustr
y (R
esea
rch
and
Dev
elop
men
t) T
rust
30 Ju
ne 2
013
15 A
ugus
t 201
35
Aug
ust 2
013
P19
Aug
ust 2
013
P
Tas
man
ian
Bui
ldin
g an
d C
onst
ruct
ion
Indu
stry
Tra
inin
g B
oard
30 Ju
ne 2
013
15 A
ugus
t 201
38
Aug
ust 2
013
P16
Aug
ust 2
013
P
Tas
man
ian
Com
mun
ity
Fund
30 Ju
ne 2
013
15 A
ugus
t 201
329
July
201
3P
5 Se
ptem
ber
2013
P
Tas
man
ian
Dai
ry I
ndus
try
Aut
hori
ty30
June
201
315
Aug
ust 2
013
15 A
ugus
t 201
3P
24 S
epte
mbe
r 20
13P
Tas
man
ian
Ear
ly Y
ears
Fou
ndat
ion
30 Ju
ne 2
013
2 A
ugus
t 201
330
Aug
ust 2
013
P30
Aug
ust 2
013
P
Tea
cher
s Reg
istr
atio
n B
oard
of T
asm
ania
30 Ju
ne 2
013
15 A
ugus
t 201
315
Aug
ust 2
013
P25
Sep
tem
ber
2013
P
Wel
lingt
on P
ark
Man
agem
ent T
rust
30 Ju
ne 2
013
15 A
ugus
t 201
314
Aug
ust 2
013
P29
Sep
tem
ber
2013
P
AN
ZA
C D
ay T
rust
31 D
ecem
ber 2
013
15 F
ebru
ary
2014
24 Ja
nuar
y 20
14P
11 F
ebru
ary
2014
P
The
Sol
icito
rs’ T
rust
31 D
ecem
ber 2
013
15 F
ebru
ary
2014
14 F
ebru
ary
2014
20 M
arch
201
4P
24 M
arch
201
4P
Tas
man
ian
Qua
lifica
tion
s Aut
hori
tity
31 D
ecem
ber 2
013
15 F
ebru
ary
2014
13 F
ebru
ary
2014
P24
Mar
ch 2
014
P
Fin
anci
al s
tate
men
tsT
imel
ines
s of au
dit o
pin
ion
issu
e fr
om
bal
ance
dat
e
Enti
tyB
alan
ce
Dat
e
Fin
anci
al
Sta
tem
ent
dea
dline
Sig
ned
Fin
anci
al
Sta
tem
ents
R
ecei
ved
Re-
signed
/A
men
ded
Fin
anci
al
Sta
tem
ents
R
ecei
ved
Cle
ar
opin
ion
issu
ed
Em
phas
is
of
Mat
ter
Audit o
pin
ion
signed
< 8
w
eeks
8 to
10
wee
ks
10 t
o
12
wee
ks
12
to 1
4 w
eeks
14 t
o
16
wee
ks> 1
6 w
eeks

114 Appendix 2 - Audit Status
The
atre
Roy
al M
anag
emen
t Boa
rd31
Dec
embe
r 201
315
Feb
ruar
y 20
1413
Feb
ruar
y 20
14P
17 F
ebru
ary
2014
P
Uni
vers
ity
of T
asm
ania
31 D
ecem
ber 2
013
15 F
ebru
ary
2014
14 F
ebru
ary
2014
P14
Feb
ruar
y 20
14P
AM
C S
earch
Ltd
31 D
ecem
ber 2
013
15 F
ebru
ary
2014
12 F
ebru
ary
2014
P12
Feb
ruar
y 20
14P
TR
EA
SU
RE
R’S
AN
NU
AL
FIN
AN
CIA
L R
EPO
RT
Gen
eral
Gov
ernm
ent S
ecto
r30
June
201
330
Sep
tem
ber
2013
27 S
epte
mbe
r 20
139
Oct
ober
201
3P
23 O
ctob
er 2
013
P
Tot
al S
tate
Sec
tor
30 Ju
ne 2
013
n/a
9 O
ctob
er 2
013
P23
Oct
ober
201
3P
Pub
lic A
ccou
nt30
June
201
330
Sep
tem
ber
2013
27 S
epte
mbe
r 20
13P
23 O
ctob
er 2
013
P
SU
PE
RA
NN
UA
TIO
N F
UN
DS
Ret
irem
ent B
enefi
ts F
und
Boa
rd30
June
201
315
Aug
ust 2
013
15 A
ugus
t 201
316
Sep
tem
ber 2
013
P16
Sep
tem
ber
2013
P
RB
F Fi
nanc
ial P
lann
ing
Pty
Ltd
30 Ju
ne 2
013
15 A
ugus
t 201
314
Aug
ust 2
013
P16
Aug
ust 2
013
P
GO
VE
RN
ME
NT
BU
SIN
ESS
EN
TE
RPR
ISE
S
Fore
stry
Tas
man
ia30
June
201
315
Aug
ust 2
013
15 A
ugus
t 201
3P
P15
Aug
ust 2
013
P
Hyd
ro-E
lect
ric
Cor
pora
tion
30
June
201
315
Aug
ust 2
013
14 A
ugus
t 201
3P
16 A
ugus
t 201
3P
Bell
Bay
Pow
er P
ty L
td30
June
201
315
Aug
ust 2
013
14 A
ugus
t 201
3P
20 S
epte
mbe
r 20
13P
HT
Win
d O
pera
tions
Pty
Ltd
30 Ju
ne 2
013
15 A
ugus
t 201
314
Aug
ust 2
013
P30
Sep
tem
ber
2013
P
Lof
ty R
ange
s Pow
er P
ty L
td30
June
201
315
Aug
ust 2
013
14 A
ugus
t 201
3P
20 S
epte
mbe
r 20
13P
RE
Sto
rage
Hol
ding
s Pty
Ltd
30 Ju
ne 2
013
15 A
ugus
t 201
314
Aug
ust 2
013
P20
Sep
tem
ber
2013
P
Mom
entu
m E
nerg
y P
ty L
td30
June
201
315
Aug
ust 2
013
14 A
ugus
t 201
3P
15 A
ugus
t 201
3P
Mot
or A
ccid
ents
Ins
uran
ce B
oard
30 Ju
ne 2
013
15 A
ugus
t 201
313
Aug
ust 2
013
15 A
ugus
t 201
3P
19 A
ugus
t 201
3P
Port
Art
hur
His
tori
c Si
te M
anag
emen
t
Aut
hori
ty30
June
201
315
Aug
ust 2
013
5 A
ugus
t 201
3P
15 A
ugus
t 201
3P
Pub
lic T
rust
ee
30 Ju
ne 2
013
15 A
ugus
t 201
312
Aug
ust 2
013
P12
Aug
ust 2
013
P
Tas
man
ian
Pub
lic F
inan
ce C
orpo
rati
on
(TA
SCO
RP
)30
June
201
315
Aug
ust 2
013
8 A
ugus
t 201
319
Aug
ust 2
013
P19
Aug
ust 2
013
P
Fin
anci
al s
tate
men
tsT
imel
ines
s of au
dit o
pin
ion
issu
e fr
om
bal
ance
dat
e
Enti
tyB
alan
ce
Dat
e
Fin
anci
al
Sta
tem
ent
dea
dline
Sig
ned
Fin
anci
al
Sta
tem
ents
R
ecei
ved
Re-
signed
/A
men
ded
Fin
anci
al
Sta
tem
ents
R
ecei
ved
Cle
ar
opin
ion
issu
ed
Em
phas
is
of
Mat
ter
Audit o
pin
ion
signed
< 8
w
eeks
8 to
10
wee
ks
10 t
o
12
wee
ks
12
to 1
4 w
eeks
14 t
o
16
wee
ks> 1
6 w
eeks

115Appendix 2 - Audit Status
STA
TE O
WN
ED
CO
RPO
RA
TIO
NS
Aur
ora
Ene
rgy
Pty
Ltd
30 Ju
ne 2
013
15 A
ugus
t 201
312
Aug
ust 2
013
P12
Aug
ust 2
013
P
Met
ro T
asm
ania
Pty
Ltd
30 Ju
ne 2
013
15 A
ugus
t 201
38
Aug
ust 2
013
P8
Aug
ust 2
013
P
Tas
man
ian
Irri
gati
on P
ty L
td
30 Ju
ne 2
013
15 A
ugus
t 201
314
Aug
ust 2
013
P19
Aug
ust 2
013
P
Tas
man
ian
Port
s Cor
pora
tion
Pty
Ltd
30 Ju
ne 2
013
15 A
ugus
t 201
315
Aug
ust 2
013
P15
Aug
ust 2
013
P
Tas
raci
ng P
ty L
td30
June
201
315
Aug
ust 2
013
15 A
ugus
t 201
3P
2 Se
ptem
ber
2013
P
Tas
man
ian
Rai
lway
Pty
Ltd
30 Ju
ne 2
013
15 A
ugus
t 201
35
Aug
ust 2
013
P9
Aug
ust 2
013
P
Tra
nsen
d N
etw
orks
Pty
Ltd
30
June
201
315
Aug
ust 2
013
13 A
ugus
t 201
322
Aug
ust 2
013
P28
Aug
ust 2
013
P
TT
-Lin
e C
ompa
ny P
ty L
td
30 Ju
ne 2
013
15 A
ugus
t 201
313
Aug
ust 2
013
P13
Aug
ust 2
013
P
TA
SM
AN
IAN
WA
TE
R A
ND
SE
WE
RA
GE C
OR
PO
RA
TIO
NS
Tas
man
ian
Wat
er a
nd S
ewer
age
Cor
pora
tion
(Sou
ther
n R
egio
n) P
ty L
td
30 Ju
ne 2
013
15 A
ugus
t 201
314
Aug
ust 2
013
P14
Aug
ust 2
013
P
Tas
man
ian
Wat
er a
nd S
ewer
age
Cor
pora
tion
(Nor
ther
n R
egio
n) P
ty L
td
30 Ju
ne 2
013
15 A
ugus
t 201
314
Aug
ust 2
013
P14
Aug
ust 2
013
P
Tas
man
ian
Wat
er a
nd S
ewer
age
Cor
pora
tion
(Nor
th W
este
rn R
egio
n) P
ty L
td
30 Ju
ne 2
013
15 A
ugus
t 201
314
Aug
ust 2
013
P14
Aug
ust 2
013
P
Tas
man
ian
Wat
er a
nd S
ewer
age
Cor
pora
tion
(Com
mon
Ser
vice
s) P
ty L
td
30 Ju
ne 2
013
15 A
ugus
t 201
314
Aug
ust 2
013
P14
Aug
ust 2
013
P
OT
HE
R P
UB
LIC
NO
N-F
INA
NC
IAL C
OR
PO
RA
TIO
NS
Mac
quar
ie P
oint
Dev
elop
men
t Cor
pora
tion
30 Ju
ne 2
013
15 A
ugus
t 201
315
Aug
ust 2
013
5 Se
ptem
ber 2
013
P10
Sep
tem
ber
2013
P
Priv
ate
Fore
sts T
asm
ania
30 Ju
ne 2
013
15 A
ugus
t 201
315
Aug
ust 2
013
P30
Sep
tem
ber
2013
P
Fin
anci
al s
tate
men
tsT
imel
ines
s of au
dit o
pin
ion
issu
e fr
om
bal
ance
dat
e
Enti
tyB
alan
ce
Dat
e
Fin
anci
al
Sta
tem
ent
dea
dline
Sig
ned
Fin
anci
al
Sta
tem
ents
R
ecei
ved
Re-
signed
/A
men
ded
Fin
anci
al
Sta
tem
ents
R
ecei
ved
Cle
ar
opin
ion
issu
ed
Em
phas
is
of
Mat
ter
Audit o
pin
ion
signed
< 8
w
eeks
8 to
10
wee
ks
10 t
o
12
wee
ks
12
to 1
4 w
eeks
14 t
o
16
wee
ks> 1
6 w
eeks
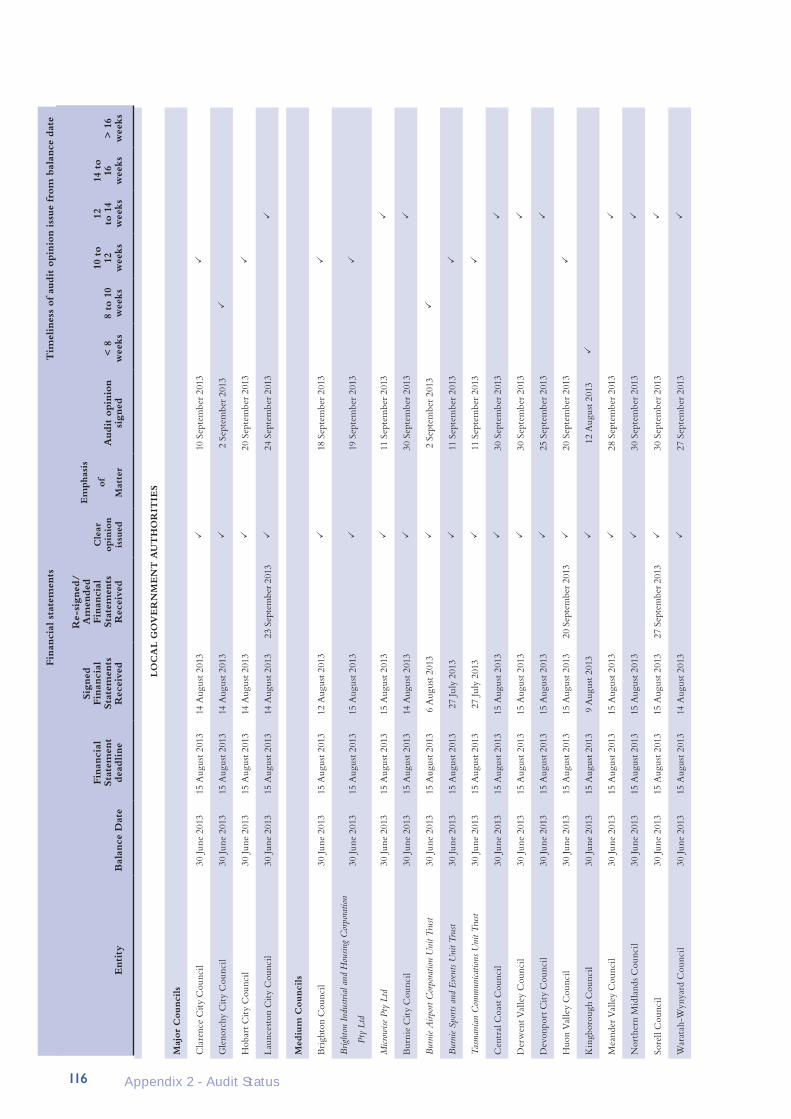
116 Appendix 2 - Audit Status
LO
CA
L G
OV
ER
NM
EN
T A
UT
HO
RIT
IES
Maj
or
Counci
ls
Cla
renc
e C
ity
Cou
ncil
30 Ju
ne 2
013
15 A
ugus
t 201
314
Aug
ust 2
013
P10
Sep
tem
ber
2013
P
Gle
norc
hy C
ity
Cou
ncil
30 Ju
ne 2
013
15 A
ugus
t 201
314
Aug
ust 2
013
P2
Sept
embe
r 20
13P
Hob
art C
ity
Cou
ncil
30 Ju
ne 2
013
15 A
ugus
t 201
314
Aug
ust 2
013
P20
Sep
tem
ber
2013
P
Laun
cest
on C
ity
Cou
ncil
30 Ju
ne 2
013
15 A
ugus
t 201
314
Aug
ust 2
013
23 S
epte
mbe
r 201
3P
24 S
epte
mbe
r 20
13P
Med
ium
Counci
ls
Bri
ghto
n C
ounc
il 30
June
201
315
Aug
ust 2
013
12 A
ugus
t 201
3P
18 S
epte
mbe
r 20
13P
Brig
hton
Ind
ustri
al a
nd H
ousin
g C
orpo
ratio
n
Pty
Ltd
30 Ju
ne 2
013
15 A
ugus
t 201
315
Aug
ust 2
013
P19
Sep
tem
ber
2013
P
Micr
owise
Pty
Ltd
30 Ju
ne 2
013
15 A
ugus
t 201
315
Aug
ust 2
013
P11
Sep
tem
ber
2013
P
Bur
nie
Cit
y C
ounc
il30
June
201
315
Aug
ust 2
013
14 A
ugus
t 201
3P
30
Sep
tem
ber
2013
P
Bur
nie
Airp
ort C
orpo
ratio
n U
nit T
rust
30 Ju
ne 2
013
15 A
ugus
t 201
36
Aug
ust 2
013
P2
Sept
embe
r 20
13P
Bur
nie
Spor
ts an
d E
vent
s Uni
t Tru
st30
June
201
315
Aug
ust 2
013
27 Ju
ly 2
013
P11
Sep
tem
ber
2013
P
Tas
man
ian
Com
mun
icatio
ns U
nit T
rust
30 Ju
ne 2
013
15 A
ugus
t 201
327
July
201
3P
11 S
epte
mbe
r 20
13P
Cen
tral
Coa
st C
ounc
il30
June
201
315
Aug
ust 2
013
15 A
ugus
t 201
3P
30 S
epte
mbe
r 20
13P
Der
wen
t Val
ley
Cou
ncil
30 Ju
ne 2
013
15 A
ugus
t 201
315
Aug
ust 2
013
P30
Sep
tem
ber
2013
P
Dev
onpo
rt C
ity
Cou
ncil
30 Ju
ne 2
013
15 A
ugus
t 201
315
Aug
ust 2
013
P25
Sep
tem
ber
2013
P
Huo
n V
alle
y C
ounc
il30
June
201
315
Aug
ust 2
013
15 A
ugus
t 201
320
Sep
tem
ber 2
013
P20
Sep
tem
ber
2013
P
Kin
gbor
ough
Cou
ncil
30 Ju
ne 2
013
15 A
ugus
t 201
39
Aug
ust 2
013
P12
Aug
ust 2
013
P
Mea
nder
Val
ley
Cou
ncil
30 Ju
ne 2
013
15 A
ugus
t 201
315
Aug
ust 2
013
P28
Sep
tem
ber
2013
P
Nor
ther
n M
idla
nds C
ounc
il 30
June
201
315
Aug
ust 2
013
15 A
ugus
t 201
3P
30 S
epte
mbe
r 20
13P
Sore
ll C
ounc
il30
June
201
315
Aug
ust 2
013
15 A
ugus
t 201
327
Sep
tem
ber 2
013
P30
Sep
tem
ber
2013
P
War
atah
-Wyn
yard
Cou
ncil
30 Ju
ne 2
013
15 A
ugus
t 201
314
Aug
ust 2
013
P27
Sep
tem
ber
2013
P
Fin
anci
al s
tate
men
tsT
imel
ines
s of au
dit o
pin
ion
issu
e fr
om
bal
ance
dat
e
Enti
tyB
alan
ce D
ate
Fin
anci
al
Sta
tem
ent
dea
dline
Sig
ned
Fin
anci
al
Sta
tem
ents
R
ecei
ved
Re-
signed
/A
men
ded
Fin
anci
al
Sta
tem
ents
R
ecei
ved
Cle
ar
opin
ion
issu
ed
Em
phas
is
of
Mat
ter
Audit o
pin
ion
signed
< 8
w
eeks
8 to
10
wee
ks
10 t
o
12
wee
ks
12
to 1
4 w
eeks
14 t
o
16
wee
ks> 1
6 w
eeks

117Appendix 2 - Audit Status
Fin
anci
al s
tate
men
tsT
imel
ines
s of au
dit o
pin
ion
issu
e fr
om
bal
ance
dat
e
Enti
tyB
alan
ce D
ate
Fin
anci
al
Sta
tem
ent
dea
dline
Sig
ned
Fin
anci
al
Sta
tem
ents
R
ecei
ved
Re-
signed
/A
men
ded
Fin
anci
al
Sta
tem
ents
R
ecei
ved
Cle
ar
opin
ion
issu
ed
Em
phas
is
of
Mat
ter
Audit o
pin
ion
signed
< 8
w
eeks
8 to
10
wee
ks
10 t
o
12
wee
ks
12
to 1
4 w
eeks
14 t
o
16
wee
ks> 1
6 w
eeks
Wes
t Coa
st C
ounc
il30
June
201
315
Aug
ust 2
013
14 A
ugus
t 201
3P
29 S
epte
mbe
r 20
13P
Wes
t Tam
ar C
ounc
il30
June
201
315
Aug
ust 2
013
14 A
ugus
t 201
3P
2 Se
ptem
ber
2013
P
Sm
all C
ounci
ls
Bre
ak O
'Day
Cou
ncil
30 Ju
ne 2
013
15 A
ugus
t 201
315
Aug
ust 2
013
P30
Sep
tem
ber
2013
P
Cen
tral
Hig
hlan
ds C
ounc
il30
June
201
315
Aug
ust 2
013
14 A
ugus
t 201
3P
15 S
epte
mbe
r 20
13P
Cir
cula
r H
ead
Cou
ncil
30 Ju
ne 2
013
15 A
ugus
t 201
315
Aug
ust 2
013
P30
Sep
tem
ber
2013
P
Dor
set C
ounc
il30
June
201
315
Aug
ust 2
013
15 A
ugus
t 201
3P
27 S
epte
mbe
r 20
13P
Flin
ders
Cou
ncil
30 Ju
ne 2
013
15 A
ugus
t 201
315
Aug
ust 2
013
4 O
ctob
er 2
013
P7
Oct
ober
201
3P
Geo
rge
Tow
n C
ounc
il
30 Ju
ne 2
013
15 A
ugus
t 201
314
Aug
ust 2
013
P28
Sep
tem
ber
2013
P
Gla
mor
gan-
Spri
ng B
ay C
ounc
il30
June
201
315
Aug
ust 2
013
30 A
ugus
t 201
3P
30 S
epte
mbe
r 20
13P
Ken
tish
Cou
ncil
30 Ju
ne 2
013
15 A
ugus
t 201
315
Aug
ust 2
013
P30
Sep
tem
ber
2013
P
Kin
g Is
land
Cou
ncil
30 Ju
ne 2
013
15 A
ugus
t 201
315
Aug
ust 2
013
25 S
epte
mbe
r 201
3P
30 S
epte
mbe
r 20
13P
Latr
obe
Cou
ncil
30 Ju
ne 2
013
15 A
ugus
t 201
321
Aug
ust 2
013
P4
Oct
ober
201
3P
Sout
hern
Mid
land
s Cou
ncil
30 Ju
ne 2
013
15 A
ugus
t 201
314
Aug
ust 2
013
P30
Sep
tem
ber
2013
P
Tas
man
Cou
ncil
30 Ju
ne 2
013
15 A
ugus
t 201
315
Aug
ust 2
013
P19
Sep
tem
ber
2013
P
Loca
l G
ove
rnm
ent B
usi
nes
s U
nits
Cop
ping
Ref
use
Dis
posa
l Site
Join
t
Aut
hori
ty30
June
201
315
Aug
ust 2
013
13 A
ugus
t 201
3P
27 S
epte
mbe
r 20
13P
Cra
dle
Coa
st A
utho
rity
30 Ju
ne 2
013
15 A
ugus
t 201
314
Oct
ober
201
3P
7 N
ovem
ber
2013
P
Dul
vert
on R
egio
nal W
aste
Man
agem
ent
Aut
hori
ty30
June
201
315
Aug
ust 2
013
22 A
ugus
t 201
3P
7 O
ctob
er 2
013
P
Sout
hern
Tas
man
ian
Cou
ncils
Aut
hori
ty30
June
201
315
Aug
ust 2
013
15 A
ugus
t 201
3P
29 S
epte
mbe
r 20
13P
Sout
hern
Was
te S
trat
egy
Aut
hori
ty30
June
201
315
Aug
ust 2
013
15 Ju
ly 2
013
P14
Aug
ust 2
013
P

118 Appendix 3 - Acronyms and Abbreviations
appendix 3 - aCronyms and abbreviaTions
AAS Australian Accounting StandardsAASB Australian Accounting Standards BoardABS Australian Bureau of StatisticsACIPA Academy of Creative Industries and Performing ArtsACT Australian Capital TerritoryAEMO Australian Energy Market OperatorAEMC Australian Energy Market CommissionAER Australian Energy RegulatorAETV Aurora Energy Tamar ValleyANAO Australian National Audit OfficeAPRA Australian Prudential Regulation AuthorityASX Australian Stock ExchangeBBP Bell Bay Power Pty LtdBLW Ben Lomond WaterCEO Chief Executive OfficerCFO Chief Financial OfficerCLP China Light and PowerCMW Cradle Mountain Water
CPI Consumer Price IndexCPOL Cargo and Port Operational LogisticsDHHS Department of Health and Human ServicesDIER Department of Infrastructure, Energy and ResourcesDORC Depreciated Optimised Replacement CostDPAC Department of Premier and CabinetDPEM Department of Police and Emergency ManagementDIISRTE Department of Industry, Innovation, Science, Research and Tertiary
EducationDPIPWE Department of Primary Industries, Parks, Water and the EnvironmentEBA Enterprise Bargaining AgreementEBIT Earnings Before Interest and TaxEBITDA Earnings Before Interest, Tax, Depreciation and AmortisationEEP Environmental Energy ProductsEFTSL Equivalent Full-time Student LoadEOI Expression of InterestFCAS Frequency Control Ancillary ServicesFMAA Financial Management and Audit Act 1990FTE Full-time EquivalentFSI Forest Services InternationalGBE Government Business EnterpriseGDP Gross Domestic ProductGGS General Government SectorGMO Grantham, Mayo and OtterlooGSP Gross State ProductGST Goods and Services TaxGWh Gigawatt Hour

119Appendix 3 - Acronyms and Abbreviations
HEC Hydro-Electric CorporationHECS-HELP Higher Education Loan Program HR Human ResourcesIMAS Institute of Marine and Antarctic StudiesIPSASB International Public Sector Accounting Standards BoardIRR Inter Regional RevenuesIT Information TechnologyKIPC King Island Ports CorporationKPI Key Performance IndicatorsKV KilovoltLGAT Local Government Association of TasmaniaLSL Long Service LeaveMAIB Motor Accidents Insurance BoardMAR Maximum Allowable RevenueMIC Member Investment ChoiceMWh Megawatt HourNDRRA Natural Disaster Relief and Recovery ArrangementsNEM National Electricity MarketNEMMCO National Electricity Market Management Company LimitedNewood Newood Holdings Pty LtdNRAS National Rent Affordability SchemeNTER National Taxation Equivalent RegimeOPWG Optical Ground WirePA Public AccountPFC Public Financial Corporation
PNFC Public Non-Financial CorporationPNT Pacific National TasmaniaPOAGS P&O Automotive and General Stevedoring Pty LtdPRBF Parliamentary Retiring Benefits FundPSF Parliamentary Superannuation FundPWC Price WaterhouseCoopersR40s Roaring 40s Renewable Energy Pty LtdRBF Retirement Benefits FundRBFB Retirement Benefits Fund BoardREC Renewable Energy CertificatesRFDS Royal Flying Doctor ServiceROGS Report on Government ServicesSEV Soil Expectation ValueSFC State Fire CommissionSFCSS State Fire Commission Superannuation SchemeSOC State Owned CompanySDTF Special Deposits and Trust FundSLIMS Technology One Student Management SystemSW Southern WaterSPA Superannuation Provision AccountSPFR Specific Purpose Financial ReportsTAFR Treasurer’s Annual Financial ReportTAS Tasmanian Accumulation Scheme

120 Appendix 3 - Acronyms and Abbreviations
Tascorp Tasmanian Public Finance CorporationTasracing Tasracing Pty LtdTASSS Tasmanian Ambulance Service Superannuation SchemeTasWater Tasmanian Water and Sewerage Corporation Pty LtdTCFA Tasmanian Community Forest AgreementTDRA Temporary Debt Repayment AccountTFIA Tasmanian Forest Intergovernmental AgreementTFS Tasmanian Fire ServiceTIDB Tasmanian Irrigation Development Board Pty LtdTIPL Tasmanian Irrigation Pty LtdTRB Tasmanian Racing BoardTVPS Tamar Valley Power StationTWSC Tasmanian Water and Sewerage CorporationTUU Tasmanian University Union IncorporatedUPF Uniform Presentation FrameworkVaR Value at RiskWACC Weighted Average Cost of Capital

121Appendix 4 - Recent Reports
appendix 4 - reCenT reporTs
Tabled no. TiTle
2012
November No 3 of 2012-13 Volume 3 - Government Business Enterprises, State Owned Companies and Water Corporations 2011-12
November No 4 of 2012-13 Volume 4 - Local Government Authorities 2011-12
November No 5 of 2012-13 Volume 1 - Analysis of the Treasurer’s Annual Financial Report 2011-12
November No 6 of 2012-13 Volume 2 - Executive Legislature, Government Departments, other General Government Sector State entities and Superannuation Funds 2011-12
December No 7 of 2012-13 Compliance with the Tasmanian Adult Literacy Plan 2010-15
2013
March No 8 of 2012-13 National Partnership Agreement on Homelessness
March No 9 of 2012-13 Royal Derwent Hospital: site sale
May No 10 of 2012-13 Hospital bed management and primary preventative health
May No. 11 of 2012-13 Financial Statements of State entities: Volume 5 - Other State entities
May No. 11 of 2012-13 Department of Health and Human Services - Output based expenditure (included in Financial Statements of State entities: Volume 5 - Other State entities)
August No. 1 of 2013-14 Fraud control in local government
November No. 2 of 2013-14 Volume 1 - Executive and Legislature, Government Departments, Tasmanian Health Organisations, Other General Government Sector State entities, Other State entities and Superannuation Funds
November No. 3 of 2013-14 Volume 2 - Government Businesses, Other Public Non-Financial Corporations and Water Corporations
December No. 4 of 2013-14 Volume 3 - Local Government Authorities
December No. 5 of 2013-14 Infrastructure Financial Accounting in Local Government
2014
January No. 6 of 2013-14 Redevelopment of the Royal Hobart Hospital: governance and project management
February No. 7 of 2013-14 Police responses to serious crime
February No. 8 of 2014-14 Volume 4 - Analysis of the Treasurer’s Annual Finncial Report 2012-13
Auditor-General’s reports are available from the Tasmanian Audit Office. These and other published reports can be accessed via the Office’s homepage: www.audit.tas.gov.au

Level 4, Executive Building, 15 Murray Street, Hobart, Tasmania, 7000Postal Address GPO Box 851, Hobart, Tasmania, 7001
Phone: 03 6226 0100 | Fax: 03 6226 0199Email: [email protected]
Web: www.audit.tas.gov.au
To provide independent assurance to the Parliament and Community on the performance and accountability of the Tasmanian Public sector.Professionalism | Respect | Camaraderie | Continuous Improvement | Customer Focus
Strive | Lead | Excel | To Make a Difference
VISION AND PURPOSE
our vision
STRIVE | LEAD | EXCEL | TO MAKE A DIFFERENCE
our purpose
To provide independent assurance to the Parliament and Community on the performance and accountability of the Tasmanian Public sector
Availability of reports
Auditor-General’s reports are available from the Tasmanian Audit Office, Hobart. This report and other recent reports published by the Office can be accessed via the Office’s home page. For further information please contact the Office.
© Crown in right of the state of Tasmania may 2014

Audit Mandate and Standards Applied
Mandate
Section 17(1) of the Audit Act 2008 states that:
‘An accountable authority other than the Auditor-General, as soon as possible and within 45 days after the end of each financial year, is to prepare and forward to the Auditor-General a copy of the financial statements for that financial year which are complete in all material respects.’
Under the provisions of section 18, the Auditor-General:
‘(1) is to audit the financial statements and any other information submitted by a State entity or an audited subsidiary of a State entity under section 17(1).’
Under the provisions of section 19, the Auditor-General:
‘(1) is to prepare and sign an opinion on an audit carried out under section 18(1) in accordance with requirements determined by the Australian Auditing and Assurance Standards
(2) is to provide the opinion prepared and signed under subsection (1), and any formal communication of audit findings that is required to be prepared in accordance with the Australian Auditing and Assurance Standards, to the State entity’s appropriate Minister and provide a copy to the relevant accountable authority.’
Standards Applied
Section 31 specifies that:
‘The Auditor-General is to perform the audits required by this or any other Act in such a manner as the Auditor-General thinks fit having regard to –
(a) the character and effectiveness of the internal control and internal audit of the relevant State entity or audited subsidiary of a State entity;
(b) the Australian Auditing and Assurance Standards.’
The auditing standards referred to are Australian Auditing Standards as issued by the Australian Auditing and Assurance Standards Board.

Photo courtesy of Tourism Tasmania and Garry Moore
Phone (03) 6226 0100Fax (03) 6226 0199email [email protected] www.audit.tas.gov.au
Address Level 4, Executive Building 15 Murray Street, Hobart
Postal Address GPO Box 851, Hobart 7001Office Hours 9am to 5pm Monday to Friday
Launceston OfficePhone (03) 6336 2503Fax (03) 6336 2908
Address 2nd Floor, Henty House 1 Civic Square, Launceston