Embed Size (px)
Citation preview

no . 28 2
of the
VIRGINIA INSTITUTE of
MARINE SCIENCE
VIRGINIA SEA GRANT MARINE AD VISORY SER . C: at the VIRGINIA INSTITUTE OF MARl~.E SC E , CE
of THE COLLEGE OF WI LU' " • •,_:: "' ::; •
Norfolk's Harborfest '86
A Tenth Anniversary Analysis
Jon A. Lucy Marine Recreation Specialist
Sea Grant Marine Advisory Service Virginia Institute of Marine Science
Instructor School of Marine Science
College of William and Mary Gloucester Point, Virginia
Eleanor A. Bochenek Graduate Assistant
Fisheries/Marine Resources Management Sea Grant Marine Advisory Service
Virginia Institute of Marine Science School of Marine Science
College of William and Mary Gloucester Point, Virginia
Special Report in Applied Marine Science and Ocean Engineering No. 282
Virginia Sea Grant Marine Advisory Service at the
Virginia Institute of Marine Science College of William and Mary
1986
This work is a result of research sponsored in part by the National Sea Grant College Program of the National Oceanic and Atmospheric Administration, U.S. Department of Commerce, under Grant No. NASIAA-0-00025 to the Virginia Graduate Marine Science Consortium and the Virginia Sea Grant College Program. The U.S. Government is authorized to produce and distribute reprints for governmental purposes notwithstanding any copyright notation that may appear hereon.
t
t
t
t
t
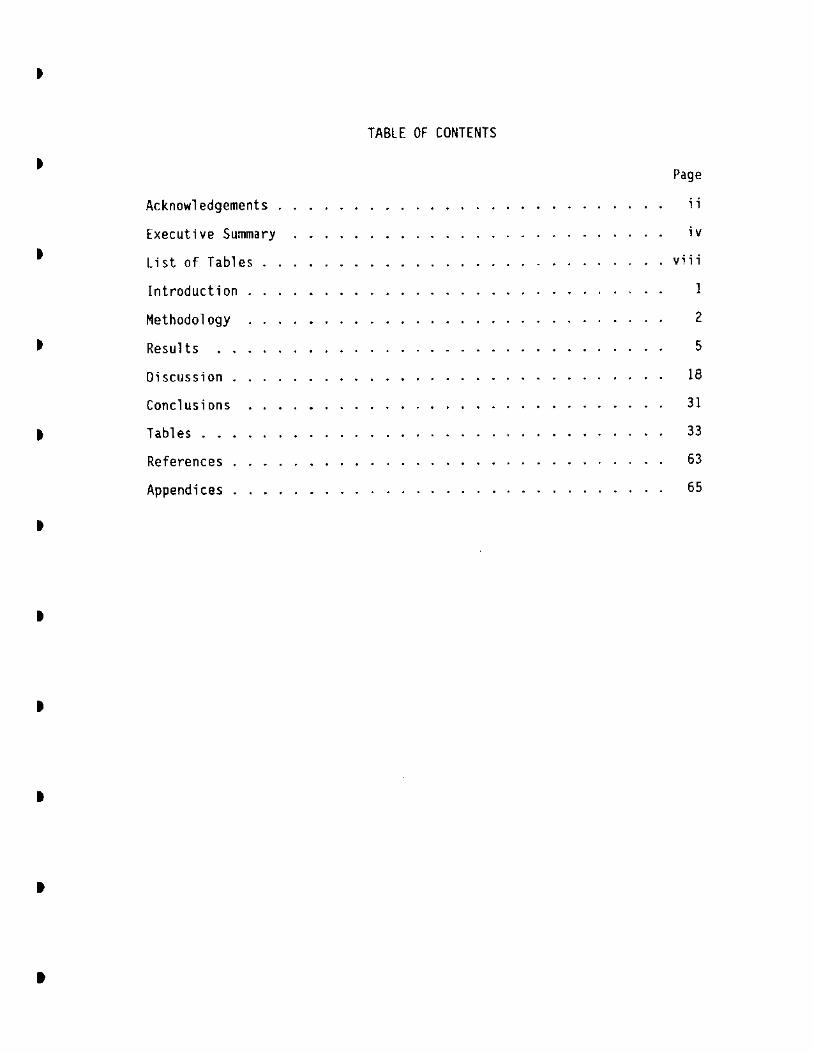
Acknowledgements .
Executive Summary
List of Tables
Introduction
Methodology
Results
Discussion
Conclusions
Tables ..
References
Appendices
TABLE OF CONTENTS
Page
i ;
iv
viii
l
2
5
18
31
33
63
65

'
'
'
'
'
ACKNOWLEDGEMENTS
The Harborfest Executive Co1T111ittee, an organization of corporate and
civic volunteers, requested the assistance of the Sea Grant Marine Advisory
Service Program of the Virginia Institute of Marine Science {VIMS) in
conducting a study of Norfolk's tenth anniversary Harborfest celebration.
Because of the Marine Advisory Service Program's interest in the role
Harborfest has played in the continuing development of Norfolk's downtown
waterfront, and the unique opportunity to conduct a follow+up study to a
smaller-scale survey of the 1979 festival, VIMS agreed to assist the
Committee. Special thanks are due Dr. Bill DuPaul, Head of the Department
of Marine Advisory Services, for his support of this project and his
personal involvement in both the planning and implementation phases of the
undertaking.
Various members of the Harborfest Executive Committee worked closely
with the study organizers in developing the survey questionnaire. Special
thanks for these efforts are due Mr. Mike Pitchford, Committee Chairman, and
Ms. Susan May, Vice-Chairman and principal study liaison with the Committee.
In addition, helpful input on the questionnaire was received from Ms. June
McPartland, Ms. Sue Doviak, Ms. Jeanne McDougall, and Ms. Dianne Stutz of
Norfolk's Convention and Visitors Bureau. Mr. Larry Zehnder of Norfolk's
Department of Parks and Recreation also contributed to the survey
questionnaire. The overall design of the questionnaire was reviewed by Dr.
John Nezlek of the Department of Psychology of the College of William and
Mary. His constructive suggestions on wording and format were very helpful.
During the three hectic days of the festival, interviewers were
graciously fed and sheltered from sun, wind and rain by Mr. Jim Boyle and
i i

I
I
I
I
I
I
I
I
I
I
•
his crew of volunteers coordinating the Harborfest volunteer tent. Study
volunteers greatly appreciated the hospitality extended to them by the
Executive Committee through Mr. Boyle.
Many Committee members also assisted the study organizers with numerous
critical communication needs during the Festival. Of special help were Mr.
Roger Saunders, Mr. Ron Spadafora, Mr. Skip Gibson, Mr. Jim Brune, Ms. Paul a
Barclay, Ms. Rhonda Brune and Mr. Bill Church. Ms. Barbara Thomas of the
Harborfest Office provided a critical communication link with festival
officials on many occasions.
The study would have been impossible without the volunteer efforts of
numerous VIMS/William and Mary staff, graduate students and spouses who
worked tirelessly to interview festival patrons. A special thanks is given
to Ms. Pat Barthle, Mr. Carl Bates. Mr. Dave Boyd, Ms. Nancy Chartier, Mr.
Joe Choromanski, Or. William DuPaul, Ms. Jaye DuPaul, Ms. Lisa Kline, Ms.
Dianne Lucy, Mr. Steve Madenburg, Mr. Livingston Marshall, Ms. Pam Mason,
Mr. Mike Oester1 ing, Mr. Dan Sved, Ms. Monica Sved, and Mr. Dave Wyanski.
Ms. Nancy Chartier and Ms. Randa Mansour. graduate assistants,
contributed to data entry and construction of data tables.
Ms. Dianne Roberts and Ms. Cheryl Teagle composed numerous
questionnaire drafts. Ms. Ruth Hershner, Ms. Maxine Butler and Ms. Janet
Walker of VIMS Word Processing Center, along with Ms. Cheryl Teagle,
prepared the report for printing. Ms. Christine Plummer assisted with
editing and Ms. Sylvia Motley printed the final report. Cover photographs
were provided courtesy of Harborfest volunteers Mr. Kevin McPartland
{background photo) and Ms. June McPartland (insert photo).
Thanks to you all!
Jon Lucy
; i i

t
t
t
t
t
t
t
•
EXECUTIVE SUMMAR1
The 1986 Harborfest celebration drew patrons predominantly from the
Greater Hampton Roads area, but also attracted significant numbers of
visitors from other Virginia communities and areas outside Virginia.
Approximately 80% of the festival crowd resided in the Hampton Roads
Metropolitan Statistical Area (compared to 74% in 1979), with almost 12% of
the patrons coming from out of state (down from 18% in 1979).
While exhibiting a shift towards greater local attendance in 1986, the
festival continued to demonstrate its ability to attract tourists to
downtown Norfolk's waterfront area. Of those festival patrons attending the
event from outside the general Hampton Roads area, 59% were in the Norfolk
area primarily for the festival, 33% primarily related to being on vacation,
with an additional 8% in the area principally for business reasons. Over
75% of these "tourist" patrons indicated that they were in Norfolk either
primarily for the festival or had planned their vacation/business trips to
the area around the waterfront celebration.
Efforts to improve access to the festival through shuttle bus and ferry
services have helped reduce downtown traffic congestion, but problems still
exist. Nearly 47% of patrons arrived in the festival area by car, with 31%
using the bus/ferry shuttle services and 13% arriving by boat. With shuttle
buses handling approximately 56,000 patrons throughout the three-day
festival and ferries carrying an additional 39,000 visitors, the shuttle
services potentially reduced traffic in downtown Norfolk by over 25,000
vehicles. Even with three ferries operating, however, this service quickly
became overwhelmed by patrons, resulting in extremely long lines and
numerous patron complaints.
iv

•
•
•
•
•
•
•
•
•
•
•
In seeking input on disappointing features of the festival, it was
determined that the 1986 celebration exhibited a greater proportion of
patrons voicing no disappointments about activities (52%) than during the
1979 event (39%). This is particularly noteworthy considering growth in
festival attendance and the corresponding increase in complexity of festival
programming. Among problems common to both festivals, commercialization
high prices jumped from a seventh place ranking in 1979 to first place in
1986 (discounting weather problems). Crowd congestion ranked high as a
problem during both years, being mentioned most frequently as the one aspect
of the 1986 festival that patrons would like changed. Concerning overall
festival quality, 71% of patrons having attended the festival before stated
that quality had improved, indicating that organizers have been fairly
successful in addressing festival problems.
Water events, including ship and boat activities, declined
significantly in their relative contribution to total programmed events in
1986 (compared to 1979}; such festival elements, however, continued to be
ranked by patrons as their top favorite activity. Music ranked as second in
favorite festival activities for 1986 with food ranking third, up from fifth
in 1979. Fireworks maintained a fourth place ranking during both years. In
1986, favorite activities were more evenly distributed in their ranking by
patrons than in the earlier festivali food, music, and fireworks, captured
significantly larger proportions of the popularity ranking in 1986 than in
1979.
The Harborfest '86 crowd was largely characterized as being family
oriented. Festival patrons were primarily in their twenties and thirties,
evenly divided between being single and married, and generally attended the
festival with family or friends. Better than 25% of the crowd was
V
I
I
I
accompanied by children, with the average age of such children being nine
years old.
Over three-quarters of the patrons had attended at least one previous
festival. Patrons' return rate to the festival was high compared to similar
events for which data were available. All ten Harborfest celebrations had
been attended by 22% of the 1986 crowd.
Considering the strong pace of development characterizing Norfolk's
waterfront, patrons were questioned about its possible impact on attendance
at future festivals. Asked if they would attend the festival if it were
forced away from the waterfront and held in the streets of the financial
district, 81% of patrons responded negatively. The negative response
included a significant proportion of patrons {58%) who stated that they
definitely would not attend the event under such circumstances.
Overall festival attendance was estimated at 385,725, based upon a
random telephone survey technique. The festival more than doubled in
attendance since 1979, when a similar survey technique estimated crowd size
at 184,700. Attendance in 1986 may have been somewhat less than that of
recent past festivals due to periodic rain and drizzle on Saturday. More
importantly, Saturday's weather forecast called for the likelihood of
Tropical Storm Andrew dumping heavy rain on southeastern Virginia, a
significant deterrent to potential festival patrons. More patrons visited
the festival one day (42%) than attended two (30%) or three days (28%); on
the average, boating parties attended the full three days of the festival
while land parties averaged approximately one and one half days attendance.
Expenditures, averaging $11.25 per person per day for land and boat
parties combined, principally occurred in the festival area {83%) rather
vi
•
•
•
•
•
•
•
•
•
•
•
than in areas immediately adjacent to the festival (6%} or in the Greater
Hampton Roads area (11%}. Nearly 75% of patron expenditures went to food
and beverage items, 15% to souvenirs, with the remainder going to lodging
and miscellaneous items. Based upon overall attendance and patron
visitation patterns, total estimated expenditures attributed to the three
day festival equaled $9.7 million. Expenditures of approximately $8.0
million were estimated to have been made directly in the festival area,
which included the shops and restaurants of Waterside as well as the Omni
International Hotel. Applying a tourist expenditure multiplier of 1.25 to
those expenditures made by persons attending the festival from outside of
the Hampton Roads Metropolitan Statistical Area provided an additional
estimated expenditure impact of approximately $422,000. Total combined
festival-related expenditures, the sum of initial expenditures and the
tourist multiplier effect, were estimated to be $10.2 million .
The analysis of the 1986 Harborfest celebration demonstrated that the
festival, while undergoing numerous changes over the years, continues to
contribute significantly to the revitalization of Norfolk's downtown
waterfront. The festival provides a quality, family-oriented recreational
event for thousands of local residents, while simultaneously attracting
considerable numbers of in-state and out-of-state tourists to the Norfolk
area. This analysis of Harborfest's tenth anniversary celebration should
prove beneficial to Norfolk and other Hampton Roads communities as they
strive to maintain, or newly establish, crucial focal points of people
activity in their evolving waterfront plans. The imaginative infusion of
such focal points into a community's waterfront revitalization program
ultimately determines the program's success .
vii

•
•
•
•
I
•
LIST OF TABLES
Page
Table 1. Arrival Mode of Harborfest Patrons. 33
Table 2A. Lodging Arrangements For Harborfest Patrons 34
2B. Overnight lodging Pattern for Festival Patrons Using Hotels and Motels . . . . . . . . . . . . . . . 34
Table 3. Residential Distribution of Harborfest Patrons. . 35
Table 4. Land-Party and Boat-Party Festival Patrons' Residential Distribution. . . 36
Table SA. Mode of Transportation to Norfolk for Festival Patrons Visiting from Outside the Hampton Roads Area. . 37
SB. Length of Stay in Norfolk Area for Festival Patrons Visiting from Outside the Hampton Roads Area. . . . 37
Table 6A. Primary Reasons for Festival Tourist Patrons Visiting the Norfolk Area. . . . . . . . . . . . 38
68. Relative Ranking of Non-Festival Reasons for Tourist Patrons Visiting the Norfolk Area . . . . 38
Table 7. Patron Response to Festival Publicity Campaign. 39
Table BA. Favorite Activity of Festival Patrons . 40
SB. Second Overall Favorite Activity of Festival Patrons. 40
Table 9. Overall Weighted Popularity Index Ranking for Patron's Favorite Festival Activity. . . . . . .
Table 10. Situations or Events Disappointing to Festival Patrons
41
and Which Patrons Would like Changed. 42
Table 11. Festival Patrons' Opinion of litter Control Program . 43
Table 12. Patron Response to Perceived Changes in Since Previous Visit{s} . . ...
Festival Quality 43
Table 13A. Patrons' Attendance Record for Previous Festivals 44
l3B. Patron Response Regarding Attending Festival if Moved Away from the Waterfront. . . 44
Table 14. Festival Attendance Patterns for land-Parties, Boat-Parties, and Festival Patrons Overall. . . . 45
Table 15. Sociological Characteristics of Festival Patrons. 46
Vi j i

•
•
•
•
•
•
•
•
•
•
•
Table 16. Age Distribution of Children Accompanying Festival Patrons .....................• • . . 47
Table 17A. Daily and Total Estimated Festival Attendance Based Upon Combined Shuttle Bus and Ferry Ridership from Interviews . . . . . . . ........ .
178. Total Estimated Festival Attendance Based Upon a Random Telephone Survey of Virginia Beach Households.
Table 18.
Table 19.
Table 20.
Table 21.
Table 22.
Characteristics of Boating Sample for Festival Study ..
Estimated Number of Boats at Harborfest by Mooring Area.
Estimated Average Daily Expenditures Per Group and Per Person at Harborfest . . . . . . . . ....... .
Estimated Total Expenditures by All Harborfest Patrons
Estimated Average Daily Land-Party Expenditures (per group
48
48
49
so
SI
S2
and per person) Associated with Harborfest ..••..•. 53
Table 23. Estimated Total Expenditures by Harborfest Patrons Arriving by Land {non-boating parties) .•..
Table 24.
Table 2S.
Table 26.
Table 27 .
Table 28.
Table 29.
General Expenditure Patterns for land-Parties, BoatParties and Festival Patrons Overall ..•..•••
Estimated Average Daily Boat-Party Expenditures (Per Boat and Per Person) Associated with Harborfest •••
Comparison of Patrons' Residential Distribution from 1986 and 1979 Festivals. . . . . . . • . ••.
Comparison of land-Party and Boat-Party Patrons' Residential Distribution for 1986 and 1979 Festivals
Comparison of Patron Response to Publicity Campaigns for 1986 and 1979 Festivals .......•
S4
ss
56
S7
SB
S9
Comparison of Patrons' Favorite Activities for the 1986 and 1979 Festivals. . . . . . . . . ... 60
Table 30.
Table 31.
Comparison of Progra1T111ed Events for 1986 and 1979 Festivals ......•..•••....•....
Comparison of Patrons' Opinions on Disappointing Aspects of the 1986 and 1979 Festivals ............ .
61
62
ix
'
'
I
INTRODUCTION
Since its inception ten years ago, Norfolk's Harborfest has become one
of the region's most popular waterfront festivals. Having grown in size and
diversity, the festival is considered by many to have been a crucial element
in the overwhelmingly successful redevelopment of Norfolk's downtown
waterfront (Lucy 1981; Lucy, Breen and Ridby 1985). The festival has
significantly contributed to downtown Norfolk's new image as a tourist
destination. Whether traveling by land or boat, growing numbers of visitors
are learning that there is much to see and do on the City's waterfront (Lucy
1986). Naturally, the festival's success has led to more complex
organizational problems for its planning committee. Festival growth and
apparent changes in the mix of patrons (more young people} have resulted in
increasing problems regarding crowd and traffic control, sanitary
facilities, litter and trash disposal, boating congestion, and docking
facilities, to name a few obvious issues. In recent years a shift in the
overall atmosphere of the festival also seems to have occurred. Whereas
earlier celebrations were dominated by water-oriented activities, recent
events have leaned more towards a city fair-type program.
To better evaluate the festival's success and future direction, the
Harborfest Executive Co11111ittee requested that the Virginia Institute of
Marine Science (VIMS) undertake a study of the 1986 event scheduled for June
6-8. Having completed a survey of the 1979 festival (Lucy and Baker 1979),
VIMS Marine Advisory Services Program agreed to conduct a study of the 1986
celebration. The objective of the project was to provide the Committee with
basic data characterizing festival patrons, their perceptions of the event,
changes in the festival and its patrons since 1979, and overall attendance.
2
METHODOLOGY
A more in-depth survey questionnaire than that used in the earlier
study was developed with input from the Committee and several Norfolk agency
representatives. The rather lengthy patron survey questionnaire (Appendix
A) was designed to be used in personal interviews. During 1979 a very
simple, one-page survey form was made available at numerous locations
throughout the festival area for patrons to complete at their convenience.
Personal interviews were also conducted in 1979, but probably accounted for
less than 25 percent of the slightly more than one thrw,.. 'nd completed survey
forms.
In the initial planning phase of the study a preliminary goal of two
thousand patron interviews was deemed appropriate to adequately sample
festival patrons. This goal was established because festival attendance had
grown dramatically since the 1979 study when just over one thousand survey
forms were collected from the crowd. As more and more input accumulated
from the Harborfest Executive Committee and city agency representatives
regarding important issues to be addressed by the study, it became apparent
that the length and complexity of the survey instrument made the preliminary
sampling goal impossible to ach1eve. A more realistic goal of one thousand
patron interviews was set for the three day period of the festival.
Eighteen staff and graduate student volunteers from VIMS and William
and Mary's School of Business Administration were familiarized with the
survey instrument and utilized during the festival period to obtain random
patron interviews. Care was taken by each interviewer to solicit
information from a mixed group of patrons with respect to age, sex, race and
group size. Interviews were conducted Friday from 1:00 p.m. through 8:00
p.m., Saturday from 10:30 a.m. through 5:00 p.m., and Sunday from 11:30 a.m.
through 4:00 p.m. (at which time a severe storm curtailed the festival).
Nine interviewers worked Friday and Sunday with fifteen interviewers
covering Saturday's crowd. After 5:00 p.m. on Saturday afternoon the size
of the crowd and its npartyn mood escalated to the point that interview
efforts became largely impractical.
Interviewers generally worked in teams of two or three individuals with
teams assigned to cover different portions of the festival area. Festival
areas given particular attention included the Freemason Harbor area, Pier 8
{spectator fleet launch service), Kingfisher Docks, Town Point Park, Otter
Berth, in front of Waterside, Waterside Marina docks, and Hanmond Berth
(ferry service launch/disembark point) {see Appendix B).
After determining that only 200 interviews were completed on Friday
(primarily due to the complexity of the questionnaire and festival patrons'
wanting to chat with the interviewers), the interviewing strategy was
changed for Saturday and Sunday. On these days approximately each fifth
person interviewed was asked all questions while others were only asked
questions 1-2, 3-4 (if from outside the Hampton Roads area}, and 11-13
(Appendix A). These questions provided critical information on patrons'
residence, lodging arrangements, method of arriving in the festival area,
and daily expenditures. This procedure resulted in nearly 600 interviews
being completed on Saturday and 100 interviews on Sunday before the storm
abruptly ended the festival.
Difficulties were experienced in trying to obtain sufficient numbers of
interviews from boaters using the shuttle launch from the end of Pier Bin
the Freemason Harbor area. Frustrations over delays in the start-up of the
spectator fleet harbor shuttle service (due to barge problems) and the long

4
walk to and from the central festival area caused part of the difficulties.
In addition, boaters waiting for the shuttle quickly departed when it
arrived, leaving interviewers with incomplete information. As a result,
special efforts were made to obtain significant numbers of interviews from
boaters readily accessible at the Waterside Marina and Kingfisher Docks. A
dinghy was borrowed to obtain a few interviews directly from boats anchored
in the Spectator Fleet Anchorage area. These combined efforts provided an
adequate number of completed boat-party interviews.
Two methods were used to derive estimates of festival attendance. By
means of patron interviews, the proportion of festival patrons who utilized
special Harborfest shuttle buses and the expanded harbor ferry service (3
ferries) between Portsmouth and Norfolk was determined. This information
was then compared to the known counts of people using these services, as
tabulated by the Tidewater Regional Transit. Knowing both the percentage of
the festival crowd that used the shuttle services and the actual numbers of
users on a daily basis, an estimated daily attendance level could be
derived. Total attendance was obtained by sununing the daily estimates.
The second method. comparable to that used in 1979 {Lucy and Baker
1979), was based upon a random telephone survey of Virginia Beach
households. This effort yielded an estimate of the average number of
Virginia Beach residents per household who attended Harborfest '86. Knowing
the estimated number of households in Virginia Beach in 1986 {Knapp and Cox
1986), an estimated total number of festival attendees from that city was
calculated. The percentage of the festival crowd residing in Virginia
Beach, determined through festival interviews, was then compared to the
calculated Virginia Beach resident attendance to derive an estimated overall
attendance for the festival.
RESULTS
A total of 965 useable interviews were completed during the three days
of the festival, slightly under the sampling goal (the goal would have been
achieved but for the sudden storm Sunday afternoon). Of these interviews,
approximately 35% - 40% had the majority of questions completed while the
remainder had only selected questions answered (see Methodology section).
5
The transportation mode used by Harborfest patrons to arrive in the
festival area was a key concern of festival organizers. Much effort has
gone into trying to reduce traffic congestion during the festival by
providing shuttle bus and additional ferry service for festival-goers.
Private cars, however, continued to be the dominant travel mode for patrons
during each festival day (Table 1). Shuttle buses handled 23% of the
festival crowd, showing a relative increase in use from Friday to Sunday.
The Elizabeth River ferries provided approximately 8% of patrons'
transportation needs while almost 13% of those attending the event arrived
by boat. Together the two festival commuter services transported
approximately 31% of the overall festival crowd with Sunday being their most
successful day. A significant portion (11%) of the festival crowd walked to
the event on Friday, demonstrating the importance of downtown office workers
to Friday's attendance. Pedestrian problems with crossing Waterside Drive
on Friday were significantly reduced this year by closing the roadway after
the morning rush hour. When asked about continuing this practice for future
festivals, patrons overwhelmingly approved of the action.
As illustrated in Tables 3 and 4, Harborfest '86 predominately drew its
patrons from the Hampton Roads area. As a result, better than two-thirds of
the crowd required no special lodging, utilizing their homes for overnight
6
accommodations during the festival (Table 2). Boats provided 15.5% of
patrons' overnight lodging needs. Hornes of friends or relatives
accommodated 8.4% of festival patrons while over 5.4% required {or sought
the convenience of) hotel-motel accommodations. This latter group
predominately used such lodging for Friday and Saturday nights, but hotel
stays of up to four nights occurred among 14% of the group (Table SB).
Patrons' overall residential distribution reflected the strong local
attraction of the event while also indicating that a diverse mix of
Virginians and out-of-state visitors attended the festival (Table 3). The
festival was almost as popular among Virginia Beach residents (23.3% of the
crowd} as residents of the host city (27.5% of the crowd). Interestingly.
Hampton-Newport News residents accounted for 10.1% of the festival crowd in
comparison to only 7.5% for Portsmouth residents and 7.3% for the City of
Chesapeake. The relatively small contribution of Portsmouth residents to
the Norfolk festival is paralleled by the finding that only 33.1% of
Harborfest patrons visited Portsmouth's Seawall Festival. occurring
simultaneously across the harbor. The greater Richmond area contributed
5.4% to the festival's attendance with North Carolina accounting for 2.4% of
the crowd. While Virginia residents comprised approximately 89% of the
overall festival's attendance, 31 other states were also represented along
with the District of Columbia, Canada and Denmark.
Boaters' residential distribution differed somewhat from that of land
parties' {those patrons not attending the festival by boat) (Table 4).
Approximately 93% of the boating parties were from Virginia (compared to 88%
for land parties), including 16% from the combined cities of Hampton and
Newport News (Table 4). Portsmouth, Chesapeake and Richmond boaters made up

•
•
•
•
a slightly smaller proportion of total boating parties (4.9%) than these
cities' respective 7.~. 7.6% and 5.2% contributions to land-party patrons .
7
Another significant aspect of the geographical distribution of festival
patrons concerned those who visited the festival from beyond the boundaries
of Hampton Roads Metropolitan Statistical Area (Hampton Roads MSA). The
Hampton Roads MSA consists of Norfolk, Virginia Beach, Chesapeake,
Portsmouth, Suffolk, Newport News, Hampton, Poquoson, York County, James
City County, Williamsburg, and Gloucester County. From patrons' overall
residential distribution (Table 3}, it can be determined that approximately
19% of the festival crowd traveled to the event from outside the HSA. The
breakdown of festival patrons into land and boat parties revealed that
approximately 21% and 18% of these respective attendance groups resided
outside the MSA (Table 4).
In general, festival patrons residing outside the HSA ("tourist
patrons") predominantly traveled to the festival area by car {70.6%), with a
considerably lesser proportion arriving by boat (15.7%) and plane {8.5%)
{Table SA). None of these parties were in Norfolk during the festival as
part of a tour package. The majority (29.4%) of these patrons stayed in the
Norfolk area for three days with another 30.9% staying in the area for one
to two days (Table SB). Visits of one to two weeks were planned by 18.4% of
these patrons.
A large proportion of festival tourist patrons (59%) stipulated that
Harborfest was their primary reason for visiting the Norfolk area, followed
by being on vacation in the area (Table 6A). Separating out the responses
of tourist patrons not visiting the area primarily for the festival
indicated the strong ranking of vacations {81%} as a reason for visiting the
area, followed by business and convention trips (Table 68). Almost half

8
(44%) of the tourist patrons not in the area primarily for Harborfest
indicated that they, nevertheless, tried to plan their Norfolk visit around
the festival.
To evaluate the effectiveness of the festival's publicity campaign,
patrons were asked how they learned about the festival. Since many patrons
learned about the festival through several media sources or other means of
communication, both multiple responses and weighted responses were tabulated
(Table 7). Both analyses revealed that word of mouth was the best festival
advertisement mechanism. Also ranking near the top of the list was the fact
that by simply living in the vicinity of the festival site, many patrons
knew of the upcoming event via this association. Television, radio and
newspaper advertisements, as well as news coverage, ranked high as major
sources of knowledge about the festival. These media sources were
frequently mentioned in various combinations with one another.
That "word of mouth" proved to be the principal means by which patrons
learned of the festival indicated previous attendees liked what they
experienced at the event. Favorite activities of Harborfest '86 patrons, as
expected, varied from day to day (Table 8). On Friday, ships, food, and
music were the top-rated activities, in that order. On Saturday, ships and
music were equally ranked first with food in second place and the fireworks
third. On Sunday, following the very impressive Saturday night fireworks,
this activity was the clear favorite of the crowd followed, in order, by
music and ships. For the festival overall, the order of favorite activities
was ships, music, food, fireworks, and water events. If one considers ships
and boats on display or open for visitation as part of water events, this
general activity category would be the highest ranking favorite of festival
•
•
•
•
•
•
•
•
•
•
•
patrons on Friday, Saturday, and for the festival overall. On Sunday it
would have ranked third behind fireworks and music .
In taking the favorite activity question a bit further, patrons were
also asked to indicate their second overall favorite activity. For the
festival as a whole, patrons indicated their top three, "second~favorite"
activities to be food/beverages, music/entertainment, and ships/parade of
sail/boats, in that order.
9
By weighting the top five activities in each of the two "favorite"
categories by their respective rank in each group, and secondly, by a factor
denoting whether the ranking was from the "most favorite" or the "second
favorite" group, an overall popularity index was calculated for each
activity (Table 9). Using this weighted comparison, ships/boats again
proved to be the most popular festival activity followed by
music/entertainment, food/beverages, fireworks, people watching, and water
events in general. By comparing the summed popularity index of ships/boats
to that for fireworks, it can be shown, on a relative basis, that ships and
boats ranked better than four times higher in popularity than fireworks
(1.335/0.286 4.7). Again, if one considers ship and boat activities to
fall under the general water events category, water events proved to be the
overall favorite activity of festival patrons.
In addition to determining patrons' favorite festival activities,
patrons' disappointments with the celebration were recorded and summarized
(Table 10). Information on festival problems was collected through two
slightly different survey questions asked at different times during the
interview process. After determining patrons' favorite activities, they
were asked if anything about the festival disappointed them {Question 8.
Appendix A). Several interview questions later, patrons were asked about

10
overall changes in festival quality and whether they would like to see any
one aspect of the festival changed {Question lOb, Appendix A).
A significant proportion of patrons indicated that they had no problems
with any aspect of the festival. Approximately 52% stated there was nothing
that had disappointed them and 26% wanted nothing changed. Rainy weather on
Saturday elicited the greatest "disappointed" response (7.5%) followed by
the festival being too crowded (6.1%). Restrooms, docking facilities,
parking, music problems, and high prices each received between 2. 7% - 3. 5%
of the "disappointed" response. Lower ranked problems are also listed in
Table 10.
A different ranking of problems resulted from asking patrons about
festival elements they would like changed. Crowd congestion ranked highest
(8.4%) among the "want changed" responses, fallowed by music (7.9%), high
prices (6.3%}, restrooms (5.3%}, parking (5.3%), and more daytime activities
far kids and adults (4.7%). Music problems mentioned in both questions
genera 11 y related to poor sound, patrons' not finding a favorite group, the
location of a given stage, patrons' not being able to see performers, or not
enough of a particular kind of music being offered. The other problem
categories are largely self-explanatory.
One particular problem that has always concerned festival organizers
and city officials is litter control. litter problems, however, elicited
only a slight response (0.6%) from patrons in the question about festival
disappointments (Table 10}. A specific question about 1 itter control
{Question 9a, Appendix A) indicated that 96% of the patrons rated the effort
as Ngood" for each day of the festival (Table 11). Another aspect of the
litter question concerned the need for more trash receptacles. The daily
response to this question varied consistently, with the highest "yesR
•
•
•
•
•
•
•
•
•
•
•
response (24.3%) being on Friday and the lowest (8.5%) on Sunday. The
majority of patrons specified no need for more receptacles .
II
In association with interview questions about possible festival
problems, patrons who had attended the festival previously were asked to
rank the event's quality. Responses varied daily with a majority of patrons
indicating that quality had improved (Table 12). A significant proportion
of the crowd felt that quality of the festival had remained unchanged.
Saturday's crowd gave festival quality the best ranking while Sunday's
patrons ranked it lowest. The combined responses on quality indicated that
approximately 71% of the patrons felt it had improved, 23% stated it was
unchanged, and 6% said it had declined .
As part of its evaluation of festival problems and successes, the
Harborfest Committee was also interested in some measure of the festival's
ability to bring patrons back to the waterfront celebration year after year .
Patrons' attendance record for previous festivals revealed that 78.4% of the
crowd had attended the event at least once prior to 1986, with a
corresponding 21.0% of the crowd being first~time patrons (Table 13A}.
Approximately 39% of the festival-goers had attended one to four festivals
with a like proportion of the crowd indicating five to nine years of
Harborfest experience. Veterans of all ten festivals accounted for 22.3% of
the 1986 attendees .
Patrons' plans for attending future festivals were examined regarding
continuing waterfront development possibly restricting open space currently
used for Harborfest activities. Areas adjacent to the Waterside Festival
Marketplace, Kingfisher Docks and Freemason Harbor, for example, are likely
to experience new construction (Appendix 8). Without referencing any
specific development project, patrons were asked to rate their feelings
12
about attending future festivals, if the event was moved away from the
waterfront into closed-off streets of the financial district behind Town
Point Park (Question 9c, Appendix A}. Answers to the question were
partitioned among definite and probable responses (Table l3B). A majority
(58.1%) of those asked the question stated that they would definitely not
attend the event if it were moved off the waterfront. An additional 23.3%
indicated that they would probably not attend the festival under this
scenario. Therefore, approximately 81% of the responses were negative with
19% being positive (only 2.8% of the total responses were a ffdef1nite yes"}.
The 1986 festival's pattern of attendance indicated that a majority
(30.7%) of land parties attended only Saturday with another 20.5% spending
some part of Friday through Sunday at the event (Table 14). Those who
attended the festival two of its three days were nearly equally divided
between Friday-Saturday and Saturday-Sunday day combinations. Boating
parties exhibited a quite different pattern of attendance. Three day visits
(Friday-Sunday) were made by 78% of boaters with an additional 10% staying
only two days (Saturday and Sunday). The overall attendance pattern (land
and boat parties combined) exhibited equal portions of the crowd attending
"only Saturday" and "Friday through Sunday." Examining the attendance
pattern another way, it was shown that, overall, 42.4% of patrons attended
the festival one day (Friday, Saturday or Sunday). The remainder of the
crowd was almost equally divided between two day (29.7%) and three day
(27 .9%) visits.
Festival organizers desired something of a sociological profile of
festival patrons, e.g. their martial status, whether they attended the
festival alone or in groups, their age distribution, and the ages of
children attending the event. Patrons were evenly divided between being

•
•
•
•
•
•
•
•
•
•
•
married and single; approximately 471 of patrons attended the event with
friends and 34% with family members, while nearly 19% were 1n mixed groups
of family and friends (Table 15).
13
Unfortunately. the survey question addressing composition of patron
groups did not clearly specify whether persons not with family or friends
were actually alone. A measure of this situation, however, was obtained by
determining the distribution of numbers of individuals in the •groups"
interviewed. This data (Table 15) indicated that "groups" of one individual
accounted for 8% of the festival crowd. A more precise distribution of
patrons, according to whether they were alone, with family, friends, or
family and friends, could be obtained by factoring the 8% "alone" category
into the calculated frequency distribution.
The dominant group size for patrons was two persons (32.8%) with groups
of three and four persons each accounting for approximately 16%-17% of the
crowd. Groups ranging in size from one to four persons cumulatively
accounted for approximately 75% of the festival crowd. Groups ranging from
8-10 persons, and even up to 50 persons, were also encountered during the
survey.
The age distribution of patrons indicated that approximately 40% of the
crowd was 21-30 years of age followed by 31-40 year olds (28%) and 41-50
year olds (15%) (Table 15). An additional 9% of the crowd fell into the 51-
70 year old age bracket while those twenty and under accounted for about 8%.
Children accompanied approximately 27% of festival patrons with the
children's ages being fairly evenly distributed (Table 16). The age
distribution of children accompanying festival patrons was: 1-5 year olds
(30.7%); 6-10 year olds (31.1%); 11-15 year olds (31.7%); and 16-18 year

14
olds (5.6%). These children's average age was approximately nine years old.
Only 5.9% of the crowd stated that they had left children at home.
Estimating attendance at festivals is difficult when, as with
Harborfest, access to the festival area is largely non-restricted and
attendance is free (non-ticketed). Two methods were utilized to establish
overall attendance estimates (land and boat parties combined). In Table
17A, the proportion of the festival crowd determined to have used shuttle
buses and harbor ferries to reach the festival area {tabulated from
interview data) was compared to the actual number of such shuttle service
users (tabulated from ticket sales by Tidewater Regional Transit). Since
these two quantities were known for each festival day, daily festival
attendance could be calculated. For example, Friday's attendance was
derived by the following calculation: (0.286) x (Attendance}• 23,047 SB/F
riders. Solving the equation for "AttendanceM, Friday's crowd was estimated
to be 23,047/0.286 or 80,584 persons. The same procedure was followed for
the remaining festival days, resulting in a total estimated festival
attendance of 305,214. Therefore, Friday accounted for 26.4% of total
attendance with Saturday contributing 54.5% and Sunday 19.1%.
To insure that the attendance estimate for the 1986 festival could be
compared to that derived for the 1979 event, a second attendance analysis
was made (Table l7B). As in the 1979 study, a random telephone survey was
conducted of Virginia Beach households to determine the average number of
persons per household attending the festival. Over three hundred random
telephone calls yielded 143 usable responses. This compared to 141
responses for a comparable telephone effort in 1979 (Lucy and Baker 1979).
The telephone survey indicated that an average of 0.81 person per household
attended the festival from Virginia Beach. Using this information to
•
•
•
•
•
•
•
•
•
•
•
15
estimate the total number of Virginia Beach residents attending the
festival, one could then compare the latter figure to the proportion of the
festival crowd from Virginia Beach {determined from festival interviews} to
calculate overall Harborfest attendance. This analysis placed estimated
total festival attendance at 385,725. More confidence was placed in this
second estimate of festival attendance, largely because restricted interview
time on Saturday could have biased the shuttle bus/ferry ridership
percentage data used to calculate attendance in Table 17A. The rationale
for this decision will be explained further in the Discussion section.
A significant proportion of festival patrons (12.8%) attended the event
by boat. Some of the characteristics of boat-party patrons, compared to the
much larger group of land parties, have already been described; additional
features of boating patrons are indicated in Table 18. As stated previously
in the Methodology section, a special effort was made to interview patrons
on boats moored at festival docking areas because of problems catching up
with boaters anchored out in the spectator fleet. This means that the boat
party sample is biased somewhat towards these boats. Keeping this in mind,
the boating sample indicated that 78% of the boat parties visited the
festival aboard sailboats and 22% aboard power boats. The boating sample
was distributed essentially evenly between boats berthed at Waterside Marina
(37.4%) and Kingfisher Docks {38.2%) while the remaining 24.4% of the boats
were moored in the spectator fleet anchorage.
Total boat attendance at the festival was estimated from a combination
of boat counts and observations from personnel in Norfolk's dockmaster's
office and with Shawn's Launch Service {operator of spectator fleet launch
service). Boat attendance was placed at 2,183 boats for the entire fe>tiva1

16
period (Table 19) with almost two to three times as many boats in the
spectator fleet on Saturday as compared to either Friday or Sunday.
Daily expenditure estimates were determined for patrons for items such
as food and beverages, souvenirs, lodging, etc. {Table 20). Average daily
expenditures per group were calculated for all patrons interviewed. This
amount was divided by the average number of persons per group to obtain
average daily expenditures per person (Lucy and Baker 1979). Patrons'
expenditures were determined relative to those occurring within the
immediate festival area, adjacent to the festival area and within the
greater Norfolk/Hampton Roads area (as long as expenses were related to the
festival visit).
Total expenditures were first estimated for all festival patrons
without regard to whether they attended the event by land or water (Table
21). Before being analyzed, expenditure data from interviews were converted
into estimated total daily group expenses. This prevented having to
disregard data sets in which patrons only provided total daily expenses
rather than breaking expenses down into preferred sub-categories. Where
expense data were recorded in the desired categories, they were combined to
provide a total daily expense estimate.
Average group expenditures were calculated for total daily expenses and
expense sub-categories of food/beverage, meals, souvenirs, lodging, parking,
entertainment, shopping, and groceries {boaters and campers) (Question 13,
Appendix A). Because relatively few expenses were made in the two ~expense
areas II outside the immediate fest; va 1 area, on 1 y total expenses are
presented for these expense zones. For all expense zones, average daily
group expenses were divided by the overall average group size (3.9 persons)
to derive average daily expenses per person (Table 20). In the festival
•
•
•
•
•
•
•
•
•
•
•
17
area total daily expenses per person were $11.25. E~amining the breakdown
of expenses, where such data were provided, revealed that nearly 75% of
patrons• daily expenditures were devoted to food and beverages and 15% to
souvenirs, with lodging and miscellaneous expenses accounting for the
remainder of daily costs. Food and lodging accounted for the majority of
expenses outside the immediate festival area. Combining data for the three
expenditure zones provided a grand total overall daily spending estimate per
person of $13.61 .
Total daily expenditure data from Table 20 were combined with data on
patrons' pattern of festival visitation and estimated overall festival
attendance to provide estimated total daily expenditures for each of the
previously described spending zones {Table 21). Total direct expenditures
by festival patrons in the Greater Hampton Roads area were estimated at $9.7
million of which $8.0 million was spent in the immediate festival area .
Because of the land-party/boat-party dichotomy in the festival crowd,
and the fact that boating parties might have slightly different spending
patterns than land parties (e.g. provisioning their boat for the entire
festival weekend), land-party expenditures were broken out of the total
expense data picture (Tables 22 and 23). Calculated in the same manner
described for all festival patrons, total land-party expenditures were
estimated at $8.4 million. The respective contributions of land and boat
parties to the overall patron spending pattern indicate that the latter
group made proportionately less of their total expenditures in the area
adjacent to the festival and more of their expenditures in the Greater
Hampton Roads area (Table 24). A general comparison between average daily
expenditure patterns of the two groups can be obtained by examining Tables
11 and 15 .
18
DISCUSSION
The sampling effort for the study, while producing fewer patron
interviews than initially planned, was adequate to define festival
parameters and patron characteristics of interest to the Harborfest
Executive Committee. The benefits of the more detailed survey questionnaire
largely outweighed problems associated with reduced numbers of interviews.
The change in interviewing strategy on Saturday and Sunday, following a
careful review of Friday's completed survey forms, maximized the information
collected by the volunteer survey team.
To provide some perspective to the sampling effort, a study of Rhode
Island's Tall Ships '76 Celebration, conducted by the University of Rhode
Island in the Newport Harbor area, was accomplished using a patron sampling
team of something over fourteen interviewers per day (Della Bitta gt Al_.
1977). This survey team completed approximately 3,600 interviews over the
eight day celebration, equivalent to a three-day total of 1,350 interviews
{3/8 x 3,600); the Harborfest survey team completed 965 useable interviews
over a three day period. Estimated attendance at the Rhode Island
celebration was 717,400 compared to Harborfest's estimated attendance of
385,725.
Harborfest patrons' transportation use pattern demonstrated the
importance of the shuttle bus system. Tidewater Regional Transit tabulated
that Harborfest shuttle buses transported nearly 56,000 festival-goers
during the three day celebration. From survey interviews it was determined
that the average size of land-party arrivals at the festival was 3.7
persons. Assuming that one car would have been required to transport such a
land-party, it can be seen that a potential additional burden of

•
•
•
•
•
•
•
•
•
•
•
approximately 15,000 cars (56,000/3.7) could have been placed on downtown
streets and parking lots if the buses were not available.
19
In comparing the number of shuttle bus riders estimated by TRT to the
estimated festival attendance, the proportion of the crowd utilizing this
service was approximately 14%, rather than 23% determined from interviews .
The difference indicates that shuttle bus use rates, relative to crowd size,
declined during both Friday and Saturday evenings after interviewing ceased.
This is highly possible, considering the likelihood that patrons are more
comfortable using the buses when return trips to satellite parking areas
occur during less congested, daylight hours rather than late evening
periods .
The fact that a significant number of patrons choose to attend the
festival by boat also helped alleviate vehicular traffic congestion in the
downtown area. The addition of a third ferry boat to the two existing
commuter ferries helped this water shuttle service handle approximately
38,900 festival patrons, potentially equivalent to an additional 10,500 cars
that could have tried to get into the downtown area .
The apparent relative decline in ferry use from Friday to Sunday may
have been due to the service's becoming quickly saturated, as indicated by
the number of complaints heard by interviewers about the long waits in line
for the boats. These pedestrian festival patrons, along with others who
have obviously had past difficulties with vehicular traffic on Friday along
Waterside Drive, responded very positively to the roadway being closed to
traffic after the Friday morning rush hour .
Comparing the TRT estimate of ferry ridership to estimated festival
attendance indicated that approximately 10% of the crowd utilized this n'.ec.'.s
of transportation, a slightly higher ridership rate than determined 1.hrc,uai·

20
interviews (8.2%). This might be attributed to regular ferry users,
convnuting to work on Friday, being interviewed at the festival and counted
as having walked to the festival rather than arriving by ferry. If such
individuals were included in TRT's festival, ferry ridership figures, either
when arriving on the Norfolk side in the morning or departing for Portsmouth
in the evening, this would account for the discrepancy in overall ridership
estimates.
The geographical distribution of patrons at the 1986 festival changed
significantly from that of the 1979 celebration (Table 26). Foremost was
the relative reduction in out-of-state visitors during 1986 (11.5%) compared
to 1979 (17.9%). This change was most dramatic among the boating element of
the festival (Table 27); however, a more rigorous interview effort among
boaters in the spectator fleet anchorage might have resulted in a more
balanced distribution pattern.
The relative decline in out-of-state attendance for the festival means
that a stronger appeal for the event has developed among local conmunities.
This was demonstrated by a relative 1986 increase in patron contributions
from the cities of Virginia Beach (1.4%), Hampton-Newport News (2.6%),
Portsmouth (2.5%), Chesapeake (1.7%) and the Richmond area (5.4%).
Interestingly, there was a slight decline (-1.7%) in the relative makeup of
the crowd from Norfolk. Corresponding to the relative increase in
attendance from Virginia cities, there was a slight decline in relative
attendance from major states outside Virginia contributing patrons to the
1986 and 1979 festivals (with the exception of the District of Columbia).
As boaters• ranks showed the greatest relative decline among out-of
state members in 1986 compared to 1979, they likewise showed the greatest
relative increase in patrons from Virginia cities, especially Virginia Beach
•
•
•
•
•
•
•
•
•
•
•
(11.3%), Hampton-Newport News (10.4%) and Richmond (4.9'1;), The only
Virginia conrnunities exhibiting relative decreases in contributions to the
boating portion of Harborfest patrons were Portsmouth (-1.0I) and York
County-Poquoson (-5.5%).
21
For festival patrons attending the event from outside the Hampton Roads
MSA, the festival appears to be a significant factor in simply attracting
these individuals to the Norfolk area. Among these "tourist• patrons, 59%
indicated they were in Norfolk primarily for the festival. More
importantly, however, was the fact that the remaining tourist patrons, while
not in the Norfolk area primarily for the festival, had a significant
proportion (44%) of their ranks indicate that their vacation trip, business
trip, or convention activity was planned around the festival. Therefore the
festival can be considered a significant tourist attraction for Norfolk in
spite of apparently losing some of its appeal for out-of-state visitors
(compared to the 1979 celebration).
The publicity effort for the festival has traditionally been
comprehensive and of good quality. The festival's popularity throughout the
Hampton Roads area is demonstrated by the fact that "word-of-mouth"
advertising was most often mentioned by patrons as the way they learned
about the 1986 event. Television, utilizing both advertisements and news
coverage, ranked second in importance as the publicity effort capturing most
patrons' attention. With more and more people choosing to live in the
general downtown waterfront area~ their proximity to the festival site also
ranked high in drawing their attention to the celebration .
Patrons' response to publicity efforts in 1986 differed significantly
from the response in 1979 (Table 28). Word of mouth publicity only ranked
fourth in importance among major, distinctive publicity efforts in 1979,
22
compared to its first place ranking in 1986. In 1979 newspaper publicity
caught the greatest proportion of patrons' attention. Television ranked in
second place for both years, while radio was more important in 1979 (third
place) than in 1986 (fourth place). Differences in patrons' responses to
the publicity campaigns in 1986 and 1979 appear to reflect obvious changes
in the longevity and popularity of the festival, changes in the residential
component of the downtown area, and people's infatuation with television.
Knowing festival activity preferences of patrons helps the Harborfest
Committee in its annual struggle to provide the right mix of activities to
keep patrons happy and to keep them coming back year after year. The
previous discussion on the role word-of-mouth advertising plays in getting
people's attention focused on the event indicates that the Committee has
done a good job over the years in the progranmed activities area.
Activities allowing patrons close contact with ships and boats continue to
rank number one among people's favorite events at Harborfest, as was the
case in 1979 (Table 29). Since ship and boat activities fall under the
general category of water events, this broad activity category ranks as the
top favorite among festival visitors. Any question as to the significance
of ship and boat activities is resolved by their activity popularity index
ranking in Table 9.
In light of the strong preference for ship and boat activities, it is
interesting to note the change that has occurred in progranvned festival
events since 1979 (Table 30). At that time total water events accounted for
almost 38% of all major festival events. In 1986, while the relative
proportion of ships open for visitation remained about the same, such was
not the case for participatory and viewing-only water events. These dropped
dramatically in relative significance to the overall number of activities,
•
•
•
•
•
•
•
•
•
•
•
23
reducing total water events to 15% of the festival program. The festival
obviously remains very popular, in spite of its shift in emphasis away from
water events and more towards bands, singers and other stage events. But it
would seem that careful consideration should be given to these changes in
light of the preferential ranking indicated for water-related activities .
Ships and boats are one of the unique features of waterfront festivals
that cannot be similarly enjoyed by people attending land-oriented
celebrations. Urbanna, Virginia's Oyster Festival, for example, while
celebrating seafood, has its principal activities all occurring inland from
the waterfront, largely because of the town's layout. A study of the
conrnunity's 1979 festival indicted that food, by far, was the most desirable
(favorite) feature of the event, accounting for 70% of the overall patron
response {Lucy and Vance 1982,. While patrons• boats were moored at town
marinas or out in the creek on which the town is located, no ships or boats
were on display or open for visitation. Since the 1979 festival, Urbanna
has regularly incorporated several ~tall shipsn into its festival making
special arrangements for visitation aboard such vessels at private
conrnercial docks. This capability is one of the strongest features of
Norfolk's festival.
A further examination of patrons' responses to the question of favorite
festival activities indicates that, while music ranked second in 1986, it
was third in preference in 1979. Food, third in the 1986 ranking, ranked
fifth in the earlier festival. Fireworks rose to fourth place in 1986
compared to its fifth place ranking in 1979. Water events, as a specified
favorite activity exclusive of ships and boats, actually dropped to fifth
place in the 1986 ranking compared to third place in 1979. All in all, the
same major activities were specified as patrons' favorites during both
24
festivals, with only slight shifts occurring in their ranking. A more even
ranking of favorite festival activities was observed in 1986 compared to
1979; food, music and fireworks captured significantly larger proportions of
patrons' responses in 1986 than in 1979.
Of equal or possibly greater value to festival organizers than knowing
what people like about the event is constructive input from patrons on
aspects of the celebration that proved to be a source of disappointment or
frustration. People tend to view such activities from either the
perspective of "I was disappointed in that" or "they should change that."
Therefore, patrons were asked both types of questions, with the results
providing two viewpoints from which the Harborfest Committee can evaluate
festival problems. In examining the results of these interview questions in
Table IO, one must realize that, in many instances, only two or three
individual patrons mentioned a particular problem (approximately a 1% or
smaller relative frequency). Infrequently mentioned problems were included
in the Table primarily for the additional insight that might be provided
organizers of future festivals.
The growth experienced by the festival since 1979, and its associated
increase in organizational and scheduling problems, has not resulted in a
dramatic increase in criticism of the festival. A comparison of major
criticisms noted by festival patrons in 1986 and 1979 shows the reverse
trend (Table 31). Approximately 52% of 1986 patrons stated that nothing
disappointed them about the festival compared to only 39% in 1979. Parking,
the highest ranking problem in 1979, dropped to seventh in 1986. Without
the shuttle buses and increased ferry service, this problem likely would
have ranked considerably higher in 1986.
•
•
•
•
•
•
•
•
•
•
•
25
Among problems colllllOn to both festivals, commercialization-high prices
moved from a relatively low ranking of seventh place 1n 1979 to the top
problem spot in 1986, discounting the non-controllable problem of weather.
This same problem ranked third among things 1986 patrons wanted to see
changed (Table 10). Crowd congestion and associated problems such as long
lines remained high in the ranking of problems for 1986, being third
compared to its second place ranking in 1979 (Table 31). Crowding ranked
first among those things 1986 patrons wanted to see changed or improved
(Table 10). Numbers of toilet facilities, their distribution, and
condition, ranked fourth in ~ajar problems for both festivals. The need for
more food and drink, and better distribution of such items throughout the
festival area, ranked fifth in both 1986 and 1979.
Litter proved not to be a major concern of patrons, being mentioned
only by 0.6% of those interviewed in 1986 (Table 10)- Neither was it a
significant problem in 1979; the •condition of grounds• feature listed as a
problem for the 1979 festival (Table 31) referred to the need for
landscaping along the waterfront, not litter problems. In reference to the
1986 festival question rating the litter control program, patrons did
mention numerous times that, while the program was good, more frequent
dumping of trash containers was needed. This general suggestion contrasts
with the results of the survey concerning the need for more trash
receptacles {Table 11). Better than three-fourths of those interviewed each
day stated that they felt no additional receptacles were needed, and the
response grew stronger through the weekend. It must be assumed that patrons
want existing trash receptacles emptied more often, not more trash
receptacles marring the appearance of the waterfront .

26
The handling of litter, and other problems previously discussed, helps
mold feelings about the overall quality of the festival. Considering survey
responses on the issue of festival quality, no distinctive daily pattern was
observed except that Sunday's patrons included a somewhat larger component
of persons who felt overall quality had either remained unchanged or
declined (Table 12). If more persons had been interviewed on Sunday, the
results might have been more definitive (33 interviews included responses to
the question compared to well over 100 interviews each of the other two
days). There is no obvious reason why Sunday's patrons felt more negatively
about festival quality than those interviewed on previous days. Perhaps the
novelty of the festival had somewhat worn off for these patrons or they were
negatively affected by some of the crowd congestion problems of Saturday
night. Considering all festival interviews, patrons generally specified
that festival quality had improved.
Harborfest demonstrates a strong capability for bringing patrons back
to the celebration, not just once, but numerous times. Approximately 78% of
the patrons had attended at least one previous festival. This is a
relatively high return rate. For the ninth annual Three Rivers Festival in
Fort Wayne, Indiana, 62% of day visitors had attended previous ·festivals and
35% of overnight visitors had attended before (Reinchert and Lovell-Troy
1978). While the same type of information on return visitors was not sought
in the Urbanna, Virginia Oyster Festival study (Lucy and Vance 1982),
patrons were asked if they planned to return to the event. Approximately,
91% indicated they would return. One would have to assume that not all of
these patrons actually carried through on their commitment for the
festival's twenty-third annual celebration in 1980. Assuming that 75% of
them did return, the overall patron return rate for 1980 would have been 68%
•
•
•
•
•
•
•
•
•
•
•
27
(0.9lx0.75); if 87% returned, the overall rate would have been 78':.
Therefore Harborfest demonstrated a relatively strong patron return rate in
comparison to the Indiana event (167,000 attendance) and the small-town
Urbanna festival (20,900 attendance).
If continued development along Norfolk's waterfront ultimately forces
the festival away from the water, the only positive result might be solution
of the crowd congestion problem. With 58% of patrons stating they
definitely would not attend the festival in the future if it were not on the
waterfront, and another 23% indicating they probably would not attend, crowd
size could be reduced 81%. The strong message conveyed on this issue goes
back to activity preferences expressed by patrons. The water events {ships,
boats, etc.} are what patrons predominantly come to the festival to enjoy.
Without these elements patrons might just as well attend a local carnival or
fair .
Daily attendance patterns of festival patrons indicated significant
differences between the habits of land parties and boat parties (Table 14).
Overall, strong preferences were observed for patrons either attending all
days of the festival or only Saturday, each situation accounting for over
27% of the crowd. Boat parties largely attended the entire event,
exhibiting an average visit of 2.6 days, compared to land parties' average
visit of 1.7 days. Compared to 1979's festival, boat parties• had not
changed in their length of stay at the event; land parties, however,
exhibited a longer average stay in 1986 (1.7 days versus 1.2 days in 1979).
The profile of festival patrons relative to their marital status, age,
etc. supported the concept that Harborfest remains a family-oriented event
(Table 15). Half of the crowd was married, only slightly lower than the
married-single ratio (55%:45%) for the Hampton Roads MSA (1980 Census, Debra
28
Oar, personal communication). One third of the patrons attended the
festival with family, and over a quarter of the patron groups were
accompanied by children, whose average age was nine years old (Table 16}.
There was no indication of infants or younger children being left at home by
families (only 5.9% of patrons left any children at home). Patrons 21 to 30
years of age accounted for approximately 40~ of the crowd with patrons 31 to
50 years of age contributing another 42%. These percentages are typical for
daytime festival attendance only and do not represent late evening
attendance, when interviewing was impractical. Interviewer observations
indicated that a greater percentage of young people attended the festival
during evening hours, compared to daytime attendance patterns.
Attendance estimates for the 1986 festival differed for the two
techniques utilized. Basing daily attendance on the estimated daily use of
shuttle buses and harbor ferries resulted in a lower attendance estimate
than the random telephone survey technique. The latter, larger estimaie was
preferred in the study because the random telephone survey sampled patrons
who attended the festival during evening hours on Friday (after 8:00 p.m.}
and Saturday (after 5:00 p.m.), after which times crowd size prohibited on
site interviewing.
Any change in the crowd's pattern of shuttle bus-ferry ridership that
might have occurred after these times was not reflected in patron
interviews. If the proportion of the crowd using the combined shuttle
services increased during these periods compared to daytime usage, daily
attendance estimates for Friday and Saturday would have declined while the
opposite would have occurred if the rate of patron usage dropped {the latter
may have been the case for shuttle bus usage, as discussed previously).
This situation results because the total ridership for the two shuttle

•
•
•
•
•
•
•
•
•
•
•
29
services, a fixed number, was used in calculating daily estimated
attendance. In addition to the telephone survey method better representing
attendance during both daytime and evening periods, the method made the 1986
attendance more readily comparable to the 1979 attendance estimate, derived
using the same technique .
The 1986 festival's attendance of approximately 385,700 persons is more
than double the 184,700 figure for the 1979 festival (Lucy and Saker 1979).
Attendance for 1986 may have been somewhat Tower than for festivals of
recent years due to the inclement weather experienced on Saturday, normally
the event's biggest crowd day. Saturday's rainfall, mostly 1n the form of a
drizzle, was not so much the problem as the day's weather forecast. In
addition to the chance of afternoon thunderstorms increasing from 30% on
Friday to 40% on Saturday, regional forecasts on Friday and Saturday also
included mention of the formation of a low pressure system off South
Carolina. By early Saturday morning the low had been upgraded to Tropical
Storm Andrew, and chances were good that it could bring fairly heavy rains
to southeastern Virginia most of Saturday (Terry Ritter and Sam HcCown,
personal conmunication). Fortunately for the festival, the storm stayed off
the coast and the weather cleared late Saturday afternoon. The threat of
significant rainfall and wind, in addition to the daytime drizzle, could
have discouraged many potential festival patrons from attending Saturday's
daytime activities.
Significant expenditures were made in downtown Norfolk by festival
patrons. Over $8 million was estimated to have been spent directly in the
festival area, which included the restaurants of Waterside and the Omni
International Hotel as well as Waterside's festival market shops. Overall
average daily boat•party expenditures of $15.26 per person (Table 25) may
30
appear to be slightly higher than corresponding land-party expenditures of
$13. 05 (Tab le 22); however, the means by wh 1 ch the daily per person average
expenditures were calculated prohibited statistical comparisons. It is not
possible, therefore, to conclude that boaters, on the average, spent more
per person at the festival than land-party patrons.
By making 82.7% of their expenditures in the festival area itself,
patrons' spending most directly impacted vendors, civic groups and other
concessionaires participating in the festival, in addition to merchants and
restaurant operators at Waterside and the Omni International Hotel. There
was some additional impact of patrons' spending on the greater Norfolk and
Hampton Roads areas, since 10.9% of overall festival-related expenditures
occurred in this general area. away from the downtown festival grounds.
While little work has been done in Virginia to detennine tourist
expenditure multipliers (Lucy and Baker, 1979), there is a special tourist
dollar impact associated with Harborfest. Such a multiplier effect would
apply specifically to expenditures made by those festival patrons coming
from outside the local economy area, considered here to be the Hampton Roads
MSA. Based upon the residential distribution of festival patrons, 19.4% of
festival-related expenditures represent tourist expenditures. The
equivalent dollar amount of such expenditures would be approximately
$1,889,191 (0.194 x $9,738,100). An appropriate tourist expenditure
multiplier to apply to these expenditures is 1.25 (Archer and Owen 1971).
This multiplier implies that for every dollar of tourist expenditures, an
additional $.25 of expenditures is generated within the local economy (Lucy
and Baker 1979). Total estimated local expenditures resulting from
tourists' spending would therefore equal approximately $2,361,SOO
($1,889,191 x 1.25). Therefore the total economic contribution of tourists

•
•
•
•
•
•
•
•
•
•
•
31
exceeds direct tourist expenditures by approximately $472,300. As a result,
total direct expenditures associated with the 1986 festival equal direct
patron expenditures ($9,738,100) plus the tourist multiplier effect
($472,300) for a grand total of $10,210,400. To determine the net economic
benefit of the festival to the Hampton Roads area, the actual costs of
putting on the event would have to be deducted from total expenditures;
however, assessing such costs was beyond the scope of this study .
CONCLUSIONS
The analysis of the 1986 tenth anniversary Harborfest celebration
demonstrated that, while changing over the years, the festival remains
extremely popular and continues to contribute significantly to Norfolk, its
successful waterfront revitalization movement and to the greater Hampton
Roads area. Problems associated with the festival's growth are constantly
being evaluated and concerted efforts being made to improve the event for
the maximum benefit of the region's citizens. Water events, in particular
ship and boat activities, have experienced a relative decline in their
overall contribution to the formal festival program. Festival patrons'
strong preference for such events warrants organizers' consideration. By
attracting a more local crowd and emphasizing a family style program, the
festival contributes significantly to Norfolk Festevents' goal of providing
activities on the downtown waterfront that are of maximum benefit to such
groups .
With its tenth anniversary now past, ttarborfest faces a number of
pressures to maintain its progress and success. The energy and
conscientious attitude of the festival's Executive Committee, and its
32
hundreds of volunteers, should enable the event to maintain its positive,
leadership role in the continued revitalization of Hampton Roads urban
waterfronts. The results of this study, while of most direct benefit to
Harborfest organizers and the City of Norfolk, also can be utilized by other
con111unities in assessing similar events.

• 33
Table I. Arrival Mode of Harborfest Patrons.
• Bil &!ii YI ECtQUID~Y* Arrival Mode Fr1dax Saturday Sunday All DaYS Private Car 50.7% 43.6" 51.4" 46.6"
• Shuttle Bus 19.7 22.9 27 .I 23.0
Boat 6.9 15.9 9.6 12.8
Ferry 8.9 8.8 5.6 8.2
Wal king 11.3 5.2 5.1 6.5 • Ship 0.5 1.6 0.6 I. I
Bus (not shuttle) 0 1.4 0 0.8
Bicycle 0 0.3 0.6 0.3
• Motorcycle 0.5 0.3 0 0.3
Cab 1.5 0 0 0.3
----------------------------------------------------------------------• No. of Interviews 203 580 177 960
•
•
•
•
•
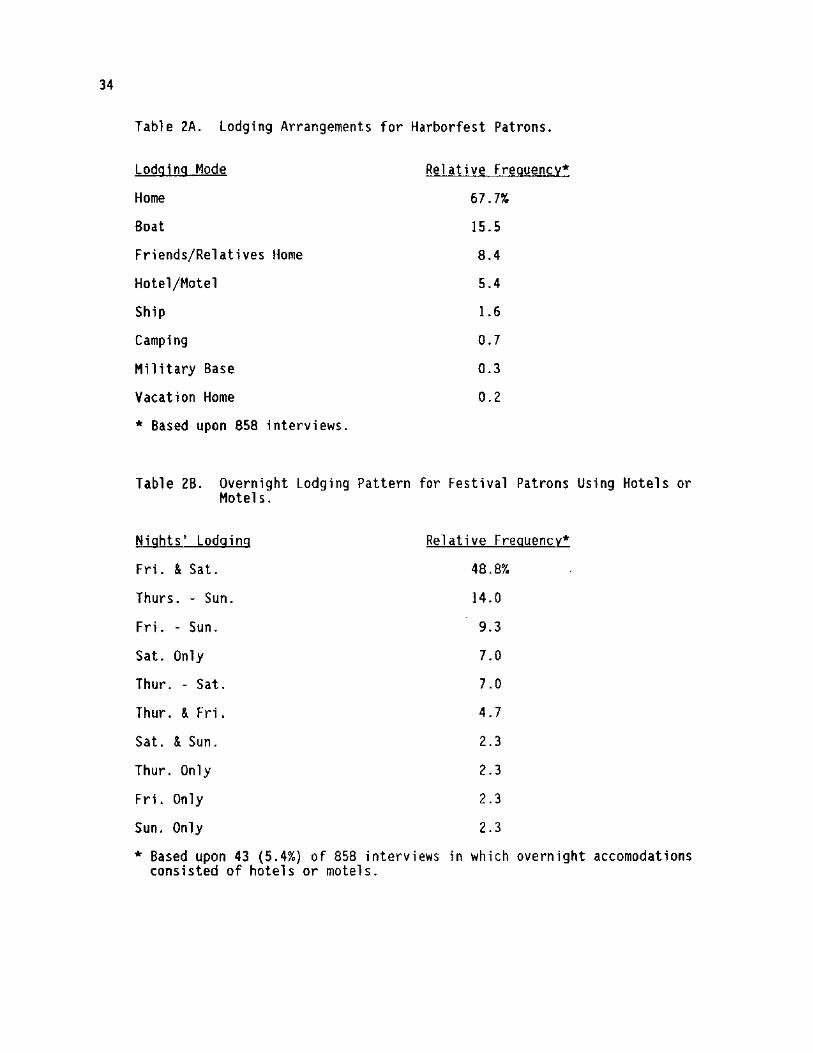
34
Table 2A. lodging Arrangements for Harborfest Patrons.
Lodging Mode
Home
Boat
Friends/Relatives Home
Hotel/Motel
Ship
Camping
Military Base
Vacation Home
* Based upon 858 interviews.
Relative frequency*
67. 7%
15.5
8.4
5.4
1.6
0. 7
0.3
0.1
Table 28. Overnight Lodging Pattern for Festival Patrons Using Hotels or Motels.
Nights' Lodging
Fri. & Sat.
Thurs. - Sun.
Fri. Sun.
Sat. Only
Thur. Sat.
Thur. & Fri.
Sat. & Sun.
Thur. Only
Fri. Only
Sun. Only
Relative Frequency*
48.8%
14.0
9.3
7 .0
7.0
4.7
1.3
1.3
1.3
1. 3
* Based upon 43 (5.4%) of 858 interviews in which overnight accomodations consisted of hotels or motels.
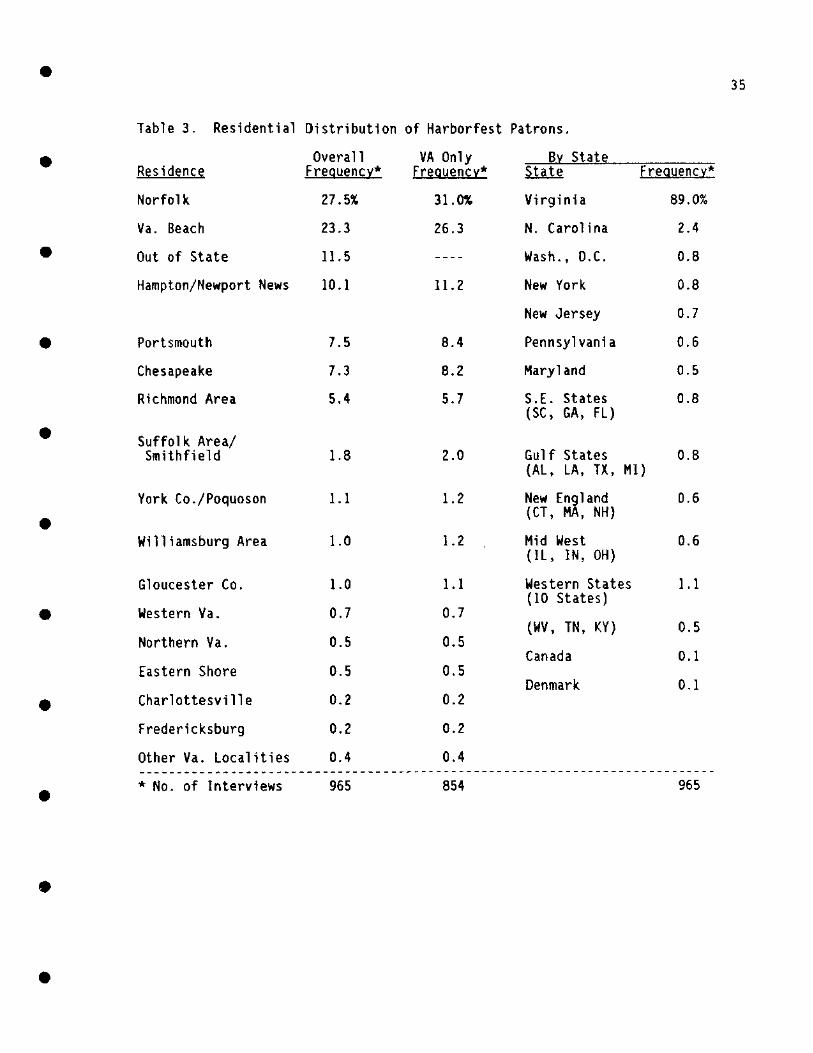
•
•
•
•
•
•
•
•
•
•
•
Table 3. Residential Distribution of Harborfest Patrons.
Residence
Norfolk
Va. Beach
Out of State
Hampton/Newport News
Portsmouth
Chesapeake
Richmond Area
Suffo 1 k Area/ Smithfield
York Co./Poquoson
Williamsburg Area
Gloucester Co.
Western Va.
Northern Va.
Eastern Shore
Charl attesvil 1 e
Fredericksburg
Other Va. Localities
* No. of Interviews
Overall Frequency*
27.5%
23.3
11.5
10. I
7.5
7.3
5.4
1.8
1.1
1.0
1.0
0. 7
0.5
0.5
0.2
0.2
0.4
965
VA Only Frequency*
31.0%
26.3
11. 2
8.4
8.2
5.7
2.0
I. 2
1.2
1.1
0.7
0.5
0.5
0.2
0.2
0.4
854
BY State
Virginia
N. Carolina
Wash., D.C.
New York
New Jersey
Pennsylvania
Maryl and
S.E. States (SC, GA, FL)
Gulf States
frequency*
89.0%
2.4
0.8
0.8
0.7
0.6
0.5
0.8
0.8 (AL, LA, TX, Ml)
New England (CT, MA, NH)
Mid West (lL, IN, OH)
Western States (10 States)
0.6
0.6
I. I
(WV, TN, KY) 0.5
Canada
Denmark
0.1
0.1
965
35
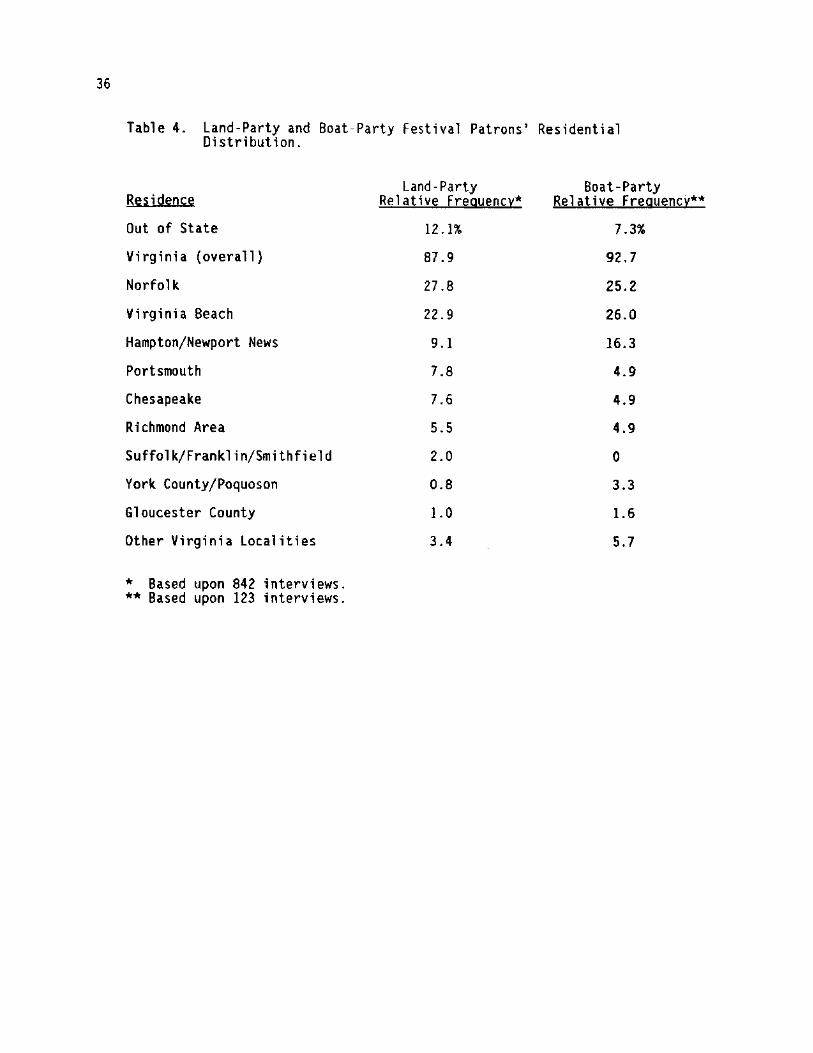
36
Table 4. Land-Party and Boat-Party Festival Patrons' Residential Distribution.
Residence Out of State
Virginia (overall}
Norfolk
Virginia Beach
Hampton/Newport News
Portsmouth
Chesapeake
Richmond Area
Suffolk/Franklin/Smithfield
York County/Poquoson
Gloucester County
Other Virginia Localities
* Based upon 842 interviews. ** Based upon 123 interviews.
Land-Party Relative frequency*
12 .1%
87.9
27.8
22.9
9 .1
7 .8
7.6
5.5
2.0
0.8
1. 0
3.4
Boat-Party Relative Frequency**
7 .3%
92.7
25.2
26.0
16.3
4.9
4.9
4.9
0
3.3
1.6
5.7
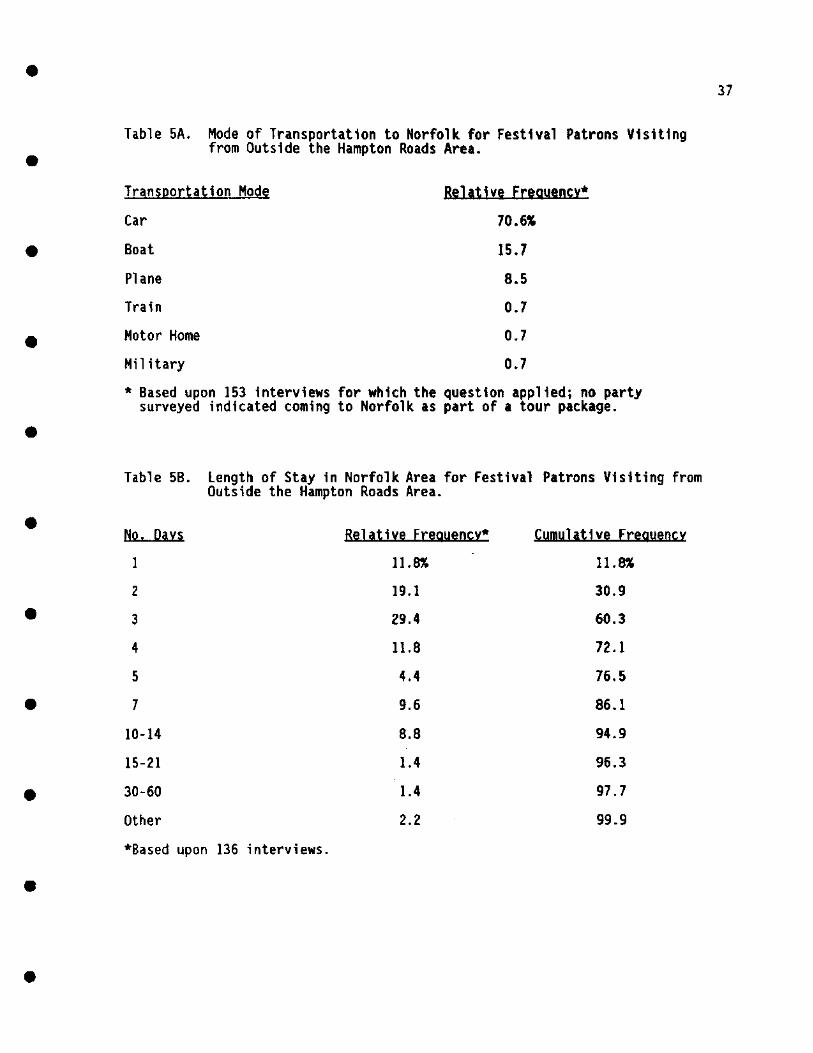
•
•
•
•
•
•
•
•
•
•
•
Table 5A. Mode of Transportation to Norfolk for Festival Patrons Visiting from Outside the Hampton Roads Area .
Transportation Mode Car
Boat
Plane
Train
Motor Home
Mil 1tary
Relative Ereauencv• 70.6,.
15.7
8.5
0. 7
0. 7
0. 7
* Based upon 153 interviews for which the question applied; no party surveyed indicated coming to Norfolk as part of a tour package .
Table 5B.
H2. Dan 1
2
3
4
5
7
10-14
15-21
30-60
Other
length of Stay in Norfolk Area for Festival Patrons Visiting from Outside the Hampton Roads Area •
Relative Ereauencv* Cumulative Freauencv 11. a,;
19.1
29.4
11.8
4.4
9.6
8.B
1.4
1.4
2.2
11. a,;
30.9
60.3
72.1
76.5
86.1
94.9
96.3
97.7
99.9
*Based upon 136 interviews .
37

38
Table 6A. Primary Reasons for Festival Tourist* Patrons Visiting the Norfolk Area.
* **
Reason
Harborfest
Vacation
Business
Convention
Relative Freguency**
59.0%
33.4%
5.5%
2 .1%
Festival patrons residing outside the Greater Hampton Roads area. Based upon 115 interviews with tourist patrons.
Table 68. Relative Ranking of Non-Festival Reasons For Tourist* Patrons Visiting the Norfolk Area.
•••
****
Reason***
Vacation
Business
Convention
Relative Frequency****
81.4%
]J.5
5. I
Of 115 interviews with tourist patrons regarding whether the party was visiting Norfolk primarily for the festival, 59% responded positively; of those patrons indicating the festival was NOT their primary reason for visiting Norfolk, their relative responses are indicated in this table; however, when asked if they tried to plan their visit around the festival, 44% of these patrons responded affirmatively.
Based upon 47 interviews with tourist patrons was not their primary reason for being in the
stating Norfolk.
that the Area.
festival

•
•
•
•
•
•
•
•
•
•
•
Table 7. Patron Response to Festival Publicity Campaign (how patrons learned about the festival) .
Sinlle/Multiple Media Responses* Pub icity Source Frequency***
Word of Mouth 20.1%
Live Nearby/TV/ 18.7 Radio
Been Before/TV/ 12.3 Newspaper
Newspaper/Radio/TV 8. 7
Other 8. 7
Television 7.3
Radio/TV 5.9
Radio 5.5
Newspaper 5.0
Been Before/Live 3.7 Nearby
Radio/TV /Word of 2.3 Mouth
Magazine 0.9
Posters 0.9
Weilhted Single Media Responses** Pub icity Source Frequency***
Word of Mouth 18. 7%
Television 17.3
Live Nearby**** 17.0
Radio 14.1
Newspaper 12.l
Been Before 12 .1
Magazine 0. 7
Posters 0. 7
Other 7.3
* As many as three different ways to learn about the festival were noted on survey forms if patron freely mentioned more than one media source; denotes patrons' actual response to question .
**
*** ****
Single media source was weighted for the total number of times it was mentioned, be it singularly or in combination with other sources. Relative frequency distribution based upon 219 interviews. "live nearby" means that patrons learned about festival from living in proximity to festival site .
39
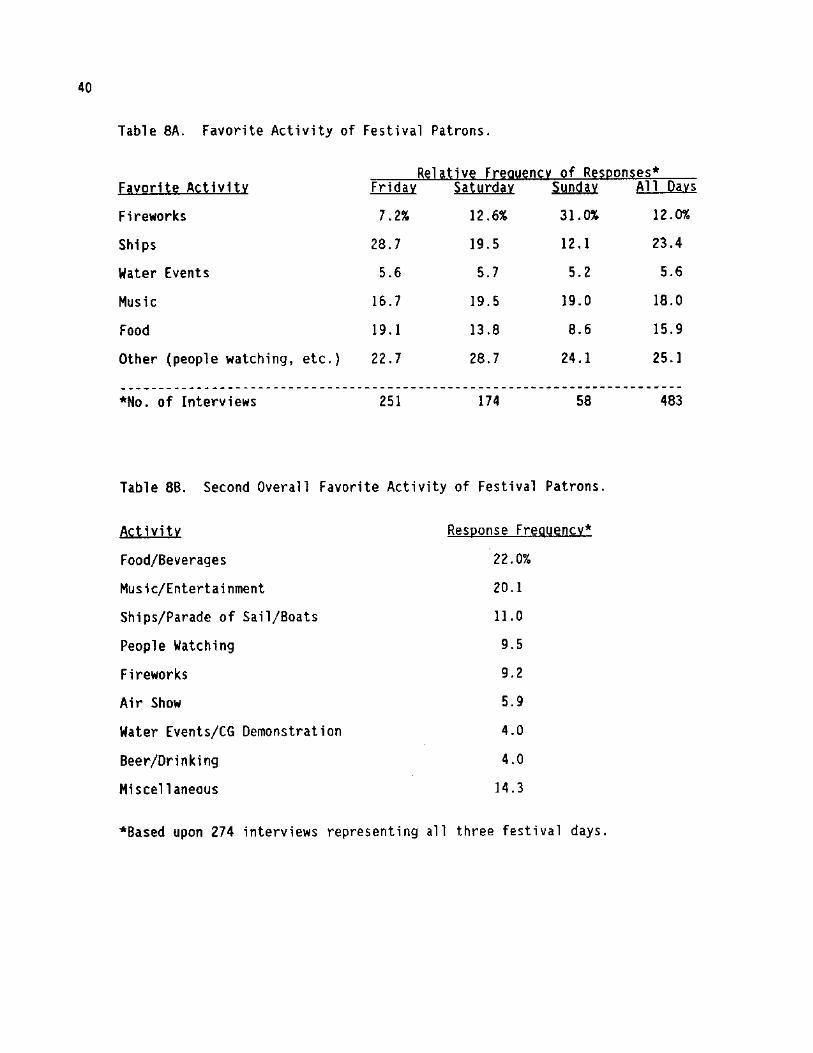
40
Table SA. Favorite Activity of Festival Patrons.
Rel ativ~ Fr~~n,~ncv of Resgonses* favorite Activity Friday Saturdav Sunday
Fireworks 7.2% 12.6% 31. 0%
Ships 28.7 19.5 12 .1
Water Events 5.6 5. 7 5. 2
Music 16.7 19. 5 19.0
Food 19 .1 13.8 8.6
Other (people watching, etc.) 22.7 28.7 24.1
*No. of Interviews 251 174 58
Table 88. Second Overall Favorite Activity of Festival Patrons.
Activity Response Freguency*
Food/Beverages
Music/Entertainment
Ships/Parade of Sail/Boats
People Watching
Fireworks
Air Show
Water Events/CG Demonstration
Beer/Drinking
Miscellaneous
22.0%
20.1
11.0
9.5
9.2
5.9
4.0
4.0
14.3
*Based upon 274 interviews representing all three festival days.
All Days
12.0%
23.4
5.6
18.0
15.9
25.1
483

•
•
•
•
•
•
•
•
•
•
•
Table 9. Overall Weighted Popularity Index Ranking for Patrons' Favorite Festival Activity .
41
Overall Favorite Activity~~~~~~~~~
Activity
Ships Music Food Fireworks Water Events
Food/Beverages Music/Entertainment Ships People Watching Fireworks
Rel. Freq. Response
23.4%** 18.0 15.9 12.0 5.6
Rank Weighting
5 4 3 2 1
Favorite/2nd Favorite Activity Weighting
1 1 I I I
Popularity Index*
1.170 0. 720 0.477 0.240 0.056
Second Overall Favorite Activity
22.0%*** 20.1 11.0 9.5 9.2
5 4 3 2 1
0. 5**** 0.5 0.5 0.5 0.5
0.550 0.402 0 .165 0.095 0.046
Combined Ranking Index
General Activity
Ships/Boats Music/Entertainment Food/Beverages Fireworks People Watching Water Events
Summed Popularity Index
1.335 1.122 1. 027 0.286 0.095 0.056
• •• *** **"'*
Index Derivation: (23.4%/100) X 5 X I • 1.170 From Table SA . From Table BB. Second favorite responses weighted 0.5 in comparison to a factor of I for favorite responses .
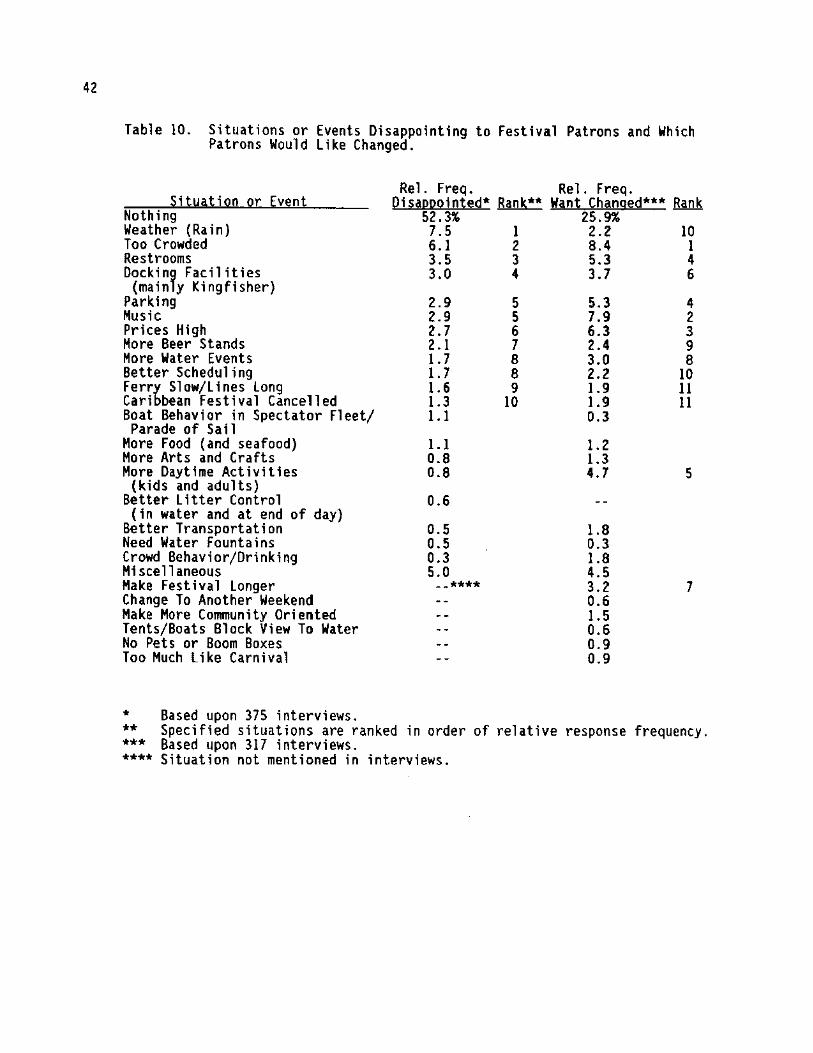
42
Table 10. Situations or Events Disappointing to Festival Patrons and Which Patrons Would Like Changed.
Rel. Freq. Rel. Freq. ~it!,H!i:tign Qr Event Qi ~~l:H2Qin:ted* Rank** Ws1,n:t Changed*** Rank
Nothing 52.3% 25. 9% Weather (Rain) 7.5 I 2.2 JO Too Crowded 6.1 2 8.4 I Restrooms 3.5 3 5.3 4 Dockinf Facilities 3.0 4 3.7 6 (main y Kingfisher)
Parking 2.9 5 5.3 4 Music 2.9 5 7 .9 2 Prices High 2.7 6 6.3 3 More Beer Stands 2. J 7 2.4 9 More Water Events I. 7 B 3.0 B Better Scheduling I. 7 8 2.2 JO Ferrb Slow/Lines long I. 6 9 1.9 II Cari bean Festival Cancelled 1.3 JO 1.9 II Boat Behavior in Spectator Fleet/ I. I 0.3 Parade of Sa i 1
More Food (and seafood) I. I I. 2 More Arts and Crafts 0.8 1.3 More Daytime Activities 0.8 4.7 5
(kids and adults) Better Litter Control 0.6 (in water and at end of day}
Better Transportation 0.5 l.B Need Water Fountains 0.5 0.3 Crowd Behavior/Drinking 0.3 1.8 Miscellaneous 5.0 4.5 Make Festival Longer --**** 3.2 7 Change To Another Weekend 0.6 Make More Community Oriented 1.5 Tents/Boats Block View To Water 0.6 No Pets or Boom Boxes 0.9 Too Much like Carnival 0.9
• Based upon 375 interviews. •• ••• ****
Specified situations are ranked in order of relative response frequency . Based upon 317 interviews . Situation not mentioned in interviews.

•
•
•
•
•
•
•
•
•
•
•
Table II. Festival Patrons' Opinion of Litter Control Program .
litter Control D1i1}! &eU!QDU Qvernl 1 hl,__ Rating fr.L.. Frea. * al.. Erea, * ~ Freq.* Response Freq.
Good 195 96.I" IIO 95. 1, 48 96.0ll 353 95. 9"
Fair 8 3.9 3 2.6 1 2.0 12 3.3
Poor 0 2 I. 7 1 2.0 3 0.8
Total Interviews 203 I15 50 368
More Trash Receptacles? No ll5 75. 7% 79 83.2% 43 91. 5" 237 80.6%
Yes 37 24.3 16 16.8 4 8.5 57 19.4
Total Interviews 152 95 47 294
* Relative Frequency
Table 12. Patron Response to Perceived Changes in Festival Quality Since Previous Visit(s) .
Ee:tthit] oualitv Friday Response Freguencv*
Ss1t1,1rda:t Sunday: All Day:s
Improved 67.7% 79.4% 51. 5% 70.8"
Unchanged 25.5 16.8 39.4 23.4
Declined 6.8 3.8 9 .1 5.8
*No. of Interviews 161 131 33 325
43
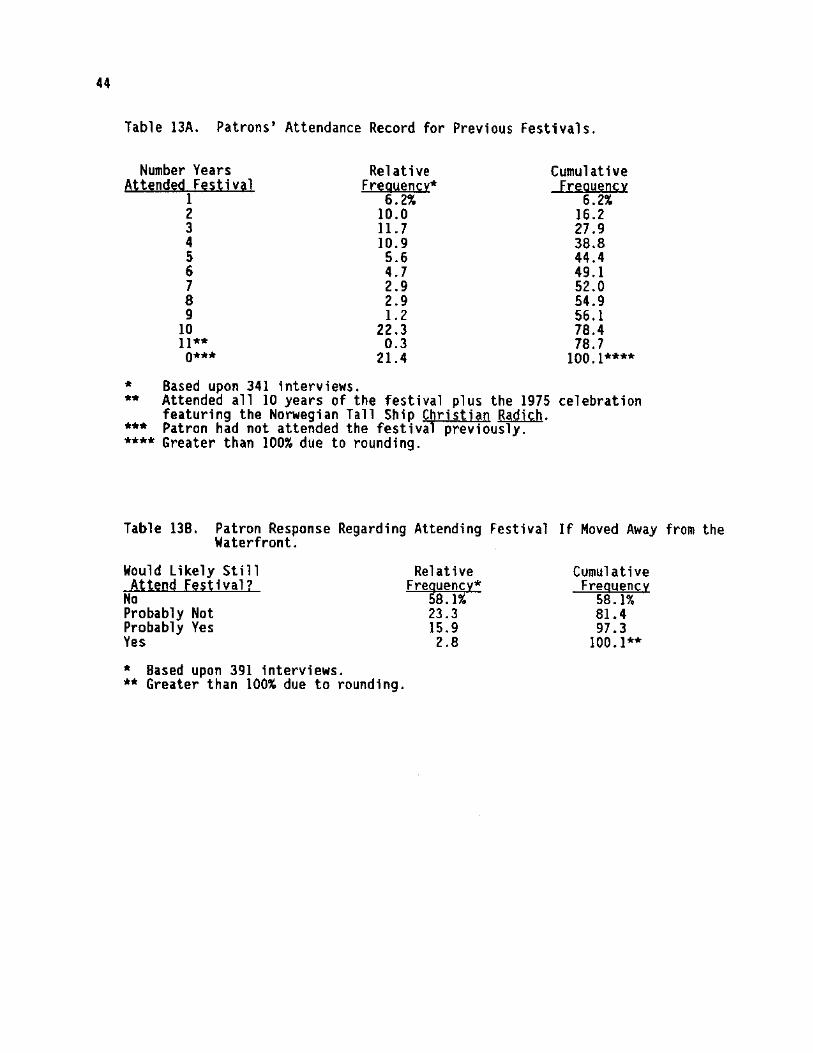
44
Table 13A. Patrons' Attendance Record for Previous Fest;vals.
Number Years Attended Festival
I 2 3 4 5 6 7 8 9
10 11** 0***
* Based upon 341 interviews.
Relative Frequency*
6.2% 10.0 11. 7 10.9 5.6 4.7 2.9 2.9 I. 2
22.3 0.3
21.4
Cumulative Freauencv
6.2% 16.2 27 .9 38.8 44.4 49.1 52.0 54.9 56.1 78.4 78.7
100.1****
** Attended all 10 years of the festival plus the 1975 celebration featuring the Norwegian Tall Ship Christian Radich.
*** Patron had not attended the festival previously. **** Greater than 100% due to rounding.
Table 138. Patron Response Regarding Attending Festival If Moved Away from the Waterfront.
Would Likely Still Attend Festival?
No Probably Not Probably Yes Yes
* Based upon 391 interviews. ** Greater than 100% due to rounding.
Relative Frequency*
58.1% 23.3 15.9
2 .8
Cumulative Frequency
58.1% 81.4 97.3
100.l**

• 45
Table 14. Festival Attendance Patterns for Land-Parties, Boat·Parties, and Festival Patrons Overall .
• ReJ1tiie Eregueat~ Actual Days Land Boat All Atten~•a Parties* Parties** htri:ms***
Fri-Sun 20. 5:1: 78. O:I: 27.9:1:
• Sat Only 30.7 4.2 27.3
Fri & Sat 15.0 6.8 14.0
Sat & Sun 13.9 10.2 13.4
• Sun Only 12.2 10.7
Fri Only 5.2 4.5
Fri & Sat 2.5 0.8 2.3
• Belatixe Eregu~ntx Total Days Land Boat All Attended Parties* Parties** Patrons***
I 48 .1,: 4.211 42. 4,:
• 2 31.4 17 .8 29.7
3 20.5 78.0 27.9
• Based upon 792 interviews. •• Based upon llB interviews . • *** Based upon 910 interviews .
•
•
•
•

46
Table 15. Sociological Characteristics of Festival Patrons.
Character Relative Frequency*
Single 50.0%
Married 50.0
*No.of Interviews
With Family With Friends With Both
*No.of Interviews
Number In Group
I 2 3 4 5 6 7 8 9-10
11-14 15-18 20-30 39-50
Rel. Freq.*
8.0% 32.8 17.6 16.4 8.2 5.5 2. 7 2. 7 3.3 1.0 0.3 0. 7 0. 7
* No. of Interviews 939 ** Cumulative frequency.
Cum. Freq.**
8.0% 40.8 58.4 74.8 83.0 88.5 91.2 93.8 97.1 98. l 98.4 99.1 99.8
532
33.7 47.1 19.2
434
Age Range (yrs.)
10-15 16-20 21-30 31-40 41-50 51-60 61-70 71-80
Rel, Freq.*
0.3% 8.0
39.6 27.9 14.9 6.8 2.0 0.5
603
Cum. Freq.**
0.3% 8.3
47.9 75.8 90.7 97.5 99.5
100.0

•
•
•
•
•
•
•
•
•
•
•
Table 16.
,m
I 2 3 4 5 6 7 8 9
10 II 12 13 14 15 16 17 18
Age Distribution of Children Accompanying Festival Patrons .
Relative Freauencv* 3.21 8.0 4.9 6.8 7 .8 6.6 6.1 7 .3 6.3 5.8 7.3 6.8 5. I 8. 7 3.8 2.2 2.4 1.0
Cumulative Freauency
30 .7,;
62.8
94.5
100.l**
47
* Based upon 412 children whose ages were obtained from 945 interviews; children 7 s average age was 9 years old; 26.8' of patrons were accompanied by children 18 years old or younger while only 5.~ of patrons• indicated they had left at least one child at home.
** Greater than 100% due to rounding .
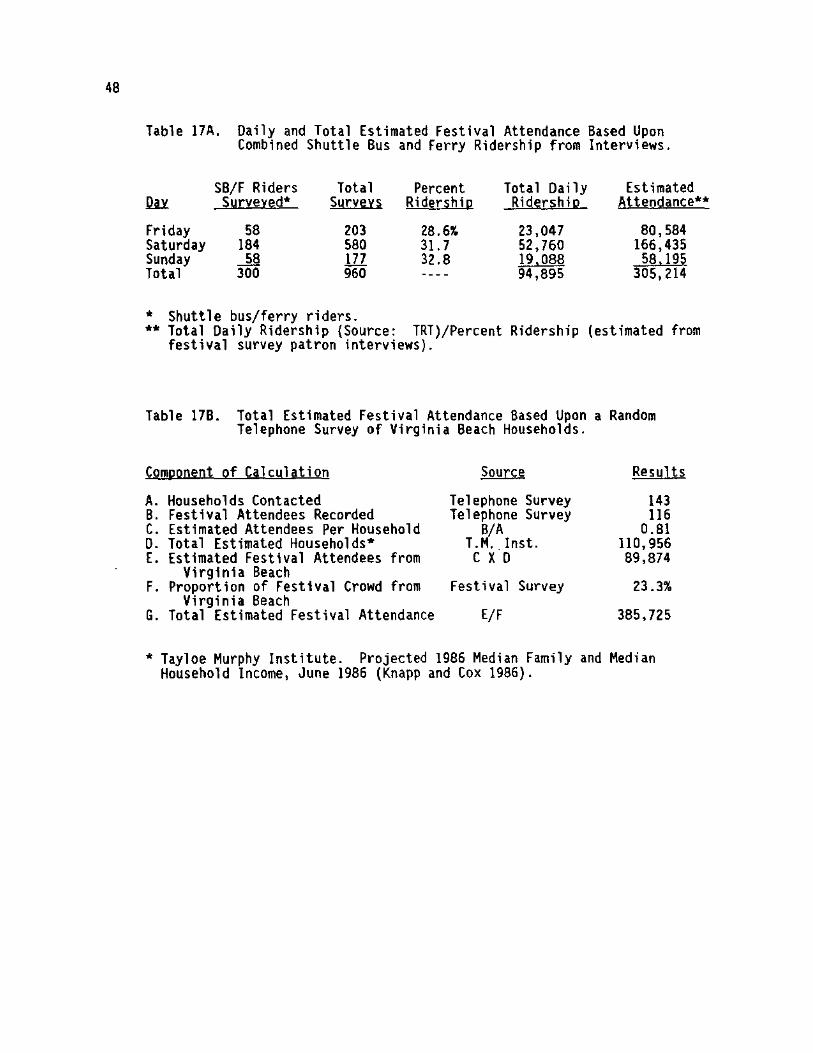
48
Table 17A. Daily and Total Estimated Festival Attendance Based Upon Combined Shuttle Bus and Ferry Ridership from Interviews.
SB/F Riders Total Percent Total Daily Estimated l!u Surveyed* Syrvevs Ridership Ridership Attendance**
Friday 58 203 28.6% 23,047 80,584 Saturday 184 580 31. 7 52,760 166,435 Sunday 58 177 32.8 19,088 58, 19, Total 300 960 94,895 305,214
* Shuttle bus/ferry riders. ** Total Daily Ridership {Source: TRT)/Percent Ridership (estimated from
festival survey patron interviews).
Table l7B. Total Estimated Festival Attendance Based Upon a Random Telephone Survey of Virginia Beach Households.
Component of Calculation
A. Households Contacted B. Festival Attendees Recorded C. Estimated Attendees Per Household D. Total Estimated Households* E. Estimated Festival Attendees from
Virginia Beach F. Proportion of Festival Crowd from
Virginia Beach G. Total Estimated Festival Attendance
Source
Telephone Survey Telephone Survey
8/A T .M .. Inst. C X D
Festival Survey
E/F
Results
143 116
0.81 IID, 956 89,874
23.3%
385,725
* Tayloe Murphy Institute. Projected 1986 Median Family and Median Household Income, June 1986 (Knapp and Cox 1986).
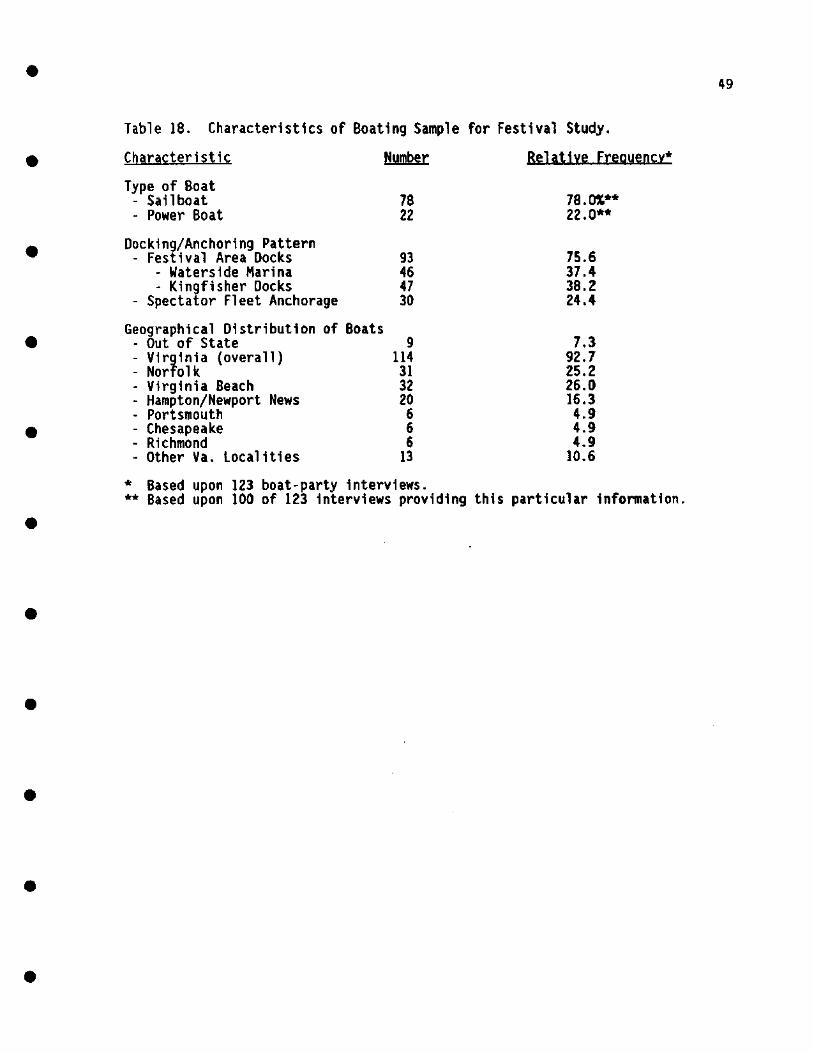
• 49
Table 18. Characteristics of Boating Sample for Festival Study.
• Character i st 1c Number Relative Freauencv* Type of Boat
- Sailboat 78 78.0X.** - Power Boat 22 22.0**
• Docking/Anchoring Pattern - Festival Area Docks 93 75.6
- Waterside Marina 46 37 .4 - Kingfisher Docks 47 38.2
- Spectator Fleet Anchorage 30 24.4
• Geographical Distribution of Boats Out of State 9 7.3 Virjinia {overall) 114 92.7 Nor olk 31 25.2 Virginia Beach 32 26.0 Hampton/Newport News 20 16.3 Portsmouth 6 4.9
• Chesapeake 6 4.9 Richmond 6 4.9 Other Va. Localities 13 10.6
* Based upon 123 boat-party interviews. ** Based upon 100 of 123 interviews providing this particular infonnatton .
•
•
•
•
•
•

50
Table 19. Estimated Number of Boats at Harborfest by Mooring Area.
Number of Boats MQoring Area Friday: Saturdit Sunday Total
Waterside Marina 50* 50 50 150
Kingfisher Docks 161** 161 161 483
Spectator Fleet Anchorage -400*** -950**** -z.QQ***** -~ TOTAL BOATS -611 -1,161 -411 -2,183
*
**
***
****
*****
Count estimated by Norfolk dockmaster's office and confirmed by survey staff. Count of boats made Saturday by survey staff (dockmaster's office estimated 135 boats had reserved slips at Kingerfisher Docks). No count was made by Harborfest Corrmittee boat on Friday; an estimate of 400 boats is used based upon observations of Shawn's Launch Service personnel serving spectator fleet anchorage (personnel counted 600-700 sailboats in anchorage cove on Friday even1ng). Estimate of average number of boats in anchorage on Saturday based upon a Harborfest Committee boat count of 535 oats at 12 noon and 1,400 boats at 5:00 p.m.; boat numbers continued growing in anchorage until sunset but could not be counted due to harbor congestion; boat counts difficult to estimate, e.g. Norfolk dockmaster office personnel estimate maximum Saturday count in anchorage at 650 boats. Estimated Harborfest Committee boat count of boats in anchorage at 1:00 p.m. on Sunday.
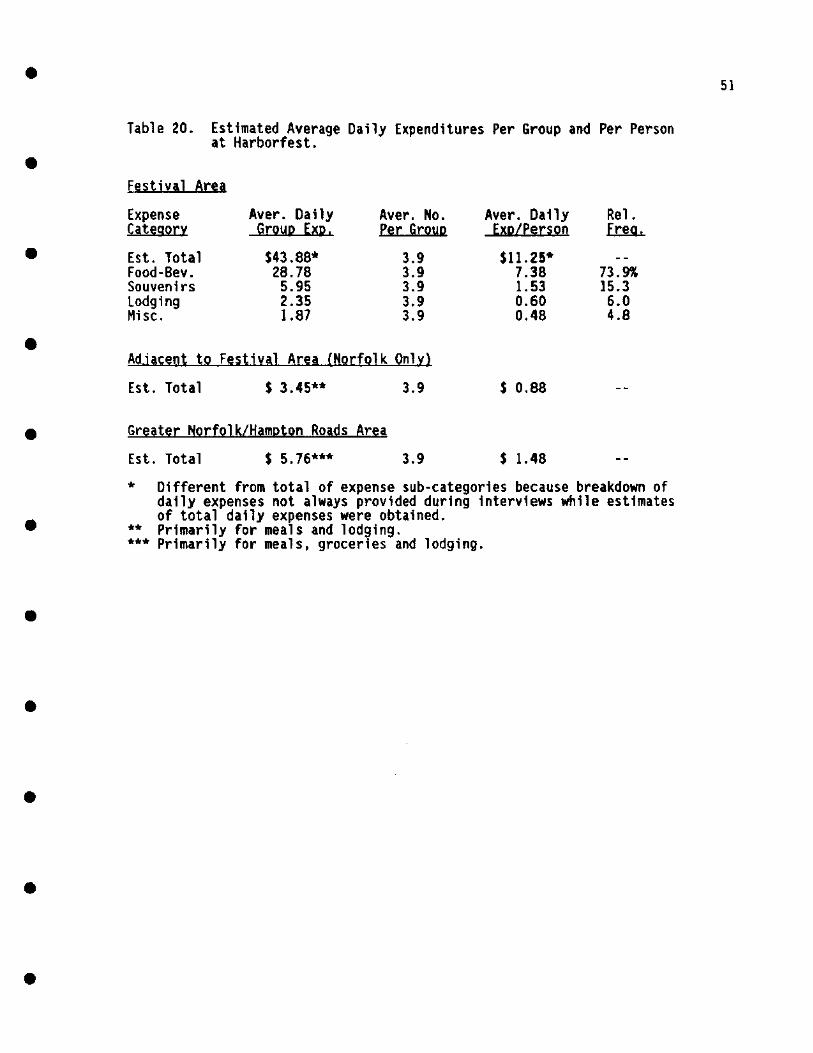
•
•
•
•
•
•
•
•
•
•
•
Table 20. Estimated Average Daily Expenditures Per Group and Per Person at Harborfest .
Festival Area Expense Aver. Daily Aver. No. Aver. Daily Rel. Cateaorv Group EXP, Per Group Exp/Person frli... Est. Total $43.88* 3.9 $11.25* Food-Bev. 28.78 3.9 7 .38 73. 9': Souvenirs 5.95 3.9 1.53 15.3 Lodging 2.35 3.9 0.60 6.0 Mi SC. 1.87 3.9 0.48 4.8
Ad.iacent to Festival Area {Norfolk Only)
Est. Total S 3.45** 3.9 S 0.88
Greater Norfolk/Hampton Roads Area Est. Total $ 5.76*** 3.9 S 1.48
• Different from total of expense sub-categories because breakdown of daily expenses not always provided during interviews while estimates of total daily expenses were obtained .
** Primarily for meals and lodging. ••• Primarily for meals, groceries and lodging .
51
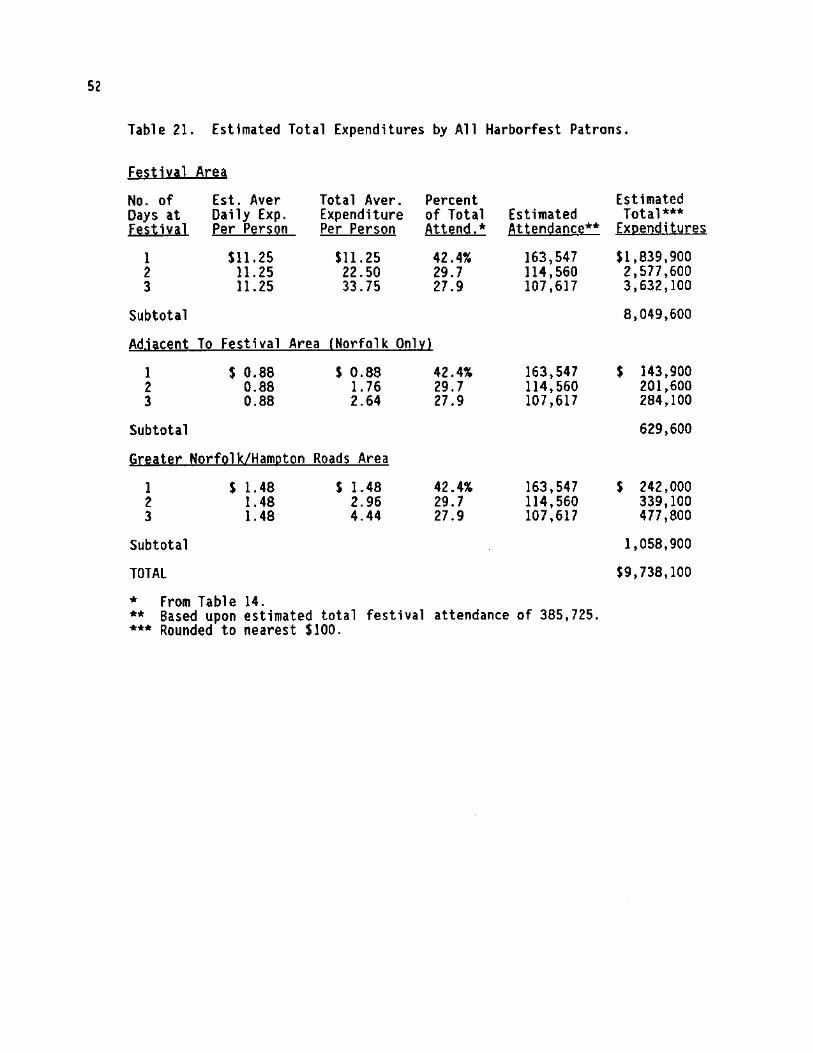
52
Table 21. Estimated Total Expenditures by All Harborfest Patrons.
FeUju] Area No. of Days at Festival
I 2 3
Subtotal
Adj.cent To
I 2 3
Subtotal
Est. Aver Daily Exp. Per Person
$11.25 11. 25 11.25
Festival
$ 0.88 0.88 0.88
Area
Total Aver. Percent Expenditure of Total Per Person Attend.*
$11. 25 42.4% 22.50 29.7 33. 75 27.9
(Norfolk Onl:tl
S 0.88 I. 76 2.64
42.4% 29.7 27.9
Greater Norfolk/Hampton Roads Area
I 2 3
S 1.48 1.48 1.48
$ 1.48 2.96 4.44
42.4% 29.7 27.9
Estimated Attendance**
163,547 114,560 107,617
163,547 114,560 107,617
163,547 114,560 107,617
Estimated Total***
Expenditures
$1,839,900 2,577,600 3,632,100
8,049,600
$ 143,900 201,600 284,100
629,600
S 242,000 339, IOO 477,800
Subtotal 1,058,900
TOTAL $9,738,100
* From Table 14. ** Based upon estimated total festival attendance of 385,725. *** Rounded to nearest $100.
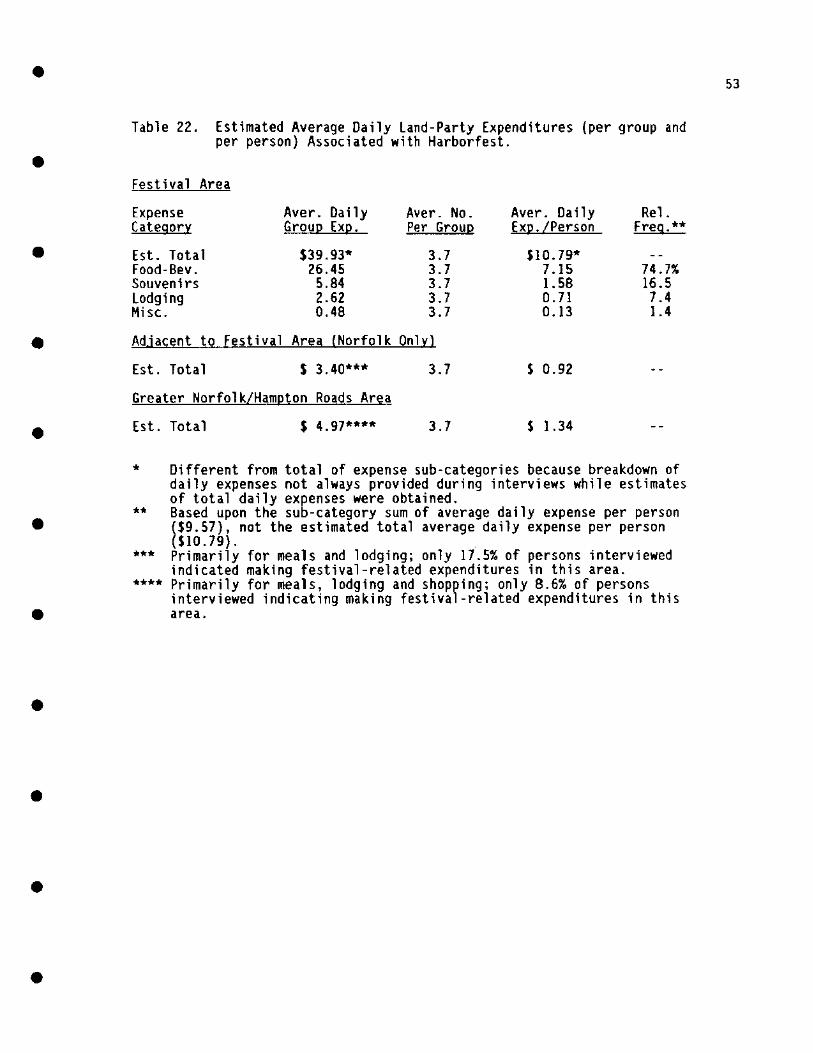
•
•
•
•
•
•
•
•
•
•
•
Table 22. Estimated Average Daily Land-Party Expenditures (per group and per person} Associated with Harborfest .
Festival Area
Expense Aver. Daily Aver. No. Aver. Daily Rel. Category Group Exp. Per Group fxQ. /Person Freg. **
Est. Tota 1 $39.93* 3.7 $10. 79• Food-Bev. 26.45 3.7 7 .15 74.7% Souvenirs 5.84 3.7 1.58 16.5 Lodging 2.62 3.7 0. 71 7.4 Misc. 0.48 3.7 0.13 1.4
Adjacent to Festival Are11. (Norfolk Only)
Est. Total s 3. 40*** 3. 7 S 0.92
Greater Norfolk/Hampton Roads Area
Est. Total $ 4.97**** 3. 7 S 1.34
• Different from total of expense sub-categories because breakdown of daily expenses not always provided during interviews while estimates of total daily expenses were obtained.
••
•••
****
Based upon the sub-category sum of average daily expense per person ($9.57), not the estimated total average daily expense per person (SI0.79). . Primarily for meals and lodging; only 17.5% of persons interviewed indicated making festival-related expenditures in this area. Primarily for meals, lodging and shopping; only 8.6% of persons interviewed indicating making festival-related expenditures in this area .
53
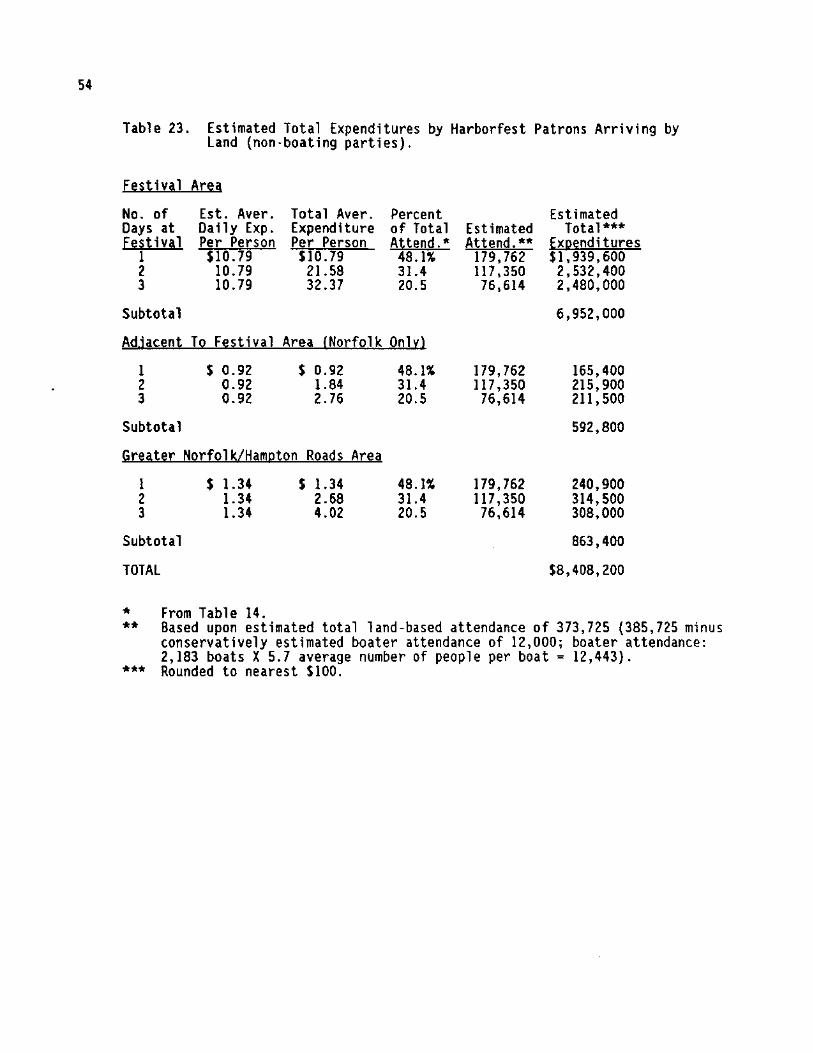
54
Table 23. Estimated Total Expenditures by Harborfest Patrons Arriving by Land {non-boating parties).
F~itivtl Area No. of Est. Aver. Total Aver. Percent Days at Daily Exp. Expenditure of Total EeUival Per Person Per Person Attend.*
I $10.79 $10.79 48.1% 1 JO. 79 21.58 31.4 3 JO. 79 32.37 20.5
Subtotal
Adjacent To Festival Area (Norfolk Only)
I 1 3
Subtotal
$ 0.92 0.91 0.91
$ 0.91 1.84 2.76
Greater Norfolk/Hampton Roads Area
l 1 3
Subtotal
TOTAL
$ 1.34 1.34 1.34
From Table 14.
S 1.34 2.68 4.01
48.1% 31.4 20.5
48 .1% 31.4 10.5
Estimated Attend.**
179,762 117,350 76,614
179,762 ll 7,350 76,614
179,761 ll7,350 76,614
Estimated Total***
fx12enditures $1,939,600
2,532,400 2,480,000
6,952,000
165,400 115,900 1ll, 500
591,800
140,900 314,500 308,000
863,400
$8,408,200
* ** Based upon estimated total land-based attendance of 373,725 (385,725 minus
conservatively estimated boater attendance of 12,000; boater attendance: 2,183 boats X 5.7 average number of people per boat= 12,443).
*** Rounded to nearest $100.

•
•
•
•
•
•
•
•
•
•
•
Table 24. Genera 1 Expenditure Patterns for Land-Parties, Boat-Parties and Festival Patrons Overall .
Festival-Related Exoendityre Estimates Area of
Expendityre All Patrons
Festival Area $8,049,600 Only
Adjacent to 629,000 Festival Area (Norfolk Only)
Greater Norfolk/ 1,058,900 Hampton Roads Area
TOTAL Rel. Freq. Over a 11
$9,738,100
Relative frequency.
Freq.*
82. 7ll.
6.5
10.9
Land-Parties
$6,952,000
592,800
863,400
$8,408,200
86.3%***
~*
82. 7%
7.1
10.3
Boat-Parties**
$1,097,600
36,800
195,500
$1,329,900
13. 7%***
Freq.*
81.5%
2.8
14.7
* ** ***
Expenditures of all patrons minus those of land-parties. Proportion of overall patron expenditures accounted for by land-parties and boat-parties respective 1 y; in terms of estimated atteance, 1 and parties accounted for approximately 97% and boating parties 3% of all festival attendees (see Table 23 footnote for attendance estimates) .
55
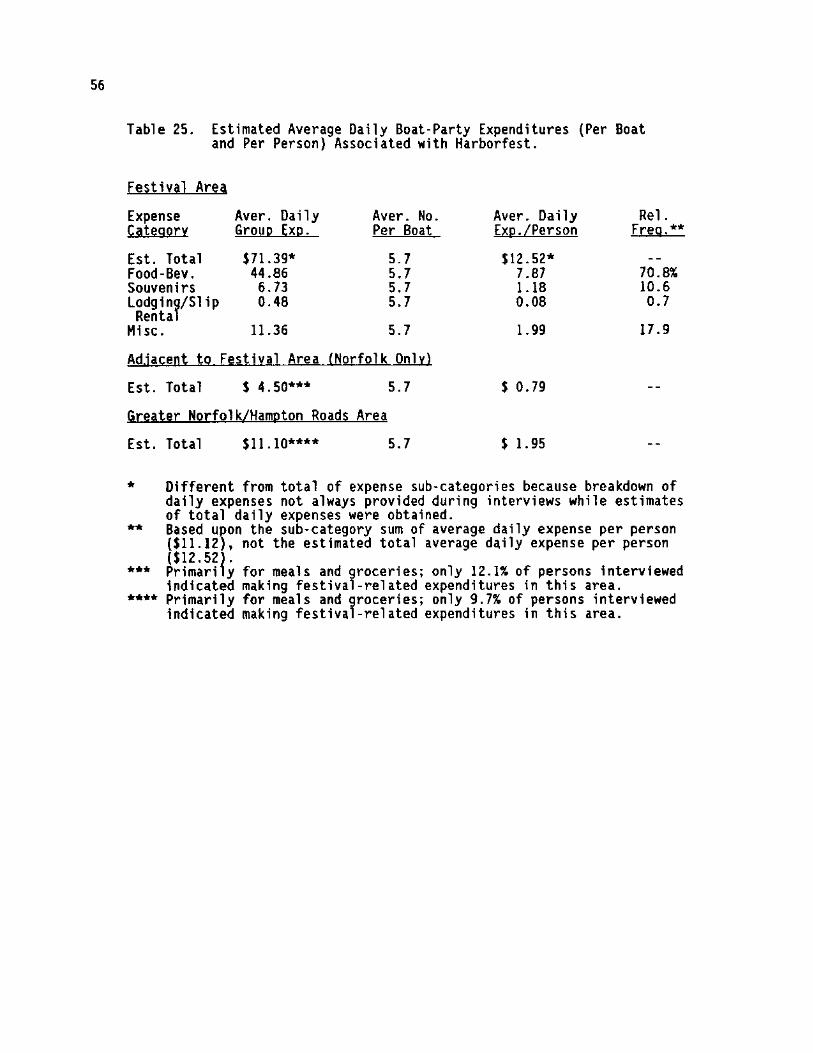
56
Table 25. Estimated Average Daily Boat-Party Expenditures {Per Boat and Per Person) Associated with Harborfest.
Eestiv1] Are~
Expense Aver. Daily Aver. No. Categorv Group Exp. Per Boat
Aver. Daily Rel. Exp. /Person Freq.**
Est. Total $71.39* 5.7 $12.52* Food-Bev. 44.86 5. 7 7.87 70.8% Souvenirs 6.73 5.7 1.18 10.6 Lodginy!Slip 0.48 5.7 Renta
0.08 0. 7
Hi SC, 11.36 5. 7 1.99 17.9
Adjacent to Festival Area (Norfolk Only)
Est. Total $ 4.50**'* 5.7 $ 0. 79
Greater Norfolk/Hampton Roads Area Est. Total $11.10**** 5.7 $ 1.95
• Different from total of expense sub-categories because breakdown of daily expenses not always provided during interviews while estimates of total daily expenses were obtained.
••
••• ****
Based upon the sub-category sum of average daily expense per person ($11.12), not the estimated total average daily expense per person 1112. 52j · Primari y for meals and groceries; only 12.1% of persons interviewed indicated making festival-related expenditures in this area. Primarily for meals and groceries; only 9.7% of persons interviewed indicated making festival-related expenditures in this area.
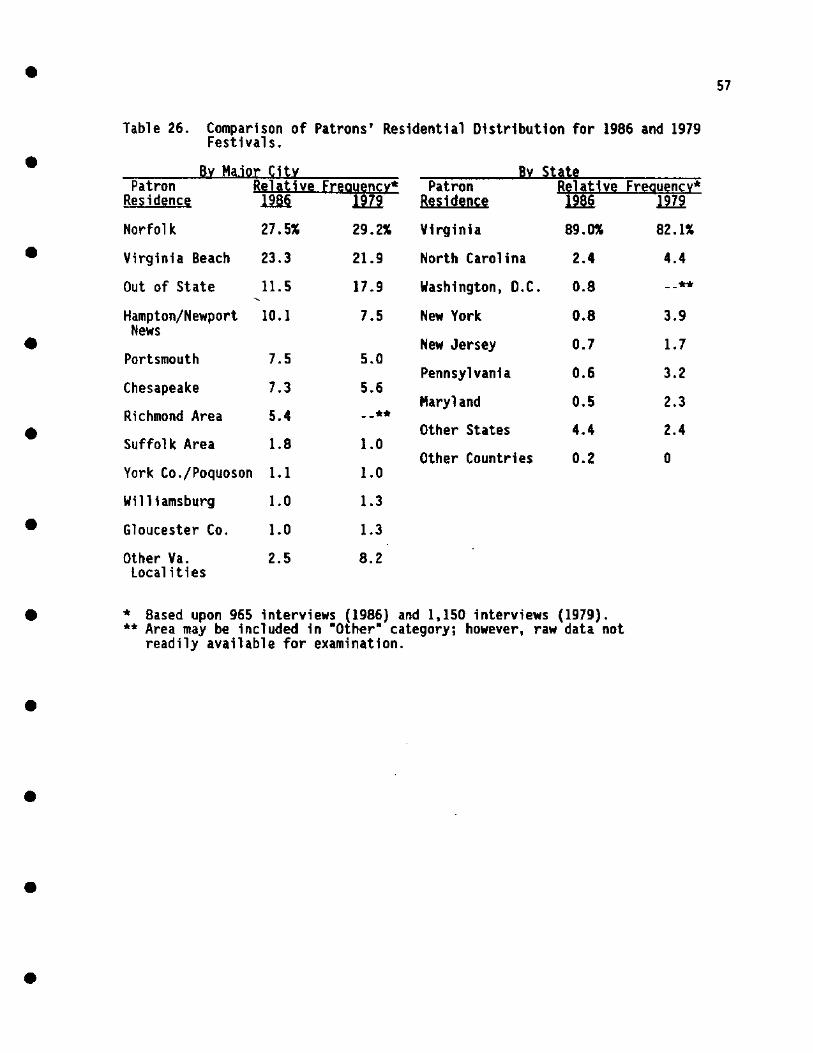
•
•
•
•
•
•
•
•
•
•
•
Table 26. Comparison of Patrons' Residential Distribution for 1986 and 1979 Fest tva ls .
By Major City By state Patron Relative Ereauencr* Patron Relative Freauency*
Residence UM lili Residence m§. .l.lli.
Norfolk
Virginia Beach
27.5"
23.3
Out of State 11. 5
Hampton/Newport 10.1 News
Portsmouth
Chesapeake
Richmond Area
Suffolk Area
7.5
7 .3
5.4
1.8
29. 2"
21.9
17.9
7.5
5.0
5.6
--** 1.0
York Co./Poquoson I.I 1.0
Williamsburg 1.0 1.3
Gloucester Co.
Other Va. Loe al it i es
1.0
2.5
1.3
8.2
Virginia
North Carolina
Washington, D.C.
New York
New Jersey
Pennsylvania
Maryland
Other States
Other Countries
89.01'
2.4
0.8
0.8
0.7
0.6
0.5
4.4
0.2
* Based upon 965 interviews (1986) and 1,150 interviews (1979) . ** Area may be included in •other• category; however, raw data not
readily available for examination .
82.1"
4.4
•• 3.9
1.7
3.2
2.3
2.4
0
57

58
Table 27. Comparison of Land-Party and Boat-Party Patrons' Residential Distribution for 1986 and 1979 Festivals.
Patron Residence Virginia (overall)
Norfolk
Virginia Beach
Hampton/Newport News
Out of State
Portsmouth
Chesapeake
Rkhmond Area
Suffolk Area
York Co./Poquoson
Gloucester Co.
Other Virginia Localities
Land-Parties Relative Frequency* 1986 1979
87 .9%
27.8
22.9
9.1
12.1
7 .8
7.6
5.5
2.0
0.8
1.0
3.4
82.6%
29.4
22.4
7.7
17 .4
4.9
5.6
- -***
I. I
0.6
I. 3
9.6
Boat-Parties Relative Frequency*
1986 1979
92.7%
25.2
26.0
16.3
7 .3
4.9
4.9
4.9
0
3.3
1.6
5.7
73.5%
25.0
14.7
5.9
26.5
5.9
4.4
--***
0
8.8
1.5
7.3
* Based upon 842 interviews (1986) and 1,081 interviews (1979). ** Based upon 123 interviews {1986} and 68 interviews (1979). *** Area may be included in uother" category; however, raw data
not readily available for examination.
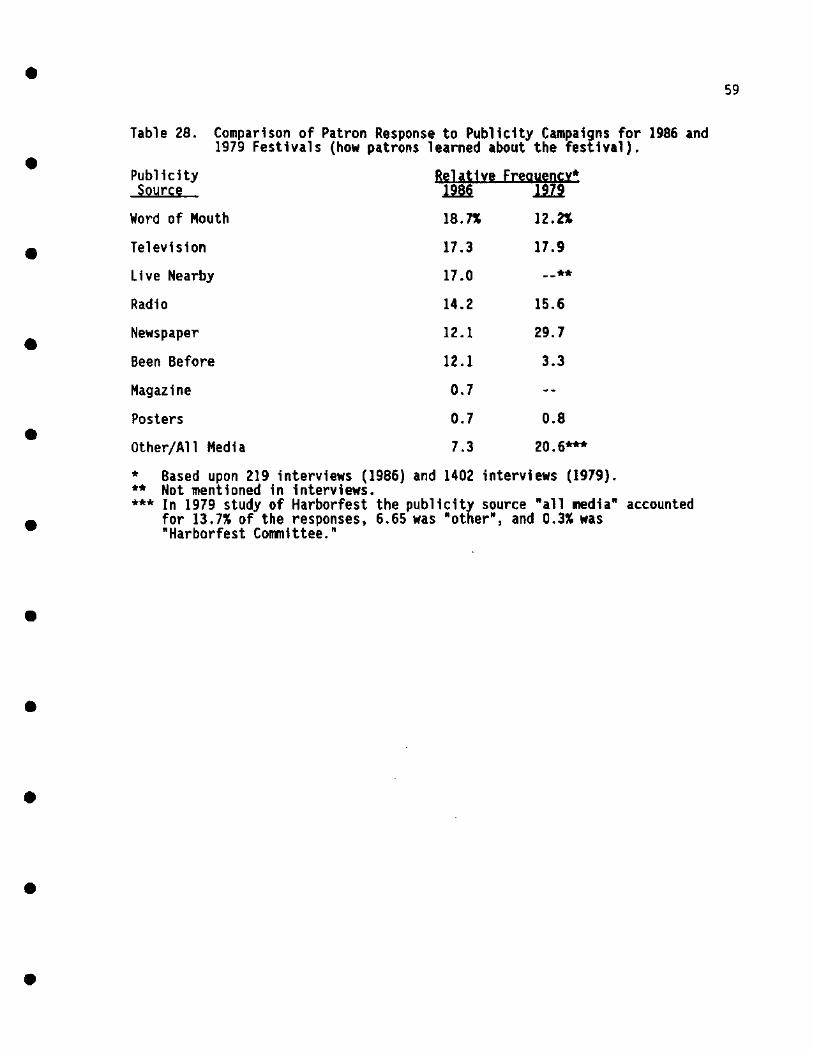
•
•
•
•
•
•
•
•
•
•
•
Table 28. Comparison of Patron Response to Publicity Campaigns for 1986 and 1979 Festivals {how patrons learned about the festival) .
Publicity Source
Word of Mouth
Television
Live Nearby
Radio
Newspaper
Been Before
Magazine
Posters
Other/All Media
Relative Freauencx* .lffl. .llli 10.n
17 .3
17.0
14.2
12.1
12.1
0.7
0. 7
7.3
12.2'
17.9
--** 15.6
29.7
3.3
0.8
20.6***
* Based upon 219 interviews (1986) and 1402 interviews (1979). ** Not mentioned in interviews. *** In 1979 study of Harborfest the publicity source Rall nediaR
for 13.7% of the responses, 6.65 was •other•, and 0.3% was ·Harborfest Con111ittee."
accounted
59

60
Table 29. Comparison of Patrons' Favorite Activities for the 1986 and 1979* Festivals.
Relative Freguenc:t** Favorite Activity* 12.!!§ - BiD.11 1979 - Rank**"'
Ships/Boats 23.4% 1 43.6% 1
Music 18.0 2 6.8 3
Food 15.9 3 2.5 5
Fireworks 12.0 4 5. I 4
Water Events 5.6 5 8.8 2
All Attract ions --**** 24.3
Beer 2.0 6
Other 25.1 6.5
• In 1979 study of Harborfest, patrons were asked to indicate "the most desirable feature" of the festival rather than their "favorite act; vi ty"; the two quest i ans are considered similar enough for this general comparison.
** Based upon 483 interviews (1986) and 1238 interviews (1979). *** Specified activities are ranked in order of relative response
frequency. **** Activity not mentioned in interviews.
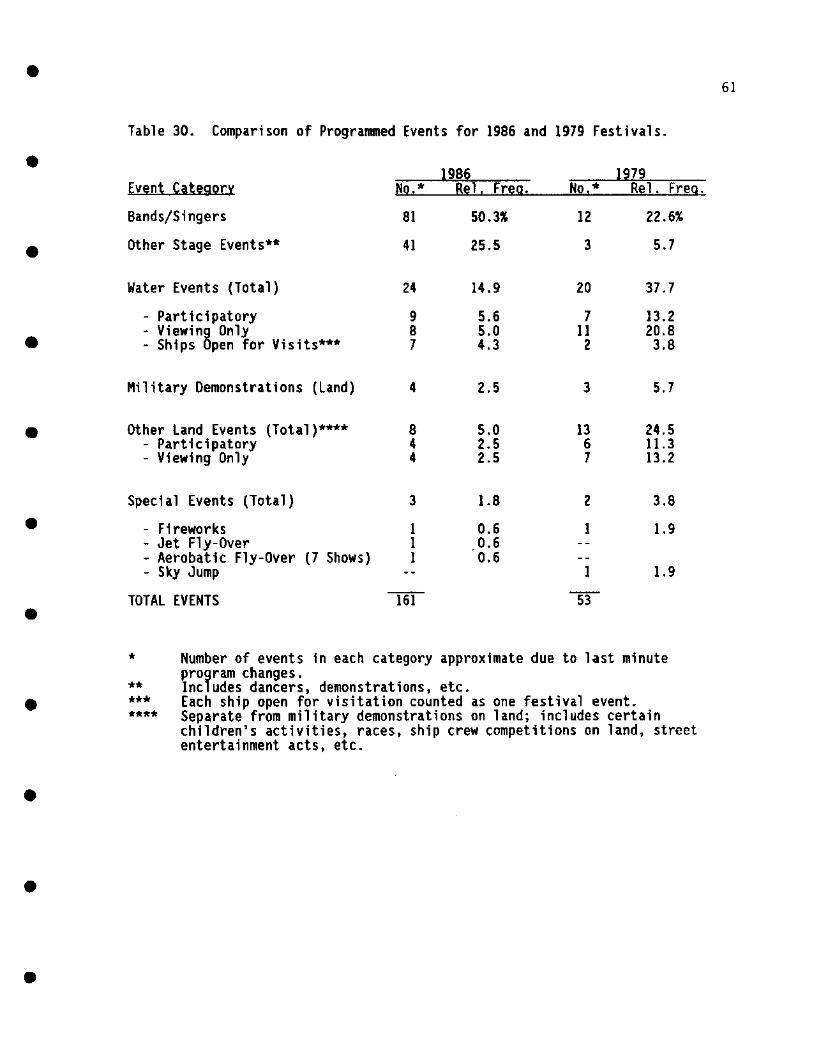
•
•
•
•
•
•
•
•
•
•
•
Table 30. Comparison of Programmed Events for 1986 and 1979 Festivals .
Event Category Bands/Singers
Other Stage Events**
Water Events (Total)
Participatory - Viewing Only - Ships Open for Visits***
Military Demonstrations (Land)
Other land Events (Total)*'*** Participatory
- Viewing Only
Special Events (Total)
Fi reworks Jet Fly-Over Aerobatic Fly-Over (7 Shows) Sky Jump
TOTAL EVENTS
1986 No.* Rel, Frea.
Bl
41
24
9 8 7
4
8 4 4
3
I I I
50.31
25.5
14.9
5.6 5.0 4.3
2.5
5.0 2.5 2.5
1.8
0.6 0.6 0.6
)979 No,* Rel. Freg.
12
3
20
7 11 2
3
13 6 7
2
I
I
53
22.6%
5.7
37.7
13.2 20.8 3.8
5.7
24.5 11.3 13.2
3.8
1.9
1.9
* Number of events in each category approximate due to last minute program changes.
** *** ****
Includes dancers, demonstrations, etc. Each ship open for visitation counted as one festival event. Separate from military demonstrations on land; includes certain children's activities, races. ship crew competitions on land, street entertainment acts, etc .
61

62
Table 31. Comparison of Patrons' Opinions on Disappointing Aspects of the 1986 and 1979* Festivals.
Relative Freguency:** Major Oi sap pointing Features* ~ - Rank lll..2 · Rank***
Nothing S2.3% 39.3%
Parking 2.9 7 13.2 1
Restrooms 3.S 4 s.o 4
Food/Drink (Need More) 3.2 s 3.4 s Too Commercialized/Prices High 6.3**** 2 2 .1 7
Music {Diversity and Sound Systems} 2.9 7 0.1 9
Docking Facilities 3.0 6 0.7 8
Weather 7.S 1 -·***** Crowd Congestion/lines Too Long 6.1 3 10.4 2
Organization/Scheduling Events I. 7 8 3.0 6
Condition of Grounds 6.1 3
Other
•
•• ••• ****
*****
s.o 1S.O
In 1979 study of Harborfest patrons were asked to indicate the "least desirable feature" of the festival rather than "what feature had disappointed them" or "needed changing"; the questions are considered similar enough for this general comparison. Based upon 375 interviews {1986) and 1,336 interviews (1979) . Specified disappointing features are ranked in order of relative response frequency. Indicated by patrons as needing to be changed (based upon 317 interviews)i better indicates concern for problem than disappointing feature response of 2.7%. Not indicated in interviews.
•
•
•
•
•
•
•
•
•
•
•
REFERENCES
Archer, 8. and C. OWen. 1971. Towards a Tourist Regional Multiplier,
Regional Studies 5(4):289-294.
Dar. Debra. Southeast Virginia Planning District Conmission, Norfolk,
Virginia, personal conmunication.
63
Della Bitta, A., 0. Loudon, G. Booth and R. Weeks. 1977. The Economic Impact
of the Tall Ships '76 Celebration on Rhode Island. Marine Tech. Report
No. 59, University of Rhode Island, Kingston, RI, 35 p.
Knapp, J. and R. Cox. 1986. Projected 1986 Median Family and Median
Household Income. Tayloe Murphy Institute, Colgate Darden Graduate
School of Business Administration, University of Virginia,
Charlottesville, VA.
Lucy, J. 1981. Waterfront Festivals: Catalysts for Maritime Heritage and
Waterfront Redevelopment. Va. Sea Grant College Program, Virginia
Institute of Marine Science, Contribution No. 1017, College of William
and Mary, Gloucester Pt., VA. 8 p. (Reprinted 1n Current Municipal
Problems 9:338-343.
Lucy, J. 1986. Tourism: Boon or Bane? - Norfolk's Downtown Waterfront. !!l
Urban Waterfronts '85, Water Makes a Difference (A. Breen and 0. Rigby,
eds.) Conference Surrmary, The Waterfront Press, Wash., D.C.:82-89 .
Lucy, J. and S. Baker. 1979. Harborfest '79 Norfolk, Virginia: Analysis of
Patrons and their Expenditures. Special Report in Applied Marine Science
and Ocean Engineering No. 226, Va. Sea Grant College Program, Va .
Institute of Marine Science, College of William and Mary, Gloucester Pt.,
VA, 25 p •

64
Lucy, J., A. Breen and 0. Rigby. 1985. Urban Waterfronts: Positive
Directions, New Problems. Va. Institute of Marine Science Contribution
No. 1223, College of William and Mary, Gloucester Pt., VA, Va Sea Grant
College Program Reprint VSG-86-48R, 26 p. ln Proceedings of the National
Outdoor Recreation Trends Symposium II, Vol. II: Dept. of Parks,
Recreation and Tourism Mgmt., Clemson Univ:66-80.
Lucy, J. and T. Vance. 1982. The 22nd Urbanna Oyster Festival: Analysis of
Patrons and their Expenditures. Special Report in Applied Marine Science
and Ocean Engineering No. 257, Sea Grant College Program, Va. Institute
of Marine Science, College of William and Mary, Gloucester Pt., VA, 11 p.
Rei chert, A. and L. Love 11-Troy. 1978. The Economic and Socia 1 Impact of the
1977 Three Rivers Festival (unpublished report), Indiana Univ.-Purdue
Univ., Fort Wayne, 13 p.
Ritter, Terry. National Weather Service, Norfolk, Virginia; and Sam Mccown.
National Climatic Data Center, Asheville, North Carolina, personal
corrmun i cation.

•
•
•
•
•
•
•
•
•
•
•
Appendix A. Harborfest '86 Survey Instrument.
Date
Harborfest Visitor Survey VIMS, College of William and Mary
Interview No. ___ _
1. How did you arrive in the festival area? Harborfest Shuttle Bus~; Private Car ; Boat~; Ship __ Other (circle): walked, bicycle, motorcy~cab, ferry.
2a. Where do you live?---~=~---(City) (State) (Zip Code)
b. Where are you going to stay tonight? At home? ----,-------At the home of friends or relatives?-------' A hotel -motel? (specify name). Aboard a boat (or ship)? (power __ sail __ ); Will the boat be tied up at docks in the festival area?-~~~~---at a marina?{name) or anchored out __ _
c. For which nights of the festival are you using these arrangements? Thurs. __ , Fri. __ , Sat. __ or Sun. __
IF PERSON FROM OUTSIDE THE HAMPTON ROADS AREA, COMPLETE QUESTIONS 3 AND 4; (otherwise go to Question S.)
3a. How did you get to the Norfolk area? Car ; Bus ____ ~ Boat ; Plane ; As part of a tour package ___ _
b. How many days do you plan to be in the Norfolk area? _____ _ c. How many nights? _____ _
4a. Did you come to the Norfolk area primarily for the festival?~{Y or N) or are you also here for a meeting or convention? , business activity or vacation? (check).
b. If here for something other than the festival, did you try to plan your trip around the festival? Yes __ or No __ ; Somewhat ___ _
5. How did you learn about this year's Harborfest? Been before(Y/N) ; Number of Years~----Live nearby~ Newspaper~- Radio __ TV __ Magazine Posters Word of Mouth Other
6. What was your main reason for attending the festival? to have fun __ _ to do something different with family or friends ;other ____ _
7a. What has been your favorite activity so far? fireworks __ i ships __ ; water events in general __ ; music __ ; food __ ; other ___ _ What has been your second most favorite activity?----------
65
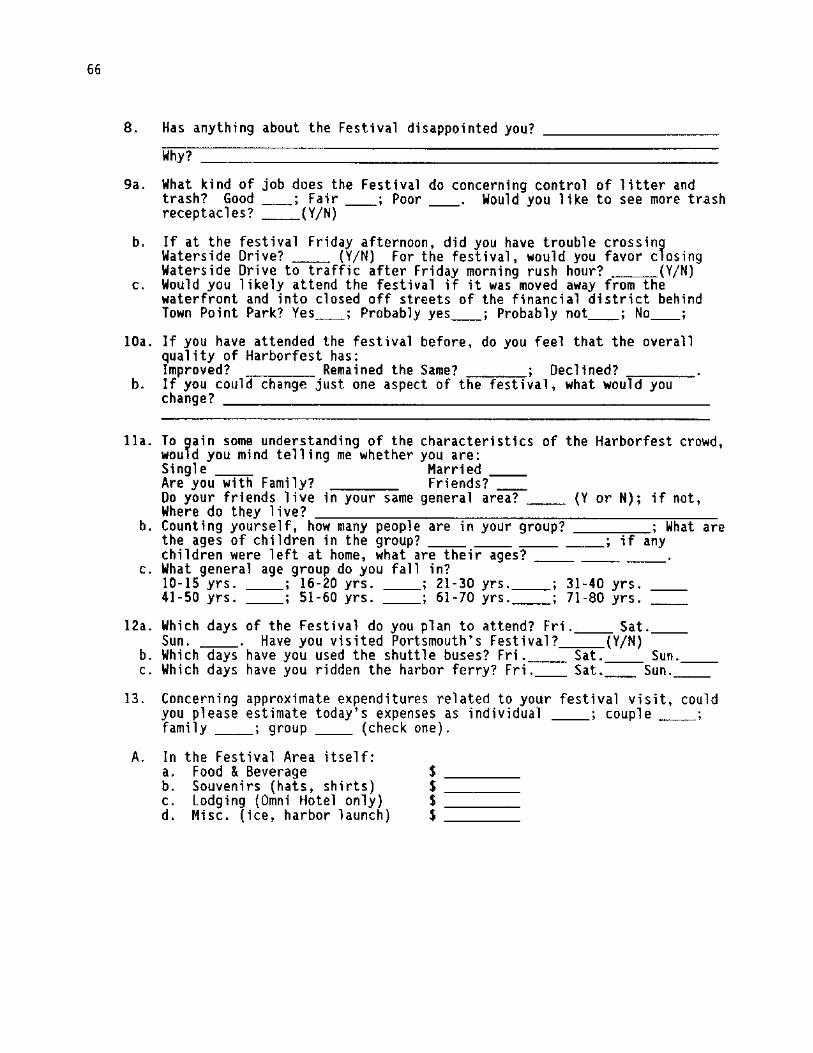
66
8. Has anything about the Festival disappointed you?~~~~~~~~~~
Why?~~~~~~~~-------------------
9a. What kind of job does the Festival do concerning control of litter and trash? Good __ ; Fair __ i Poor __ . Would you like ta see more trash receptacles? __ (Y/N)
b.
c.
10a.
b.
lla.
If at the festival Friday afternoon, did you have trouble crossing Waterside Drive? __ {Y/N) For the festival, would you favor closing Waterside Drive to traffic after Friday morning rush hour? (Y/N) Would you likely attend the festival if it was moved away from the waterfront and into closed off streets of the financial district behind Town Point Park? Yes __ ; Probably yes __ ; Probably not __ ; No __ ;
If you have attended the festival before, do you feel that the overall quality of Harborfest has: Improved? Remained the Sarne? ; Declined?~~~~ If you could change just one aspect of the festival, what would you change?~~~~~~~~~~~~~~~~~~~~~~~~~~-
To gain some understanding of the characteristics of the Harborfest crowd, would you mind telling me whether you are: Single __ Married __ Are you with Family? Friends? __ Do your friends live in your same general area? __ (Y or N); if not, Where do they live?-----~--~----~-----~~~-
b. Counting yourself, how many people are in your group? ; What are the ages of children in the group? __ ~- ____ ; if any children were left at home, what are their ages? ______ .
c. What general age group do you fall in? 10-15 yrs. __ ; 16-20 yrs. __ ; 21-30 yrs. __ i 31-40 yrs. __ 41-50 yrs.~-; 51-60 yrs.~-; 61-70 yrs. __ ; 71-80 yrs.~-
12a. Which days of the Festival do you plan to attend? Fri. __ Sat. __ Sun. __ Have you visited Portsmouth's Festival? (Y/N)
b. Which days have you used the shuttle buses? Fri. __ Sat. __ Sun.~-c. Which days have you ridden the harbor ferry? Fri. __ Sat. __ Sun. __
13. Concerning approximate expenditures related to your festival visit, could you please estimate today's expenses as individual __ ; couple~-; family __ ; group __ (check one).
A. In the Festival Area itself: a. Food & Beverage $ b. Souvenirs (hats, shirts) $ C. Lodging (Omni Hotel only) $ d. Mi SC. (ice, harbor launch) $
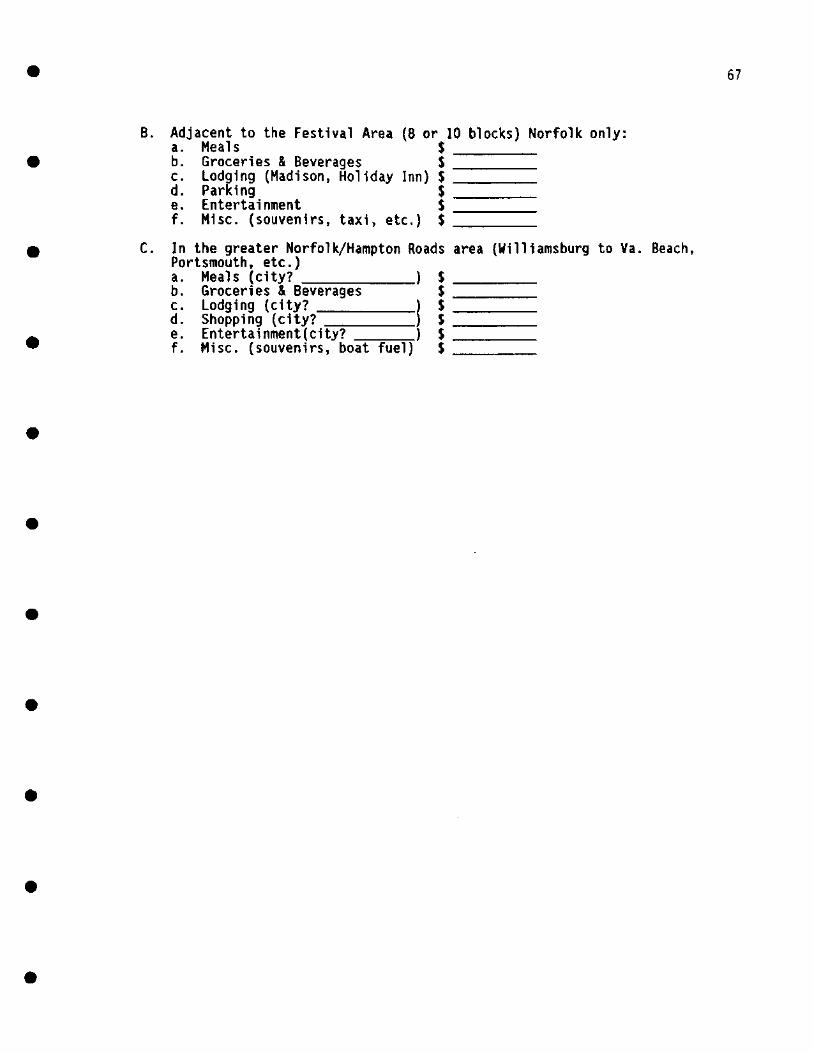
• 67
B. Adjacent to the Festival Area (8 or 10 blocks) Norfolk only: a. Meals s • b. Groceries & Beverages $ c. Lodging (Madison, Holiday Inn) s d. Parking s e. Entertainment s f. Misc. (souvenirs, taxi, etc.) s
• C. In the greater Norfolk/Hampton Roads Portsmouth, etc.)
area (Williamsburg to Va. Beach,
a. Meals (city? s b. Groceries & Beverages s c. Lodging (city? l s d. Shopping (city? s
• e . Entertainment(city? ) s f . Misc. {souvenirs, boat fuel) s
•
•
•
•
•
•
•
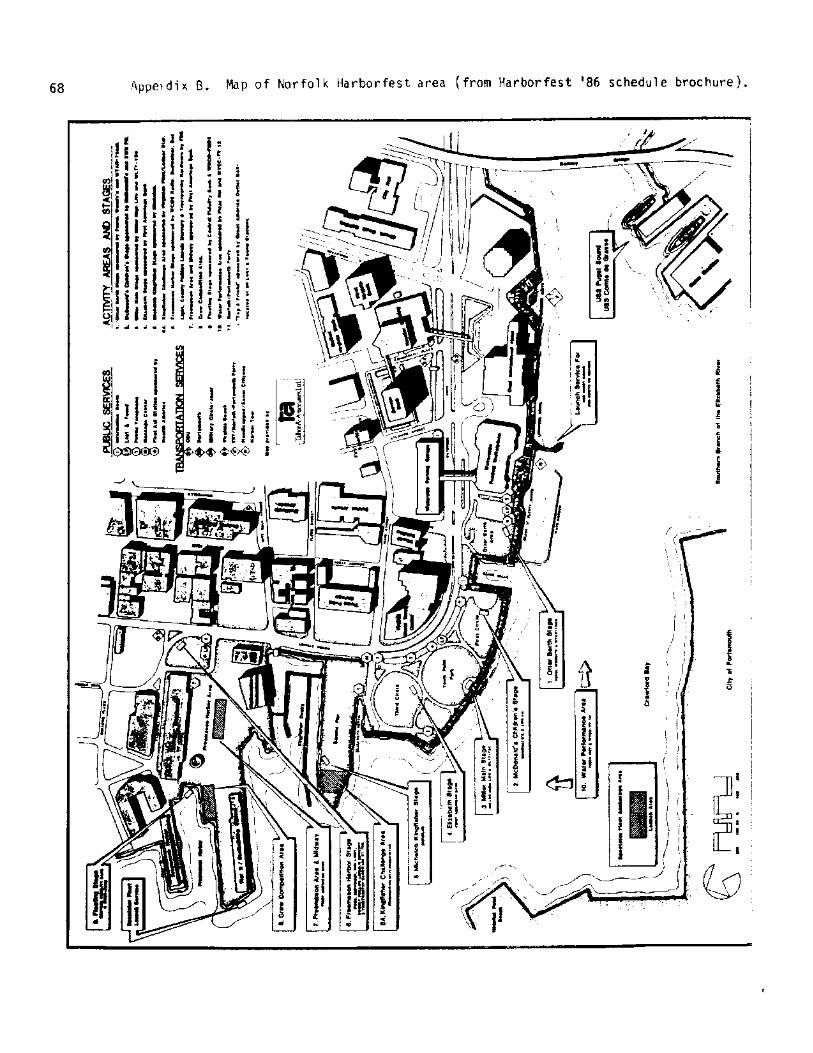
68 .i\ppe1dh B. Map of Norfolk Harborfest area (from Harborfest 1 86 schedule brochure).
I
i !
' i I
! I
\ \
' ! '! 1.
i·· ' ' ., I -.
l j! i ' ' ,i ' ' fr i l
ii '. I ' • ' : g ! '
\ I ;
·:1 -; I ,, ,, I! I
' ~i r-.. ' '
i' ' I:, ' 1 "'i !i ii •· 1. ; ' .,
~ I i
~! "· I , • I ' .. ; 11, I I L" l I! ' '
' ! l I ' '.
' I ' I ' l I ' ' ' ,~---' ' ~ - ·. ~,---.., I . ' ·" ,.-.
,----./~ ~: /.