Embed Size (px)
Citation preview

Joint Discussion Paper Series in Economics
by the Universities of
Aachen · Gießen · Göttingen Kassel · Marburg · Siegen
ISSN 1867-3678
No. 14-2009
Ivan Savin and Peter Winker
Forecasting Russian Foreign Trade Comparative Advantages in the Context of a Potential WTO Accession
This paper can be downloaded from http://www.uni-marburg.de/fb02/makro/forschung/magkspapers/index_html%28magks%29
Coordination: Bernd Hayo • Philipps-University Marburg
Faculty of Business Administration and Economics • Universitätsstraße 24, D-35032 Marburg Tel: +49-6421-2823091, Fax: +49-6421-2823088, e-mail: [email protected]
Gießen
Marburg
Kassel
Siegen Aachen
Göttingen MAGKS

Forecasting Russian Foreign TradeComparative Advantages in the Context of a
Potential WTO Accession ∗
Ivan Savin, Peter WinkerDepartment of Economics, Justus-Liebig University Giessen
{Ivan.Savin, Peter.Winker}@wirtschaft.uni-giessen.de
March 2, 2009
Abstract
This paper proposes a new approach of forecasting “prospective” com-parative advantages based on relative prices differences between coun-tries in the context of economic liberalization. An empirical analysisbased on the example of Central and East European countries thathave already passed the transition period from specialization mainlyin natural resource- and labor-intensive goods to “high-tech” goodsconfirms a significant influence of our “prospective” advantages oncomparative advantages dynamics. Using this method we identify a setof industries in Russia that seem to be most promising for formationof comparative advantages in the context of its economic liberalizationand joining the WTO agreements. These industries include high andmedium technological industries like machinery building, pharmaceu-tical products, railway transport, electronic and medical equipment.
Keywords: comparative advantage, competitive advantage, econ-omy in transition, Balassa index, Lafay index.
∗Financial support from the German Academic Exchange Service (DAAD) is gratefullyacknowledged.
1

1 Introduction
The modernization of the economy using newest technologies is the core toRussia’s long term economic strategy. To obtain this goal the governmentneeds to stimulate innovative activities of enterprizes and diversify Russianexport structure by gaining comparative advantages (CAs) in industries withhigh value added goods. Apparently, the existing instruments of the com-parative advantages theory assess dimensions of advantages at a particularmoment in the past or at present, whereas CA is a dynamic characteristic,i.e. it changes in the course of time according to economic development ofcountries (Grossman and Helpman 1991). Therefore, an instrument thatcould tackle the problem of forecasting CAs is required to provide an estima-tion on industries, which have prospects for stimulation of innovations. Forthe Russian economy this issue is even more important due to the transitionperiod in the economy and the necessity to set development priorities.
At the moment this area of research is seldom explored and contains onlya few scientific publications. Thus, Belousov (2006) based on the macroe-conomic trends suggests that the future CAs of Russia could be energy,scientific-research (generating innovative technologies and products), trans-port (international logistic services) and agriculture sectors. Rogov (2004)argues that the diversification of Russian foreign trade is possible in hightechnology industries by the use of public corporations as the most effectivemanagement instrument without providing any concrete suggestions for in-dustries where CAs will take place. Therefore, so far as we know research inthis area relies on intuitive approaches rather than theoretical analysis andquantitative assessments, and our research is intended to close this gap.
This paper is organized as follows. Section 2 provides an analysis ofthe comparative advantages theory and different approaches on measuringCAs. We present a new method of forecasting CAs dynamics in the formof a “prospective” comparative advantage index and describe main featuresof this index. In Section 3 the present state of the Russian foreign tradespecialization is explored and the index of prospective comparative advan-tages is empirically tested on the example of new EU member states. Basedon these results we identify industries with apparently higher potential forstimulation of CAs in Russia. Section 4 concludes.
2
2 The concepts of Revealed and Prospective
Comparative Advantages
2.1 Revealed Comparative Advantages
To analyze the Russian foreign trade structure we will use the compar-ative advantages theory that was originally introduced by David Ricardo(Feenstra 2004). It asserts that countries are specializing in goods they canproduce with less opportunity costs than other countries. This principle isby no means trivial as it asserts that even if a country has an absolute costdisadvantage in all goods, it will still benefit from international trade throughspecialization in goods where it has CAs. In the simplest case of two goodsand two countries it means that country A has a CA for the product thatthis country can produce most-best in comparison to country B, even if thisproduct is produced less productively than in country B. This implies thatthe country is relatively more efficient in producing goods with CAs so thatunder free trade its welfare will be improved by reallocating more resourcesto producing the goods with CAs and exporting them in exchange for moreimport goods (Leung and Cai 2005). Thus, a CA is established by costcomparison under autarky and under trade (Siggel 2006).
Possible reasons for this cost advantage include: differences in countriesendowments of factors of production, technologies, taxation, and consumers’preferences. The most popular theory of comparative advantages is theHeckscher-Ohlin theory (Feenstra 2004). This theory describes differencesin factor proportions among countries as a main reason of CAs. For furtherdetails on the comparative advantage theory see Dixit and Norman (1989).
The principle of comparative advantage is straightforward as long as onlytwo products are involved. The extension to a continuum of goods demon-strated by Dornbusch et al. (1977) confirms the principle as valid for a “con-tinuum of goods” and determines a “borderline”, according to which a coun-try has a CA in goods, that it can produce with less production costs thanother country. Further, Dornbusch et al. (1977) extend the analysis by requir-ing the usage of equilibrium prices to measure cost differences across countriesas non-equilibrium prices contain various distortions like trade barriers andexchange rate misalignments. Thus, cost comparison based on market pricescan not be the sole basis of a measure of CA. When costs are measuredin terms of distorted prices we deal with competitive advantage, which isnot the same as CA; having a CA implies that production costs in terms ofequilibrium factor prices are lower than those of an international competitor.
In order to measure the current trade specialization of a country and
3
its potential in the context of trade liberalization, we consider CAs indices.According to the principle of comparative advantages, trade patterns andexport specialization are determined by CAs (Feenstra 2004) that are diffi-cult to assess empirically, since the principle is based upon autarkic priceswhich we can not assess under free trade (Balance et al. 1987). There existnumerous alternatives to measure comparative advantages (Bruno (1965),Krugman and Hatsopoulos (1987), Porter (1990)). Balassa (1965) suggestedcalculating the Revealed Comparative Advantage (RCA) index as follows:
RCABij = (xij/Xwj)/(xi/Xw), (1)
where
xij export of good j by country iXwj world export of good jxi export of all goods by country iXw world export of all goods
If the Balassa index is greater (smaller) than 1 the country i exhibits arevealed comparative advantage (disadvantage) in good j. With other words,Balassa argued that country i exhibits a comparative advantage in good j,if its export of the good j, relative to world export of the good j, is largerthan the country’s market share in total exports.
Balance et al. (1987) classified different approaches to measure revealedCAs and tested their consistency. The authors highlighted two main classesof indices, namely those using data on trade, domestic production and con-sumption; and those using only trade data. The consistency tests based onthe comparison of correlation coefficients for alternative pairs of RCA in-dices, rankings of countries provided by the RCA indices and the extents towhich the indices agree in distinguishing between countries that enjoy CAs,showed that the index based on the “net export” approach (that uses onlytrade data) is the most reliable among all tested indices. Taking this intoaccount, a more appropriate index of CAs would be as follows:
RCANij = 100(xij −mij)/(xij +mij), (2)
where xij and mij denote the export and import of good j by countryi, respectively. The denominator in formula (2) represents the total tradevolume of good j of country i (Balance et al. 1987). This index is rang-ing between -100 and 100. In practice the absolute value of the index israrely larger than 10. The larger the index is, the higher is the foreign tradespecialization in industry j.
4
Another approach for CA assessment was proposed by Lafay (1992) andtakes intra-industry trade more closely into consideration. This is particu-larly important in the context of the globalization of the world economy,the growth of semi-finished goods trade flows and multinational compa-nies (MNC) that distribute the production process among their subsidiariesaround the world. The Lafay index (LFI) also has an advantage in compari-son to formula (2) as it is robust to macroeconomic distortions, since it takesthe difference between each item normalized trade balance and the overallnormalized trade balance into account (Zaghini 2005).
The Lafay index can be calculated for a given country i and for a givengood j as follows:
LFIij = 100
(xij −mij
xij +mij
−∑N
j=1(xij −mij)∑Nj=1(xij +mij)
)xij +mij∑N
j=1(xij +mij), (3)
where N is the overall number of traded goods. So the Lafay index mea-sures the contribution of each good to the overall normalized trade balance.Therefore, the sum of LFI indices for all goods equals zero. Positive valuesof the Lafay index indicate the existence of comparative advantages and viceversa.
In general we can conclude that the indices of revealed comparative ad-vantages assess advantages that exist and are realized in practice, but giveno information in regard to their future dynamics.
2.2 Prospective Comparative Advantages
It is both for the private and public sector in any particular economy cru-cial to know, what industries may exhibit CAs, which for some reasons arenot realized. This can efficiently help all current and potential actors to im-prove their economic strategy. Since CA tends to change over time due tochanges in technologies or factor endowments, a forecasting instrument ofCAs dynamics is required. Looking for an appropriate instrument we haveascertained that the existing approaches are mainly based on the investiga-tion of reasons for cost advantages and normally do not provide any detailedestimation of industries with a potential of CA.
The widely cited work of Grossman and Helpman (1991) noted thatdynamic comparative advantages arise “due to incipient cost advantage inR&D”. The authors devote their attention mostly to knowledge spilloversand its accumulation, as well as to the relative shares of R&D expenditures
5

in GDP, which are, in fact, instruments for stimulating comparative advan-tages, which is beyond the scope of this paper. We would rather aim toidentify the industries, where these instruments may be most advantageous.
As for empirical based analysis, the existing research (Marconi and Rolli(2008), Landesmann and Stehrer (2001), Montobbio (2003)) provides esti-mates of the potential impact of explanatory variables based on CA dynam-ics in the past, but do not enable to forecast CA dynamics in the future,mainly due to high variance across country specific characteristics and greatdifference of CA determinants across industries depending on their level oftechnology.
Here it is reasonable to note that we will use the classification of high,medium and low technology industries defined by Technological Performanceand Industrial Competitiveness (1986). Therefore, industries with a shareof R&D in output larger than 4% are characterized as high technologicalindustries (e.g., pharmaceuticals, microelectronics, aircraft), industries witha share of 1-4% are considered as medium technological industries (chemicals,motor vehicles, non-electronical machinery) and all other are categorized aslow technological industries (mining industries, textile, food).
Marconi and Rolli (2008) examined 16 emerging countries over the periodof 1985-2000 and showed that higher unit labor costs have a negative effect onCAs, whereas intensive physical capital accumulation and imports of capitalgoods have a positive effect only on medium and high technological industries.Similarly, Montobbio (2003) showed that R&D per employee positively affectsexport market shares, whereas industries are affected by R&D with differenttime lags, e.g. high technological industries are affected by R&D with a timelag of three years and medium technological industries are affected with atime lag of one or two years.
Stehrer and Woerz (2003) have determined and distinguished three typesof “catching-up” processes in productivity levels of less developed countries:first, the “continuous-convergence approach” with an equal speed of conver-gence across all industries; second, the “climbing-up-the-ladder approach”where the lagging country closes the gap in the low technological industriesbefore it can start to catch up with high technological industries and, third,the “jumping-up approach” where the lagging country catches up in the hightechnological industries from the very beginning. The authors have empiri-cally tested these “catching-up” patterns and concluded that these patternsdiffer substantially across countries in terms of industries, time and rate ofgrowth of the “catching-up” process.
To forecast the dynamics of CAs, we will consider relative prices of prod-ucts in different countries. Practically, we turn back to the initial idea ofthe comparative advantages theory: when two countries have different prices
6

of goods in autarky, and trade is allowed to be opened up, these countriesgain CAs in goods, which are less expansive than in another country. Thedifficulty in this case is that, as mentioned above, we cannot measure autarkyprices simply because we can not observe them (Balance et al. 1987). Animportant assumption that we make here is that we will consider commod-ity prices in countries under numerous trade barriers as approximations toautarky prices that will converge to international prices after economic liber-alization. Therefore, this forecasting instrument is suitable only for countriesthat exhibit rigid protectionist policies. In addition, these countries are as-sumed to be in the period of transition and are expected to liberalize theireconomy in terms of joining multinational free trade zones, e.g. WTO, EU.Here we should take into account that the Russian Federation is the onlylarge economy outside the WTO agreements and from this point of viewmay rather be considered, at present, as a closed economy.
Let us now turn back to the meaning of the differences in commodityprices across countries. When a country has a CA in a particular good, itcan produce an additional unit of this good while refusing to produce lessunits of other goods than an other country or the world economy in general.Therefore, the relative price of this good is also lower in this country thanelsewhere (Dixit and Norman 1989). In the case of an open economy, thecountry will export this good according to the Ricardo principle of CAs. Thisgood then becomes scarcer on the domestic market and, therefore, moreexpensive until it will be as expensive as on the foreign market. This isexactly the comparative advantage principle that is described in classicaland neo-classical trade theory (Siggel 2006).
But when trade barriers exist, this process is limited and domestic pricesdo not reach the level of international prices and some natural CAs are notrealized because of distorted prices. Therefore, based on relative price differ-ences we can conclude whether there is a prospective, but unrealized CA ornot.
As we have just argued, it is difficult to measure CAs based on marketprices due to various distortions presented by these prices (Siggel 2006). Tominimize these distortions we use relative producer price indices. This hasseveral reasons, which we will now discuss in detail.
First, since we compare advanced countries and countries in transitionwith a different structure of industrial output as compared to OECD coun-tries, we use price indices rather than absolute prices. This will eliminate theneed to translate the prices in one currency and will better suit our model ofheterogenous goods and levels of economic development. Moreover, compiledat different levels of aggregation, the indices are intended to be free of someof the defects of existing measures and more suitable for the calculation of
7
changes in quantities traded and for the analysis of the relations betweenprices and quantities (for further details see Diewert (1993)).
Second, the usage of relative prices to construct an indicator of an indus-try’s competitiveness was realized long ago. Indicators of competitivenesscalculated by the OECD’s Economics and Statistics Department are basedon the industry consumer price indices (Durand and Giorno 1987). Practi-cally, they use a relative industry price (relative to foreign competitors), withthe exchange rate translating it into US dollars.
Third, in contrast to Durand and Giorno (1987), we consider manufac-turer prices rather than consumer prices to measure industry competitive-ness, because they are less distorted by the state of competition on a par-ticular market and by possible misalignment of the exchange rate. In fact,producer prices are actual transaction prices of domestic production takingaccount of discounts and rebates, excluding VAT and all taxes and duties onthe goods as well as trade margin. As it was shown by Nakamura and Steins-son (2008) trade margin is stochastic and not fixed as a percentage from aproducer price and accounts for roughly 50% of consumer price instability.So we consider that manufacturer prices reflect changes in technologies incompanies to a larger extent than consumer prices that are not well suitedto measure competitiveness indices (Siggel 2006).
Durand and Giorno (1987) argue that the producer price indices vary inquality across countries due to their lack of homogeneity in terms of weightingand coverage. They argue that the main problem of using manufacturerprices is the difference in data collection across countries, in general, and apossible omission of some products from countries price indices, in particular.It is true, that the problem of economic data aggregation, in particular dataaggregation on prices (Balk 1983), is very complicated. But we must keep inmind that, in first instance, we suggest using producer prices with a fine levelof commodity detail (classification of goods of 3- and 4-digits) rather thanon the high level of aggregation, at which the criticism is primarily directedand, in second instance, we propose to use (if possible) a unified database,e.g. Eurostat, for all countries in the scope as a source of industrial outputprices to minimize the risk of omitted goods.
Thus, we use an indicator of competitiveness, or in other words “com-petitive advantage”, as a forecasting instrument for CAs in the context ofeconomic liberalization. Here we need to admit that it is very unlikely toeliminate all artificial distortions that take place in the real economy, e.g.,exchange rate misalignments. But it is beyond the scope of this paper toapproximate “true natural” CAs. We rather try to forecast CAs that takeplace in the real economy with a minimum of trade barriers and can be mea-sured by indices of revealed CAs like the Balassa index based on the trade
8

statistics (see Leung and Cai (2005), Siggel (2006)).We call the index that forecasts CAs based on relative price differences
the Prospective Comparative Advantage (PCA) index. Thus, prospectiveadvantage takes place when a country has a CA, but it is not exploited (e.g.because of trade barriers). The PCA index is defined as follows:
PCAij =ph
it
phjt
/pf
it
pfjt
, (4)
where
phit price index of good i on the domestic market in period tph
jt price index of good j on the domestic market in period t
pfit price index of good i on the foreign market in period t
pfjt price index of good j on the foreign market in period t
We denote a base good as j. In our case it is an overall producer priceindex (including good i). Prospective comparative advantage takes placewhen the relative price on the domestic market is lower than on the foreignmarket. An index value less than 1 reflects a prospective comparative advan-tage in this industry. The lower the index is, the higher is the prospectivecomparative advantage.
The PCA index may be seen as an extension of the Domestic ResourceCost (DRC) criterion proposed by Bruno (1965). This criterion is knownas an alternative measure of revealed comparative advantages. The maindifference is that instead of measuring the relation of total domestic costs perunit of a product to free-trade price of comparable output in absolute values,we measure producer price indices of goods in relation to the base goodamong two countries. Measuring competitiveness among countries undertrade barriers and presuming economic liberalization in the nearest future,the PCA index provides a forecast of industries in which CAs are likely toarise rather than assessing CAs that are already realized.
Calculating the PCA for Russia we can consider Germany, the biggesttrade partner of Russia, or the European Union as a whole as the foreigneconomy, which can be considered as liberalized economies and with priceindices structures close to the world economy. The choice of the EU as theforeign economy is also supported by the fact that the EU has the highestdegree of product coverage in its trade pattern with Russia (Brenton et al.1997). It is also important to note that the more similar the industrialstructure of the foreign economy is, the more exact is the PCA index due to
9

the comparability of overall producer price indices. For Russia and the EUit is not exactly the case due to a significant prevalence of mining industriesin the Russian economy as we will see in Section 3 of this paper.
2.3 Implications of the Prospective Comparative Ad-vantages index
If the PCA is lower than 1, we may conclude that industry i is undervaluedin comparison to the overall industrial output, i.e. prices in a particularindustry grow slower than the overall price index in comparison to a foreigncountry, and when the PCA is higher than 1, industry i is overvalued incomparison with the overall output, i.e. prices in this industry rise faster thanthe overall price index as compared to the foreign economy. After economicliberalization an inefficient use of resources will hardly be maintained, pricesin undervalued industries will most likely rise and the optimal strategy wouldbe to arrange conditions under which resources from overvalued industriescould freely float into undervalued industries.
To make it easier to understand, let us take a concrete calculation exam-ple: consider Russia for h and Germany for f . We will consider medical andsurgical equipment for i, an overall industrial price index for j and will cal-culate the PCA index in 2007 (t). We use chain indices, so that price indicesof 2006 are all assumed to be equal 100. Thus, ph
it= 102,1 (which means thatthe producer price for medical and surgical equipment has changed slightlyin Russia in 2007 in comparison with 2006), ph
jt= 125,1 (the manufacturer
prices in Russia have risen dramatically in 2007), pfit=100,1 and pf
jt=100,4(the prices in Germany of an overall industrial output as well as of medicaland surgical equipment in particular have not risen much, at least in com-parison with Russia). Then, according to formula (4) the PCA equals 0,823and gives a signal that this Russian sub-industry is undervalued, prices inthis industry are likely to rise after economic liberalization and, therefore,this industry is prospective for investments.
Measuring the PCA indices has several obstacles. First, the PCA is adynamic characteristic. Therefore it may be distorted, e.g. by price bounces.Second, the PCA is dependent on initial conditions. For example, if theprice of a good initially equaled 1 and has risen to 3, then the growth rateis 300%, but if the price initially equaled 2, then the growth rate is only50%. So as we see, a change of 50% in initial conditions has led to a moresignificant change in the PCA. It may therefore become problematic to makeconclusions based on a quantitative comparison of PCA indices. Third, thisindex is effective when the share of traded goods (international trade) is
10

small relative to GNP, i.e. the closer is an economy to autarky, the betterwe can measure autarky prices and the more informative is the PCA index.Finally, the PCA is also influenced by the exchange rate. When a currency isundervalued, it stimulates net exports and reduces the share of internationaltrade in GNP. Imported goods become more expensive (in terms of ph
it informula 4) on the domestic market than on the foreign market and this willartificially reduce prospective comparative advantages, e.g., industries maybe estimated as overvalued, when in fact they are not. Therefore, in caseswhere exchange rate distortions are present, the actual PCA value need tobe assumed higher than the value of the index. It is not to oversee thatan undervalued exchange rate also affects revealed comparative advantages(RCA) but in the opposite direction: it stimulates export of goods, whichare not characterized as advantageous for a particular country.
Thus, we need to admit that the measurement of the PCA index as ofany other index of competitive advantage is in a large measure a matterof trade-off with available data. In addition, some technical considerations,e.g., collecting and matching the price indices with different classifications ofgoods, arise in the calculation of the prospective advantages index.
The PCA index should not be considered isolated from other economicindicators, in particular from the indices of revealed comparative advantages,e.g., the Lafay index. This is because of various factors that may lead to over-and undervaluation of prices in a particular industry. After all, we considernot autarky economies, but economies with high trade barriers that are stillable to trade. Thus, undervaluation can be explained not only by lowerproduction costs in a given country, but also by intensive competition on themarket. Overvaluation in turn can result from favorable international prices.For a summary see Table 1.
Therefore, to explore whether a prospective CA is presented in a partic-ular industry or not we need to consider the PCA index in conjunction withother instruments like RCA index.
3 Empirical application
3.1 Data description
To compute the Revealed Comparative Advantage index for new EU mem-ber states and the Russian Federation we use data from the COMTRADEDatabase of the United Nations Statistics Division (UNSD) at the Harmo-nized System (HS), 2-digit, and for some particular industries at the 4-digitlevel covering the period of 2002-2006. These data are available in US dollars.
11
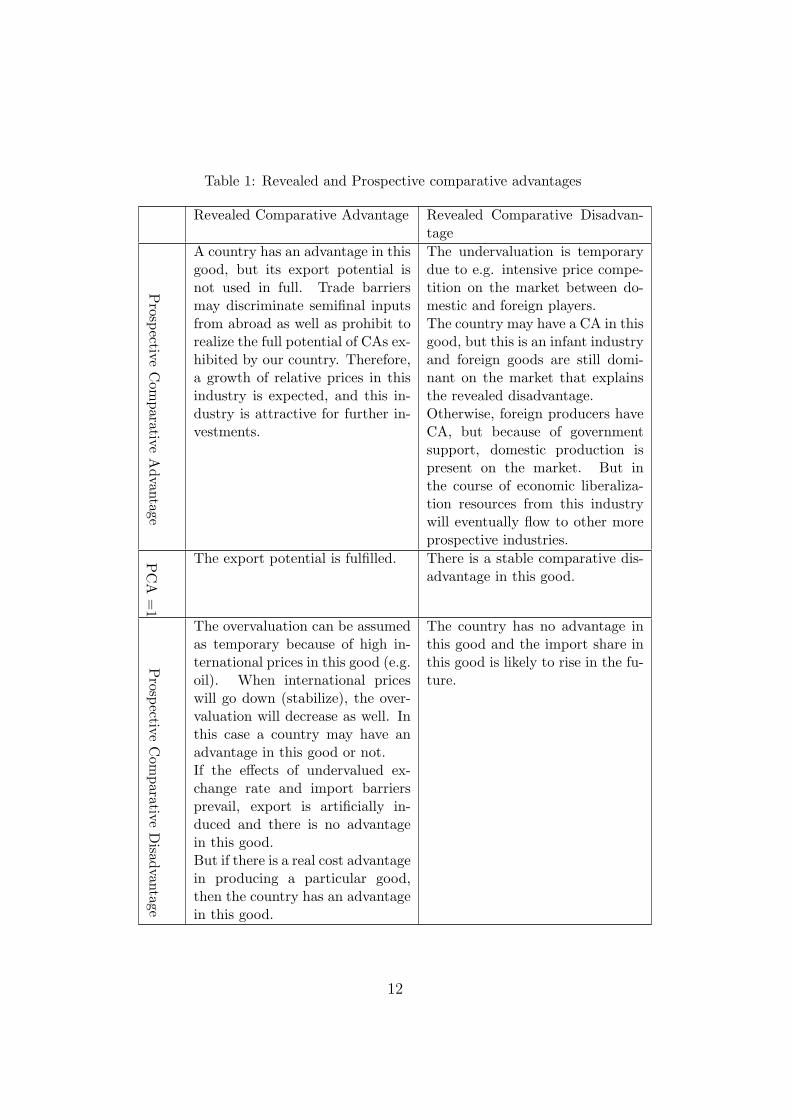
Table 1: Revealed and Prospective comparative advantages
Revealed Comparative Advantage Revealed Comparative Disadvan-tage
Prospective
Com
parativeA
dvantage
A country has an advantage in thisgood, but its export potential isnot used in full. Trade barriersmay discriminate semifinal inputsfrom abroad as well as prohibit torealize the full potential of CAs ex-hibited by our country. Therefore,a growth of relative prices in thisindustry is expected, and this in-dustry is attractive for further in-vestments.
The undervaluation is temporarydue to e.g. intensive price compe-tition on the market between do-mestic and foreign players.The country may have a CA in thisgood, but this is an infant industryand foreign goods are still domi-nant on the market that explainsthe revealed disadvantage.Otherwise, foreign producers haveCA, but because of governmentsupport, domestic production ispresent on the market. But inthe course of economic liberaliza-tion resources from this industrywill eventually flow to other moreprospective industries.
PC
A=
1
The export potential is fulfilled. There is a stable comparative dis-advantage in this good.
Prospective
Com
parativeD
isadvantageThe overvaluation can be assumedas temporary because of high in-ternational prices in this good (e.g.oil). When international priceswill go down (stabilize), the over-valuation will decrease as well. Inthis case a country may have anadvantage in this good or not.If the effects of undervalued ex-change rate and import barriersprevail, export is artificially in-duced and there is no advantagein this good.But if there is a real cost advantagein producing a particular good,then the country has an advantagein this good.
The country has no advantage inthis good and the import share inthis good is likely to rise in the fu-ture.
12
The data on the LFI indices for new EU countries in the period of 1993-2001 that we use in our empirical estimation were kindly provided by AndreaZaghini (Center for Financial Studies, Frankfurt).
One of the problems in calculating the Prospective Comparative Advan-tage index of a country group including CEE countries and Russia is, first,to obtain data for the producer price indices with a detailed classification ofindustries and sub-industries for a period from the beginning of the 1990s.
Unfortunately, it turned out to be impossible to find detailed price indicesof these countries for the period 1993-1996. Therefore, we will calculate andcompare PCA indices for the period 1997-2004. Moreover, for the CzechRepublic, Hungary and Slovenia we can calculate the PCA index only since2001-2002 due to data limitations. Nevertheless, we need to keep in mindthat the EU enlargement took place only in 2004 and the Central EuropeanFree Trade Area (CEFTA) and the Baltic Free Trade Area (BFTA) formedby these countries at the beginning of the 1990s have abolished duties onmost of the industrial goods with the European Union only in 1997 (Adamet al. 2003). Therefore, we presume that by 1997 the relative prices were notfully adjusted yet and calculation of the PCA index for the period 1997-2004will provide us with meaningful estimates.
Due to data limitations for producer price indices for new EU countrieswe use the harmonized indices of consumer prices (HICP) to calculate thePCA indices. As a consequence we are able to compare relative prices mostlyon consumer products and not on the semi-finished goods. The data coversthe period of 1997-2007, but with substantial differences in availability acrosscountries and industries.
For the EU countries we use data from the Statistical Office of the Euro-pean Communities (Eurostat) Database. For the Russian Federation we usedata for the consumer and producer price indices from the Russian FederalState Statistics Service (Rosstat). Calculating the PCA index for Russiabased on consumer prices we are forced to match two different classificationsof goods and services, one is COICOP provided by Eurostat and another oneof the Russian Rosstat. Calculating the PCA index based on the producerprices we have the same problem by matching the NACE classification forthe EU countries and the classification of Rosstat. All three datasets have adetailed classification of goods, at the 2-, 3- and 4-digits. We consider thatthese classifications of goods are similar and conclude that the matching willnot seriously affect our results.
13

3.2 The example of the new EU Member States
To test the mechanism of Prospective Comparative Advantages we use anexample of the new EU member states, in particular Poland, the CzechRepublic, Hungary, Slovenia, Slovak Republic, Cyprus, Malta, Lithuania,Latvia and Estonia. These countries may be easily split in two groups. Thefirst group is formed by Poland, the Czech Republic, Hungary, Slovenia, Slo-vak Republic and the Baltic states that were members of the former socialistbloc. So the structural organization of their economies at the beginning ofthe 1990s may be considered as close to the system that Russia had at thatperiod of time. The remaining countries, Malta and Cyprus, were taken tocomplete our analysis with a different type of economies that have never beenplanned economies. We have chosen these countries because they have re-cently passed transition periods of their economies. In addition, most of theseCEE countries as well as Russia have a larger share of skilled-labor force incomparison to other developing countries (Bardhan and Kroll (2006), Zagh-ini (2005)). So we can draw a parallel between initial conditions that thesecountries had at the beginning of the 1990s and conditions in which Russiais situated at the moment.
According to Zaghini (2005) most of these countries had excessive nat-ural, labor and land resources in comparison to other EU countries, so itis not surprising that in the period of 1993-1994 they mainly specialized insectors where these resources are used more intensively, namely products ofsteel and glass, simply worked wood, vegetables and fruits. Zaghini (2005)showed that these countries managed to gain CAs during a period of tenyears in which they were weak at the beginning of the liberalization process,notably in some medium and high technological industries, e.g., transportand machinery building, electronics. The author explains this success by the”advantage of backwardness” (Gerschenkron 1962) together with significantinvestments both from the side of governments and from EU countries andby substantial technological transfer as a part of the FDI inflows that wassuccessfully adopted thanks to the endowment of a skilled labor force.
The realization of this scenario could be a reasonable policy in purposingthe Russian Government objectives until 2020. Understanding what was thegeneral characteristic of these industries in CEE countries will help us toreveal prospective industries for investments and stimulating CAs in Rus-sia. Our idea is that these “successful” industries were undervalued (hadprospective advantages) and thanks to the inflow of new technologies andinvestments became realized.
Zaghini (2005) used the Lafay index (LFI) and the world export share(WES) to assess CAs at the beginning of the liberalization period (1993-
14
1994) and after 7 years of reforms (2000-2001). For example, the CzechRepublic specialized in simple products of glass, iron and wood with a minorspecialization in passenger motor cars in the period of 1993-1994. But by2001 it has trebled its world export share in motor vehicles and significantlyenlarged its revealed advantages not only in this industry, but also in relatedindustries like parts and accessories of motor vehicles, and also in electricalmachinery.
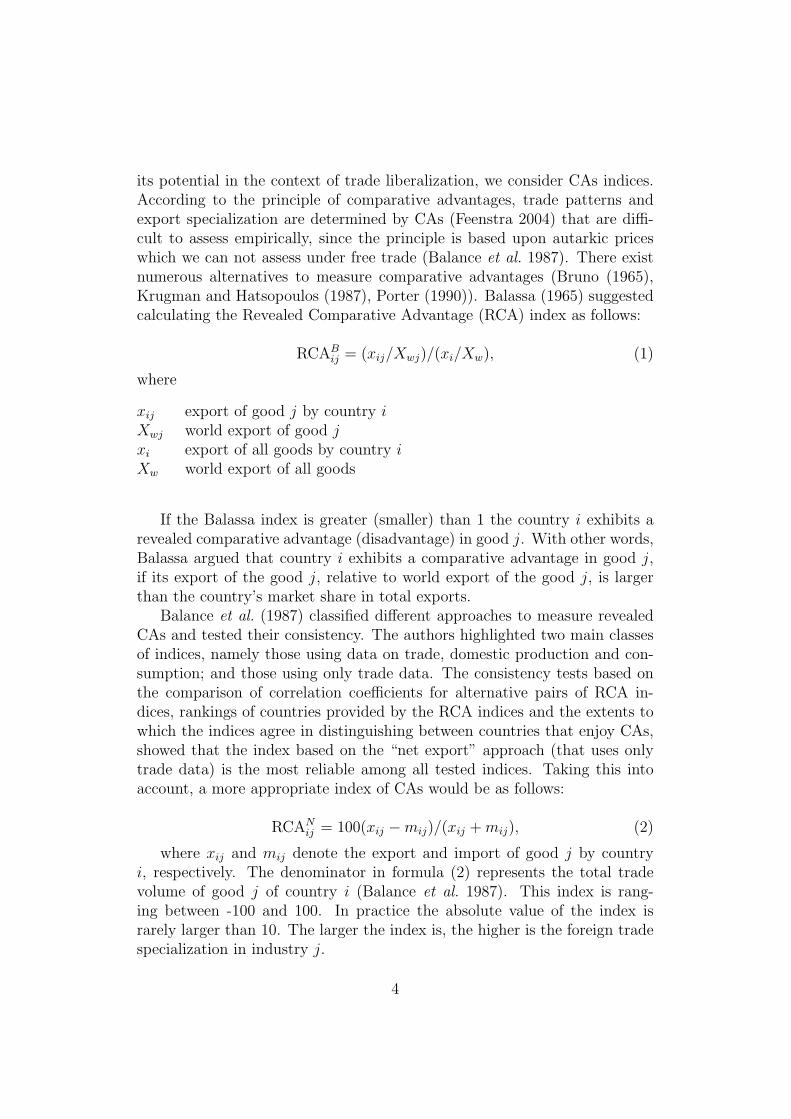
Our idea is to calculate the PCA index described in the first part of thispaper for industries, in which these countries have gained substantial CAsand to evaluate whether our index has “forecasted” future success of theseindustries. We calculate the PCA index based on consumer price indices fornew ten EU member countries using the EU as a foreign economy. Thus, weexpect to find that the “successful” industries were undervalued in terms ofrelative prices in 1997 and these prices have converged to the internationalfree-trade level (the level of the EU) by 2004.
As we found out, based on the PCA index Estonia, Lithuania, Latvia, Slo-vak Republic, Poland and Malta had prospective advantages in telecommu-nication, furniture, clothing, electrical equipment, transport and petroleumindustries in 1997. These industries got revealed CAs in the trade structureof these countries by 2004 according to the LFI index.
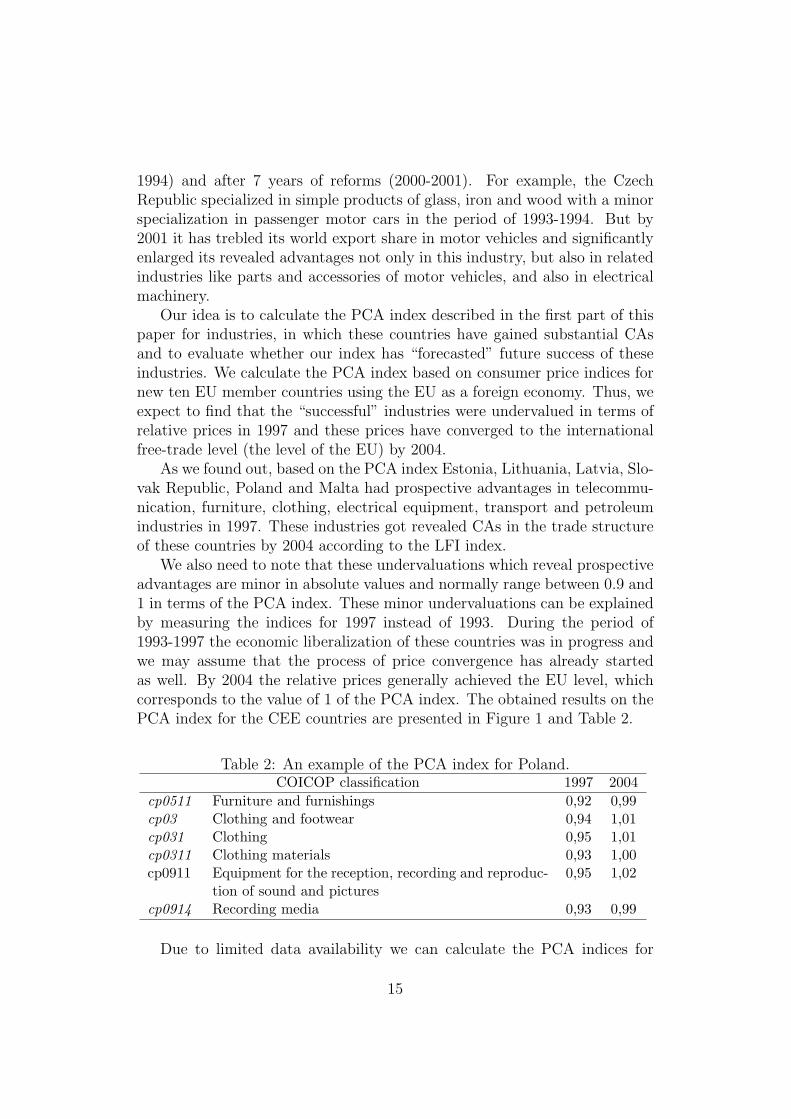
We also need to note that these undervaluations which reveal prospectiveadvantages are minor in absolute values and normally range between 0.9 and1 in terms of the PCA index. These minor undervaluations can be explainedby measuring the indices for 1997 instead of 1993. During the period of1993-1997 the economic liberalization of these countries was in progress andwe may assume that the process of price convergence has already startedas well. By 2004 the relative prices generally achieved the EU level, whichcorresponds to the value of 1 of the PCA index. The obtained results on thePCA index for the CEE countries are presented in Figure 1 and Table 2.
Table 2: An example of the PCA index for Poland.COICOP classification 1997 2004
cp0511 Furniture and furnishings 0,92 0,99cp03 Clothing and footwear 0,94 1,01cp031 Clothing 0,95 1,01cp0311 Clothing materials 0,93 1,00cp0911 Equipment for the reception, recording and reproduc-
tion of sound and pictures0,95 1,02
cp0914 Recording media 0,93 0,99
Due to limited data availability we can calculate the PCA indices for
15

Figure 1: PCA indices for 1997 and 2004 for seven CEE countries.
Slovenia, the Czech Republic and Hungary only since 2001-2002. Thus, forexample, in Hungary there were no prospective advantages to be observedin telecommunication or automatic data processing industries by 2002. Wecan assume that these industries are flexible in relation to price changes andadjustments. In contrast, production of meat and the motor car sector wereundervalued even in 2002. We have calculated that in these two industriesthe indices of LFI and the world export share have generally increased by2006 up to 1.01 and 0.7 respectively in passenger motor cars - and up to0.28 and 0.95 in production of meat. It means that the prospective advan-tages that Hungary still had by 2002 were realized by 2006. Thus, we candraw a parallel with the “catching-up” process observed by Stehrer and Wo-erz (2003): the speed of convergence in price levels between developed anddeveloping countries that leads to changes in trade specialization patternsdiffers across industries, where this convergence process takes place.
A different example is shown by Cyprus. In this country the relativeprices have significantly dropped after joining the EU, below the Europeanrelative price level. As an example, the relative prices of fruits and vegeta-bles have decreased in terms of the PCA index from 1.05 and 1.12 to 0.95and 1.00, respectively. This overvaluation can also be observed on Figure1. As a result, the LFI and the world export share for fruits as well as forvegetables have decreased. This may indicate that overvaluation by the endof the 1990s was caused by high import duties in Cyprus before joining theEU. In fact, in comparison to other European countries before their acces-
16
sion to the EU Cyprus had high import tariffs (average tariff 37.6 percent)especially on agricultural products (with average rates above 60%) togetherwith substantial export subsidies. It also should be noted that Cyprus is afairly small economy, a net importer of manufacture goods, with 70 percentof GDP and foreign exchange receipts generated in services (Cyprus: June1997 (1997)).
Having only very fragmented data on producer price indices we have cal-culated the PCA index that supports the results we have obtained on theconsumer prices. Thus, the Czech Republic had prospective advantages intransport equipment and Lithuania had prospective advantages in produc-tion of outer garments and electrical machinery and equipment in terms ofmanufacturer prices as well. Since the data on producer price indices is veryfragmented for CEE countries, we can not provide more detailed results.
The fact that we have got consistent results of PCA index for the CEEcountries based both on producer and consumer price indices can be ex-plained by changes in exchange rate regimes among these countries in 1997.In this period the exchange rate regimes of these countries, which differedconsiderably at the beginning of the 1990s, became oriented towards theEuro (Backe 1999). Therefore, possible distortions of the PCA index due toexchange rate misalignments have not significantly affected the results.
To assess the forecasting power of the PCA index we tested it using thefollowing equation:
LFIdiffij = α + βPCA1997
ij + ε, (5)
In this equation, LFIdiff stands for the absolute change (increase or de-crease) of the Lafay index in the period from 1997 to 2001. This was done tomeasure the assumed effect of the PCA and to minimize the country charac-ter specialization in particular industries. Thus, Slovak Republic in 2001 hasa Lafay index in passenger motor cars of more than 6, but the real improve-ment of the index during the period of 1997-2001 was about 4. PCA1997 isthe calculated PCA index for 1997. We test the equation (5) on industrieswith a 3-digit level on 7 countries: Poland, Slovak Republic, Latvia, Lithua-nia, Estonia, Cyprus and Malta (for which price indices are available since1997). These industries were chosen independently from the fact whether achange in the LFI index is to observe in the period or not, according to onlyone criterion, namely data availability.
The results are presented in Table 3. Firstly, we have estimated ourequations on goods from low, medium and high technological industries (totalsample). Then, we have estimated the equations only on medium and hightechnological goods (subsample 1). Finally, we have also tested equation
17

Table 3: Regression results.
Total sample Subsample 1 Subsample 2β -9.98 -15.79 -11.04Std. Error 0.74 1.78 1.29P-value 0.000 0.000 0.000R2 0.48 0.49 0.49N 200 81 74
(5) only on industries, where a change of the LFI index was larger than 0.5in absolute value (subsample 2). The subsample 2 was constructed to test,whether a significant difference in estimates compared to the total sampleexists or not.
We have also tested a modification of equation (5) using logarithm of thePCA index and obtained almost the same results as for absolute values ofthe PCA index. This is due to the type of the PCA values, i.e. around 1,normally in the range from 0.8 to 1.2.
In addition, we have tested equation (5) controlling for possible country-specific effects using dummy-variables. As a result, no significant country-specific effects have been obtained.
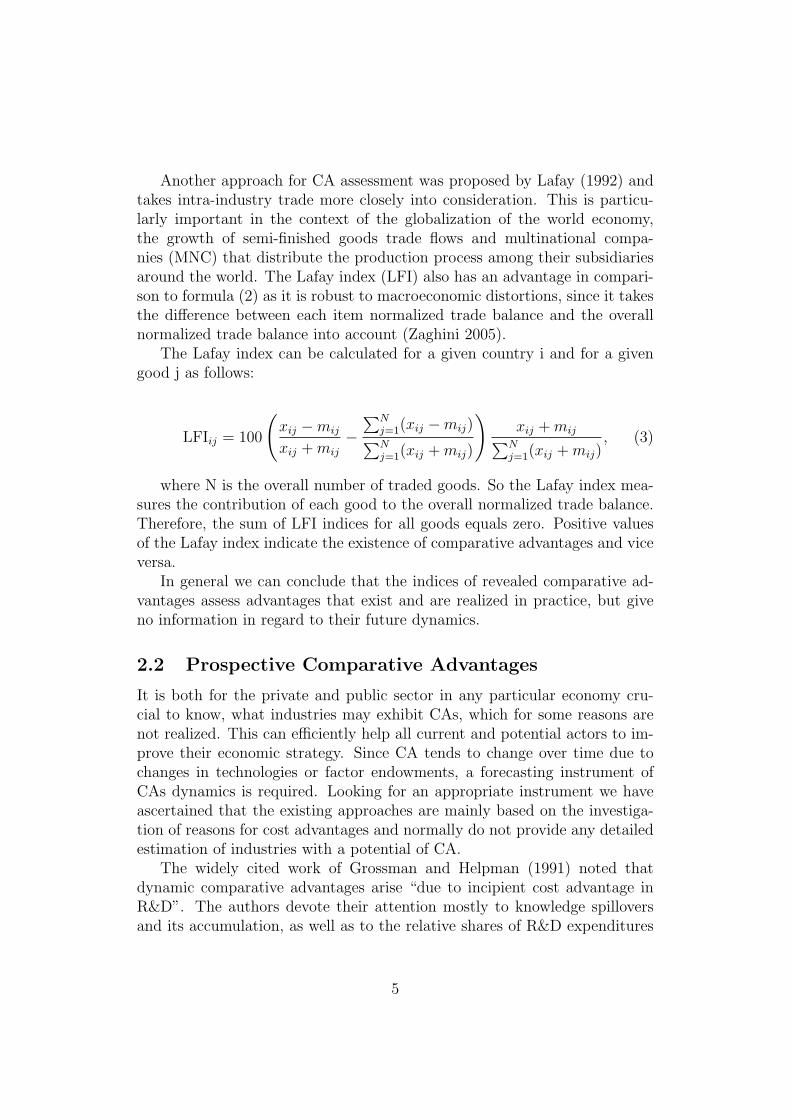
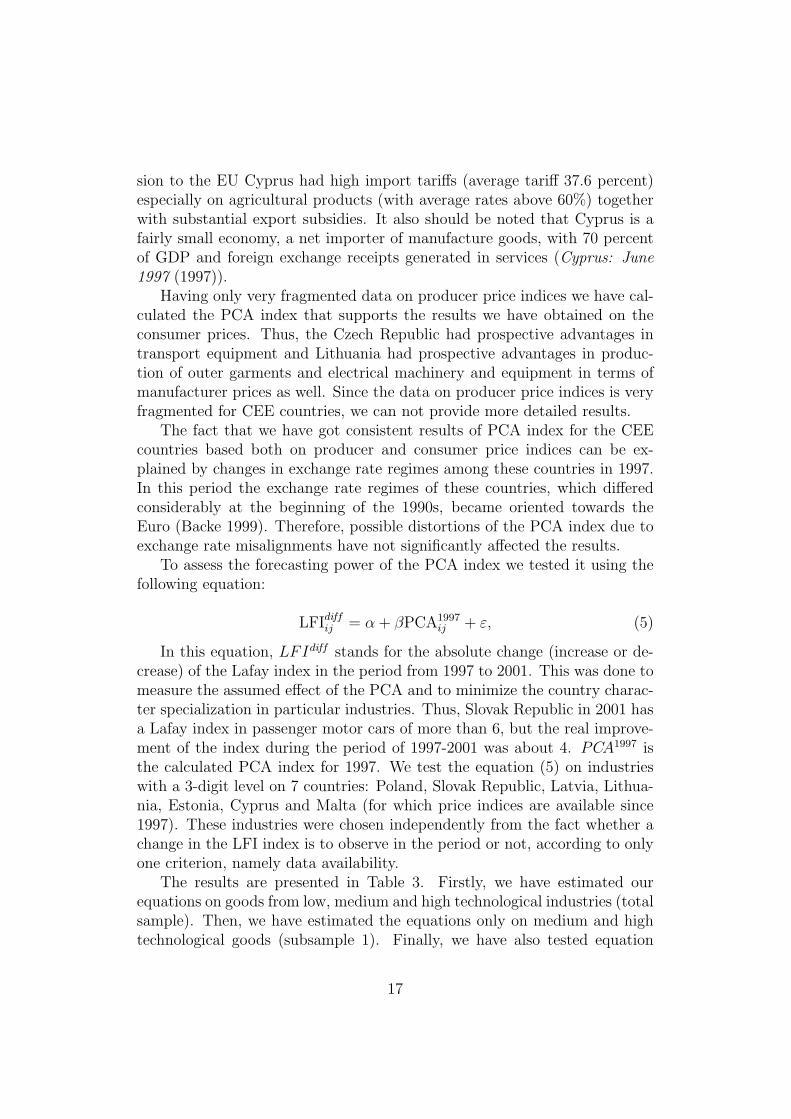
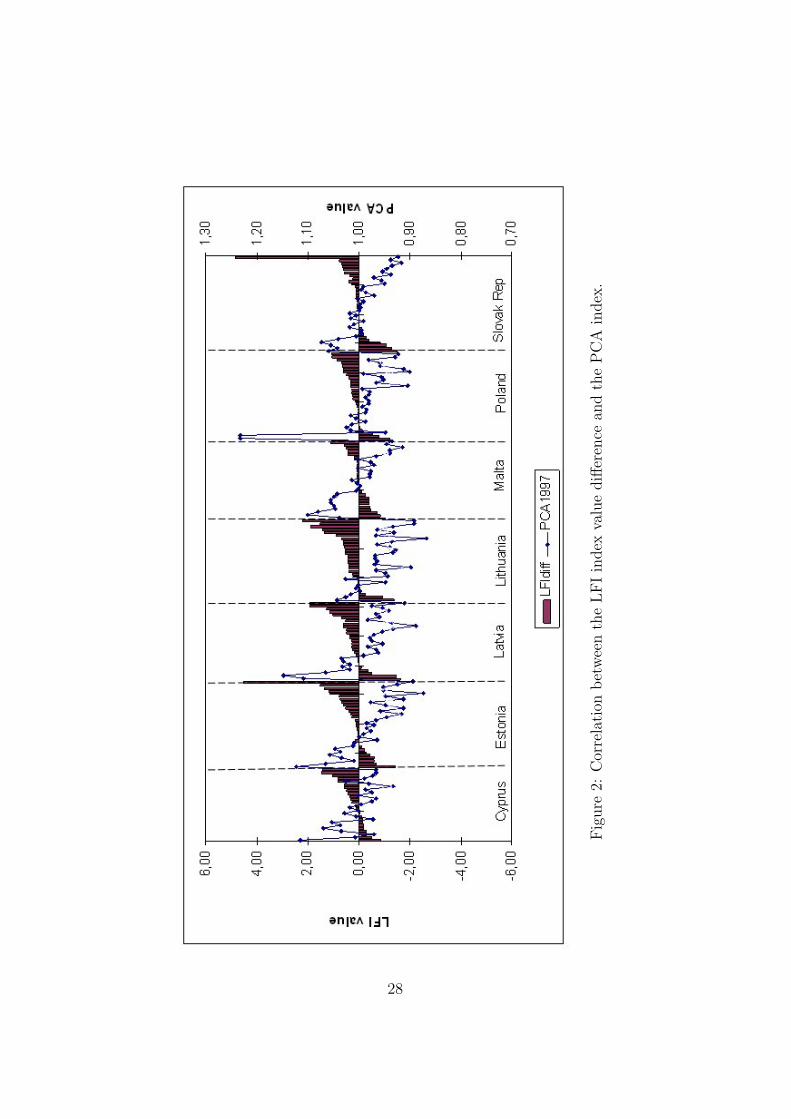
Looking at Table 3 we see that the explanatory power of the index remainsalmost the same for all three samples (which is approximately 49% and quitewell for a cross-section analysis with only one explanatory variable). Thevalue of β - which is in all cases significantly different from zero - differs acrossthe subsamples. β is substantially higher for the industries with a significantchange in the LFI value, and even higher for the subsample of medium andhigh technological products. It means that in the case of medium and hightechnological products a negative/positive change in the PCA index of 0.1(10% higher under- or overvaluation of prices) leads to an increase/decreasein the value of the Lafay index of roughly 1.6, i.e. industries that wereundervalued in 1997 experienced a growth in CAs. This negative correlationof the change in the LFI value and the value of the PCA index can be observedon Figure 2 in the appendix, where LFI and PCI indices are grouped bycountry.
To conclude, we observe a robust significant influence of the PCA indexon the CAs dynamics.
18
3.3 Russian revealed and prospective comparative ad-vantages
3.3.1 Revealed comparative advantages
Let us now turn back to the comparative advantages theory and considerdynamics of CAs indices of Russia during the last years. The RCA indicesanalyze the current structure of international trade. Table 4 in the appendixpresents a short review of obtained revealed comparative advantages of Rus-sia in the form of LFI indices, starting from industries with the highestadvantages and presenting the most disadvantageous industries in the end ofthe table.
Thus, we see that Russia’s main CAs are linked to hydrocarbons (oil, gas,coal) and some other resources (woodworking industry, non-ferrous metalsand fertilizers). Medium and high technology industries are characterizedmainly as disadvantageous in Russian exports.
Moreover, in contrast to most of the developing countries whose tradestructures have become more diversified in the last decade (Woerz (2005),Marconi and Rolli (2008)) the structure of Russian foreign trade has becomeeven more concentrated in the period from 2002 to 2006. For example, inpharmaceutical products and motor cars the revealed disadvantages havesignificantly increased. The only exceptions among medium and high tech-nology industries are nuclear reactors and turbo-jets, which are characterizedas advantages, but very specific ones.
3.3.2 Prospective comparative advantages
As it was already pointed out in Section 2, the PCA index based on manu-facturer prices is less distorted. Nevertheless, analyzing the prospective CAsof Russia we consider the PCA index based both on consumer and producerprices to compare the results and to try to explain possible deviations.
Calculating the prospective advantages for Russia, we need to remem-ber that according to the existing Exchange Rate Deviation Index (ERDI)the Russian rouble is still clearly undervalued (Tiusanen 2007). This indexof undervaluation was extreme after the economic crisis in Russia in 1998(roughly by factor 3) and has gradually decreased during the last ten yearsto about 1.8. This leads to a competitive advantage of Russian companiesin terms of absolute prices. That points out that Russian companies havea competitive edge and an import potential in Russia may not be full ex-ploited, i.e. the domestic market is protected by the undervalued rouble.Therefore, the undervaluation of prices measured by the PCA index may not
19
be as significant as it really is, the PCA index based on the consumer pricesexhibits a significant exchange rate distortion.
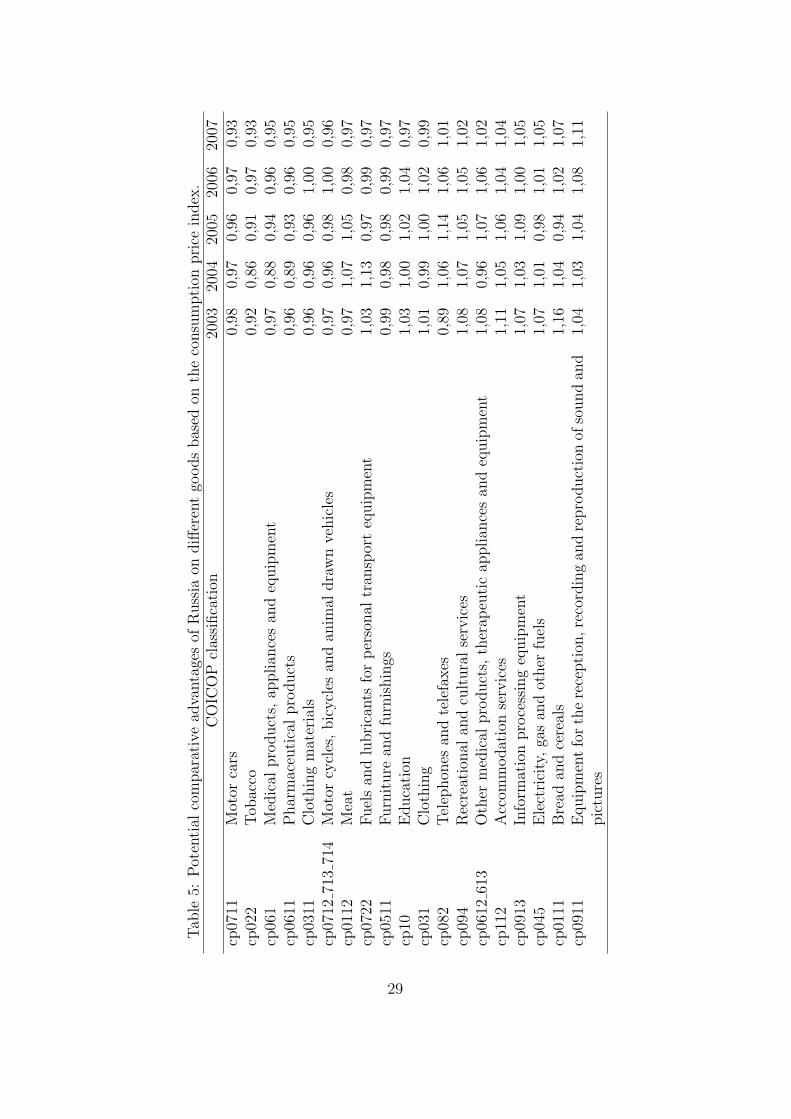
In Table 5 in the appendix we see that based on the consumer pricesprospective advantages of Russia contain motor cars, tobacco, medical andpharmaceutical products. Some moderate prospective advantages can be alsofound in clothing materials, whereas clothing industry itself is characterizedwith no advantages.
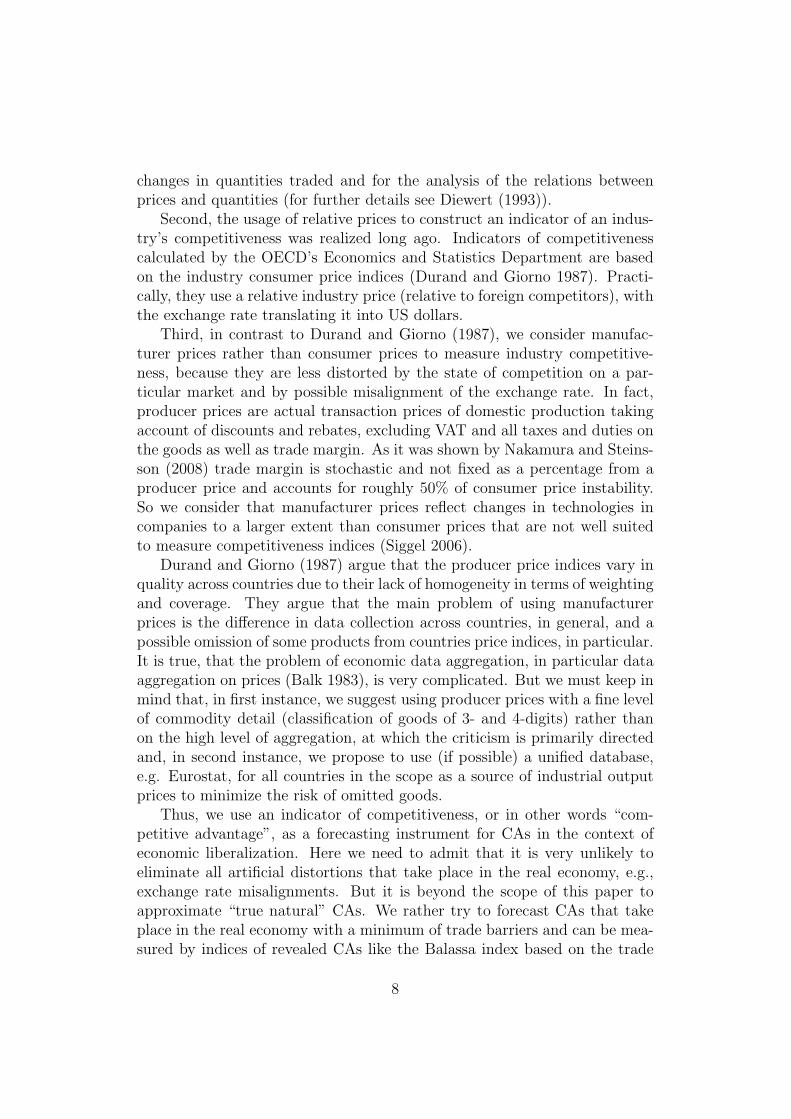
To deepen our prospective advantages analysis we will consider producerprice indices as a base for the PCA mechanism, as these indices presentproduction costs at a larger extent. Owing to a lack of data for the Euro-pean Union as a whole, calculating the PCA we will consider Germany, thebiggest trading partner of Russia, as the foreign partner (see Table 6 in theappendix).
As we see the obtained results differ from the PCA indices based on theconsumer price index, i.e., producer prices volatility between the countriesis more significant than volatility in consumer prices. One of the reasonsfor this may be that consumer prices between different markets are closelyconnected. Thus, an increase in prices in Germany on motor vehicles willmost likely cause an increase in prices in Russia as well, and not only onimported cars, but on most cars, because other car sellers will react to thechanges on the market. In contrast, a similar increase in production costswill hardly invoke respective changes in production cost in Russia. Thesechanges in relative producer prices reflect differences in industrial process,investments in R&D and, consequently, dynamics of prospective comparativeadvantages to a greater extent. Due to the non-simultaneous character ofthese processes in Russia and Germany, the PCA index based on producerprices for a particular industry may change substantially from one year toanother. Therefore, these indices must be analyzed for a sequence of yearsto make a conclusion in regard to the existence of prospective advantages.
Observing the PCA indices of Russia based on manufacturer prices, wecan see that Russia has prospects in diversifying its export structure in awide set of low, medium and high technological industries (see Table 6).
3.3.3 Discussion
In the following we will interpret the obtained results of CAs to reveal thoseindustries where the stimulation of comparative advantages may show themost promise.
In the clothing sector Russia has some moderate revealed disadvantages.At the same time we need to consider the fact that domestic products arenevertheless competitive on the foreign market (there is also a substantial
20

export of products in this industry). We can also see that the obtained PCAindices based on consumer and producer prices are not consistent: there areprospective advantages in production of clothing and clothing materials interms of producer prices, but in terms of consumer prices these advantagesare not evident. This is an example when the exchange rate distortion has asignificant effect. On the Russian market foreign-made clothes form a con-siderable part of the overall assortment, and because of the Russian roublesundervaluation advantages in this industry based on consumer prices maynot be observed. In fact, the undervalued rouble gives a competitive edgeto Russian companies enabling them to set higher prices and maintain acomparative price level with foreign apparel. This overvaluation of prices isalso induced by import tariff rates, which are among the highest for textileand clothing in Russia (Tarr 2007). Therefore, we observe no undervalua-tion in terms of consumer prices on the market. But based on the producerprices we obtain a much less distorted estimation that points to advantagesin this sector. After the Soviet Union collapse many of the existing factorieswere closed or significantly reorganized, so we can consider this industry as”quasi-infant”. Besides, the foreign companies are very active on the Russianmarket using different market entry and competitive strategies. Consideringthat Russia has prospective advantages not only in production of clothes butalso in textile materials and machinery for textile production, we suggestthat this industry can be considered as prospective.
Revealed disadvantages of Russia in the pharmaceutical industry havesignificantly increased during the last years. At the same time prospectiveadvantages remained more or less stable. There is no doubt that this in-dustry is supported by the Russian government, but considering that thisindustry has a good basis of related chemical sub-industries in Russia andrelated research institutes we assume that this industry is prospective. But torealize this potential and to generate new technologies, large investments areessential given that the pharmaceutical industry is one of the most capital-intensive industries in the world (Agrawal 1999).
Manufacturing of electronic equipment is one of the truly infant indus-tries in Russia, since many enterprizes in this sector got bankrupt in theearly 1990s, while others were conversioned from the military sector. Sincethen this industry is characterized as disadvantageous based on the tradestatistics. Nevertheless, there exist prospective advantages in manufacturingof television and radio receivers based on the producer prices (PCA indicesbased on consumer prices are distorted by the exchange rate undervalua-tion). Therefore, investments in this industry are promising, as the pricesthere will rise in the course of time and the potential of the industry may befulfilled under the condition that new technologies will be developed and a
21

prospective field of specialization will be found.Russia also has prospective advantages in manufacturing machinery, e.g.
for food processing and mining. These industries are characterized with re-vealed disadvantages at the moment, but have a good potential for growth.Mining and construction machinery are of high demand on the Russian mar-ket as the economy is growing and exploration industries remain prevalentin the Russian economy. Therefore, investments in these industries may beconsidered as prospective.
There are also prospective advantages in production of motor vehicles andrailway equipment. In these two sectors Russia has revealed disadvantagesduring the last years. How can we explain this “undervaluation”? It is widelyknown that the motor vehicles sector in Russia has a strong public supportand its competitive position is poor. This can be a reason for prospectiveadvantages in motor cars in terms of consumer prices as prices on domesticcars are artificially lowered. Thus, we can expect that after economic liber-alization this sector will likely be reduced and substituted by internationalcompanies and their assembling plants. This process takes place already.In comparison to the motor sector there are some differences with the rail-way sector. Though companies that produce railway equipment are partlyowned by the government, this sector is more competitive on the interna-tional market. An evidence for this fact can be observed, if we considerthe trade performance of this sector more closely: in sub-industries like self-propelled railway coaches or rail locomotives powered from an external sourceof electricity there is a positive net export (see Table 4). But the industryis lacking in new technologies and investments. Therefore, the high-speedrailroads projects in Russia are implemented in a close cooperation with for-eign companies. As a result, we consider this sector as ”prospective” forstimulation of comparative advantages.
22
4 Conclusion
In this paper we demonstrate that the known instruments of comparativeadvantages theory provide an analysis of “realized” advantages but do notforecast which industries may be prospective for stimulation of new CAs.Nevertheless these forecasts are relevant, especially in Russia as the economyis still in a period of transition.
To solve this problem we suggest a new approach that forecasts thesedynamics based on the relative price differences under the assumption thatthe trade relations of a particular country are not liberalized yet. Russia,as the biggest economy outside the WTO agreements and other effectivefree-trade zones like the EU, fits this assumption.
We also show that the Prospective Comparative Advantages mechanismshould not be considered independently. In contrary, it needs to be inter-preted in conjunction with both revealed comparative advantages and pos-sible exchange rate distortions. It should also be noted that the calculationof the PCA indices based on producer price indices provides less distortedfigures on prospective advantages in comparison to those based on consumerprice indices.
We use an example of CEE countries most of which had structural prob-lems in their economies similar to Russia and show that most of the industriesin which these countries managed to gain comparative advantages during thelast ten years were undervalued in comparison to the EU sectors. An empiri-cal analysis of the PCA forecasting power provides us with good results. Thatsupports our claim for the Prospective Comparative Advantages mechanismas a noteworthy forecasting instrument.
Finally, we calculated Russian revealed and prospective comparative ad-vantages, analyzed their dynamics during the last five years, and suggestedthat the Russian Federation has prospective advantages in some medium andhigh technological industries like pharmaceutical industry, electronic equip-ment, machinery building and railway transport as well as in some otherindustries like production of clothes. But to realize this prospective advan-tages, a policy with accurate stimulating instruments needs to be appliedto these industries, first of all in stimulating innovations, i.e., accumulatinginvestments and generating new technologies. Research on the efficiency ofstimulating instruments for these sectors remains for future study.
Acknowledgements Valuable comments and suggestions from Jurgen Meckl,Georg Gotz and Matthias Gocke from the Department of Economics at theJustus-Liebig University are gratefully acknowledged.
23
References
Adam, A., T.S. Kosma and J. McHugh (2003). Trade liberalization strate-gies: What could southeastern europe learn from CEFTA and BFTA.Technical Report 239. IMF Working Paper.
Agrawal, M. (1999). Global Competitiveness in the Pharmaceutical Indus-try: the Effect of National Regulatory, Economic and Market Factors.Haworth Press.
Backe, P. (1999). Exchange rate regimes in Central and Eastern Europe:A brief review of recent changes, current issues and future challenges.Technical report.
Balance, R.H., H. Forstner and T. Murray (1987). Consistency tests of al-ternative measures of comparative advantage, the review of economicsand statistics. The Review of Economics and Statistics 69(1), 157–161.
Balassa, B. (1965). Trade liberalization and ”revealed” comparative advan-tage. The Manchester School of Economic and Social Studies (33), 92–123.
Balk, B.M. (1983). Does there exist a relation between inflation and relativeprice change variability?. Economic letters 13(2–3), 173–180.
Bardhan, A.D. and C. Kroll (2006). Competitiveness and an emerging sec-tor: The russian software industry and its global linkages. Industry andInnovation 13(1), 69–95.
Belousov, A. R. (2006). The scenarios of russian economic development forthe next 15 years. ”Problemj Prognosirovanija” 13(1), 3–53.
Brenton, P., N. Tourdyeva and J. Whalley (1997). The potential trade effectsof an FTA between the EU and Russia. Review of World Economics133(2), 205–225.
Bruno, M. (1965). The optimal selection of export-promoting and import-substituting projects. In: Planning the External Sector: Techniques,Problems and Policies (United Nations, Ed.). New York.
Cyprus: June 1997 (1997). Technical report. WTO: Trade Policy Reviews:First Press Release, Secretariat and Government Summaries.
24

Diewert, W.E (1993). The economic theory of index numbers: A survey. In:Essays in Index Number Theory (Diewert W.E and A.O. Nakamura,Eds.). Vol. 1. pp. 163–208. Amsterdam: North-Holland.
Dixit, A. K. and V. Norman (1989). Theory of International Trade: a Dual,General Equilibrium Approach. Cambridge University Press.
Dornbusch, R., S. Fischer and P.A. Samuelson (1977). Comparative advan-tage, trade and payments in a ricardian model with a continuum ofgoods. American Economic Review 67(5), 823–839.
Durand, M. and C. Giorno (1987). Indicators of international competitive-ness: Conceptual aspects and evaluation. Technical Report 9. OECDEconomic Studies.
Feenstra, R. C. (2004). Advanced International Trade. Theory and Evidence.Oxford.
Gerschenkron, A. (1962). Economic Backwardness in Historical Perspective:A Book of Essays. Cambridge, MA: Belknap Press of Harvard UniversityPress.
Grossman, G. and E. Helpman (1991). Innovation and Growth in the GlobalEconomy. Cambridge: MIT Press.
Krugman, P.R. and G. N. Hatsopoulos (1987). The problem of u.s. compet-itiveness in manufacturing. New-England Economic Review pp. 18–29.
Lafay, G. (1992). The measurement of revealed comparative advantage. In:International Trade Modelling (M. G. Dagenais and P. A. Muet, Eds.).pp. 209–234. London: Chapman & Hall.
Landesmann, M. A. and R. Stehrer (2001). Convergence patterns andswitchovers in comparative advantage. Structural Change and EconomicDynamics 12, 399–423.
Leung, P. and J. Cai (2005). A review of comparative advantage assessmentapproaches in relation to aquaculture development. In: Species and Sys-tem Selection for Sustainable Aquaculture (P. Leung, C.-S. Lee and P.J.O’Bryen, Eds.). pp. 43–56. Blackwell Publishing.
Marconi, D. and V. Rolli (2008). Comparative advantage patterns and do-mestic determinants in emerging countries. Technical Report 81. WorldInstitute for Development Economics Research, Research Paper.
25
Montobbio, F. (2003). Sectoral patterns of technological activity and exportmarket share dynamics. Cambridge Journal of Economics 27, 523–545.
Nakamura, E. and J. Steinsson (2008). Five facts about prices: A reevaluationof menu cost models. The Quarterly Journal of Economics 123(4), 1415–1464.
Porter, M. (1990). The Competitive Advantage of Nations. Harvard BusinessReview.
Rogov, V. V. (2004). Russian export potential: Current state, lines andconditions of development. ”Vneshneekonomicheskij Bulleten” (5), 61–83.
Siggel, E. (2006). International competitiveness and comparative advantage:A survey and a proposal for measurement. Journal of Industry, Compe-tition and Trade 6(2), 137–159.
Stehrer, R. and J. Woerz (2003). Technological convergence and trade pat-terns. Review of World Economics 139, 191–219.
Tarr, D.G. (2007). The structure of import tariffs in the Russian Federation:2001-05. Technical Report 4265. World Bank Policy Research.
Technological Performance and Industrial Competitiveness (1986). TechnicalReport 2. OECD Science and Technology Indicators.
Tiusanen, T. (2007). Development of rouble exchange rate in russia. TechnicalReport 45. NORDI series. Lappeenranta.
Woerz, J. (2005). Dynamics of trade specialization in developed and lessdeveloped countries. Emerging Markets, Finance and Trade 41, 92–111.
Zaghini, A. (2005). Evolution of trade patterns in the new EU member states.Economics of Transition 13, 629–658.
26

5 Appendix
Table 4: Lafay indices of Russia on different goods.
Industry 2002 2003 2004 2005 20062709 Crude petroleum oils 10,51 11,24 12,3 11,22 13,632710 Petroleum oils, not crude 4,32 4,26 4,28 4,75 6,192711 Petroleum gases 6,01 5,99 4,79 4,35 6,1372 Iron and steel 1,93 1,77 2,63 1,43 1,4344 Wood and articles of wood, charcoal 1,00 0,91 0,87 0,79 0,7931 Fertilizers 0,64 0,61 0,64 0,58 0,5874 Copper and articles thereof 0,32 0,29 0,42 0,57 0,572701 Coal, briquettes, ovoids 0,32 0,38 0,50 0,42 0,5071 Pearls, precious stones, metals, coins, etc 1,30 1,21 1,04 0,24 0,2429 Organic chemicals 0,14 0,14 0,19 0,16 0,1647 Pulp of wood, fibrous cellulosic material, etc 0,20 0,18 0,15 0,11 0,1110 Cereals 0,24 0,19 -0,11 0,10 0,108401 Fuel element for reactor; Nuclear reactor 0,25 0,24 0,19 0,11 0,108411 Turbo-jets, propellers, other gas turbines -0,03 0,02 -0,03 -0,01 0,0451 Wool, animal hair, and fabric thereof -0,02 -0,01 -0,01 0,00 0,0053 Vegetable textile fibres nes, woven fabric 0,02 0,00 0,00 0,00 0,008603 Self-propelled railway/tramway coache 0,01 0,02 0,22 0,05 0,008601 Rail locomotives with ext source of energy 0,00 0,00 0,00 0,00 0,0043 Furskins and artificial fur, manufactures -0,01 0,00 0,00 -0,02 -0,0260 Knitted or crocheted fabric -0,41 -0,75 -0,06 -0,05 -0,0545 Cork and articles of cork -0,24 -0,19 -0,13 -0,06 -0,0642 Articles of leather, harness, travel goods -0,11 -0,09 -0,07 -0,07 -0,071 Live animals -0,02 -0,02 -0,02 -0,08 -0,0852 Cotton -0,22 -0,19 -0,17 -0,11 -0,118413 Pumps for liquids; liquid elevators -0,24 -0,22 -0,23 -0,14 -0,1786 Railway, tramway locomotives, rolling stock -0,22 -0,15 -0,30 -0,19 -0,1961 Articles of apparel, accessories, knit etc -0,15 -0,15 -0,13 -0,20 -0,2089 Ships, boats and other floating structures -0,10 -0,07 0,02 -0,20 -0,208429 Self-propelled bulldozer, excavator, etc -0,14 -0,16 -0,15 -0,15 -0,2538 Miscellaneous chemical products -0,44 -0,38 -0,36 -0,30 -0,3088 Aircraft, spacecraft, and parts thereof 0,67 0,67 0,48 -0,31 -0,3164 Footwear, gaiters, parts thereof -0,21 -0,21 -0,16 -0,36 -0,3694 Furniture, lighting, prefabricated buildings -0,42 -0,38 -0,35 -0,36 -0,3628 Inorganic chemicals -0,84 -0,53 -0,42 -0,43 -0,4333 Essential oils, perfumes, cosmetics -0,60 -0,65 -0,63 -0,53 -0,5348 Paper & paperboard, articles of paper -0,75 -0,79 -0,70 -0,59 -0,5973 Articles of iron or steel -0,74 -0,72 -0,76 -0,86 -0,8690 Optical, photo, technical, etc apparatus -0,98 -1,14 -0,98 -1,11 -1,112 Meat and edible meat offal -2,11 -1,62 -1,23 -1,40 -1,4039 Plastics and articles thereof -1,10 -1,20 -1,13 -1,43 -1,4330 Pharmaceutical products -1,38 -1,62 -1,53 -1,91 -1,9185 Electrical, electronic equipment -2,96 -2,83 -3,26 -4,30 -4,3087 Vehicles other than railway, tramway -1,57 -2,47 -3,67 -5,49 -5,49
27
Fig
ure
2:C
orre
lati
onb
etw
een
the
LF
Iin
dex
valu
ediff
eren
cean
dth
eP
CA
index
.
28
Tab
le5:
Pot
enti
alco
mpar
ativ
ead
vanta
ges
ofR
uss
iaon
diff
eren
tgo
ods
bas
edon
the
consu
mpti
onpri
cein
dex
.C
OIC
OP
clas
sifica
tion
2003
2004
2005
2006
2007
cp07
11M
otor
cars
0,98
0,97
0,96
0,97
0,93
cp02
2T
obac
co0,
920,
860,
910,
970,
93cp
061
Med
ical
pro
duct
s,ap
plian
ces
and
equip
men
t0,
970,
880,
940,
960,
95cp
0611
Phar
mac
euti
cal
pro
duct
s0,
960,
890,
930,
960,
95cp
0311
Clo
thin
gm
ater
ials
0,96
0,96
0,96
1,00
0,95
cp07
1271
371
4M
otor
cycl
es,
bic
ycl
esan
dan
imal
dra
wn
vehic
les
0,97
0,96
0,98
1,00
0,96
cp01
12M
eat
0,97
1,07
1,05
0,98
0,97
cp07
22F
uel
san
dlu
bri
cants
for
per
sonal
tran
spor
teq
uip
men
t1,
031,
130,
970,
990,
97cp
0511
Furn
iture
and
furn
ishin
gs0,
990,
980,
980,
990,
97cp
10E
duca
tion
1,03
1,00
1,02
1,04
0,97
cp03
1C
loth
ing
1,01
0,99
1,00
1,02
0,99
cp08
2T
elep
hon
esan
dte
lefa
xes
0,89
1,06
1,14
1,06
1,01
cp09
4R
ecre
atio
nal
and
cult
ura
lse
rvic
es1,
081,
071,
051,
051,
02cp
0612
613
Oth
erm
edic
alpro
duct
s,th
erap
euti
cap
plian
ces
and
equip
men
t1,
080,
961,
071,
061,
02cp
112
Acc
omm
odat
ion
serv
ices
1,11
1,05
1,06
1,04
1,04
cp09
13In
form
atio
npro
cess
ing
equip
men
t1,
071,
031,
091,
001,
05cp
045
Ele
ctri
city
,ga
san
dot
her
fuel
s1,
071,
010,
981,
011,
05cp
0111
Bre
adan
dce
real
s1,
161,
040,
941,
021,
07cp
0911
Equip
men
tfo
rth
ere
cepti
on,re
cord
ing
and
repro
duct
ion
ofso
und
and
pic
ture
s1,
041,
031,
041,
081,
11
29
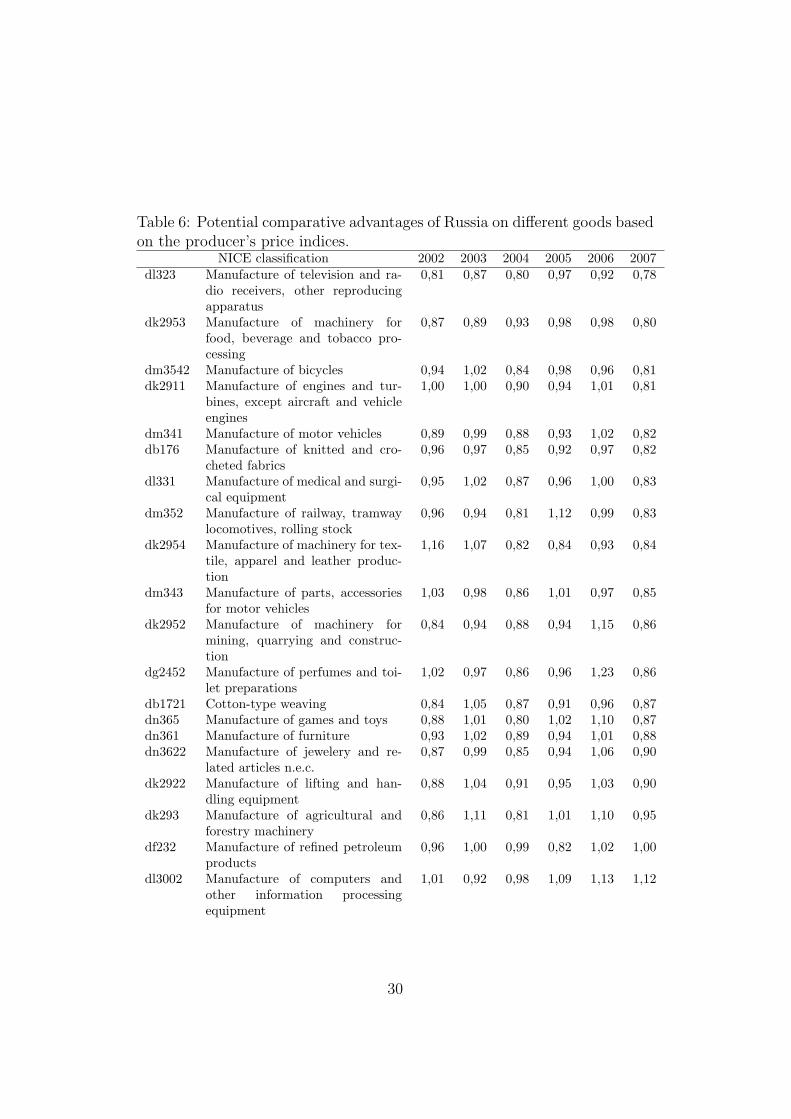
Table 6: Potential comparative advantages of Russia on different goods basedon the producer’s price indices.
NICE classification 2002 2003 2004 2005 2006 2007dl323 Manufacture of television and ra-
dio receivers, other reproducingapparatus
0,81 0,87 0,80 0,97 0,92 0,78
dk2953 Manufacture of machinery forfood, beverage and tobacco pro-cessing
0,87 0,89 0,93 0,98 0,98 0,80
dm3542 Manufacture of bicycles 0,94 1,02 0,84 0,98 0,96 0,81dk2911 Manufacture of engines and tur-
bines, except aircraft and vehicleengines
1,00 1,00 0,90 0,94 1,01 0,81
dm341 Manufacture of motor vehicles 0,89 0,99 0,88 0,93 1,02 0,82db176 Manufacture of knitted and cro-
cheted fabrics0,96 0,97 0,85 0,92 0,97 0,82
dl331 Manufacture of medical and surgi-cal equipment
0,95 1,02 0,87 0,96 1,00 0,83
dm352 Manufacture of railway, tramwaylocomotives, rolling stock
0,96 0,94 0,81 1,12 0,99 0,83
dk2954 Manufacture of machinery for tex-tile, apparel and leather produc-tion
1,16 1,07 0,82 0,84 0,93 0,84
dm343 Manufacture of parts, accessoriesfor motor vehicles
1,03 0,98 0,86 1,01 0,97 0,85
dk2952 Manufacture of machinery formining, quarrying and construc-tion
0,84 0,94 0,88 0,94 1,15 0,86
dg2452 Manufacture of perfumes and toi-let preparations
1,02 0,97 0,86 0,96 1,23 0,86
db1721 Cotton-type weaving 0,84 1,05 0,87 0,91 0,96 0,87dn365 Manufacture of games and toys 0,88 1,01 0,80 1,02 1,10 0,87dn361 Manufacture of furniture 0,93 1,02 0,89 0,94 1,01 0,88dn3622 Manufacture of jewelery and re-
lated articles n.e.c.0,87 0,99 0,85 0,94 1,06 0,90
dk2922 Manufacture of lifting and han-dling equipment
0,88 1,04 0,91 0,95 1,03 0,90
dk293 Manufacture of agricultural andforestry machinery
0,86 1,11 0,81 1,01 1,10 0,95
df232 Manufacture of refined petroleumproducts
0,96 1,00 0,99 0,82 1,02 1,00
dl3002 Manufacture of computers andother information processingequipment
1,01 0,92 0,98 1,09 1,13 1,12
30