Embed Size (px)
Citation preview

WORKING PAPERINSTITUTIONS AND STATE SPENDING: AN OVERVIEW
By Matthew Mitchell and Nick Tuszynski
No. 11-39 October 2011
The ideas presented in this research are the authors’ and do not represent official positions of the Mercatus Center at George Mason University.
Institutions and State Spending: An Overview
Matthew Mitchell and Nick Tuszynski1
Abstract
U.S. fiscal policy at the federal, state, and local level is on an unsustainable path. While reformers should
look for ways to reduce spending on particular budget items, tomorrow’s legislatures may easily reverse
these cuts. In contrast, a change in the rules that govern the political process—the “institutions” that shape
a budget—can have a lasting effect on spending for years to come. Codified in statutes and in
constitutions, these institutions include the rules of budgeting, electioneering, and legislating. They
influence the decisions of legislators, governors, presidents, bureaucrats, voters, and even lobbyists. As
such, institutional reform can be a more effective and sustainable path to fiscal probity than a one-time
budget cut. This paper summarizes the empirical investigations of sixteen state-level institutions. The
lesson for both state and federal policy makers is that there are a number of institutional reforms that seem
likely to put spending on a more sustainable path.
1 We thank Meg Patrick for excellent research assistance and Jennifer Zambone and Emma Elliott for superb
editorial improvements.
2
Introduction
U.S. fiscal policy at the federal, state, and local level is on an unsustainable path.2 While reformers should
look for ways to reduce spending on particular budget items, tomorrow’s legislatures may easily reverse
these cuts. In contrast, a change in the rules that govern the political process—the “institutions” that shape
a budget—can have a lasting effect on spending for years to come.3 Codified in statutes and in
constitutions, these institutions include the rules of budgeting, electioneering, and legislating. They
influence the decisions of legislators, governors, presidents, bureaucrats, voters, and even lobbyists. As
such, institutional reform can be a more effective and sustainable path to fiscal probity than a one-time
budget cut.
Justice Brandeis famously referred to the federal system as a “laboratory” in which each state was free to
implement novel social and economic experiments.4 For the social scientist interested in understanding
how institutions affect policy outcomes, the metaphor is apt. Each of the 50 states has its own set of
institutions and some of these have changed over the course of the last several decades. At the same time,
many other factors that might influence outcomes are invariant across the states. In other words, cross-
state studies effectively control for factors such as macroeconomic conditions, culture, and the broad
legal/constitutional setting in which each state operates. Moreover, researchers are able to employ various
econometric techniques to control for the influence of those factors that are different across states such as
climate or demography. In sum, the setting provides a rich laboratory in which to test the effect of
different institutions on spending.
A large number of researchers have performed these tests and this paper reviews this literature,
summarizing the effect of more than a dozen institutions on state spending.5 This paper concentrates on
peer-reviewed studies that rely on large data sets and well-accepted econometric techniques. Each of
these studies carefully accounts for other factors that have been shown to impact spending such as
demography, climate, and the economy.
This paper begins with some of the most-studied institutions, e.g., strict balanced budget requirements,
move on to those that have received comparatively less attention, e.g., item-reduction vetoes, and
2 For past state spending, see Matthew Mitchell, “State Spending Restraint: An Analysis of the Path Not Taken,”
(working paper, Mercatus Center at George Mason University, Arlington, VA, 2010),
http://mercatus.org/sites/default/files/publication/State%20Spending%20Restraint%20An%20Analysis%20of%20th
e%20Path%20Not%20Taken%20corrected.%2010.1.10_0.pdf. For future state spending, see Jeffrey Miron, “The
Fiscal Health of U.S. States,” (working paper, Mercatus Center at George Mason University, Arlington, VA, 2011),
http://mercatus.org/sites/default/files/publication/State%20Spending%20Restraint%20An%20Analysis%20of%20th
e%20Path%20Not%20Taken%20corrected.%2010.1.10_0.pdf. For future federal spending, see Congressional
Budget Office, Long Term Budget Outlook (Washington, DC, June 2011),
http://www.cbo.gov/doc.cfm?index=12212. 3 The Nobel Laureate Douglass North is often considered the father of modern institutional economics. In his terms,
institutions “are the humanly devised constraints that shape human interaction.” Douglass North, Institutions,
Institutional Change and Economic Performance (New York: Cambridge University Press, 1990). 4 New State Ice Co. v. Liebmann, 285 U.S. 262 (1932),
http://caselaw.lp.findlaw.com/scripts/getcase.pl?court=us&vol=285&invol=262. 5 Though this paper focuses on the effect of institutions on spending, there is a larger literature focusing on the effect
of institutions on a wide variety of policy outcomes. For a review of this larger literature, see Timothy Besley and
Anne Case, “Political Institutions and Policy Choices: Evidence from the United States,” Journal of Economic
Literature, Vol. 41, No. 1 (March, 2003), 7-73, http://www.jstor.org/pss/3217387.
3
concludes with a pair of institutions, the study of which has yielded conflicting conclusions, e.g., direct
democracy and term limits. Where possible, this paper presents the findings in terms of the institutions’
impact on per capita spending and convert all numbers into 2008 dollars to permit side-by-side
comparison. Our hope is that this overview will provide useful insights to state policy makers who may
be interested in reform. We also hope it will be helpful to federal policy makers since many of these
institutions may be transferred to the federal level.
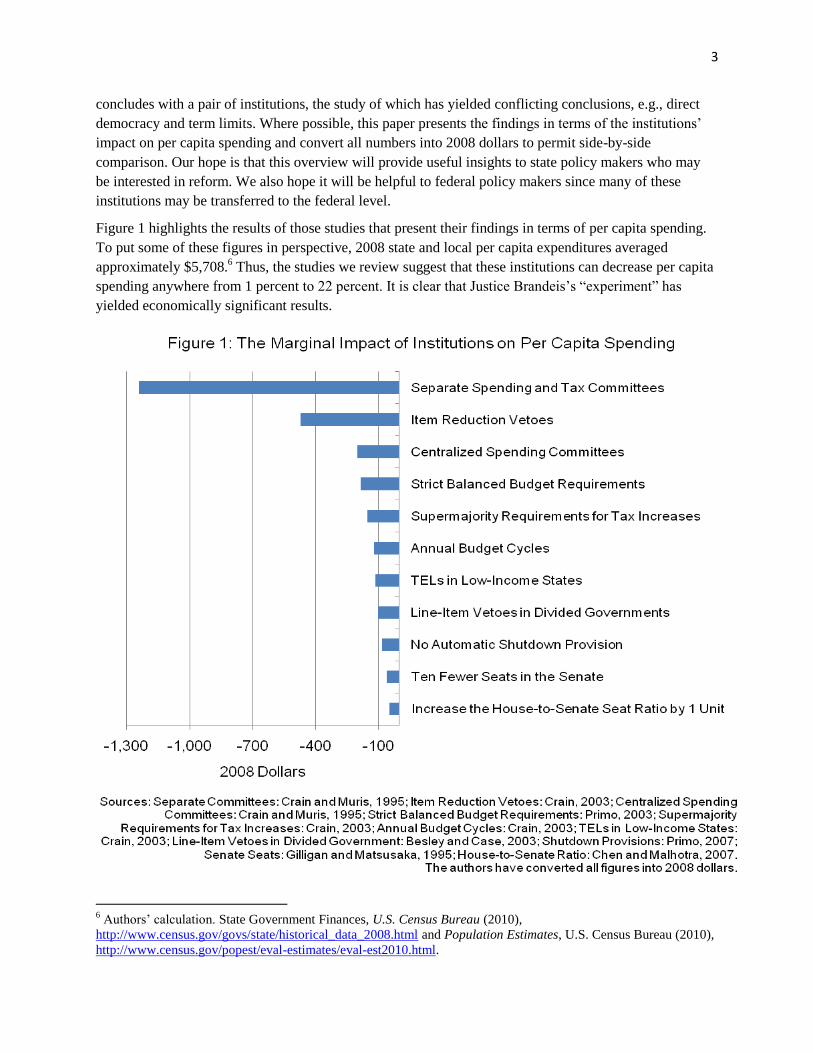
Figure 1 highlights the results of those studies that present their findings in terms of per capita spending.
To put some of these figures in perspective, 2008 state and local per capita expenditures averaged
approximately $5,708.6 Thus, the studies we review suggest that these institutions can decrease per capita
spending anywhere from 1 percent to 22 percent. It is clear that Justice Brandeis’s “experiment” has
yielded economically significant results.
6 Authors’ calculation. State Government Finances, U.S. Census Bureau (2010),
http://www.census.gov/govs/state/historical_data_2008.html and Population Estimates, U.S. Census Bureau (2010),
http://www.census.gov/popest/eval-estimates/eval-est2010.html.
4
Sixteen Institutions and Their Effects on State Spending
1. Strict Balanced Budget Requirements
With the exception of Vermont, every state has a balanced budget requirement, but the stringency of these
requirements varies widely. For example, in some states, the governor must submit a balanced budget, but
the legislature need not pass one. In other states, estimates of the enacted budget need to show balance,
but there are no consequences if these estimates prove wrong at the end of the fiscal year and the actual
budget is out-of-balance. In some states, the legislature may carry-over a deficit from one year to the next,
while in others they may not. Lastly, in some states an independently elected Supreme Court is the
ultimate enforcer of the requirement, while in others the legislature appoints the members of the Supreme
Court.
Even though balanced budget requirements are designed to ensure only that spending be less than
revenue, there is reason to believe these requirements may reduce both spending and revenue. The Nobel
laureate James Buchanan and his coauthor Richard Wagner explained why this might be when they
observed that the ability to buy items for current voters while leaving future voters to pick up the tab
systematically biases policy in favor of greater spending.7
Indeed, a number of studies have found that states with stricter balanced budget requirements tend to tax
and spend less than other states. Henning Bohn of U.C. Santa Barbara and Robert Inman of the University
of Pennsylvania, for example, find that per capita spending is about $189 less in states with strict
balanced budget requirements relative to those with only weak requirements.8 David Primo of the
University of Rochester arrives at a remarkably similar result, finding that strict balanced budget
requirements reduce per capita spending by about $184 per capita.9 If this is the impact of moving from a
weak to a strict balanced budget requirement, it is possible that if the federal government were to adopt a
balanced budget requirement where none now exists then the impact would be even greater.
Strict balanced budget requirements have other salubrious effects. Bohn and Inman also find that states
with strict requirements tend to have larger rainy day funds and larger surpluses and that states with these
requirements tend to balance their books through spending reductions rather than revenue increases.
Shanna Rose of New York University finds that states without strict balanced budget requirements are
more likely to suffer from a “political business cycle” whereby policy makers increase spending just prior
to an election, only to cut back following the election.10
7 James Buchanan and Richard Wagner, Democracy in Deficit: The Political Legacy of Lord Keynes (Indianapolis:
Liberty Fund, [1977] 1999). 8 This estimate, like all others reported in this paper, has been converted into 2008 dollars for ease of comparison.
When authors report a range of estimates, we have taken the average and then converted that average into 2008
dollars. Henning Bohn and Robert Inman, “Balanced Budget Rules and Public Deficits: Evidence from the U.S.
States” (working paper No. 5533, National Bureau of Economic Research, 1996). 9 David Primo, Rules and Restraint: Government Spending and The Design of Institutions (Chicago: University of
Chicago Press, 2003). Mark Crain has also corroborated this result. See Mark Crain, Volatile States: Institutions,
Policy and the Performance of American State Economies (Ann Arbor: University of Michigan Press, 2003). 10
Shanna Rose, “Do Fiscal Rules Dampen the Political Business Cycle?” Public Choice 128, no.3/4 (2006): 407-31.
5
But there may be some unintended consequences of a strict balanced budget requirement. Economists
Noel Johnson, Matthew Mitchell, and Steven Yamarik recently concluded that while such rules limit the
likelihood of partisan fiscal outcomes, they increase the likelihood of partisan regulatory outcomes. When
Democratic-controlled states were unable to carry a deficit forward to the next fiscal cycle, they were
more likely to raise the minimum wage, less likely to adopt a right-to-work statute, and more likely to
regulate personal freedoms.11
2. State Rainy Day Funds
Some commentators worry that a balanced budget requirement exacerbates the ups and downs of the
business cycle. Since state budgets tend to be the tightest at the bottom of an economic downturn, this
argument goes, strict balanced budget requirements force states to cut back on spending at the worst
time.12
One institutional answer to this critique is a “budget stabilization fund,” better known as a rainy
day fund. States contribute to these funds during good years and then draw on them when the budget is
strained due to a downturn or some other event such as a natural disaster. Forty-seven states currently
maintain such funds, but like many institutions, their design varies on a state-by-state basis.13
Studies of rainy day funds suggest that they can smooth out the spending-cycle, but the details matter.
Gary Wagner of Duquesne University and Erick Elder of the University of Arkansas conducted the most-
comprehensive recent study of rainy day funds. They find that states whose rainy day funds have strict
rules governing deposits and withdrawals tend to experience a $14 per capita reduction in spending
volatility (as measured by the cyclical variability of per capita spending over time).14
3. Supermajority Requirements for Tax Increases
Fifteen states require supermajority votes of the state legislature to raise taxes.15
Depending on the state,
these rules require two-thirds, three-fourths, or three-fifths of the legislature to consent to a tax increase.
In some states, the supermajority requirement applies to all taxes and in others it applies to a subset of
taxes. A number of researchers have found that these rules reduce spending. Economists Mark Crain and
James Miller III, for example, find that states with supermajority requirements for tax increases tend to
increase spending at a slower pace.16
A subsequent study by Brian Knight of Brown University finds that
the effective tax rate in states with these requirements is between 8 and 23 percentage points lower than in
states without such a requirement.17
The latest and most-comprehensive studies suggest that these
11
Noel Johnson, Matthew Mitchell, and Steven Yamarik, “Pick Your Poison: Do Politicians Regulate When they
Can’t Spend?” (working paper, Mercatus Center at George Mason University, Arlington, VA, 2011),
http://mercatus.org/sites/default/files/publication/Partisan_Policies_Johnson_Mitchell_Yamarik_WP1128_0.pdf. 12
Norman Ornstein, “Why a Balanced-Budget Amendment is Too Risky,” Washington Post, July 29, 2011,
http://www.aei.org/article/103883. 13
Kim Rueben and Carol Rosenberg, “State and Local Tax Policy: What Are Rainy Day Funds and How Do They
Work?” in The Tax Policy Briefing Book, Tax Policy Center, August 12, 2009,
http://www.taxpolicycenter.org/briefing-book/state-local/fiscal/rainy-day.cfm. 14
Gary Wagner and Erick Elder, “The role of Budget Stabilization Funds in Smoothing Government Expenditures
Over the Business Cycle,” Public Finance Review, Vol. 33, No. 4 (July 2005): 439-65. 15
Bert Waisanen, “State Tax and Expenditure Limits—2010,” National Conference of State Legislatures, 2010. 16
Mark Crain and James Miller III, “Budget Process and Spending Growth,” William and Mary Law Review, Vol. 3,
No. 4 (1990): 1021-46. 17
Brian Knight, “Supermajority Voting Requirements for Tax Increases: Evidence from the States,” Journal of
Public Economics, Vol. 76, No. 1 (2000): 41-67. An effective tax rate is the percent of income that an average
citizen pays in taxes.
6
requirements are associated with significantly lower per capita spending levels. Crain, for example, finds
that states with these rules spend, on average, $151 less per capita.18
Similarly, economists Timothy
Besley and Anne Case find that these rules reduce per capita spending by $103.19
4. Tax and Expenditure Limits
In the last several decades, a number of states have experimented with formal rules that are specifically
designed to arrest the rate of growth of government. These so-called “tax and expenditure limits” (TELs)
are either codified in the statutes or constitutions of 28 states.20
The rules bind state spending, taxation, or
both through formulas that reference factors such as the personal income of state residents, population
growth, the inflation rate, or some combination thereof.
Early studies of these rules concluded that they generally fail to restrain the fiscal growth of
government.21
Newer studies, though, use larger and more detailed data sets and tend to find that these
institutions can be effective in certain circumstances.22
As with balanced budget requirements and rainy
day funds, however, the details matter.
A number of studies, noting that TEL formulas are often based on residents’ incomes, examine whether
TELs have different effects in high versus low-income states. Crain, for example, finds that TELs in low-
income states seem to reduce spending by about $114 per capita while TELs in high-income states seem
to increase spending by about $534 per capita.23
Other studies have focused on the fact that the details of TEL laws vary considerably from state to state.
These, too, have tended to conclude that TELs can effectively restrain spending, but only in certain
circumstances. Mitchell, for example, found that TELs are more effective when their formula is based on
the sum of inflation plus population growth, when they bind spending rather than revenue, when they
require a supermajority rather than a simple majority vote to be overridden, when they immediately
refund revenue collected in excess of the limit, and when they prohibit unfunded mandates on local
governments.24
18
Crain, Volatile States: Institutions, Policy and the Performance of American State Economies. 19
Besley and Case, “Political Institutions and Policy Choices: Evidence from the United States.” 20
Waisanen. 21
See, for example, Burton Abrams and William Dougan, “The Effects of Constitutional Restraints on Government
Spending,” Public Choice, Vol. 49 (1986): 101-16. 22
This is not always true, however. One recent study found TELs to be “largely ineffective.” Thad Kousser,
Matthew McCubbins, and Ellen Moule, “For whom the TEL Tolls: Can State Tax and Expenditure Limits
Effectively Reduce Spending?” State Politics and Policy Quarterly, Vol. 8 (2008): 331-61. 23
Crain, Volatile States: Institutions, Policy and the Performance of American State Economies. Crain defines low
and high-income states as those whose incomes are one standard deviation above or below the mean. Similar
findings were obtained by Ronald Shadbegian, “Do Tax and Expenditure Limitations Affect the Size and Growth of
State Government?” Contemporary Economic Policy, Vol. 14 (1996): 22-35, and by Matthew Mitchell, “TEL It
Like It Is: Do State Tax and Expenditure Limits Actually Limit Spending?” (working paper, Mercatus Center at
George Mason University, Arlington, VA, 2010),
http://mercatus.org/sites/default/files/publication/TEL%20It%20Like%20It%20Is.Mitchell.12.6.10.pdf. 24
Mitchell, “TEL It Like It Is: Do State Tax and Expenditure Limits Actually Limit Spending?”
7
5. Line-item Vetoes
Like the president of the United States, every governor in the union possesses a veto power. In addition to
the simple veto, however, 44 governors possess a “line-item veto.” This allows them to strike specific
sections from a bill.25
At the federal level, a statutory line-item veto was approved by both houses of the
Congress and signed by President Clinton in 1996. In 1998, however, the Supreme Court struck down the
law. 26
Now, a federal line item veto would either require constitutional amendment, or a carefully-worded
statute that ensured the legislative branch retained the final say on the matter.27
Early studies of the line-item veto at the state level found that it had no impact on overall state spending.28
Subsequent research, however, has focused on the impact of the line-item veto in times and places where
different parties control the governor’s mansion and the legislature.29
This line of research has found that
the line-item veto can have a large and statistically significant impact on per capita spending. Besley and
Case, for example, find that in a state with a divided government the line-item veto reduces per capita
spending by about $100.30
6. Item-reduction Vetoes
In most cases, when a governor possesses a line-item veto, he must completely defund any budget items
he wishes to strike. In twelve states, however, the governor need not zero-out the entire item.31
Instead, he
may write in a lower amount. In such cases, the governor is said to possess an “item-reduction veto.”
Theoretically, an item-reduction veto changes the negotiating power between the governor and the
legislature by effectively denying the legislature the ability to make the governor a take-it-or-leave-it
offer. Mark Crain estimates that this particular variety of veto seems to have a substantial effect on
spending, lowering per capita expenditures by $471.32
7. Baseline Budgeting
States tend to use one of two different “baselines” when they consider a new budget. On the one hand,
they may take the dollars spent in the previous year as the baseline. On the other hand, they may take the
level of services that those dollars bought as the baseline. If they take the second approach, then price
increases in services are automatically incorporated into the budgetary baseline. A study by economists
Mark Crain and Nicole Crain suggests that spending grows about half a percentage point slower in those
states that use dollars spent rather than services rendered as the baseline.33
25
Daniel C. Vock, “Govs Enjoy Quirky Veto Power,” Stateline, Pew Center on the States, April 24, 2007,
http://www.stateline.org/live/details/story?contentId=201710. 26
For the law, see Line Item Veto Act of 1996, Public Law 104-130, 104th
Cong. (April 9, 1996). For the Supreme
Court decision, see Clinton v. City of New York, 524 U.S. 417 (1998). 27
A bipartisan group of over 40 Senators has introduced such a bill. Reduce Unnecessary Spending Act of 2011, S.
102, 112th
Cong., 1st sess. (January 25, 2011).
28 Abrams and Dougan.
29 Holtz-Eakin was the first to study the line-item veto in such a context. Douglas Holtz-Eakin, “The Line Item Veto
and Public Sector budgets: Evidence from the States,” Journal of Public Economics, Vol. 36 (1988): 269-92. 30
Besley and Case, “Political Institutions and Policy Choices: Evidence from the United States.” 31
Vock. 32
Crain, Volatile States: Institutions, Policy and the Performance of American State Economies, 111. 33
Mark Crain and Nicole Crain, “Fiscal Consequences of Budget Baselines,” Journal of Public Economics, Vol. 67
(1998): 421-36.
8
8. No Automatic Shutdown Provision
In twenty-two states, the government automatically shuts down if, by the beginning of the fiscal year,
policy makers have not reached an agreement on the budget.34
A similar rule applies to the federal
budget.35
David Primo explains the theoretical effect of an automatic shutdown provision:
The legislature has the bargaining advantage because the governor, when considering a spending
proposal, compares it to the outcome that would be obtained if he vetoed the spending proposal.36
Under these circumstances, “the legislature will be able to achieve its ideal budget, so long as the
governor prefers it to no spending.”37
In other words, the threat of a shutdown essentially permits the
legislature to make a take-it-or-leave-it offer and that is enough to make the governor concede to their
spending demands.
Empirical analysis seems to corroborate this theory. According to Primo, states without an automatic
shutdown provision spend about $80 less per capita.38
9. Separate Spending and Taxing Committees
Some states allow one legislative committee to have jurisdiction over both spending and taxing
legislation. Others divide the two powers between separate committees. Intuitively, those states that keep
these functions separate seem likely to spend less than those that combine them. The idea is essentially
Madisonian: if one committee has jurisdiction over taxing but not spending then its members—unable to
steer spending projects towards their constitutions—will have an incentive to block the interests of other
committees with spending authority.39
The last researchers to publish on this matter were Mark Crain and Timothy Muris.40
According to their
data (which is from the 1980s), five states combine spending and taxing authority in one committee while
the rest keep these two functions separate. They find that states with combined spending and revenue
authority tend to spend $1,241 more per capita than states with separate authorities. As indicated by
Figure 1, this is by far the largest per capita effect of the institutions this paper surveys.
10. Centralized Spending Committees
Researchers have also examined the effect of centralizing spending authority in one committee rather than
dividing it among several separate spending committees. In this case, the theoretical prediction is
34
National Conference of State Legislatures, Table 6-4: Procedures When the Appropriations Act is Not Passed by
the Beginning of the Fiscal Year, September 2008, http://www.ncsl.org/default.aspx?tabid=12616. 35
At the federal level, shutdowns can also occur for other reasons. For example, the near-shutdown in August of
2011 was the result of the nation’s statutory debt ceiling. 36
Primo, 102. 37
Ibid. 38
Ibid., 203. 39
As the principal framer of the Constitution and as its chief advocate through the Federalist, James Madison
advocated for checks and balances so that “ambition must be made to counteract ambition.” James Madison, “No.
51,” The Federalist, by Alexander Hamilton, James Madison, and John Jay, Clinton Rossiter, ed. (New York:
Signet, [1788] 1961): 322. 40
Mark Crain and Timothy Muris, “Legislative Organization of Fiscal Policy,” Journal of Law and Economics, Vol.
38, No. 2 (Oct., 1995): 311-33.
9
different: when a number of different committees have a hand in determining spending priorities,
spending is subject to a “tragedy of the commons.” As Crain and Muris put it:
[N]o one committee has the incentive to restrain its spending commitments because the total level
of spending is no longer the responsibility of any one committee. To the contrary, the resulting
competition among committees to spend results in more spending than would otherwise occur,
increasing reliance on deficit financing.41
John Cogan of the Hoover Institution and Stanford University examines this question at the federal level
and finds that during periods in which the U.S. Congress had decentralized spending authority, spending
grew much faster than in other periods.42
At the state level, Crain and Muris find that in the 1980s, 24 states had centralized spending authority in
one committee, while the rest had spread it out among several committees. Their results corroborate the
federal study by Cogan. They find that, on a per capita basis, states with centralized spending authority
spend about $199 less than those with decentralized spending authority.43
11. Annual Budgeting
Some state budget cycles last one year while others last two. Given the large number of complex projects
that governments currently fund, biennial budgeting would seem to afford legislators the time to carefully
scrutinize the budget in order to properly weigh the costs and benefits of different programs.
Indeed, Crain notes:
Since 1977 a number of proposals have been introduced in the U.S. House and Senate to lengthen
the federal budget cycle from an annual to a biennial process. The perception behind these
proposals is that a federal biennial budget would help curtail the growth of federal expenditures.44
But the theoretical relationship is not so clear. According to Paula Kearns of Michigan State University, a
biennial budget might on the one hand shift the balance of power from the legislature to the governor.
Since governors cannot export the costs of spending to other districts as legislators can, she reasons that
this might lead to less spending. On the other hand, she notes that biennial budgeting introduces a
measure of durability, which may make it more appealing for special interest groups to lobby for
government largesse, thereby increasing spending.45
41
Ibid., 314. 42
Spending authority in the U.S. Congress was decentralized from 1886 to 1921 and then again from 1932 until the
present. See John Cogan, “The Evolution of Congressional Budget Decision Making and the Emergence of Federal
Deficits,” in The Budget Puzzle: Understanding Federal Spending, edited by John Cogan, Timothy Muris, and Allen
Schick, (Palo Alto: Stanford University Press, 1994). See, also, David Brady and Mark Morgan, “Reforming the
Structure of the House Appropriations Process: The Effects of the 1885 and 1919-1920 Reforms on Money
Decisions,” in Congress: Structure and Policy, Matthew McCubbins and Terry Sullivan ed., (New York: Cambridge
University Press, 1987). 43
Crain and Muris. 44
Crain, Volatile States: Institutions, Policy and the Performance of American State Economies,102. 45
Paula Kearns, “State Budget Periodicity: An Analysis of the Determinants and the Effect on State Spending,”
Journal of Policy Analysis and Management, Vol. 13, No. 2 (1994): 331-62.
10
Kearns’s empirical investigation supports the second hypothesis: a biennial budget cycle seems to
increase spending.46
Crain corroborates this result, finding that states with annual budgets tend to spend
about $119 less per capita than states with biennial budget cycles.47
12. Small Senates
A number of researchers have examined whether the size of a legislative chamber affects spending. The
expectation has tended to be that larger chambers will spend more because each member has an incentive
to spend in his or her own district while spreading the cost among all districts, and as the number of cost-
sharing districts increases this incentive grows stronger.48
A number of researchers, using data at both the city and the national level, have found that larger
unicameral legislatures do tend to spend more.49
In bicameral legislatures, however, the more-seats-more-
spending relationship holds in the upper house only. For example, Thomas Gilligan and John Matsusaka
of the University of Southern California find that the number of state House seats has little or no effect on
spending, but the number of Senate seats does. State Senates range from 21 to 67 members, and they find
that a one-seat increase in membership is, on average, associated with about $17 more in per capita
spending.50
13. Large House-to-Senate Ratios
Why does the size of the House not affect spending? Jowie Chen, now of the University of Michigan, and
Neil Malhot of Stanford University offer one reason. They observe that “lower chamber districts, at least
in the United States, are unique because they are geographically embedded within Senate districts.”51
Thus:
[D]ividing each Senate district into more House districts has the effect of shrinking each House
member’s constituency, ceteris paribus. Having a smaller constituency dilutes House members’
payoffs from exploiting common pool resources to fund large pork barrel projects.52
This means that adding more House seats should not have an affect per se, but increasing the ratio of
House-to-Senate seats should lead to less spending. They corroborate this theoretical prediction with
empirical analysis estimating that decreasing the Senate size by one seat can lower per capita spending by
almost $6, while increasing the House-to-Senate seat ratio by one unit decreases per capita spending by
about $45.
46
Ibid. 47
Crain, Volatile States: Institutions, Policy and the Performance of American State Economies, 112. 48
The idea was formalized by Kenneth Shepsle and Barry Weingast, “Political Preferences for the Pork Barrel: A
Generalization.” American Journal of Political Science, Vol. 26 (February 1981): 96-111. 49
See, for example, John Bradbury and Frank Stephenson, “Local Government Structure and Public Expenditures,”
Public Choice, Vol. 115 (April 2003): 185-98. 50
Thomas Gilligan and John Matsusaka, “Deviations from Constituent Interests: The Role of Legislative Structure
and Political parties in the States,” Economic Inquiry, Vol. 33 (July 1995): 383-401. 51
Jowei Chen and Neil Malhotra, “The Law of k/n: The Effect of Chamber Size on Government Spending in
Bicameral Legislatures,” The American Political Science Review, Vol. 101, No. 4 (Nov 2007): 657-76, 670. 52
Ibid., 658. Emphasis original.
11
14. “Citizen” Legislatures
In some states, legislating is a full-time job. Legislators work year-round, have large professional staffs,
and are paid salaries that make outside work unnecessary. In other states, however, the legislative session
is short, staffs are small, and legislators are paid too little to make legislating their only means of
employment. The theoretical impact of a “professional” versus “citizen” legislature is unclear. A citizen
legislator who spends most of his time outside of the capitol building might be more susceptible to the
persuasions of interest groups than a professional who gets his information from paid staffers. On the
other hand, citizen legislators, because they have other jobs, might not need the legislative job security
that comes with appeasing interest groups.53
Economists Stephanie Owings-Edwards and Rainald Borck examine this question with an “index of
professionalization” which includes factors such as legislative compensation, staff expenditure, and the
length of legislative sessions. They find that a one-standard-deviation increase in professionalization
increases spending by about 10.2 percent.54
15. Direct Democracy
In the late 19th century, a number of states began experimenting with direct democracy by permitting their
citizens to directly vote on legislation in statewide ballots.55
Today, 27 states permit this sort of direct
democracy in one form or another.56
Early studies of direct democracy at the state level concluded that it either had little effect on spending or
that it boosted spending.57
More recent studies that use larger data sets tend to find the opposite effect. For
example, Matsusaka finds that an initiative with a 5-percent signature threshold (the most common
threshold) is associated with per capita spending that is $136 lower.58
The economists Dale Bails and
Margie Tieslau arrive at a similar result, concluding that the initiative tends to decrease per capita
spending by about $158.59
More recently, however, Besley and Case, ran a series of regressions and found that in most of them, the
initiative had little impact on spending.60
Matsusaka has suggested one way to reconcile all of these
findings. He argues that the effect of direct democracy switched at some point in the last several decades,
53
There are a number of other reasons on each side of the argument. 54
Stephanie Owings and Rainald Borck, “Legislative Professionalism and Government Spending: Do Citizen
Legislators Really Spend Less?” Public Finance Review, Vol. 28, (2000): 210-25. 55
An issue placed on the ballot by petition is an initiative. When the legislature places it on the ballot, it is a
referendum. For an overview, see John Matsusaka, For the Many or the Few: The Initiative, Public Policy, and
American Democracy, (Chicago: University of Chicago Press, 2008). 56
For this and other data on direct democracy, see The Initiative and Referendum Institute, The University of
Southern California, http://www.iandrinstitute.org/. 57
Jeffrey Zax found that initiatives were associated with higher levels of spending. See Jeffrey Zax, “Initiatives and
Government Expenditures,” Public Choice, Vol. 63, No. 3 (1989): 267-77. Paul Farnham found no impact. See Paul
Farnham, “The Impact of Citizen Influence on Local Government Expenditure,” Public Choice, Vol. 64, No. 3
(1990): 201-12. 58
John Matsusaka, “Fiscal Effects of Voter Initiative: Evidence from the Last 30 Years,” Journal of Political
Economy, Vol. 103, No. 3 (1995): 587-623. 59
Dale Bails and Margie Tieslau, “The Impact of Fiscal Constitutions on State and Local Expenditures,” Cato
Journal, Vol. 20, No. 2 (Fall 2000): 255-77. 60
In one specification, it did seem to be associated with lower levels of income taxation per capita. Besley and Case,
“Political Institutions and Policy Choices: Evidence from the United States.”
12
and that direct democracy was associated with more spending in the early part of the 20th century and less
spending in recent decades.61
This may be the result of changing public attitudes toward spending.
16. Term Limits
Does limiting the time a politician can spend in office affect spending? Some proponents of term limits
have argued that they break-up the political culture of spending.62
But not everyone agrees. Some
researchers make the case that term limits remove an important check on politicians by freeing them from
the necessity of seeking voter approval in their final terms.63
The empirical investigations of term limits have not clarified matters. Consistent with the view that term
limits lead to more spending, Besley and Case find that Democratic governors tend to spend more in their
second terms when they cannot run again.64
Using a larger dataset, they recently reexamined the question
and observe an odd pattern. Like direct democracy, the effect of gubernatorial term limits seems to have
changed over time. They conclude that gubernatorial term limits lead to more spending in the 1950s,
1960s, and early 1970s, but seem to be associated with less spending from the mid-1970s onward.65
Unfortunately, they write, “We can offer no simple explanation for this pattern.”66
The effects of legislative term limits are no clearer. In their 2000 study, Bails and Tieslau find that
legislative term limits reduce per capita spending by about $173.67
But a more recent study by the
political scientist, Abbie Erler, finds that states with more restrictive legislative term limits actually spend
about $212 more per capita than others.68
In sum, it seems that the evidence on term limits is decidedly
mixed.
Conclusion
Absent policy change, governments at all levels—and those who have come to depend upon them—face a
bleak future. According to projections, both federal and state spending growth is unsustainable,
threatening to push debt-to-GDP ratios well past 90 percent in a matter of decades.69
The 90-percent mark
is important because that is when research suggests that debt begins to hamper economic growth.70
61
John Matsusaka, “Initiative and Referendum” in Encyclopedia of Public Choice, Charles Rowley and Friedrich
Schneider, ed. (USA: Springer, 2004). 62
On the culture of spending, see James Payne, The Culture of Spending: Why Congress Lives Beyond Our Means,
(USA: ICS Press, 1991). 63
Timothy Besley and Anne Case, “Does Political Accountability Affect Economic Policy Choices? Evidence from
Gubernatorial Term Limits,” Quarterly Journal of Economics, Vol. 110, No. 3 (1995): 769-98. 64
Ibid. 65
Besley and Case, “Political Institutions and Policy Choices: Evidence from the United States.” 66
Ibid., 55. 67
Bails and Tieslau. 68
Abbie Erler, “Legislative Term Limits and State Spending,” Public Choice, Vol. 133 (2007): 479-94. 69
According to the CBO’s alternative fiscal scenario (which assumes no change in policy), federal debt held by the
public will exceed 90 percent of GDP within a decade. See Congressional Budget Office, op. cit. And according to
Miron, 17 states will have accumulated net debt levels in excess of 90 percent of GDP by 2030. See Miron, op. cit. 70
Carmen Reinhart and Kenneth Rogoff, “Growth in a Time of Debt,” (working paper, National Bureau of
Economic Research, 2010), http://www.nber.org/papers/w15639.
13
A handful of policies seem to be driving the problem: Medicaid, pensions, and other post-employee
benefits loom large.71
But these policies—like all policies—are themselves the products of the institutions
that helped create them, the rules that influence political outcomes at the state level. These institutions and
their impact on spending have been the subject of extensive study. This paper reviews this research and
highlight more than a dozen institutions that have been shown to limit spending, limit the growth of
spending, or limit the volatility of spending.
After converting all per capita estimates into 2008 dollars, it is clear that separate taxing and spending
committees and item reduction vetoes have the largest effect on per capita spending. These institutions
also happen to be among the least-studied and so further analysis may be warranted. Among the most-
studied of institutions are strict balanced budget requirements, supermajority requirements for tax
increases, and tax and expenditure limits.
In many cases, subsequent study of institutions has yielded more nuanced results. For example, a number
of the institutions this paper discusses are only effective in certain circumstances or when they are
designed in a certain way. This suggests that we may still have much to learn about the institutions that
have received comparatively less attention, such as item\-reduction vetoes. Nevertheless, policy makers
interested in arresting the unsustainable growth of government seem to have a number of tools at their
disposal.
71
State and Local Governments: Fiscal Pressures could Have Implications for Future Delivery of Intergovernmental
Programs, Government Accountability Office, No. 10-899 (July 2010), http://www.gao.gov/new.items/d10899.pdf.
14
Bibliography
Abrams, Burton, and William Dougan. “The Effects of Constitutional Restraints on Government
Spending.” Public Choice 49 (1986): 101-16.
Bails, Dale, and Margie Tieslau. “The Impact of Fiscal Constitutions on State and Local Expenditures.”
Cato Journal 20, no. 2 (2000): 255-277.
Besley, Timothy, and Anne Case. “Does Political Accountability Affect Economic Policy Choices?
Evidence from Gubernatorial Term Limits.” Quarterly Journal of Economics 110, no. 3 (1995): 769-98.
Besley, Timothy, and Anne Case. “Political Institutions and Policy Choices: Evidence from the United
States” Journal of Economic Literature 41, no. 1 (March 2003): 7-73.
Bohn, Henning, and Robert Inman. “Balanced Budget Rules and Public Deficits: Evidence from the U.S.
States.” Carnegie-Rochester Conference Series on Public Policy 45 (1996): 13-76.
Bradbury, John, and Frank Stephenson. “Local Government Structure and Public Expenditures.” Public
Choice 115 (April 2003): 185-98.
Brady, David, and Mark Morgan. “Reforming the Structure of the House Appropriations Process: The
Effects of the 1885 and 1919-1920 Reforms on Money Decisions.” In Congress: Structure and Policy, by
Matthew McCubbins and Terry Sullivan. New York: Cambridge University Press, 1987.
Buchanan, James, and Richard Wagner. Democracy in Deficit. New York: Academic Press, 1977.
California, The University of Southern. The Initiative and Referndum Institute.
http://www.iandrinstitute.org/ (accessed September 2011).
Chen, Jowei, and Neil Malhotra. “The Law of k/n: The Effect of Chamber Size on Government Spending
in Bicameral Legislatures.” The American Political Science Review 101, no. 4 (2007): 657-76.
Clinton v. City of New York. 524 U.S. 417 (Supreme Court, 1998).
Cogan, John. “The Evolution of Congressional Budget Decision Making and the Emergence of Federal
Deficits.” In The Budget Puzzle: Understanding Federal Spending, by John Cogan, Timothy Muris and
Allen Schick. Palo Alto: Stanford University Press, 1994.
Crain, Mark, and James C. Miller III. “Budget Process and Spending Growth.” William and Mary Law
Review 31, no. 4 (1990): 1021-46.
Crain, Mark, and Nicole Crain. “Fiscal Consequences of Budget Baselines.” Journal of Public Economics
67, no. 3 (1998): 421-36.
Crain, Mark, and Timothy Muris. “Legislative Organization of Fiscal Policy.” Journal of Law and
Economics 38, no. 2 (1995): 311-33.
Erler, Abbie. “Legislative Term Limits and State Spending.” Public Choice 133 (2007): 479-94.
Farnham, Paul. “The Impact of Citizen Influence on Local Government Expenditure.” Public Choice 64,
no. 3 (1990): 201-12.
15
Government Accountability Office. State and Local Governments: Fiscal Pressures Could Have
Implications for future Delivery of Intergovernmental Programs. Washington, D.C.: U.S. Government
Printing Office, 2010.
Holtz-Eakin, Douglas. “The Line Item Veto and Public Sector Budgets: Evidence from the states.”
Journal of Public Economics 36 (1988): 269-92.
Johnson, Noel, Matthew Mitchell, and Steven Yamarik. “Pick Your Poison: Do Politicians regulate When
they Can't Spend?” Mercatus Center at George Mason University Working Paper 11-28 (June 2011).
Kearns, Paula. “State budget Periodicity: An Analysis of the Determinants and the Effect on State
Spending.” Journal of Policy Analysis and Management 13, no. 2 (1994): 331-62.
Knight, Brian. “Supermajority Voting Requirements for Tax Increases: Evidence from the States.”
Journal of Public Economics 76, no. 1 (2000).
Kousser, Thad, Matthew McCubbins, and Ellen Moule. “For Whom the TEL Tolls: Can State Tax and
Expenditure Limits Effectively Reducer Spending?” State Politics and Policy Quarterly 8 (2008): 331-61.
“Line Item Veto Act of 1996.” Public Law 104-130. 104th Congress, April 9, 1996.
Madison, James. “No. 51” In The Federalist, by Alexander Hamilton, James Madison and John Jay. New
York: Signet, [1788] 1961.
Matsusaka, John. “Fiscal Effects of Voter Initiative: Evidence from the Last 30 Years.” Journal of
Political Economy 103, no. 3 (1995): 587-623.
—. For the Many or the Few: The Initiative, Public Policy, and American Democracy. Chicago:
University of Chicago Press, 2008.
Matsusaka, John. “Initiative and Referendum.” In Encyclopedia of Public Choice, by Charles Rowley and
Friedrich Schneider, 255-77. USA: Springer, 2004.
Matsusaka, John, and Thomas Gilligan. “Deviations from Constituent Interests: The Role of Legislative
Structure and Political Parties in the States.” Economic Inquiry 33 (1995): 383-401.
Miron, Jeffrey. “The Fiscal Health of U.S. States.” Mercatus Center at George Mason University
Working Paper 11-33 (August 2011).
Mitchell, Matthew. “State Spending Restraint: An Analysis of the Path Not Taken.” Mercatus Center at
George Mason University Working Paper 10-48 (August 2010).
Mitchell, Matthew. “TEL It Like It Is: Do State Tax and Expenditure Limits Actually Limit Spending?”
Mercatus Center at George Mason University Working Paper, no. 71 (December 2010).
National Conference of State Legislatures. September 2008.
http://www.ncsl.org/default.aspx?tabid=12616 (accessed September 2001).
New State Ice Co. v. Liebmann. 285 U.S. 262 (Supreme Court, 1932).
North, Douglass. Institutions, Institutional Change and Economic Performance. New York: Cambridge
University Press, 1990.
Ornstein, Norman. “Why A Balanced-Budget Amendment is Too Risky.” Washington Post, July 29,
2011.
16
Owings, Stephanie, and Rainald Borck. “Legislative Professionalism and Government Spending: Do
Citizen Legislators Really Spend Less?” Public Finance Review 28 (2000): 210-25.
Payne, James. The Culture of Spending: Why Congress Lives Beyond Our Means. USA: ICS Press, 1991.
Primo, David. Rules and Restraint: Government Spending and the Design of Institutions. Chicago, IL:
University of Chicago Press, 2007.
“Reduce Unnecessary Spending Act of 2011.” S. 102. 112th Congress, 1st Session, January 25, 2011.
Reinhart, Carmen, and Kenneth Rogoff. “Growth in a Time of Debt.” American Economic Review Papers
and Proceedings. 2010.
Rose, Shanna. “Do Fiscal Rules Dampen the Political Business Cycle?” Public Choice 128, no. 3/4
(2006): 407-31.
Rueben, Kim, and Carol Rosenberg. “State and Local Tax Policy: What Are Rainy Day Funds and How
do they Work?” In The Tax Policy Briefing Book, 439-465. Tax Policy Center, 2009.
Shadbegian, Ronald. “Do Tax and Expenditure Limitations Affect the Size and Growth of State
Government?” Contemporary Economic Policy 14 (1996): 22-35.
Shepsle, Kenneth, and Barry Weingast. “Political Preferences for the Pork Barrel: A Generalization.”
American Journal of Political Science 26 (1981): 96-111.
U.S. Census Bureau. Population Estimates. http://www.census.gov/popest/eval-estimates/eval-
est2010.html (accessed July 2011).
—. State Government Finances. July 2010. http://www.census.gov/govs/state/historical_data_2008.html
(accessed July 2011).
Vock, Daniel. “Govs Enjoy Quirky Veto Power.” Stateline.org, April 24, 2007.
Wagner, Gary, and Erick Elder. “The Role of Budget Stabilization Funds in Smoothing Government
Expenditures Over the Business Cycle.” Public Finance Review 33, no. 4 (July 2005): 439-65.
Waisanen, Bert. State Tax and Expenditure Limits - 2010. Washington, D.C.: National Conference of
State Legislatures, 2010.
Zax, Jeffrey. “Initiatives and Government Expenditures.” Public Choice 63, no. 3 (1989): 267-77.