Embed Size (px)
Citation preview
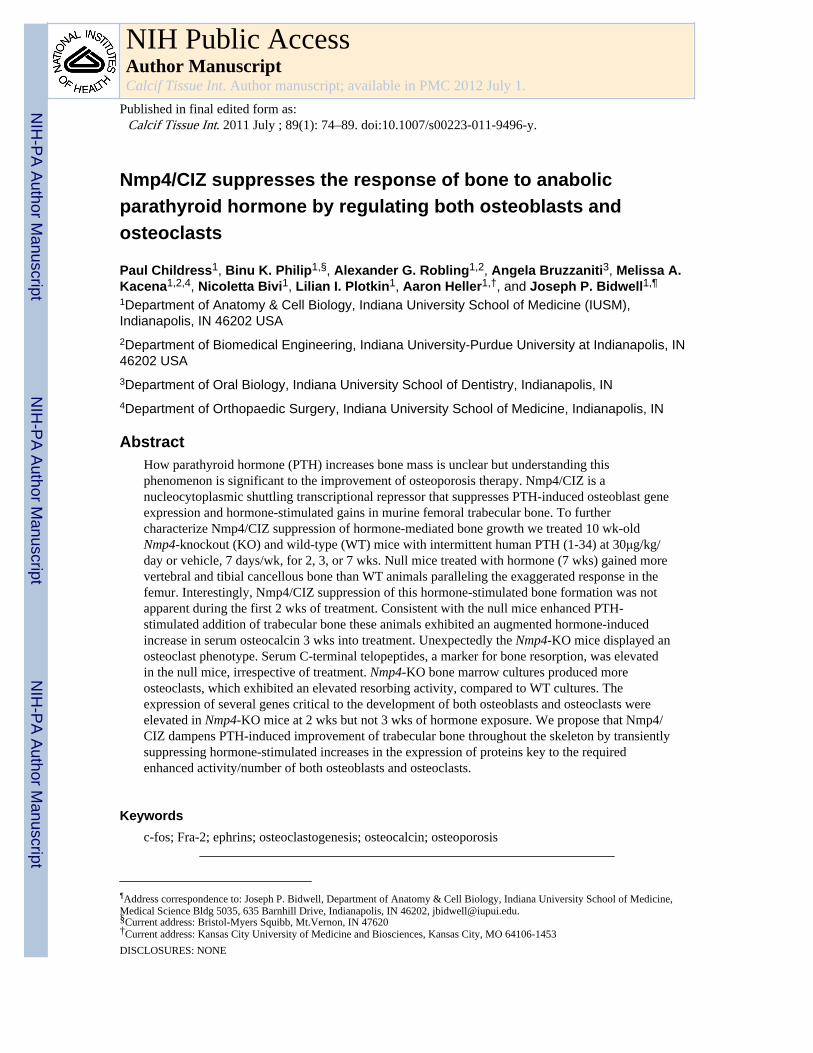
Nmp4/CIZ suppresses the response of bone to anabolicparathyroid hormone by regulating both osteoblasts andosteoclasts
Paul Childress1, Binu K. Philip1,§, Alexander G. Robling1,2, Angela Bruzzaniti3, Melissa A.Kacena1,2,4, Nicoletta Bivi1, Lilian I. Plotkin1, Aaron Heller1,†, and Joseph P. Bidwell1,¶
1Department of Anatomy & Cell Biology, Indiana University School of Medicine (IUSM),Indianapolis, IN 46202 USA2Department of Biomedical Engineering, Indiana University-Purdue University at Indianapolis, IN46202 USA3Department of Oral Biology, Indiana University School of Dentistry, Indianapolis, IN4Department of Orthopaedic Surgery, Indiana University School of Medicine, Indianapolis, IN
AbstractHow parathyroid hormone (PTH) increases bone mass is unclear but understanding thisphenomenon is significant to the improvement of osteoporosis therapy. Nmp4/CIZ is anucleocytoplasmic shuttling transcriptional repressor that suppresses PTH-induced osteoblast geneexpression and hormone-stimulated gains in murine femoral trabecular bone. To furthercharacterize Nmp4/CIZ suppression of hormone-mediated bone growth we treated 10 wk-oldNmp4-knockout (KO) and wild-type (WT) mice with intermittent human PTH (1-34) at 30μg/kg/day or vehicle, 7 days/wk, for 2, 3, or 7 wks. Null mice treated with hormone (7 wks) gained morevertebral and tibial cancellous bone than WT animals paralleling the exaggerated response in thefemur. Interestingly, Nmp4/CIZ suppression of this hormone-stimulated bone formation was notapparent during the first 2 wks of treatment. Consistent with the null mice enhanced PTH-stimulated addition of trabecular bone these animals exhibited an augmented hormone-inducedincrease in serum osteocalcin 3 wks into treatment. Unexpectedly the Nmp4-KO mice displayed anosteoclast phenotype. Serum C-terminal telopeptides, a marker for bone resorption, was elevatedin the null mice, irrespective of treatment. Nmp4-KO bone marrow cultures produced moreosteoclasts, which exhibited an elevated resorbing activity, compared to WT cultures. Theexpression of several genes critical to the development of both osteoblasts and osteoclasts wereelevated in Nmp4-KO mice at 2 wks but not 3 wks of hormone exposure. We propose that Nmp4/CIZ dampens PTH-induced improvement of trabecular bone throughout the skeleton by transientlysuppressing hormone-stimulated increases in the expression of proteins key to the requiredenhanced activity/number of both osteoblasts and osteoclasts.
Keywordsc-fos; Fra-2; ephrins; osteoclastogenesis; osteocalcin; osteoporosis
¶Address correspondence to: Joseph P. Bidwell, Department of Anatomy & Cell Biology, Indiana University School of Medicine,Medical Science Bldg 5035, 635 Barnhill Drive, Indianapolis, IN 46202, [email protected].§Current address: Bristol-Myers Squibb, Mt.Vernon, IN 47620†Current address: Kansas City University of Medicine and Biosciences, Kansas City, MO 64106-1453DISCLOSURES: NONE
NIH Public AccessAuthor ManuscriptCalcif Tissue Int. Author manuscript; available in PMC 2012 July 1.
Published in final edited form as:Calcif Tissue Int. 2011 July ; 89(1): 74–89. doi:10.1007/s00223-011-9496-y.
NIH
-PA Author Manuscript
NIH
-PA Author Manuscript
NIH
-PA Author Manuscript
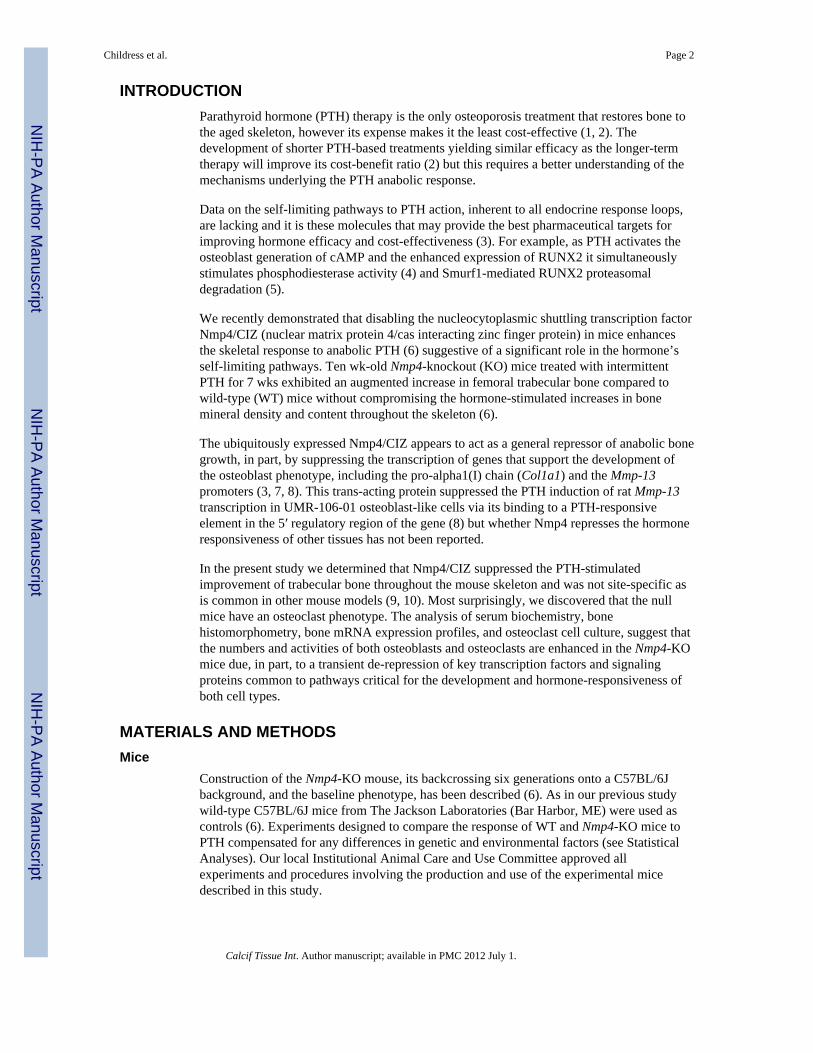
INTRODUCTIONParathyroid hormone (PTH) therapy is the only osteoporosis treatment that restores bone tothe aged skeleton, however its expense makes it the least cost-effective (1, 2). Thedevelopment of shorter PTH-based treatments yielding similar efficacy as the longer-termtherapy will improve its cost-benefit ratio (2) but this requires a better understanding of themechanisms underlying the PTH anabolic response.
Data on the self-limiting pathways to PTH action, inherent to all endocrine response loops,are lacking and it is these molecules that may provide the best pharmaceutical targets forimproving hormone efficacy and cost-effectiveness (3). For example, as PTH activates theosteoblast generation of cAMP and the enhanced expression of RUNX2 it simultaneouslystimulates phosphodiesterase activity (4) and Smurf1-mediated RUNX2 proteasomaldegradation (5).
We recently demonstrated that disabling the nucleocytoplasmic shuttling transcription factorNmp4/CIZ (nuclear matrix protein 4/cas interacting zinc finger protein) in mice enhancesthe skeletal response to anabolic PTH (6) suggestive of a significant role in the hormone’sself-limiting pathways. Ten wk-old Nmp4-knockout (KO) mice treated with intermittentPTH for 7 wks exhibited an augmented increase in femoral trabecular bone compared towild-type (WT) mice without compromising the hormone-stimulated increases in bonemineral density and content throughout the skeleton (6).
The ubiquitously expressed Nmp4/CIZ appears to act as a general repressor of anabolic bonegrowth, in part, by suppressing the transcription of genes that support the development ofthe osteoblast phenotype, including the pro-alpha1(I) chain (Col1a1) and the Mmp-13promoters (3, 7, 8). This trans-acting protein suppressed the PTH induction of rat Mmp-13transcription in UMR-106-01 osteoblast-like cells via its binding to a PTH-responsiveelement in the 5′ regulatory region of the gene (8) but whether Nmp4 represses the hormoneresponsiveness of other tissues has not been reported.
In the present study we determined that Nmp4/CIZ suppressed the PTH-stimulatedimprovement of trabecular bone throughout the mouse skeleton and was not site-specific asis common in other mouse models (9, 10). Most surprisingly, we discovered that the nullmice have an osteoclast phenotype. The analysis of serum biochemistry, bonehistomorphometry, bone mRNA expression profiles, and osteoclast cell culture, suggest thatthe numbers and activities of both osteoblasts and osteoclasts are enhanced in the Nmp4-KOmice due, in part, to a transient de-repression of key transcription factors and signalingproteins common to pathways critical for the development and hormone-responsiveness ofboth cell types.
MATERIALS AND METHODSMice
Construction of the Nmp4-KO mouse, its backcrossing six generations onto a C57BL/6Jbackground, and the baseline phenotype, has been described (6). As in our previous studywild-type C57BL/6J mice from The Jackson Laboratories (Bar Harbor, ME) were used ascontrols (6). Experiments designed to compare the response of WT and Nmp4-KO mice toPTH compensated for any differences in genetic and environmental factors (see StatisticalAnalyses). Our local Institutional Animal Care and Use Committee approved allexperiments and procedures involving the production and use of the experimental micedescribed in this study.
Childress et al. Page 2
Calcif Tissue Int. Author manuscript; available in PMC 2012 July 1.
NIH
-PA Author Manuscript
NIH
-PA Author Manuscript
NIH
-PA Author Manuscript
PTH treatment regimenPrior to the start of an experiment 8 wk-old female WT and Nmp4-KO mice were given100μl sterile saline by subcutaneous (sc) injection once daily to acclimatize them tohandling. At 10 wks of age, mice were sorted into four groups based on equivalent mean-group-body weight. The four treatment groups included 1) vehicle-treated WT; 2) PTH-treated WT; 3) vehicle-treated Nmp4-KO and 4) PTH-treated Nmp4-KO. Mice were injectedsc with human PTH 1-34 (hPTH(1-34), Bachem Bioscience Inc, PA) at 30μg/kg/day, dailyor vehicle control (0.2% BSA/0.1% 1.0 mN HCl in saline, Abbott Laboratory, NorthChicago, IL) for the times specified in the Results. Additionally, animals were administeredby intraperitoneal injection calcein green (20 mg/kg, Sigma-Aldrich, St Louis, MO) andalizarin red (25 mg/kg, Sigma-Aldrich) 6 days and 3 days before euthanasia, respectively.
Dual energy x-ray absorptiometry (DEXA)Bone mineral content (BMC; g), areal bone mineral density (aBMD; mg/cm2), and bodyweight were measured weekly (8 wks to 12 wks of age). The BMC and aBMD wereobtained for the post-cranial skeleton by dual-energy X-ray absorptiometry (DEXA) usingan X-ray PIXImus mouse densitometer (PIXImus II; GE-Lunar Corp., Madison, WI) aspreviously described (6). We report whole body (WB), femur, tibia, and spine BMD andBMC.
Micro computed tomography (μCT)Vertebrae, femurs, and tibiae were dissected from the WT and Nmp4-KO animals aftereuthanasia, the connective tissue and muscle removed, and the bones stored in 10% bufferedformalin at 4°C. After 48 hr the bones were transferred to 70% ethanol and stored at 4°Cuntil analyzed. We have previously described our methodology for assessing the trabecularmicroarchitecture at the distal femoral metaphysis and within the 5th lumbar vertebra usingthe desktop micro-computed μCT 20 tomographer (Scanco Medical AG, Bassersdorf,Switzerland; [6, 9]). Cancellous bone of the tibia was evaluated by scanning the proximal20% of each tibia at 9 μm resolution. A microfocus X-ray tube with a focal spot of 10 μmwas used as a source. Precisely 90 micro-tomograph slices were acquired per bonebeginning 1 mm from the epiphysis and extending distally 1.53 mm using a slice incrementof 17 μm. For each slice, 600 projections were taken over 216° (180° plus half of the fanangle on either side). Proximal tibia stacks were reconstructed to the 3rd dimension using astandard convolution-backprojection procedure with a Shepp-Logan filter using a thresholdvalue of 275. The Scanco software permitted evaluation of tibial, femoral and vertebraltrabecular bone volume per total volume (BV/TV, %), connectivity density (Conn.D,mm−3), structure model index (SMI), trabecular number (Tb.N, mm−1), trabecular thickness(Tb.Th, mm), and spacing (Tb.Sp, mm) from the 3D constructs. To evaluate corticalarchitecture, a single slice was taken through the midshaft femur (simply by measuring thenumber of slices for the whole femur and dividing by 2), and the cortical area (CA, mm2),marrow area (MA, mm2), and the total area (TA, mm2) were calculated (6). Additionally,the moments of inertia, the resistance of the bone to a bending load, were derived from thesedata. These parameters included the greatest (IMAX, mm4) and smallest (IMIN, mm4) flexuralrigidity as well as the polar moment of inertia (J, mm4), which is the torsional and bendingrigidity around the neutral axis of the bone and perpendicular to the x- and y-axes passingthrough the center of mass (11).
Quantitative real-time PCR (qRT-PCR) analysisFemoral or tibial RNA from mice that had been treated with intermittent PTH or vehicle for2 wks or 3 wks was harvested either 1 hr or 24 hrs after the last injection. The harvesting,processing, and analysis protocols for qRT-PCR analysis have been described (6, 9). Real-
Childress et al. Page 3
Calcif Tissue Int. Author manuscript; available in PMC 2012 July 1.
NIH
-PA Author Manuscript
NIH
-PA Author Manuscript
NIH
-PA Author Manuscript
time PCR primers and probes were obtained from Assays-on-Demand™ (AppliedBiosystem, Foster City CA, see Table 1). The ΔΔCT method was used to evaluate geneexpression between WT and KO animals using Rplp2 as the normalizer after screeningseveral housekeeping gene candidates. The coefficient of variation of Rplp2 was typically 2–3% between all samples. Normalization against internal control genes is most frequentlyused because it can control all variables including cell number (12, 13). The data representthe mean ± standard deviation from at least 6 mice per genotype.
Bone histomorphometryFemurs were removed from the WT and Nmp4-KO animals after euthanasia and fixed asdescribed above. The anterior face of the epiphyseal plate was cut to expose the marrowcavity. Samples were then dehydrated with graded alcohols, embedded in methyl-methacrylate, sectioned (4μm) with a Leica RM2255 microtome (Leica Microsystems,Wetzlar, Germany), and mounted on standard microscope slides. All histomorphometricparameters were obtained following ASBMR guidelines (14). Mineral apposition rate(MAR), mineralizing surface (MS/BS) and bone formation rate (BFR), were obtained from a0.03mm2 metaphyseal region of interest from 250μm to 1750μm below the growth plateusing ImagePro 3.1 software (Media Cybernetics, Bethesda, MD, USA). Some sectionswere stained for tartarate resistant acid-phosphatase (TRAP). The number of TRAP-positive(TRAP+) cells on the bone surface (TRAP+ cell N/BS) and the TRAP-stained surface tobone surface (TRAP+ S/BS) were determined.
Serum biochemistryIntact serum osteocalcin was measured using the sandwich ELISA BTI Mouse OsteocalcinEIA Kit (Biomedical Technologies, Inc., Stoughton MA; [15]). Serum C-terminaltelopeptides (CTX) were determined using the RatLaps™ ELISA (ImmunodiagnosticSystems Inc., Scottsdale, AZ; [15]).
Osteoclast culture and activityTo compare the number of osteoclasts derived from Nmp4-KO and WT mice, bone marrowwas flushed from the long bones of 6–8 week-old animals. Cells were seeded into 24-wellculture dishes at an initial density of 2.1×10⁵ cells/mm2 and cultured in alpha-MEM(Invitrogen, Carlsbad, CA) supplemented with 10% FBS (FBS, Hyclone, Logan Utah) and20 ng/ml of recombinant human M-CSF (Peprotech, Rocky Hill, NJ) for 2 days and thensupplemented with 20 ng/ml of recombinant human M-CSF and 80 ng/ml of recombinanthuman RANKL (Peprotech) for the duration of the experiment. The cell culture mediumwas changed every third day until osteoclasts were visible. Once osteoclasts had formed, thecells were fixed with 2.5% glutaraldehyde in phosphate buffered saline for 30 minutes atroom temperature, stained for TRAP (Sigma-Aldrich), and TRAP+, multinucleated (≥3)cells were counted.
The osteoclast resorption activity of cells derived from the KO and WT mice was evaluatedusing a standard pit assay (16). Bone marrow was isolated as above and plated into 6-wellculture dishes at 2×10⁶ cells/well (2.1×10⁵ cells/mm2). As detailed above, cells wereincubated in alpha-MEM containing 10% FBS and 20 ng/ml M-CSF for 2 days. The mediawas removed and replaced with fresh media containing 20 ng/ml M-CSF and 80 ng/mlRANKL for an additional 2–3 days. Mature osteoclasts were detached by trypsinization,washed once, re-plated onto dentin slices (Immunodiagnostics Systems Inc, Fountain Hills,AZ) and cultured for an additional 48 hrs in media containing 20 ng/ml M-CSF and 80 ng/ml RANKL. Dentin slices were washed, incubated in 6% NaOCl for 5 min, and sonicatedfor 20 s to remove cells. Resorption pits were stained with a solution containing 1%toluidine blue and 1% sodium borate for 1 min, washed with water and air-dried. Pit surface
Childress et al. Page 4
Calcif Tissue Int. Author manuscript; available in PMC 2012 July 1.
NIH
-PA Author Manuscript
NIH
-PA Author Manuscript
NIH
-PA Author Manuscript
area was quantified using the ImagePro 7.0 on a Leica DMI4000 with a 10X objective.Results were normalized for osteoclast number, as determined by counting TRAP+ cellscontaining 3 or more nuclei. Experiments were performed in triplicate and results representaverage pit area per dentin slice/OC number.
Statistical analysesStatistical analysis was processed using JMP Version 7.0.1 (SAS Institute, Cary, NC).Experiments designed to compare the response of WT and Nmp4-KO mice to PTHcompensated for any differences in genetic and environmental factors, i.e. the fact that WTmice were not bred in-house was accounted for by our analyses. For example, the raw BMDand BMC data were converted to % change (between 8 and 12 wks of age). Comparinghormone-treated to vehicle-treated within each genotype for all the endpoint analysesremoved baseline differences from those factors and permitted analysis for genotype ×treatment interactions, i.e. whether the WT and Nmp4-KO mice responded differently tohormone for the parameter under consideration. We employed a two-factor ANOVA forthese analyses. If a genotype × treatment interaction was indicated the data were thenanalyzed by a Tukey’s HSD post hoc test to determine significant differences between theexperimental groups. For the serum analysis experiment we used a repeated-measuresmultivariate analysis of variance (MANOVA) to evaluate the raw longitudinal serumosteocalcin and CTX levels over the 7 wk hormone treatment period. Additionally, weconverted the serum data to % change and analyzed with the two-factor ANOVA. Thegenotype × time term for the raw longitudinal serum data is equivalent to the genotype termfor the % change data i.e. both terms indicate a difference in the rate of either osteocalcin/CTX increase or bone accrual (for the BMD/BMC study) between the WT and null mice.For some experiments, unpaired t-tests were employed as indicated. Data are presented asmean ± SD unless otherwise indicated. Statistical significance was taken at p<0.05.
RESULTSNmp4-KO mice exhibited an enhanced PTH-induced acquisition of trabecular bonethroughout the skeleton compared to WT mice after 7 wks but not 2 wks of treatment
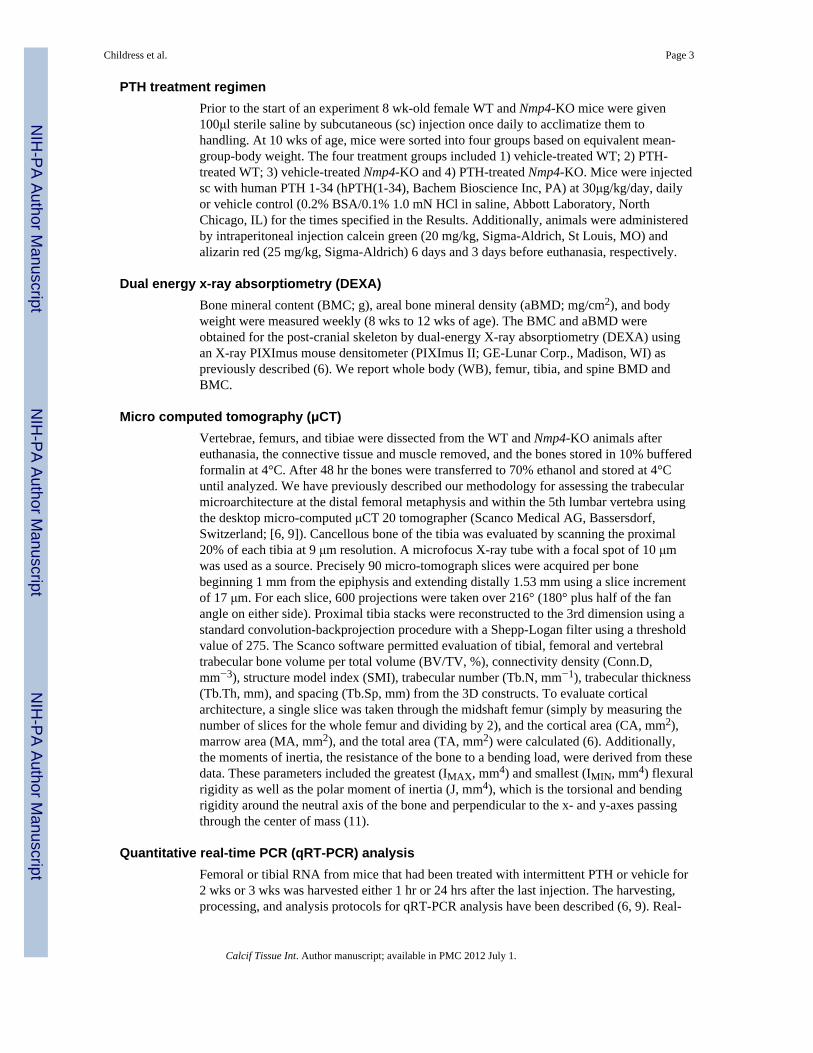
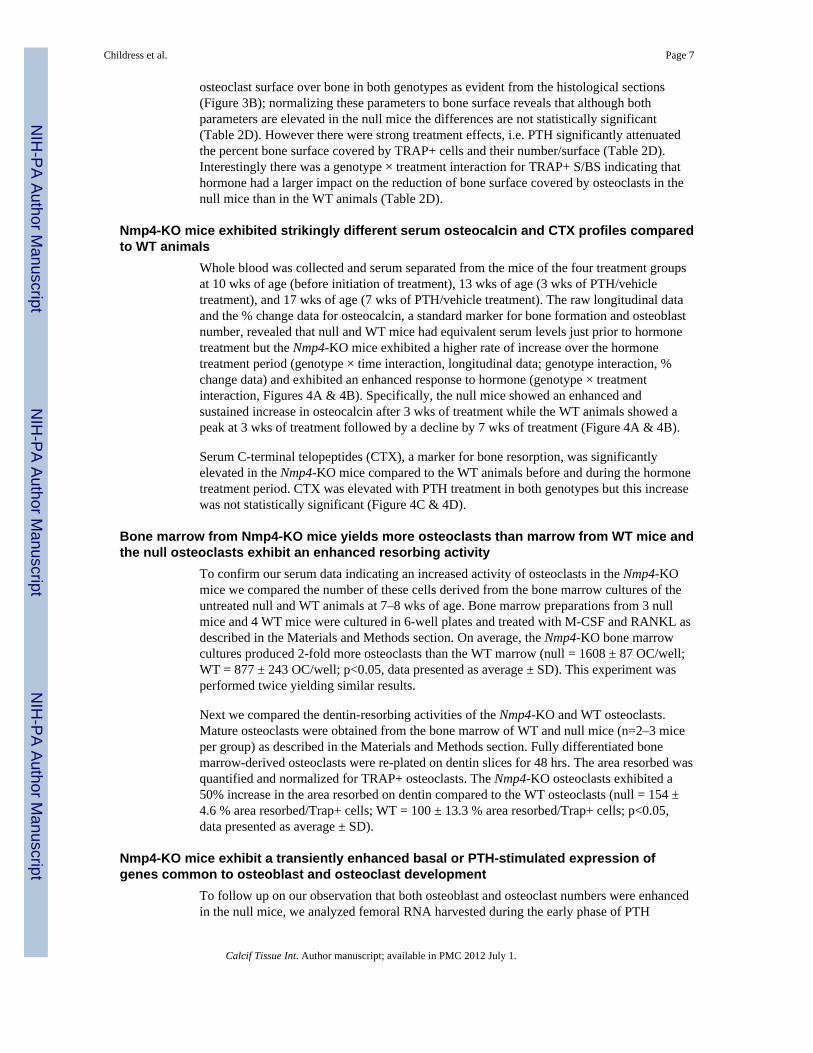
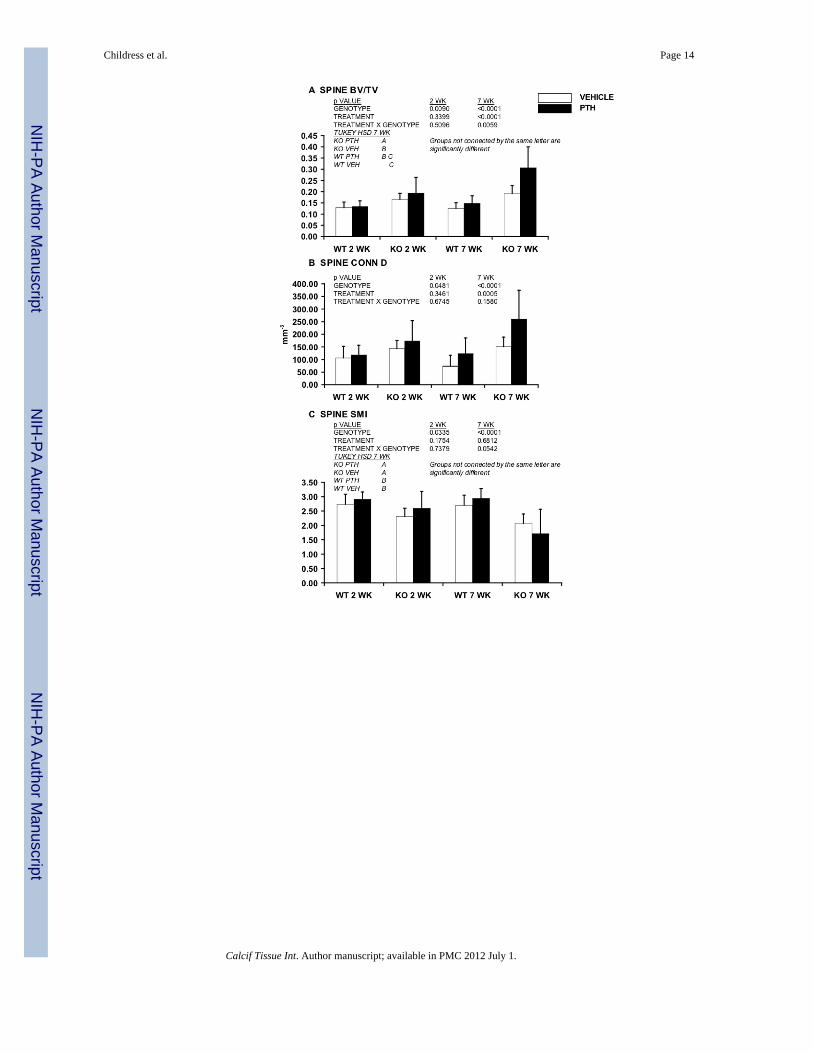
We previously showed that Nmp4-KO mice exhibited a significantly exaggerated PTH-stimulated increase in femoral trabecular bone compared to WT mice after 7 wks ofhormone challenge (6); here we addressed whether Nmp4/CIZ represses PTH-inducedimprovement in other parts of the skeleton and if this suppression is evident from the start ofthe treatment regimen. Animals were treated with intermittent hPTH(1-34) 30μg/kg/day orvehicle for 7 wks from 10 wks of age. Mice were sorted in the four treatment groups and thecancellous architecture characterized as described in the Material and Methods. The Nmp4-KO L5 vertebra BV/TV exhibited a more robust increase in response to 7 wks of PTH thanthe WT BV/TV as demonstrated by a strong treatment effect and significant genotype ×treatment interaction (Figure 1A). The PTH-induced change in vertebral morphology from arod-like to plate-like form was more pronounced in the null mice (SMI, Figure 1C).Vertebral Tb Th was significantly enhanced in response to 7 wks of hormone in the nullmice but not in the WT animals (Figure 1E), whereas PTH had an equivalent impact on TbSp (Figure 1F); a consequence of the fact that these parameters do not have a simplereciprocal relationship (14). PTH had an equivalent impact on Conn D (Figure 1B) in thegenotypes. Finally, there was a strong genotype effect for all the measured vertebralparameters consistent with the more robust trabecular architecture in the null mice (Figures1A–1F). Typical μCT scans of L5 vertebra from mice treated with intermittent hormone orvehicle for 7 wks are shown in Figure 1G.
Childress et al. Page 5
Calcif Tissue Int. Author manuscript; available in PMC 2012 July 1.
NIH
-PA Author Manuscript
NIH
-PA Author Manuscript
NIH
-PA Author Manuscript
To evaluate the early hormone response of the L5 vertebra we compared bones from WTand Nmp4-KO mice that had been treated with PTH or vehicle for 2 wks. The L5 vertebratrabecular bone showed no improvement after 2 wks of hormone in either the WT or nullanimals (Figure 1A–1F). However, there was a genotype effect for BV/TV, Conn D, SMI,and Tb Th (Figures 1A, 1B, 1C, and 1E, respectively), thus the enhanced vertebraltrabecular architecture observed in the 17 wk-old null mice irrespective of treatment, wasapparent in these mice at 12 wks of age.
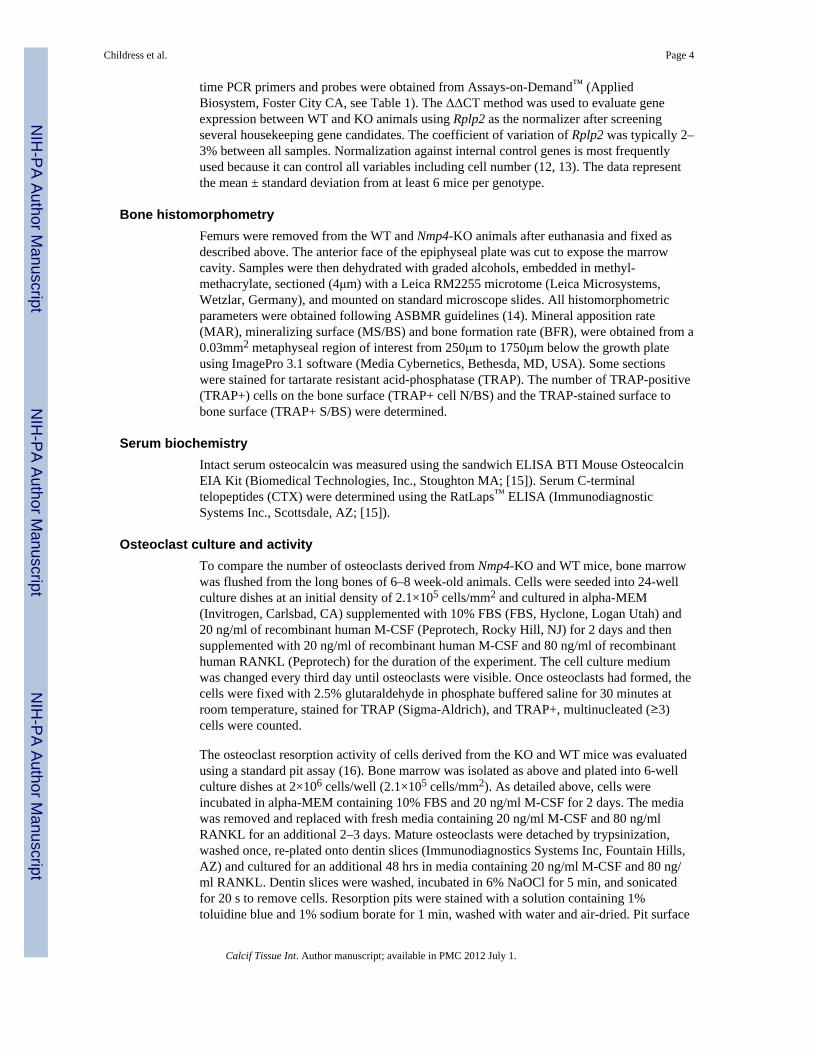
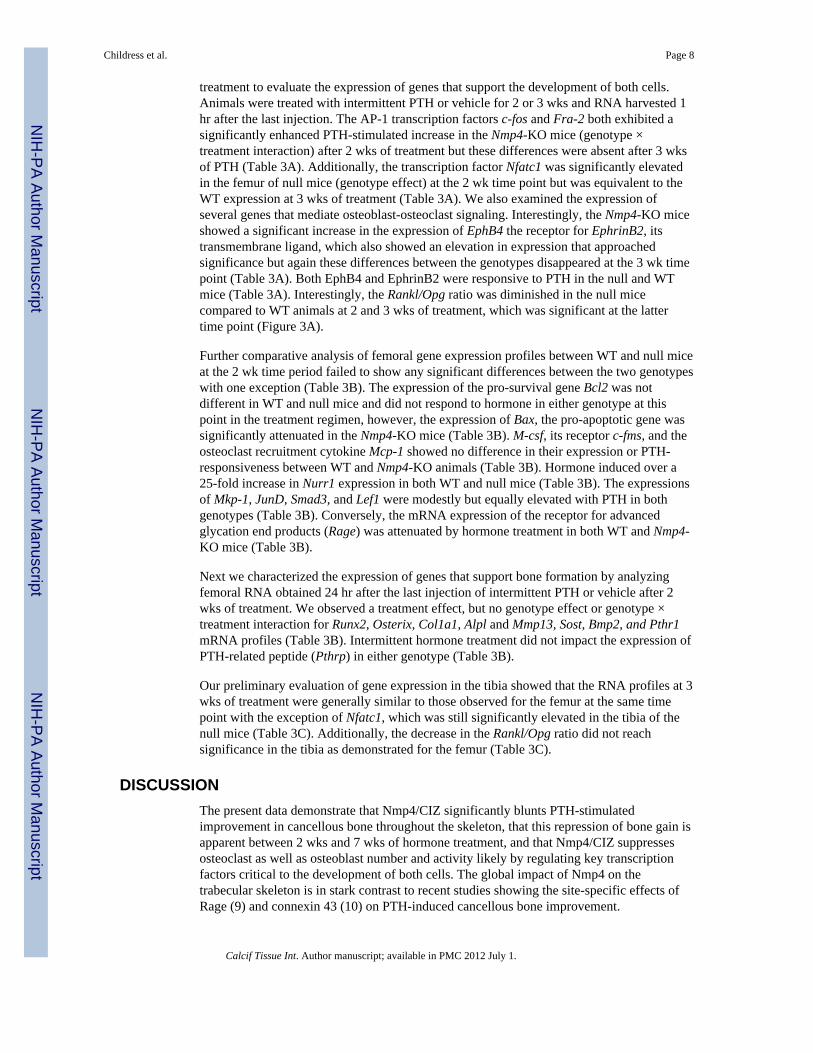
Nmp4/CIZ also repressed the hormone-induced increase in tibial cancellous bone (Figure 2).The PTH-stimulated increase in tibial BV/TV after 7 wks of hormone was greater in the nullthan the WT mice (Figure 2A). PTH increased tibial Tb N in both genotypes butsignificantly more so in the null mice (Figure 2D) and the hormone-stimulated change intibial SMI was more pronounced in the null mice (Figure 2C). PTH had a comparablepositive effect on Conn D (Figure 2B), Tb Th, (Figure 2E), and Tb Sp (Figure 2F) in the WTand null mice with 7 wks of treatment. Typical μCT scans of tibia from mice treated withhormone or vehicle for 7 wks are shown in Figure 2G.
To evaluate the early hormone response of the tibia we compared bones from WT andNmp4-KO mice that had been treated with PTH or vehicle for 2 wks. Both genotypesshowed equal hormone-induced improvement of tibial BV/TV, Conn D, SMI, and Tb Thduring the initial 2 wks of treatment (Figures 2A, 2B, 2C, 2E). PTH failed to improve Tb Nand Tb Sp in both WT and null mice during this period of the regimen, however there was agenotype effect for these two parameters indicating enhanced aspects of tibial architecture inthe null mice at 12 wks of age (Figure 2D & 2F).
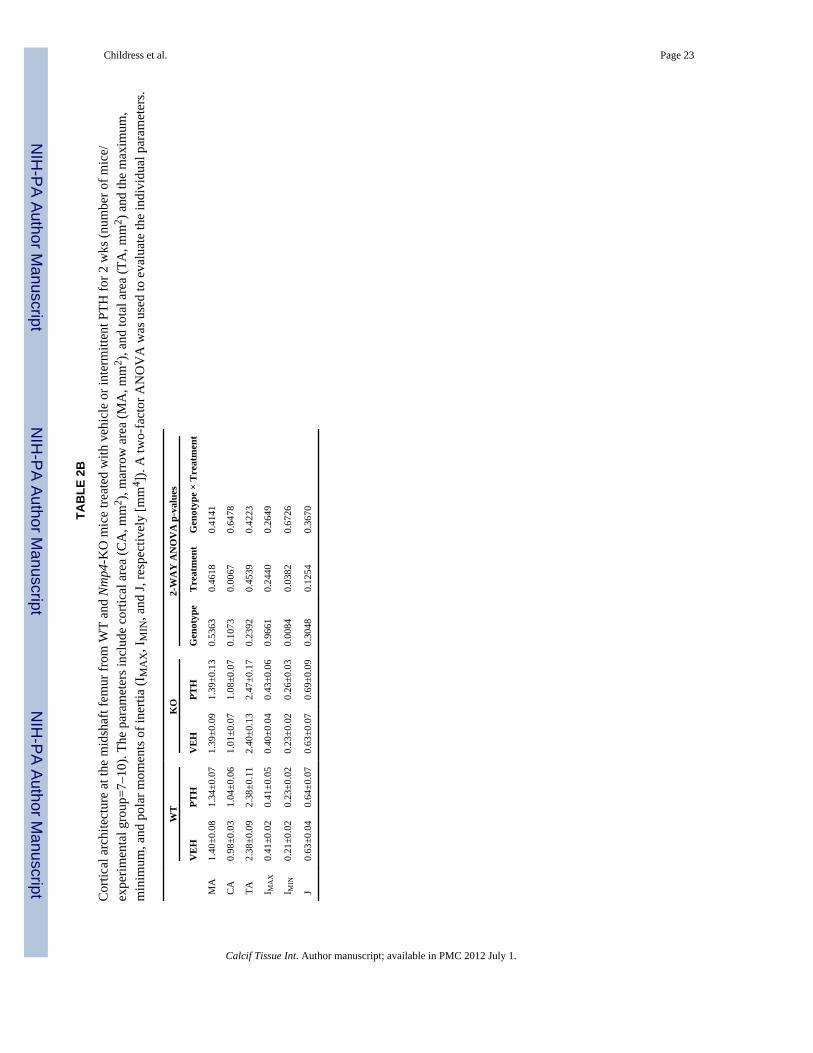
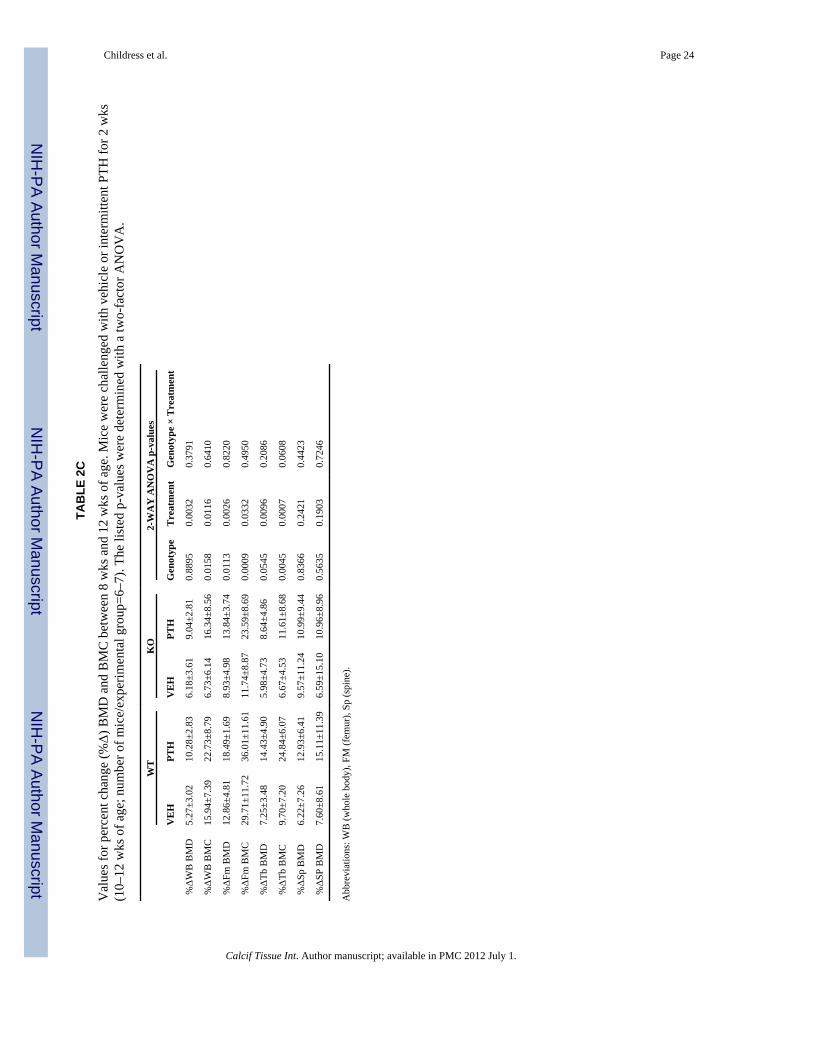
Disabling Nmp4 had no impact on any aspect of the skeletal response to PTH (no genotype× treatment interaction) during the first 2 wks of treatment including femoral cancellousarchitecture (Table 2A), midshaft cortical architecture (Table 2B) and the percent changeskeletal BMD and BMC (Table 2C). Consistent with Nmp4 repressive action on bonegrowth (6) genotype effects were observed for some of these parameters indicative of themodestly enhanced skeletal phenotype of the null animals. Interestingly, the genotypeeffects for WB BMC and femur and tibia BMD and BMC (Table 2C) indicated that the rateof bone accrual was lower in the null mice over the four-week period of measurementirrespective of treatment.
The enhanced PTH-stimulated increase in femoral trabecular bone observed in Nmp4-KOmice occurred after 2 wks and before 7 wks of hormone exposure
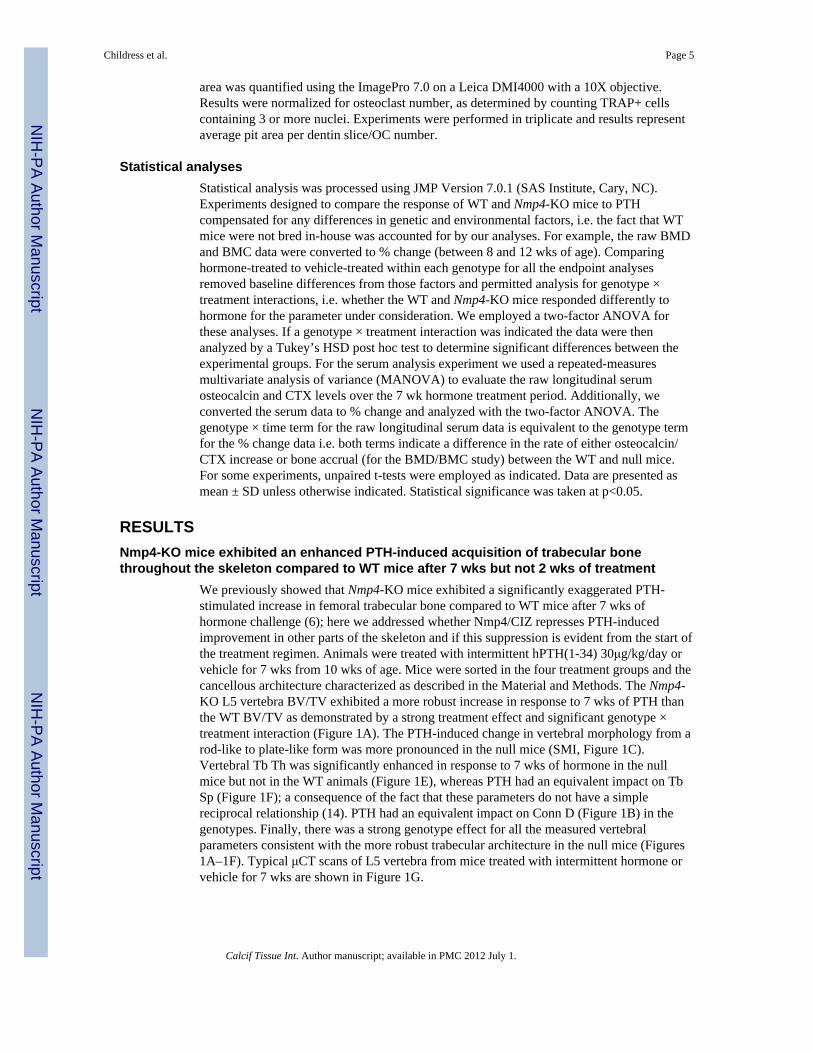
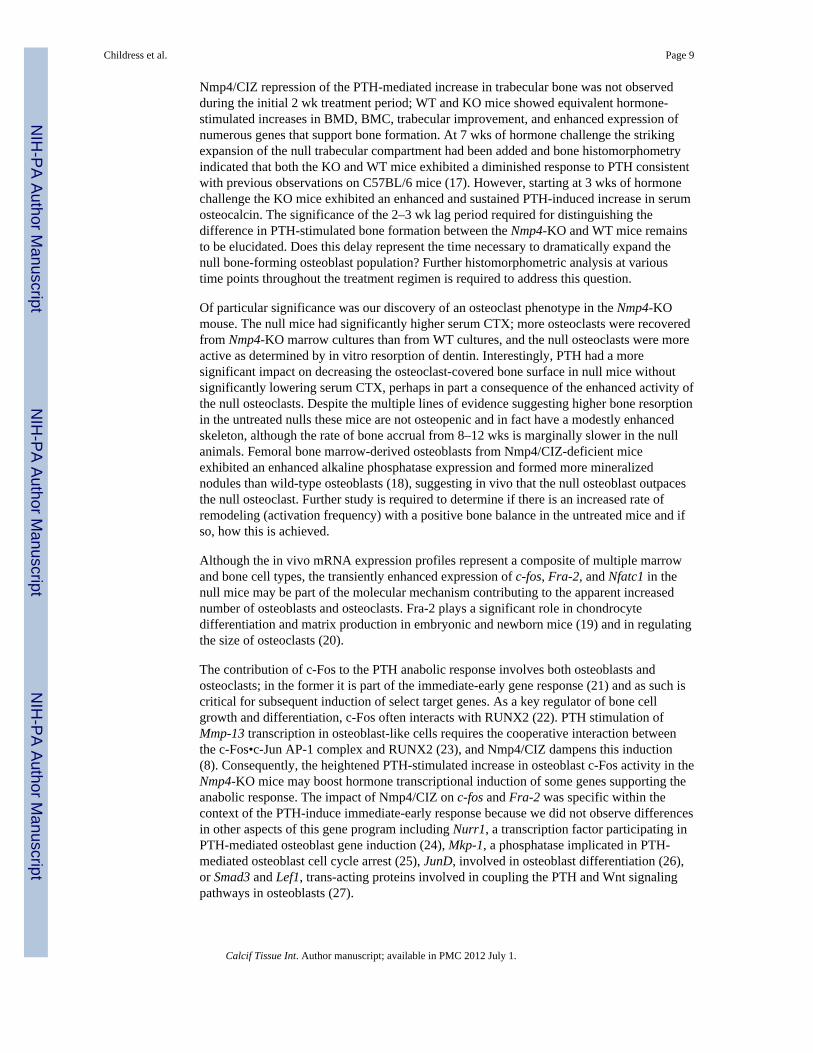
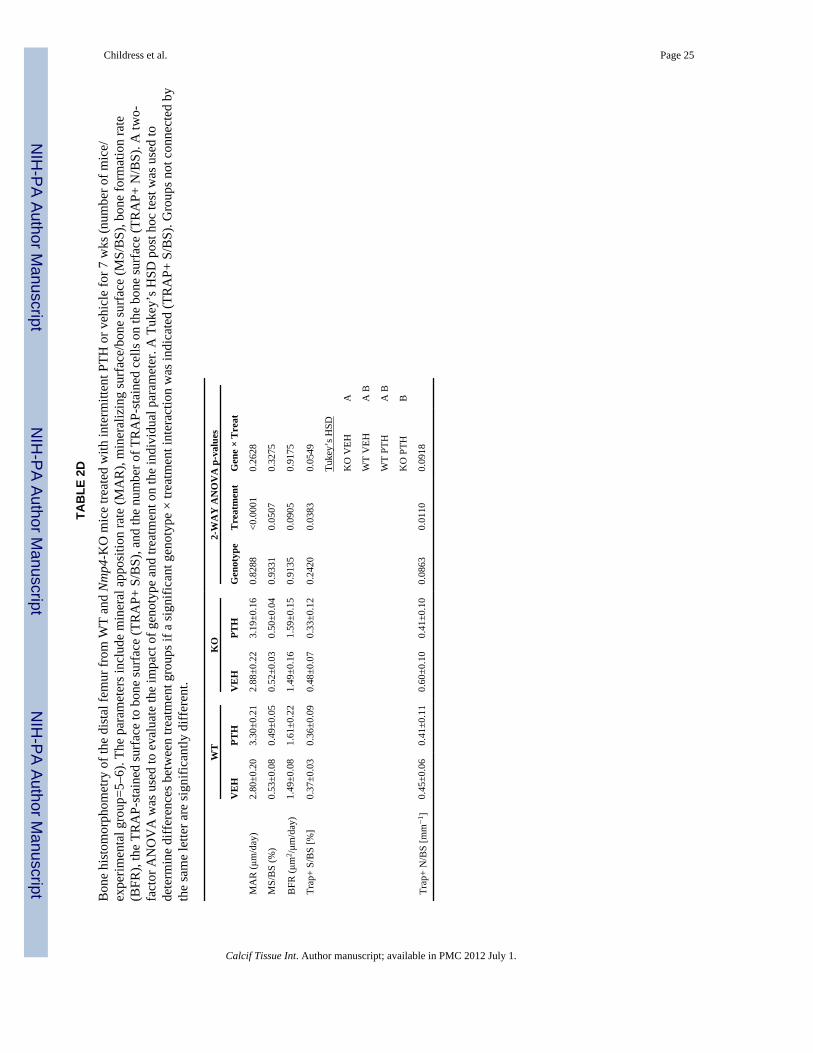
Histological sections of the femoral spongiosa prepared for histomorphometry (Figure 3A)confirmed our previous analysis using μCT (6) that the Nmp4-KO mice added morecancellous bone in response to 7 wks of hormone treatment than WT mice. However, boneformation rate parameters were not different between the null and WT mice at the end oftreatment and in fact were declining suggesting that PTH response was beginning to plateauin both genotypes. MS/BS, proportion of bone surface undergoing mineralization, wassignificantly decreased in both genotype treatment groups consistent with the decliningPTH-responsiveness (Table 2D). Additionally, we did not observe a significant hormone-induced increase in bone formation rate (BFR) in either of the genotypes at this point intreatment (Table 2D). Nevertheless, PTH equally enhanced the mineral apposition rate(MAR) in both genotypes at this time point (Table 2D).
Our histomorphometric analysis of mice treated with PTH or vehicle for 7 wks included theparameters of TRAP+ S/BS and TRAP+ N/BS, which provide an estimate of the size andnumber of osteoclast precursors and mature osteoclasts normalized to bone surface. Clearlythe anabolic hormone treatment enhanced the absolute number of osteoclasts and the total
Childress et al. Page 6
Calcif Tissue Int. Author manuscript; available in PMC 2012 July 1.
NIH
-PA Author Manuscript
NIH
-PA Author Manuscript
NIH
-PA Author Manuscript
osteoclast surface over bone in both genotypes as evident from the histological sections(Figure 3B); normalizing these parameters to bone surface reveals that although bothparameters are elevated in the null mice the differences are not statistically significant(Table 2D). However there were strong treatment effects, i.e. PTH significantly attenuatedthe percent bone surface covered by TRAP+ cells and their number/surface (Table 2D).Interestingly there was a genotype × treatment interaction for TRAP+ S/BS indicating thathormone had a larger impact on the reduction of bone surface covered by osteoclasts in thenull mice than in the WT animals (Table 2D).
Nmp4-KO mice exhibited strikingly different serum osteocalcin and CTX profiles comparedto WT animals
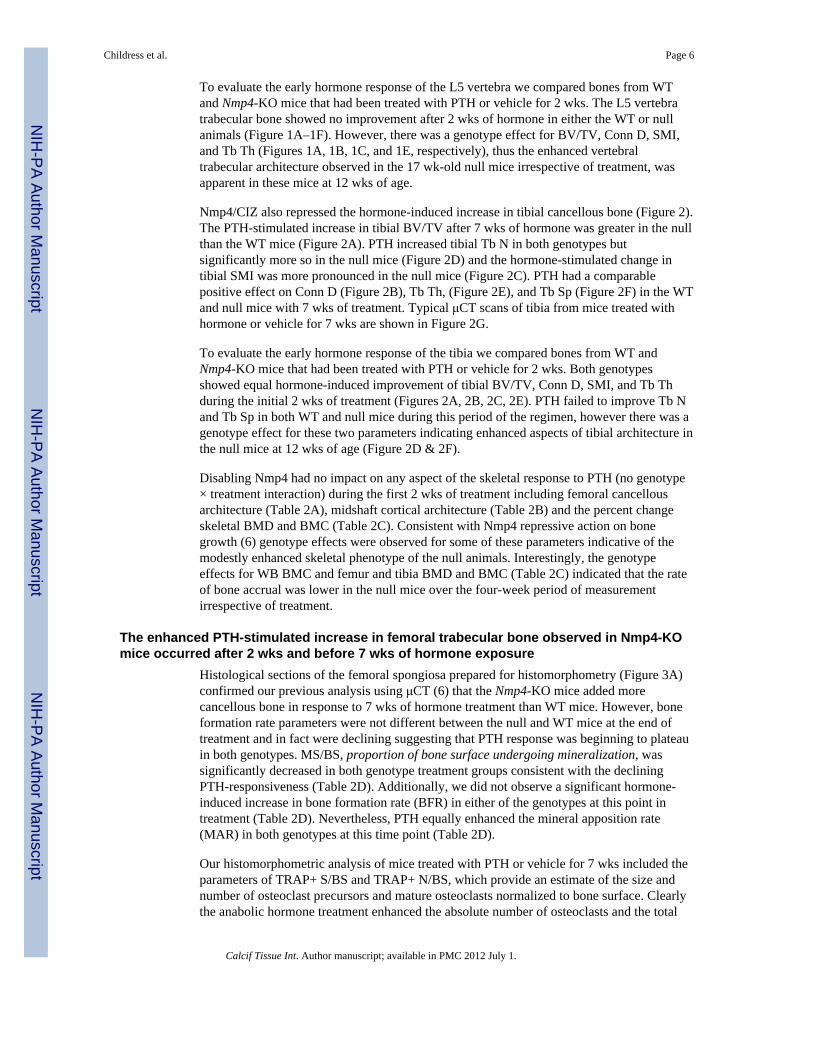
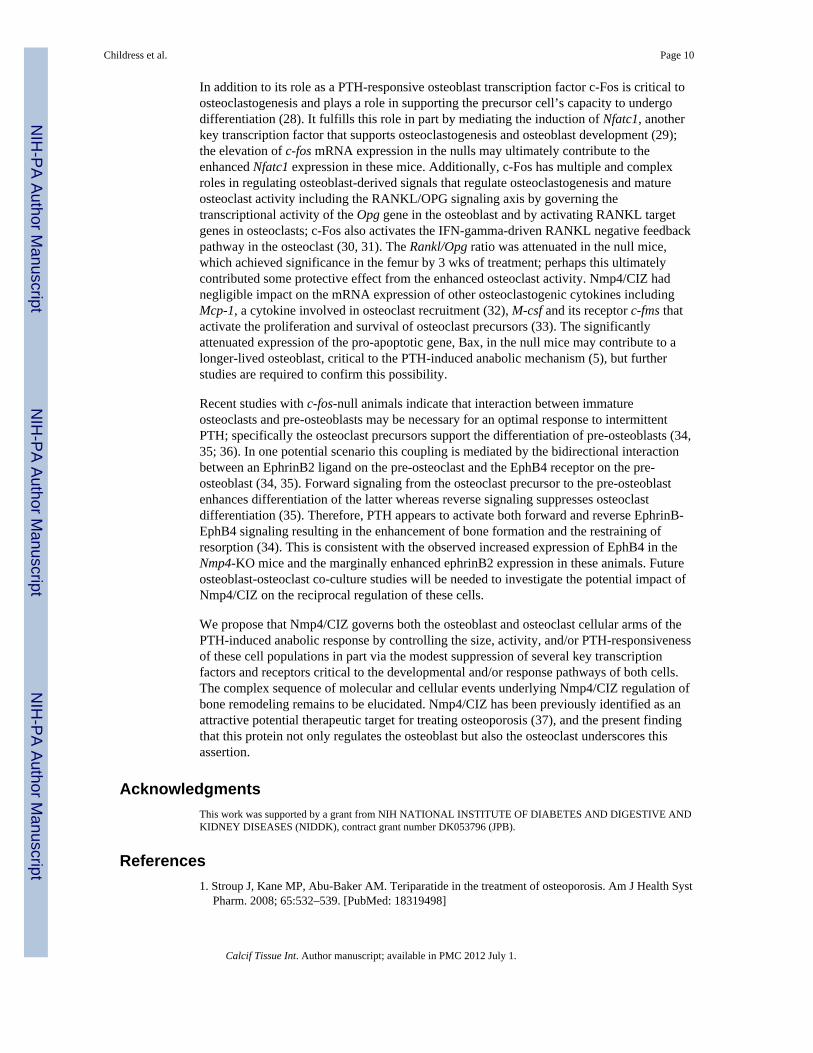
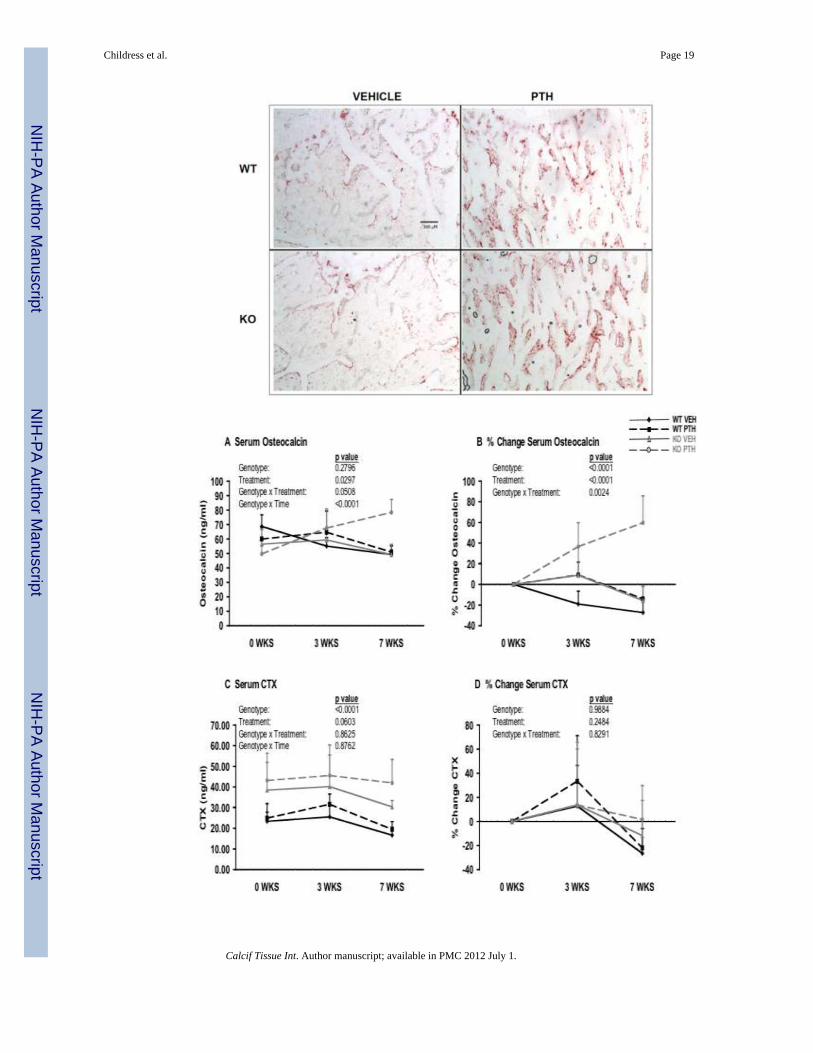
Whole blood was collected and serum separated from the mice of the four treatment groupsat 10 wks of age (before initiation of treatment), 13 wks of age (3 wks of PTH/vehicletreatment), and 17 wks of age (7 wks of PTH/vehicle treatment). The raw longitudinal dataand the % change data for osteocalcin, a standard marker for bone formation and osteoblastnumber, revealed that null and WT mice had equivalent serum levels just prior to hormonetreatment but the Nmp4-KO mice exhibited a higher rate of increase over the hormonetreatment period (genotype × time interaction, longitudinal data; genotype interaction, %change data) and exhibited an enhanced response to hormone (genotype × treatmentinteraction, Figures 4A & 4B). Specifically, the null mice showed an enhanced andsustained increase in osteocalcin after 3 wks of treatment while the WT animals showed apeak at 3 wks of treatment followed by a decline by 7 wks of treatment (Figure 4A & 4B).
Serum C-terminal telopeptides (CTX), a marker for bone resorption, was significantlyelevated in the Nmp4-KO mice compared to the WT animals before and during the hormonetreatment period. CTX was elevated with PTH treatment in both genotypes but this increasewas not statistically significant (Figure 4C & 4D).
Bone marrow from Nmp4-KO mice yields more osteoclasts than marrow from WT mice andthe null osteoclasts exhibit an enhanced resorbing activity
To confirm our serum data indicating an increased activity of osteoclasts in the Nmp4-KOmice we compared the number of these cells derived from the bone marrow cultures of theuntreated null and WT animals at 7–8 wks of age. Bone marrow preparations from 3 nullmice and 4 WT mice were cultured in 6-well plates and treated with M-CSF and RANKL asdescribed in the Materials and Methods section. On average, the Nmp4-KO bone marrowcultures produced 2-fold more osteoclasts than the WT marrow (null = 1608 ± 87 OC/well;WT = 877 ± 243 OC/well; p<0.05, data presented as average ± SD). This experiment wasperformed twice yielding similar results.
Next we compared the dentin-resorbing activities of the Nmp4-KO and WT osteoclasts.Mature osteoclasts were obtained from the bone marrow of WT and null mice (n=2–3 miceper group) as described in the Materials and Methods section. Fully differentiated bonemarrow-derived osteoclasts were re-plated on dentin slices for 48 hrs. The area resorbed wasquantified and normalized for TRAP+ osteoclasts. The Nmp4-KO osteoclasts exhibited a50% increase in the area resorbed on dentin compared to the WT osteoclasts (null = 154 ±4.6 % area resorbed/Trap+ cells; WT = 100 ± 13.3 % area resorbed/Trap+ cells; p<0.05,data presented as average ± SD).
Nmp4-KO mice exhibit a transiently enhanced basal or PTH-stimulated expression ofgenes common to osteoblast and osteoclast development
To follow up on our observation that both osteoblast and osteoclast numbers were enhancedin the null mice, we analyzed femoral RNA harvested during the early phase of PTH
Childress et al. Page 7
Calcif Tissue Int. Author manuscript; available in PMC 2012 July 1.
NIH
-PA Author Manuscript
NIH
-PA Author Manuscript
NIH
-PA Author Manuscript
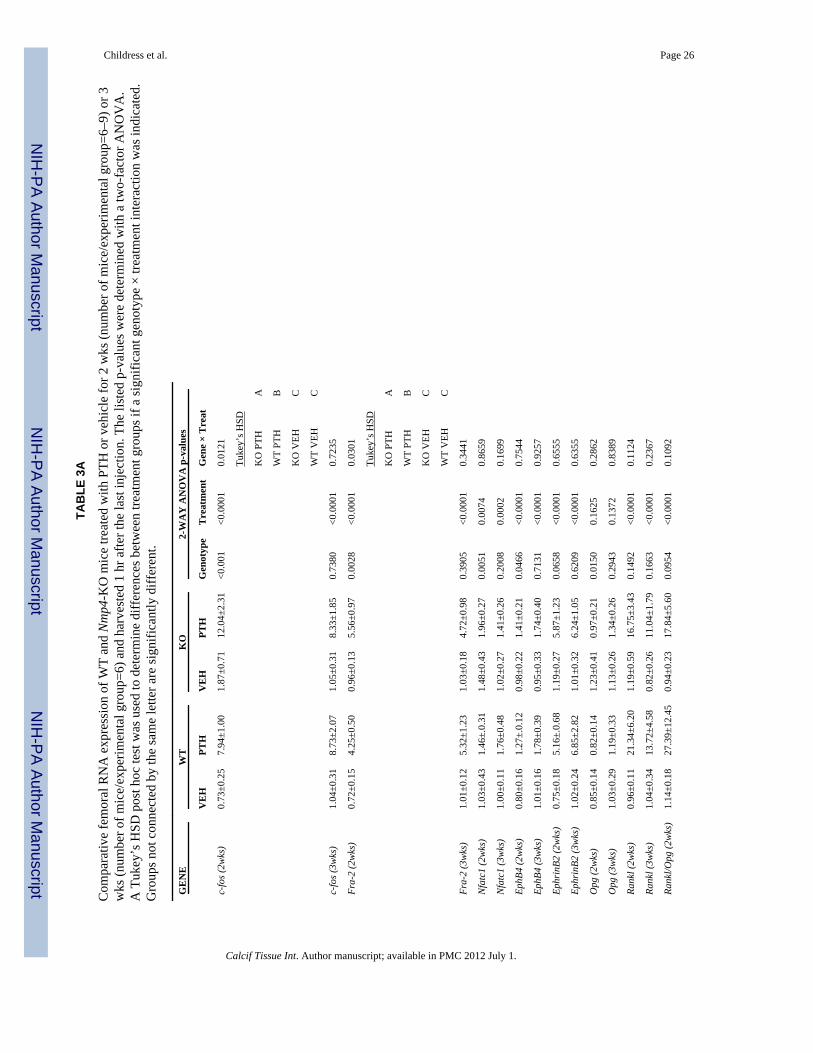
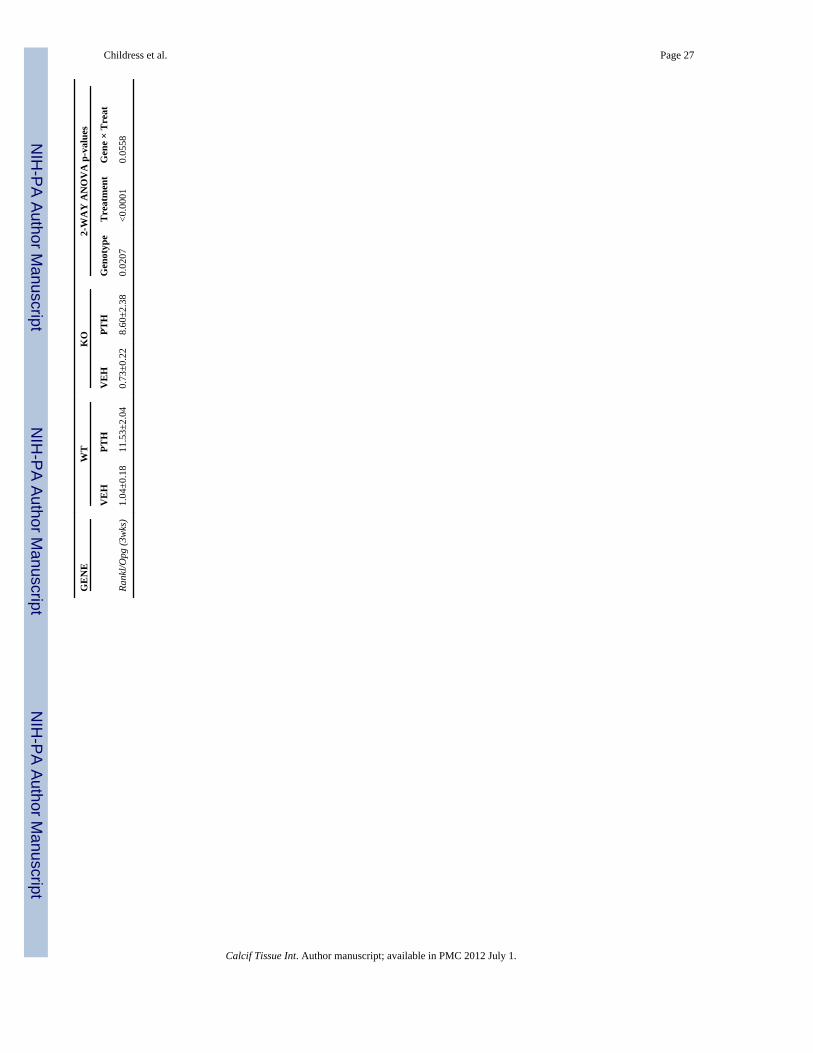
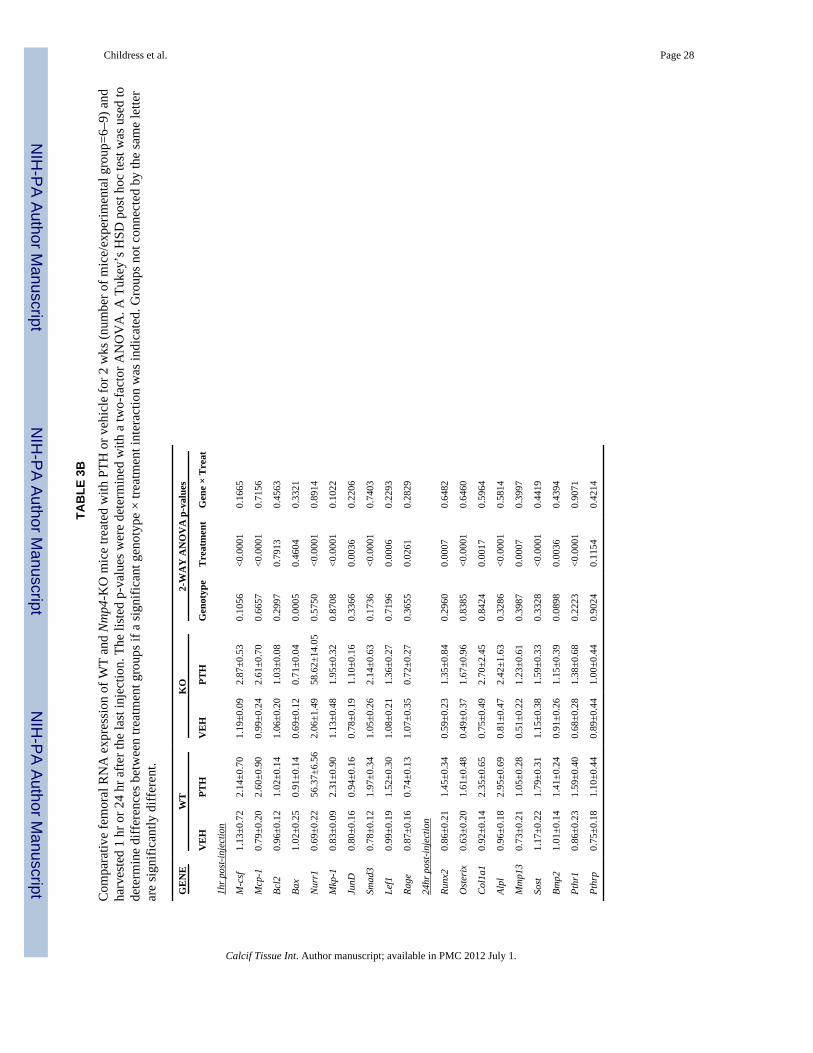
treatment to evaluate the expression of genes that support the development of both cells.Animals were treated with intermittent PTH or vehicle for 2 or 3 wks and RNA harvested 1hr after the last injection. The AP-1 transcription factors c-fos and Fra-2 both exhibited asignificantly enhanced PTH-stimulated increase in the Nmp4-KO mice (genotype ×treatment interaction) after 2 wks of treatment but these differences were absent after 3 wksof PTH (Table 3A). Additionally, the transcription factor Nfatc1 was significantly elevatedin the femur of null mice (genotype effect) at the 2 wk time point but was equivalent to theWT expression at 3 wks of treatment (Table 3A). We also examined the expression ofseveral genes that mediate osteoblast-osteoclast signaling. Interestingly, the Nmp4-KO miceshowed a significant increase in the expression of EphB4 the receptor for EphrinB2, itstransmembrane ligand, which also showed an elevation in expression that approachedsignificance but again these differences between the genotypes disappeared at the 3 wk timepoint (Table 3A). Both EphB4 and EphrinB2 were responsive to PTH in the null and WTmice (Table 3A). Interestingly, the Rankl/Opg ratio was diminished in the null micecompared to WT animals at 2 and 3 wks of treatment, which was significant at the lattertime point (Figure 3A).
Further comparative analysis of femoral gene expression profiles between WT and null miceat the 2 wk time period failed to show any significant differences between the two genotypeswith one exception (Table 3B). The expression of the pro-survival gene Bcl2 was notdifferent in WT and null mice and did not respond to hormone in either genotype at thispoint in the treatment regimen, however, the expression of Bax, the pro-apoptotic gene wassignificantly attenuated in the Nmp4-KO mice (Table 3B). M-csf, its receptor c-fms, and theosteoclast recruitment cytokine Mcp-1 showed no difference in their expression or PTH-responsiveness between WT and Nmp4-KO animals (Table 3B). Hormone induced over a25-fold increase in Nurr1 expression in both WT and null mice (Table 3B). The expressionsof Mkp-1, JunD, Smad3, and Lef1 were modestly but equally elevated with PTH in bothgenotypes (Table 3B). Conversely, the mRNA expression of the receptor for advancedglycation end products (Rage) was attenuated by hormone treatment in both WT and Nmp4-KO mice (Table 3B).
Next we characterized the expression of genes that support bone formation by analyzingfemoral RNA obtained 24 hr after the last injection of intermittent PTH or vehicle after 2wks of treatment. We observed a treatment effect, but no genotype effect or genotype ×treatment interaction for Runx2, Osterix, Col1a1, Alpl and Mmp13, Sost, Bmp2, and Pthr1mRNA profiles (Table 3B). Intermittent hormone treatment did not impact the expression ofPTH-related peptide (Pthrp) in either genotype (Table 3B).
Our preliminary evaluation of gene expression in the tibia showed that the RNA profiles at 3wks of treatment were generally similar to those observed for the femur at the same timepoint with the exception of Nfatc1, which was still significantly elevated in the tibia of thenull mice (Table 3C). Additionally, the decrease in the Rankl/Opg ratio did not reachsignificance in the tibia as demonstrated for the femur (Table 3C).
DISCUSSIONThe present data demonstrate that Nmp4/CIZ significantly blunts PTH-stimulatedimprovement in cancellous bone throughout the skeleton, that this repression of bone gain isapparent between 2 wks and 7 wks of hormone treatment, and that Nmp4/CIZ suppressesosteoclast as well as osteoblast number and activity likely by regulating key transcriptionfactors critical to the development of both cells. The global impact of Nmp4 on thetrabecular skeleton is in stark contrast to recent studies showing the site-specific effects ofRage (9) and connexin 43 (10) on PTH-induced cancellous bone improvement.
Childress et al. Page 8
Calcif Tissue Int. Author manuscript; available in PMC 2012 July 1.
NIH
-PA Author Manuscript
NIH
-PA Author Manuscript
NIH
-PA Author Manuscript
Nmp4/CIZ repression of the PTH-mediated increase in trabecular bone was not observedduring the initial 2 wk treatment period; WT and KO mice showed equivalent hormone-stimulated increases in BMD, BMC, trabecular improvement, and enhanced expression ofnumerous genes that support bone formation. At 7 wks of hormone challenge the strikingexpansion of the null trabecular compartment had been added and bone histomorphometryindicated that both the KO and WT mice exhibited a diminished response to PTH consistentwith previous observations on C57BL/6 mice (17). However, starting at 3 wks of hormonechallenge the KO mice exhibited an enhanced and sustained PTH-induced increase in serumosteocalcin. The significance of the 2–3 wk lag period required for distinguishing thedifference in PTH-stimulated bone formation between the Nmp4-KO and WT mice remainsto be elucidated. Does this delay represent the time necessary to dramatically expand thenull bone-forming osteoblast population? Further histomorphometric analysis at varioustime points throughout the treatment regimen is required to address this question.
Of particular significance was our discovery of an osteoclast phenotype in the Nmp4-KOmouse. The null mice had significantly higher serum CTX; more osteoclasts were recoveredfrom Nmp4-KO marrow cultures than from WT cultures, and the null osteoclasts were moreactive as determined by in vitro resorption of dentin. Interestingly, PTH had a moresignificant impact on decreasing the osteoclast-covered bone surface in null mice withoutsignificantly lowering serum CTX, perhaps in part a consequence of the enhanced activity ofthe null osteoclasts. Despite the multiple lines of evidence suggesting higher bone resorptionin the untreated nulls these mice are not osteopenic and in fact have a modestly enhancedskeleton, although the rate of bone accrual from 8–12 wks is marginally slower in the nullanimals. Femoral bone marrow-derived osteoblasts from Nmp4/CIZ-deficient miceexhibited an enhanced alkaline phosphatase expression and formed more mineralizednodules than wild-type osteoblasts (18), suggesting in vivo that the null osteoblast outpacesthe null osteoclast. Further study is required to determine if there is an increased rate ofremodeling (activation frequency) with a positive bone balance in the untreated mice and ifso, how this is achieved.
Although the in vivo mRNA expression profiles represent a composite of multiple marrowand bone cell types, the transiently enhanced expression of c-fos, Fra-2, and Nfatc1 in thenull mice may be part of the molecular mechanism contributing to the apparent increasednumber of osteoblasts and osteoclasts. Fra-2 plays a significant role in chondrocytedifferentiation and matrix production in embryonic and newborn mice (19) and in regulatingthe size of osteoclasts (20).
The contribution of c-Fos to the PTH anabolic response involves both osteoblasts andosteoclasts; in the former it is part of the immediate-early gene response (21) and as such iscritical for subsequent induction of select target genes. As a key regulator of bone cellgrowth and differentiation, c-Fos often interacts with RUNX2 (22). PTH stimulation ofMmp-13 transcription in osteoblast-like cells requires the cooperative interaction betweenthe c-Fos•c-Jun AP-1 complex and RUNX2 (23), and Nmp4/CIZ dampens this induction(8). Consequently, the heightened PTH-stimulated increase in osteoblast c-Fos activity in theNmp4-KO mice may boost hormone transcriptional induction of some genes supporting theanabolic response. The impact of Nmp4/CIZ on c-fos and Fra-2 was specific within thecontext of the PTH-induce immediate-early response because we did not observe differencesin other aspects of this gene program including Nurr1, a transcription factor participating inPTH-mediated osteoblast gene induction (24), Mkp-1, a phosphatase implicated in PTH-mediated osteoblast cell cycle arrest (25), JunD, involved in osteoblast differentiation (26),or Smad3 and Lef1, trans-acting proteins involved in coupling the PTH and Wnt signalingpathways in osteoblasts (27).
Childress et al. Page 9
Calcif Tissue Int. Author manuscript; available in PMC 2012 July 1.
NIH
-PA Author Manuscript
NIH
-PA Author Manuscript
NIH
-PA Author Manuscript
In addition to its role as a PTH-responsive osteoblast transcription factor c-Fos is critical toosteoclastogenesis and plays a role in supporting the precursor cell’s capacity to undergodifferentiation (28). It fulfills this role in part by mediating the induction of Nfatc1, anotherkey transcription factor that supports osteoclastogenesis and osteoblast development (29);the elevation of c-fos mRNA expression in the nulls may ultimately contribute to theenhanced Nfatc1 expression in these mice. Additionally, c-Fos has multiple and complexroles in regulating osteoblast-derived signals that regulate osteoclastogenesis and matureosteoclast activity including the RANKL/OPG signaling axis by governing thetranscriptional activity of the Opg gene in the osteoblast and by activating RANKL targetgenes in osteoclasts; c-Fos also activates the IFN-gamma-driven RANKL negative feedbackpathway in the osteoclast (30, 31). The Rankl/Opg ratio was attenuated in the null mice,which achieved significance in the femur by 3 wks of treatment; perhaps this ultimatelycontributed some protective effect from the enhanced osteoclast activity. Nmp4/CIZ hadnegligible impact on the mRNA expression of other osteoclastogenic cytokines includingMcp-1, a cytokine involved in osteoclast recruitment (32), M-csf and its receptor c-fms thatactivate the proliferation and survival of osteoclast precursors (33). The significantlyattenuated expression of the pro-apoptotic gene, Bax, in the null mice may contribute to alonger-lived osteoblast, critical to the PTH-induced anabolic mechanism (5), but furtherstudies are required to confirm this possibility.
Recent studies with c-fos-null animals indicate that interaction between immatureosteoclasts and pre-osteoblasts may be necessary for an optimal response to intermittentPTH; specifically the osteoclast precursors support the differentiation of pre-osteoblasts (34,35; 36). In one potential scenario this coupling is mediated by the bidirectional interactionbetween an EphrinB2 ligand on the pre-osteoclast and the EphB4 receptor on the pre-osteoblast (34, 35). Forward signaling from the osteoclast precursor to the pre-osteoblastenhances differentiation of the latter whereas reverse signaling suppresses osteoclastdifferentiation (35). Therefore, PTH appears to activate both forward and reverse EphrinB-EphB4 signaling resulting in the enhancement of bone formation and the restraining ofresorption (34). This is consistent with the observed increased expression of EphB4 in theNmp4-KO mice and the marginally enhanced ephrinB2 expression in these animals. Futureosteoblast-osteoclast co-culture studies will be needed to investigate the potential impact ofNmp4/CIZ on the reciprocal regulation of these cells.
We propose that Nmp4/CIZ governs both the osteoblast and osteoclast cellular arms of thePTH-induced anabolic response by controlling the size, activity, and/or PTH-responsivenessof these cell populations in part via the modest suppression of several key transcriptionfactors and receptors critical to the developmental and/or response pathways of both cells.The complex sequence of molecular and cellular events underlying Nmp4/CIZ regulation ofbone remodeling remains to be elucidated. Nmp4/CIZ has been previously identified as anattractive potential therapeutic target for treating osteoporosis (37), and the present findingthat this protein not only regulates the osteoblast but also the osteoclast underscores thisassertion.
AcknowledgmentsThis work was supported by a grant from NIH NATIONAL INSTITUTE OF DIABETES AND DIGESTIVE ANDKIDNEY DISEASES (NIDDK), contract grant number DK053796 (JPB).
References1. Stroup J, Kane MP, Abu-Baker AM. Teriparatide in the treatment of osteoporosis. Am J Health Syst
Pharm. 2008; 65:532–539. [PubMed: 18319498]
Childress et al. Page 10
Calcif Tissue Int. Author manuscript; available in PMC 2012 July 1.
NIH
-PA Author Manuscript
NIH
-PA Author Manuscript
NIH
-PA Author Manuscript
2. Liu H, Michaud K, Nayak S, Karpf DB, Owens DK, Garber AM. The cost-effectiveness of therapywith teriparatide and alendronate in women with severe osteoporosis. Arch Intern Med. 2006;166:1209–1217. [PubMed: 16772249]
3. Childress P, Robling AG, Bidwell JP. Nmp4/CIZ: road block at the intersection of PTH and load.Bone. 2010; 46:259–266. [PubMed: 19766748]
4. Ahlström M, Lamberg-Allardt C. Rapid protein kinase A-mediated activation of cyclic AMP-phosphodiesterase by parathyroid hormone in UMR-106 osteoblast-like cells. J Bone Miner Res.1997; 12:172–8. [PubMed: 9041048]
5. Bellido T, Ali AA, Plotkin LI, Fu Q, Gubrij I, Roberson PK, Weinstein RS, O’Brien CA, ManolagasSC, Jilka RL. Proteasomal degradation of Runx2 shortens parathyroid hormone-induced anti-apoptotic signaling in osteoblasts. A putative explanation for why intermittent administration isneeded for bone anabolism. J Biol Chem. 2003; 278:50259–50272. [PubMed: 14523023]
6. Robling AG, Childress P, Yu J, Cotte J, Heller A, Philip BK, Bidwell JP. Nmp4/CIZ suppressesparathyroid hormone-induced increases in trabecular bone. J Cell Physiol. 2009
7. Thunyakitpisal P, Alvarez M, Tokunaga K, Onyia JE, Hock J, Ohashi N, Feister H, Rhodes SJ,Bidwell JP. Cloning and functional analysis of a family of nuclear matrix transcription factors (NP/NMP4) that regulate type I collagen expression in osteoblasts. J Bone Miner Res. 2001; 16:10–23.[PubMed: 11149472]
8. Shah R, Alvarez M, Jones DR, Torrungruang K, Watt AJ, Selvamurugan N, Partridge NC, QuinnCO, Pavalko FM, Rhodes SJ, Bidwell JP. Nmp4/CIZ regulation of matrix metalloproteinase 13(MMP-13) response to parathyroid hormone in osteoblasts. Am J Physiol Endocrinol Metab. 2004;287:E289–96. [PubMed: 15026307]
9. Philip BK, Childress PJ, Robling AG, Heller A, Nawroth PP, Bierhaus A, Bidwell JP. RAGEsupports parathyroid hormone-induced gains in femoral trabecular bone. Am J Physiol EndocrinolMetab. 2010; 298:E714–E725. [PubMed: 20028966]
10. Chung DJ, Castro CH, Watkins M, Stains JP, Chung MY, Szejnfeld VL, Willecke K, Theis M,Civitelli R. Low peak bone mass and attenuated anabolic response to parathyroid hormone in micewith an osteoblast-specific deletion of connexin43. J Cell Sci. 2006; 119:4187–4198. [PubMed:16984976]
11. Cheng S, Sipilä S, Taaffe DR, Puolakka J, Suominen H. Change in bone mass distribution inducedby hormone replacement therapy and high-impact physical exercise in post-menopausal women.Bone. 2002; 31:126–135. [PubMed: 12110425]
12. Goossens K, Van Poucke M, Van Soom A, Vandesompele J, Van Zeveren A, Peelman LJ.Selection of reference genes for quantitative real-time PCR in bovine preimplantation embryos.BMC Dev Biol. 2005:5–27. [PubMed: 15725348]
13. Zhang X, Ding L, Sandford AJ. Selection of reference genes for gene expression studies in humanneutrophils by real-time PCR. BMC Mol Biol. 2005; 6:4. [PubMed: 15720708]
14. Parfitt AM, Drezner MK, Glorieux FH, Kanis JA, Malluche H, Meunier PJ, Ott SM, Recker RR.Bone histomorphometry: standardization of nomenclature, symbols, and units. Report of theASBMR Histomorphometry Nomenclature Committee. J Bone Miner Res. 1987; 2:595–610.[PubMed: 3455637]
15. O’Brien CA, Plotkin LI, Galli C, Goellner JJ, Gortazar AR, Allen MR, Robling AG, Bouxsein M,Schipani E, Turner CH, Jilka RL, Weinstein RS, Manolagas SC, Bellido T. Control of bone massand remodeling by PTH receptor signaling in osteocytes. PLoS One. 2008; 3:e2942. [PubMed:18698360]
16. Tanaka S, Amling M, Neff L, Peyman A, Uhlmann E, Levy JB, Baron R. c-Cbl is downstream ofc-Src in a signalling pathway necessary for bone resorption. Nature. 1996; 383:528–531.[PubMed: 8849724]
17. Iida-Klein A, Zhou H, Lu SS, Levine LR, Ducayen-Knowles M, Dempster DW, Nieves J, LindsayR. Anabolic action of parathyroid hormone is skeletal site specific at the tissue and cellular levelsin mice. J Bone Miner Res. 2002; 17:808–816. [PubMed: 12009011]
18. Morinobu M, Nakamoto T, Hino K, Tsuji K, Shen ZJ, Nakashima K, Nifuji A, Yamamoto H, HiraiH, Noda M. The nucleocytoplasmic shuttling protein CIZ reduces adult bone mass by inhibiting
Childress et al. Page 11
Calcif Tissue Int. Author manuscript; available in PMC 2012 July 1.
NIH
-PA Author Manuscript
NIH
-PA Author Manuscript
NIH
-PA Author Manuscript
bone morphogenetic protein-induced bone formation. J Exp Med. 2005; 201:961–970. [PubMed:15781586]
19. Karreth F, Hoebertz A, Scheuch H, Eferl R, Wagner EF. The AP1 transcription factor Fra2 isrequired for efficient cartilage development. Development. 2004; 131:5717–25. [PubMed:15509771]
20. Bozec A, Bakiri L, Hoebertz A, Eferl R, Schilling AF, Komnenovic V, Scheuch H, Priemel M,Stewart CL, Amling M, Wagner EF. Osteoclast size is controlled by Fra-2 through LIF/LIF-receptor signalling and hypoxia. Nature. 2008; 454:221–5. [PubMed: 18548006]
21. Liang JD, Hock JM, Sandusky GE, Santerre RF, Onyia JE. Immunohistochemical localization ofselected early response genes expressed in trabecular bone of young rats given hPTH 1-34. CalcifTissue Int. 1999; 65:369–373. [PubMed: 10541762]
22. Qin L, Raggatt LJ, Partridge NC. Parathyroid hormone: a double-edged sword for bonemetabolism. Trends Endocrinol Metab. 2004; 15:60–65. [PubMed: 15036251]
23. D’Alonzo RC, Selvamurugan N, Karsenty G, Partridge NC. Physical interaction of the activatorprotein-1 factors c-Fos and c-Jun with Cbfa1 for collagenase-3 promoter activation. J Biol Chem.2002; 277:816–822. [PubMed: 11641401]
24. Nervina JM, Magyar CE, Pirih FQ, Tetradis S. PGC-1alpha is induced by parathyroid hormone andcoactivates Nurr1-mediated promoter activity in osteoblasts. Bone. 2006; 39:1018–25. [PubMed:16765661]
25. Qin L, Li X, Ko JK, Partridge NC. Parathyroid hormone uses multiple mechanisms to arrest thecell cycle progression of osteoblastic cells from G1 to S phase. J Biol Chem. 2005; 280:3104–11.[PubMed: 15513917]
26. Wagner EF. Bone development and inflammatory disease is regulated by AP-1 (Fos/Jun). AnnRheum Dis. 2010; 69(Suppl 1):i86–88. [PubMed: 19995753]
27. Tobimatsu T, Kaji H, Sowa H, Naito J, Canaff L, Hendy GN, Sugimoto T, Chihara K. Parathyroidhormone increases beta-catenin levels through Smad3 in mouse osteoblastic cells. Endocrinology.2006; 147(5):2583–2590. [PubMed: 16484320]
28. Boyle WJ, Simonet WS, Lacey DL. Osteoclast differentiation and activation. Nature. 2003;423:337–342. [PubMed: 12748652]
29. Takayanagi H. The role of NFAT in osteoclast formation. Ann N Y Acad Sci. 2007; 1116:227–237. [PubMed: 18083930]
30. Takayanagi H, Kim S, Matsuo K, Suzuki H, Suzuki T, Sato K, Yokochi T, Oda H, Nakamura K,Ida N, Wagner EF, Taniguchi T. RANKL maintains bone homeostasis through c-fos-dependentinduction of interferon-beta. Nature. 2002; 416:744–749. [PubMed: 11961557]
31. Fu Q, Jilka RL, Manolagas SC, O’Brien CA. Parathyroid hormone stimulates receptor activator ofNFkappa B ligand and inhibits osteoprotegerin expression via protein kinase A activation ofcAMP-response element-binding protein. J Biol Chem. 2002; 277:48868–48875. [PubMed:12364326]
32. Li X, Qin L, Bergenstock M, Bevelock LM, Novack DV, Partridge NC. Parathyroid hormonestimulates osteoblastic expression of MCP-1 to recruit and increase the fusion of pre/osteoclasts. JBiol Chem. 2007; 282:33098–106. [PubMed: 17690108]
33. Negishi-Koga T, Takayanagi H. Ca2+-NFATc1 signaling is an essential axis of osteoclastdifferentiation. Immunol Rev. 2009; 231:241–256. [PubMed: 19754901]
34. Luiz de Freitas PH, Li M, Ninomiya T, Nakamura M, Ubaidus S, Oda K, Udagawa N, Maeda T,Takagi R, Amizuka N. Intermittent PTH administration stimulates pre-osteoblastic proliferationwithout leading to enhanced bone formation in osteoclast-less c-fos(−/−) mice. J Bone Miner Res.2009; 24:1586–1597. [PubMed: 19419301]
35. Zhao C, Irie N, Takada Y, Shimoda K, Miyamoto T, Nishiwaki T, Suda T, Matsuo K. BidirectionalephrinB2-EphB4 signaling controls bone homeostasis. Cell Metab. 2006; 4:111–121. [PubMed:16890539]
36. Koh AJ, Demiralp B, Neiva KG, Hooten J, Nohutcu RM, Shim H, Datta NS, Taichman RS,McCauley LK. Cells of the osteoclast lineage as mediators of the anabolic actions of parathyroidhormone in bone. Endocrinology. 2005; 146(11):4584–4596. [PubMed: 16081645] Allen MR,
Childress et al. Page 12
Calcif Tissue Int. Author manuscript; available in PMC 2012 July 1.
NIH
-PA Author Manuscript
NIH
-PA Author Manuscript
NIH
-PA Author Manuscript
Burr DB. Parathyroid hormone and bone biomechanics Clinical Reviews in Bone and MineralMetabolism. 2006; 4:259–68.
37. Krane SM. Identifying genes that regulate bone remodeling as potential therapeutic targets. J ExpMed. 2005; 201:841–843. [PubMed: 15781576]
Childress et al. Page 13
Calcif Tissue Int. Author manuscript; available in PMC 2012 July 1.
NIH
-PA Author Manuscript
NIH
-PA Author Manuscript
NIH
-PA Author Manuscript
Childress et al. Page 14
Calcif Tissue Int. Author manuscript; available in PMC 2012 July 1.
NIH
-PA Author Manuscript
NIH
-PA Author Manuscript
NIH
-PA Author Manuscript
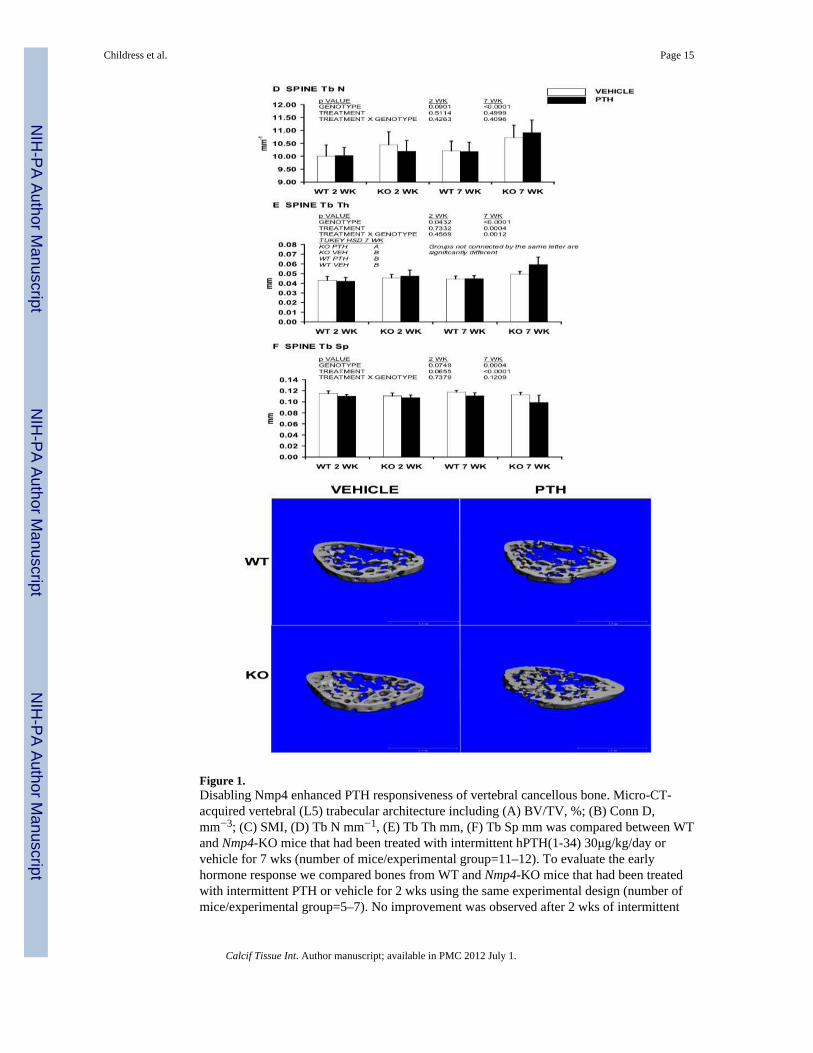
Figure 1.Disabling Nmp4 enhanced PTH responsiveness of vertebral cancellous bone. Micro-CT-acquired vertebral (L5) trabecular architecture including (A) BV/TV, %; (B) Conn D,mm−3; (C) SMI, (D) Tb N mm−1, (E) Tb Th mm, (F) Tb Sp mm was compared between WTand Nmp4-KO mice that had been treated with intermittent hPTH(1-34) 30μg/kg/day orvehicle for 7 wks (number of mice/experimental group=11–12). To evaluate the earlyhormone response we compared bones from WT and Nmp4-KO mice that had been treatedwith intermittent PTH or vehicle for 2 wks using the same experimental design (number ofmice/experimental group=5–7). No improvement was observed after 2 wks of intermittent
Childress et al. Page 15
Calcif Tissue Int. Author manuscript; available in PMC 2012 July 1.
NIH
-PA Author Manuscript
NIH
-PA Author Manuscript
NIH
-PA Author Manuscript
PTH treatment in either the WT or null animals (A–F). There was a genotype effect for BV/TV, Conn D, SMI, and Tb Th (A, B, C, and E, respectively) consistent with the enhancedtrabecular architecture of the null mice, regardless of treatment. (G) μCT images of vertebraltrabecular bone from WT and Nmp4-KO mice that had been treated with intermittent PTHor vehicle for 7 wks, Scale bar=1mm. Data is presented as average ± SD. The listed p-valueswere determined with a two-factor ANOVA. A Tukey’s HSD post hoc test was used todetermine differences between the treatment groups if a significant genotype × treatmentinteraction was indicated.
Childress et al. Page 16
Calcif Tissue Int. Author manuscript; available in PMC 2012 July 1.
NIH
-PA Author Manuscript
NIH
-PA Author Manuscript
NIH
-PA Author Manuscript
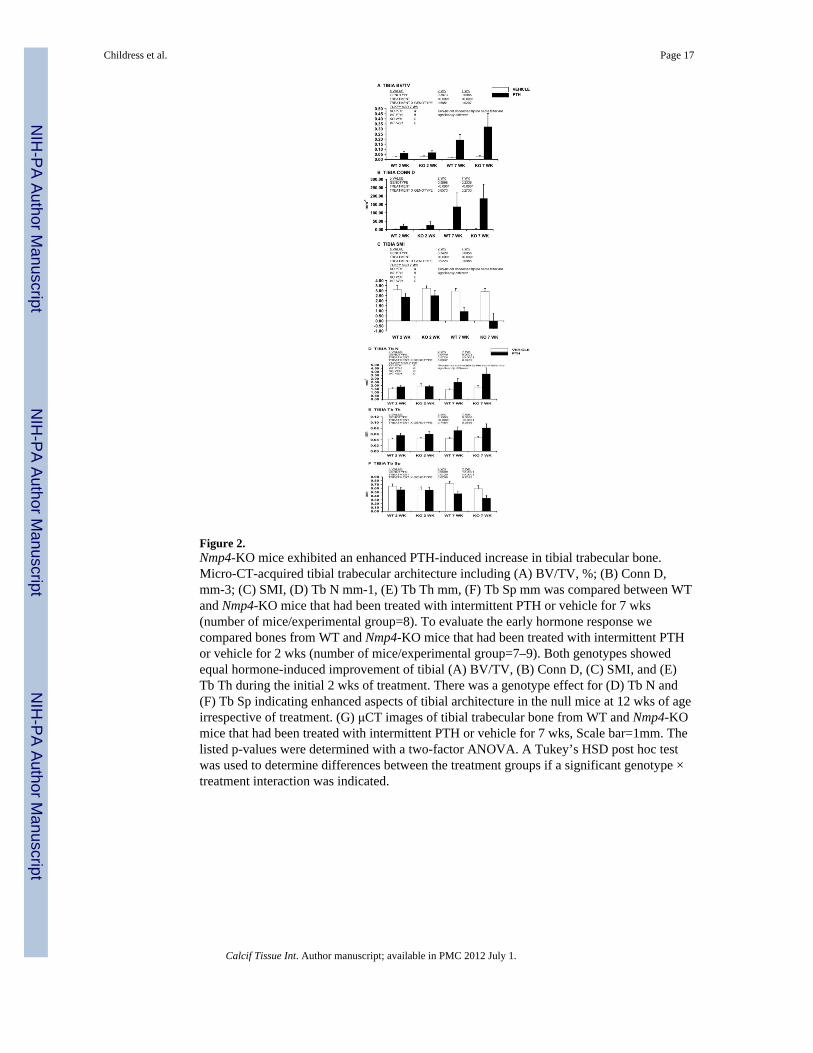
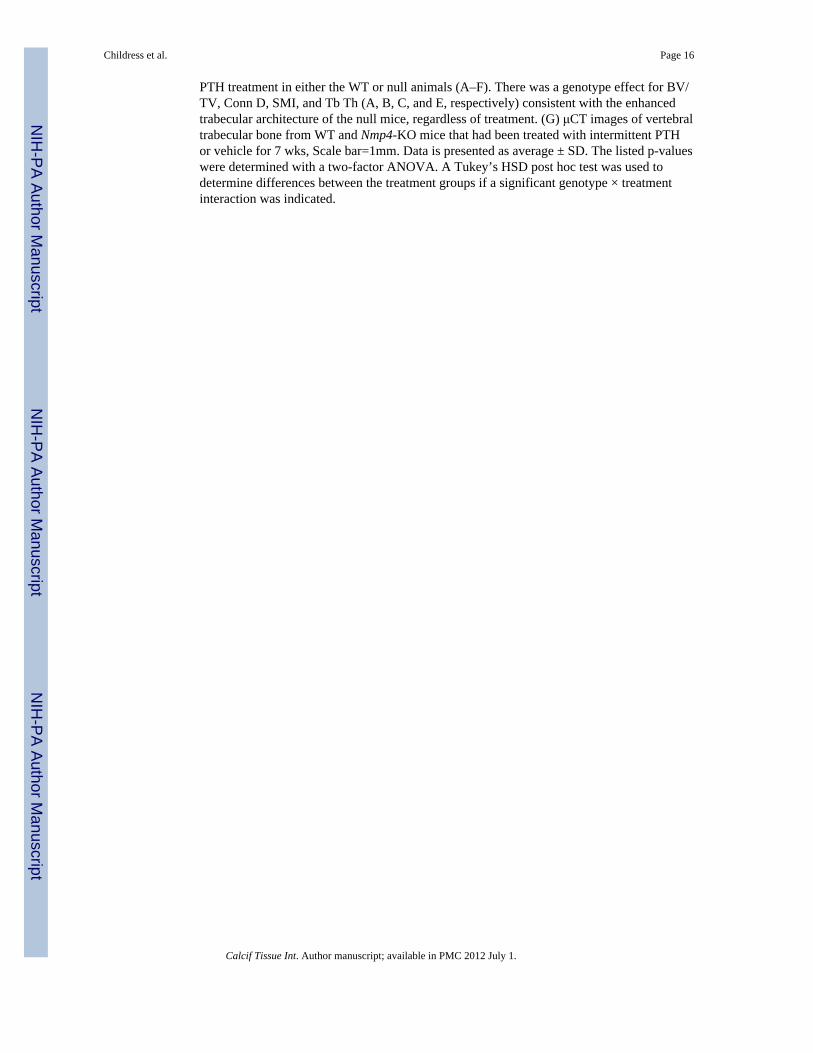
Figure 2.Nmp4-KO mice exhibited an enhanced PTH-induced increase in tibial trabecular bone.Micro-CT-acquired tibial trabecular architecture including (A) BV/TV, %; (B) Conn D,mm-3; (C) SMI, (D) Tb N mm-1, (E) Tb Th mm, (F) Tb Sp mm was compared between WTand Nmp4-KO mice that had been treated with intermittent PTH or vehicle for 7 wks(number of mice/experimental group=8). To evaluate the early hormone response wecompared bones from WT and Nmp4-KO mice that had been treated with intermittent PTHor vehicle for 2 wks (number of mice/experimental group=7–9). Both genotypes showedequal hormone-induced improvement of tibial (A) BV/TV, (B) Conn D, (C) SMI, and (E)Tb Th during the initial 2 wks of treatment. There was a genotype effect for (D) Tb N and(F) Tb Sp indicating enhanced aspects of tibial architecture in the null mice at 12 wks of ageirrespective of treatment. (G) μCT images of tibial trabecular bone from WT and Nmp4-KOmice that had been treated with intermittent PTH or vehicle for 7 wks, Scale bar=1mm. Thelisted p-values were determined with a two-factor ANOVA. A Tukey’s HSD post hoc testwas used to determine differences between the treatment groups if a significant genotype ×treatment interaction was indicated.
Childress et al. Page 17
Calcif Tissue Int. Author manuscript; available in PMC 2012 July 1.
NIH
-PA Author Manuscript
NIH
-PA Author Manuscript
NIH
-PA Author Manuscript
Figure 3.[A] PTH-induced improvements in femoral trabecular architecture were enhanced in Nmp4-KO mice, after 7 wks of treatment. The femoral tissue sections were obtained from WT andNmp4-KO mice treated with intermittent PTH or vehicle for 7 wks (number of mice/experimental group=5–6). Additionally, animals were administered by intraperitonealinjection calcein green (20mg/kg) and alizarin red (25mg/kg) 6 days and 3 days beforeeuthanasia, respectively. [B] Sections were stained for tartarate resistant acid-phosphatase(TRAP) to evaluate osteoclast number and surface. Histological sections were prepared asdescribed in the Materials and Methods. Scale bar=200 μm
Childress et al. Page 18
Calcif Tissue Int. Author manuscript; available in PMC 2012 July 1.
NIH
-PA Author Manuscript
NIH
-PA Author Manuscript
NIH
-PA Author Manuscript
Childress et al. Page 19
Calcif Tissue Int. Author manuscript; available in PMC 2012 July 1.
NIH
-PA Author Manuscript
NIH
-PA Author Manuscript
NIH
-PA Author Manuscript
Figure 4.PTH-treated Nmp4-KO mice exhibited strikingly distinct serum chemistries from the WTanimals. Whole blood was collected and serum separated from WT and Nmp4-KO micetreated with intermittent PTH or vehicle (number of mice/experimental group=6–7) atbaseline just prior initiation of treatment, at 3 wks of treatment, and at 7 wks of treatment.(A) The raw longitudinal serum osteocalcin concentrations showed no genotype effect, butrevealed a significant treatment effect, a genotype × treatment interaction and a genotype ×time interaction indicating that the WT and null mice had equivalent baseline values but thatthe Nmp4-KO had an enhanced response to hormone and a higher rate of increase over theexperimental time period. (B) The % change data confirmed the raw longitudinal datarevealing a significant genotype effect (higher rate of osteocalcin increase in the nulls), atreatment effect, and a genotype × treatment interaction over the experimental period. (C)The raw longitudinal serum CTX concentrations showed a genotype effect, but nosignificant treatment effect, no genotype × treatment interaction and no genotype × timeinteraction. (D) The % change CTX data showed no significant responsiveness to hormonetreatment in WT and null mice. The listed p-values were determined with a repeated-measures MANOVA (longitudinal data) or a two-factor ANOVA (% change data).
Childress et al. Page 20
Calcif Tissue Int. Author manuscript; available in PMC 2012 July 1.
NIH
-PA Author Manuscript
NIH
-PA Author Manuscript
NIH
-PA Author Manuscript
NIH
-PA Author Manuscript
NIH
-PA Author Manuscript
NIH
-PA Author Manuscript
Childress et al. Page 21
TAB
LE 1
Rea
l-tim
e PC
R p
rimer
s fro
m A
ssay
s-on
-Dem
and™
(App
lied
Bio
syst
ems™
, Fos
ter C
ity C
A).
GE
NE
(mR
NA
)A
BI A
ssay
ID
Alpl
(Alk
alin
e ph
osph
atas
e)M
m01
1871
17_m
1
Bcl2
(B-c
ell l
ymph
oma
2)M
m00
4776
31_m
1
Bmp2
(Bon
e m
orph
ogen
ic p
rote
in 2
)M
m01
3401
78_m
1
c-fm
s(C
olon
y st
imul
atin
g fa
ctor
1 re
cept
or [C
SF1R
])M
m01
2666
52_m
1
c-fo
s(F
BJ m
urin
e os
teos
arco
ma
vira
l onc
ogen
e ho
mol
og)
Mm
0048
7425
_m1
Col
1a1
(Typ
e I;
pro-
alph
a1(I
) cha
in)
Mm
0080
1666
_g1
EphB
4(E
phrin
type
-B re
cept
or 4
)M
m01
2011
57_m
1
Ephr
inB2
(EPH
-rel
ated
rece
ptor
tyro
sine
kin
ase
ligan
d 5)
Mm
0043
8670
_m1
Fra-
2(f
os-r
elat
ed a
ntig
en 2
)M
m00
4844
42_m
1
Igf-1
(Ins
ulin
-like
gro
wth
fact
or 1
)M
m00
4355
9_m
1
JunD
(Jun
pro
to-o
ncog
ene
rela
ted
gene
d)
Mm
0049
5088
_s1
Lef1
(Lym
phoi
d en
hanc
er-b
indi
ng fa
ctor
-1)
Mm
0055
0265
_m1
M-c
sf(M
acro
phag
e co
lony
stim
ulat
ing
fact
or 1
)M
m00
4326
86_m
1
Mcp
-1(M
onoc
yte
chem
otac
tic p
rote
in-1
)M
m00
4412
42_m
1
Mkp
-1(M
APK
pho
spha
tase
1)
Mm
0045
7274
_g1
Mm
p-13
(Mat
rix m
etal
lopr
otei
nase
13)
Mm
0043
9491
_m1
Nfa
tc1
(nuc
lear
fact
or o
f act
ivat
ed T
-cel
ls, c
ytop
lasm
ic, c
alci
neur
in-d
epen
dent
1)
Mm
0124
7944
5_m
1
Nur
r-1
(Nuc
lear
rece
ptor
-rel
ated
fact
or 1
)M
m00
4430
56_m
1
Opg
(Ost
eopr
oteg
erin
)M
m00
4354
52_m
1
Ost
erix
(Sp7
tran
scrip
tion
fact
or)
Mm
0050
4574
_m1
Pthr
1(P
arat
hryr
oid
horm
one
rece
ptor
1)
Mm
0044
1046
_m1
Pthr
p(P
arat
hryo
id h
orm
one-
rela
ted
pept
ide)
Mm
0043
6057
_m1
Rage
(Age
r)(r
ecep
tor f
or a
dvan
ced
glyc
atio
n en
dpro
duct
s)M
m00
5458
15_m
1
Rank
l(R
ecep
tor a
ctiv
ator
for n
ucle
ar fa
ctor
κ B
liga
nd)
Mm
0044
1908
_m1
Runx
2(R
unt-r
elat
ed tr
ansc
riptio
n fa
ctor
2)
Mm
0050
1578
_m1
Smad
3(S
ma-
and
Mad
-rel
ated
pro
tein
)M
m01
1707
60_m
1
Sost
(Scl
eros
tin)
Mm
0047
0479
_m1
Calcif Tissue Int. Author manuscript; available in PMC 2012 July 1.
NIH
-PA Author Manuscript
NIH
-PA Author Manuscript
NIH
-PA Author Manuscript
Childress et al. Page 22
TAB
LE 2
A
PTH
-indu
ced
impr
ovem
ents
in fe
mor
al tr
abec
ular
arc
hite
ctur
e w
ere
equi
vale
nt in
WT
and
Nm
p4-K
O m
ice,
afte
r the
firs
t 2 w
ks o
f tre
atm
ent.
The
WT
and
Nm
p4-K
O m
ice
wer
e tre
ated
with
inte
rmitt
ent P
TH o
r veh
cile
(num
ber o
f mic
e/ex
perim
enta
l gro
up=6
–7) f
or 2
wks
. A tw
o-fa
ctor
AN
OV
A w
as u
sed
toev
alua
te th
e in
divi
dual
par
amet
ers.
WT
KO
2-W
AY
AN
OV
A p
-val
ues
VE
HPT
HV
EH
PTH
Gen
otyp
eT
reat
men
tG
enot
ype
× T
reat
men
t
BV
/TV
0.01
6±0.
001
0.04
2±0.
012
0.01
9±0.
007
0.04
7±0.
017
0.33
49<0
.000
10.
8654
Con
n D
, mm−
30.
86±0
.81
22.1
1±7.
101.
66±1
.09
14.1
4±11
.74
0.19
04<0
.000
10.
1131
SMI
3.39
±0.2
12.
72±0
.39
3.51
±0.2
53.
24±0
.37
0.01
700.
0009
0.11
97
Tb N
, mm−
11.
61±0
.19
1.78
±0.1
91.
98±0
.35
2.44
±0.3
90.
0002
0.01
310.
2100
Tb T
h, m
m0.
043±
0.00
20.
056±
0.00
40.
042±
0.00
30.
052±
0.00
50.
1232
<0.0
001
0.41
17
Tb S
p, m
m0.
629±
0.06
60.
575±
0.05
80.
523±
0.10
30.
422±
0.08
00.
3048
0.00
040.
4783
Calcif Tissue Int. Author manuscript; available in PMC 2012 July 1.
NIH
-PA Author Manuscript
NIH
-PA Author Manuscript
NIH
-PA Author Manuscript
Childress et al. Page 23
TAB
LE 2
B
Cor
tical
arc
hite
ctur
e at
the
mid
shaf
t fem
ur fr
om W
T an
d N
mp4
-KO
mic
e tre
ated
with
veh
icle
or i
nter
mitt
ent P
TH fo
r 2 w
ks (n
umbe
r of m
ice/
expe
rimen
tal g
roup
=7–1
0). T
he p
aram
eter
s inc
lude
cor
tical
are
a (C
A, m
m2 )
, mar
row
are
a (M
A, m
m2 )
, and
tota
l are
a (T
A, m
m2 )
and
the
max
imum
,m
inim
um, a
nd p
olar
mom
ents
of i
nerti
a (I
MA
X, I
MIN
, and
J, re
spec
tivel
y [m
m4 ]
). A
two-
fact
or A
NO
VA
was
use
d to
eva
luat
e th
e in
divi
dual
par
amet
ers.
WT
KO
2-W
AY
AN
OV
A p
-val
ues
VE
HPT
HV
EH
PTH
Gen
otyp
eT
reat
men
tG
enot
ype
× T
reat
men
t
MA
1.40
±0.0
81.
34±0
.07
1.39
±0.0
91.
39±0
.13
0.53
630.
4618
0.41
41
CA
0.98
±0.0
31.
04±0
.06
1.01
±0.0
71.
08±0
.07
0.10
730.
0067
0.64
78
TA2.
38±0
.09
2.38
±0.1
12.
40±0
.13
2.47
±0.1
70.
2392
0.45
390.
4223
I MA
X0.
41±0
.02
0.41
±0.0
50.
40±0
.04
0.43
±0.0
60.
9661
0.24
400.
2649
I MIN
0.21
±0.0
20.
23±0
.02
0.23
±0.0
20.
26±0
.03
0.00
840.
0382
0.67
26
J0.
63±0
.04
0.64
±0.0
70.
63±0
.07
0.69
±0.0
90.
3048
0.12
540.
3670
Calcif Tissue Int. Author manuscript; available in PMC 2012 July 1.
NIH
-PA Author Manuscript
NIH
-PA Author Manuscript
NIH
-PA Author Manuscript
Childress et al. Page 24
TAB
LE 2
C
Val
ues f
or p
erce
nt c
hang
e (%
Δ) B
MD
and
BM
C b
etw
een
8 w
ks a
nd 1
2 w
ks o
f age
. Mic
e w
ere
chal
leng
ed w
ith v
ehic
le o
r int
erm
itten
t PTH
for 2
wks
(10–
12 w
ks o
f age
; num
ber o
f mic
e/ex
perim
enta
l gro
up=6
–7).
The
liste
d p-
valu
es w
ere
dete
rmin
ed w
ith a
two-
fact
or A
NO
VA
.
WT
KO
2-W
AY
AN
OV
A p
-val
ues
VE
HPT
HV
EH
PTH
Gen
otyp
eT
reat
men
tG
enot
ype
× T
reat
men
t
%ΔW
B B
MD
5.27
±3.0
210
.28±
2.83
6.18
±3.6
19.
04±2
.81
0.88
950.
0032
0.37
91
%ΔW
B B
MC
15.9
4±7.
3922
.73±
8.79
6.73
±6.1
416
.34±
8.56
0.01
580.
0116
0.64
10
%ΔF
m B
MD
12.8
6±4.
8118
.49±
1.69
8.93
±4.9
813
.84±
3.74
0.01
130.
0026
0.82
20
%ΔF
m B
MC
29.7
1±11
.72
36.0
1±11
.61
11.7
4±8.
8723
.59±
8.69
0.00
090.
0332
0.49
50
%ΔT
b B
MD
7.25
±3.4
814
.43±
4.90
5.98
±4.7
38.
64±4
.86
0.05
450.
0096
0.20
86
%ΔT
b B
MC
9.70
±7.2
024
.84±
6.07
6.67
±4.5
311
.61±
8.68
0.00
450.
0007
0.06
08
%ΔS
p B
MD
6.22
±7.2
612
.93±
6.41
9.57
±11.
2410
.99±
9.44
0.83
660.
2421
0.44
23
%ΔS
P B
MD
7.60
±8.6
115
.11±
11.3
96.
59±1
5.10
10.9
6±8.
960.
5635
0.19
030.
7246
Abb
revi
atio
ns: W
B (w
hole
bod
y), F
M (f
emur
), Sp
(spi
ne).
Calcif Tissue Int. Author manuscript; available in PMC 2012 July 1.
NIH
-PA Author Manuscript
NIH
-PA Author Manuscript
NIH
-PA Author Manuscript
Childress et al. Page 25
TAB
LE 2
D
Bon
e hi
stom
orph
omet
ry o
f the
dis
tal f
emur
from
WT
and
Nm
p4-K
O m
ice
treat
ed w
ith in
term
itten
t PTH
or v
ehic
le fo
r 7 w
ks (n
umbe
r of m
ice/
expe
rimen
tal g
roup
=5–6
). Th
e pa
ram
eter
s inc
lude
min
eral
app
ositi
on ra
te (M
AR
), m
iner
aliz
ing
surf
ace/
bone
surf
ace
(MS/
BS)
, bon
e fo
rmat
ion
rate
(BFR
), th
e TR
AP-
stai
ned
surf
ace
to b
one
surf
ace
(TR
AP+
S/B
S), a
nd th
e nu
mbe
r of T
RA
P-st
aine
d ce
lls o
n th
e bo
ne su
rfac
e (T
RA
P+ N
/BS)
. A tw
o-fa
ctor
AN
OV
A w
as u
sed
to e
valu
ate
the
impa
ct o
f gen
otyp
e an
d tre
atm
ent o
n th
e in
divi
dual
par
amet
er. A
Tuk
ey’s
HSD
pos
t hoc
test
was
use
d to
dete
rmin
e di
ffer
ence
s bet
wee
n tre
atm
ent g
roup
s if a
sign
ifica
nt g
enot
ype
× tre
atm
ent i
nter
actio
n w
as in
dica
ted
(TR
AP+
S/B
S). G
roup
s not
con
nect
ed b
yth
e sa
me
lette
r are
sign
ifica
ntly
diff
eren
t.
WT
KO
2-W
AY
AN
OV
A p
-val
ues
VE
HPT
HV
EH
PTH
Gen
otyp
eT
reat
men
tG
ene
× T
reat
MA
R (μ
m/d
ay)
2.80
±0.2
03.
30±0
.21
2.88
±0.2
23.
19±0
.16
0.82
88<0
.000
10.
2628
MS/
BS
(%)
0.53
±0.0
80.
49±0
.05
0.52
±0.0
30.
50±0
.04
0.93
310.
0507
0.32
75
BFR
(μm
2 /μm
/day
)1.
49±0
.08
1.61
±0.2
21.
49±0
.16
1.59
±0.1
50.
9135
0.09
050.
9175
Trap
+ S/
BS
[%]
0.37
±0.0
30.
36±0
.09
0.48
±0.0
70.
33±0
.12
0.24
200.
0383
0.05
49
Tuke
y’s H
SD
KO
VEH
A
WT
VEH
A B
WT
PTH
A B
KO
PTH
B
Trap
+ N
/BS
[mm−
1 ]0.
45±0
.06
0.41
±0.1
10.
60±0
.10
0.41
±0.1
00.
0863
0.01
100.
0918
Calcif Tissue Int. Author manuscript; available in PMC 2012 July 1.
NIH
-PA Author Manuscript
NIH
-PA Author Manuscript
NIH
-PA Author Manuscript
Childress et al. Page 26
TAB
LE 3
A
Com
para
tive
fem
oral
RN
A e
xpre
ssio
n of
WT
and
Nm
p4-K
O m
ice
treat
ed w
ith P
TH o
r veh
icle
for 2
wks
(num
ber o
f mic
e/ex
perim
enta
l gro
up=6
–9) o
r 3w
ks (n
umbe
r of m
ice/
expe
rimen
tal g
roup
=6) a
nd h
arve
sted
1 h
r afte
r the
last
inje
ctio
n. T
he li
sted
p-v
alue
s wer
e de
term
ined
with
a tw
o-fa
ctor
AN
OV
A.
A T
ukey
’s H
SD p
ost h
oc te
st w
as u
sed
to d
eter
min
e di
ffer
ence
s bet
wee
n tre
atm
ent g
roup
s if a
sign
ifica
nt g
enot
ype
× tre
atm
ent i
nter
actio
n w
as in
dica
ted.
Gro
ups n
ot c
onne
cted
by
the
sam
e le
tter a
re si
gnifi
cant
ly d
iffer
ent.
GE
NE
WT
KO
2-W
AY
AN
OV
A p
-val
ues
VE
HPT
HV
EH
PTH
Gen
otyp
eT
reat
men
tG
ene
× T
reat
c-fo
s (2w
ks)
0.73
±0.2
57.
94±1
.00
1.87
±0.7
112
.04±
2.31
<0.0
01<0
.000
10.
0121
Tuke
y’s H
SD
KO
PTH
A
WT
PTH
B
KO
VEH
C
WT
VEH
C
c-fo
s (3w
ks)
1.04
±0.3
18.
73±2
.07
1.05
±0.3
18.
33±1
.85
0.73
80<0
.000
10.
7235
Fra-
2 (2
wks
)0.
72±0
.15
4.25
±0.5
00.
96±0
.13
5.56
±0.9
70.
0028
<0.0
001
0.03
01
Tuke
y’s H
SD
KO
PTH
A
WT
PTH
B
KO
VEH
C
WT
VEH
C
Fra-
2 (3
wks
)1.
01±0
.12
5.32
±1.2
31.
03±0
.18
4.72
±0.9
80.
3905
<0.0
001
0.34
41
Nfa
tc1
(2w
ks)
1.03
±0.4
31.
46±.
0.31
1.48
±0.4
31.
96±0
.27
0.00
510.
0074
0.86
59
Nfa
tc1
(3w
ks)
1.00
±0.1
11.
76±0
.48
1.02
±0.2
71.
41±0
.26
0.20
080.
0002
0.16
99
EphB
4 (2
wks
)0.
80±0
.16
1.27
±.0.
120.
98±0
.22
1.41
±0.2
10.
0466
<0.0
001
0.75
44
EphB
4 (3
wks
)1.
01±0
.16
1.78
±0.3
90.
95±0
.33
1.74
±0.4
00.
7131
<0.0
001
0.92
57
Ephr
inB2
(2w
ks)
0.75
±0.1
85.
16±.
0.68
1.19
±0.2
75.
87±1
.23
0.06
58<0
.000
10.
6555
Ephr
inB2
(3w
ks)
1.02
±0.2
46.
85±2
.82
1.01
±0.3
26.
24±1
.05
0.62
09<0
.000
10.
6355
Opg
(2w
ks)
0.85
±0.1
40.
82±0
.14
1.23
±0.4
10.
97±0
.21
0.01
500.
1625
0.28
62
Opg
(3w
ks)
1.03
±0.2
91.
19±0
.33
1.13
±0.2
61.
34±0
.26
0.29
430.
1372
0.83
89
Rank
l (2w
ks)
0.96
±0.1
121
.34±
6.20
1.19
±0.5
916
.75±
3.43
0.14
92<0
.000
10.
1124
Rank
l (3w
ks)
1.04
±0.3
413
.72±
4.58
0.82
±0.2
611
.04±
1.79
0.16
63<0
.000
10.
2367
Rank
l/Opg
(2w
ks)
1.14
±0.1
827
.39±
12.4
50.
94±0
.23
17.8
4±5.
600.
0954
<0.0
001
0.10
92
Calcif Tissue Int. Author manuscript; available in PMC 2012 July 1.
NIH
-PA Author Manuscript
NIH
-PA Author Manuscript
NIH
-PA Author Manuscript
Childress et al. Page 27
GE
NE
WT
KO
2-W
AY
AN
OV
A p
-val
ues
VE
HPT
HV
EH
PTH
Gen
otyp
eT
reat
men
tG
ene
× T
reat
Rank
l/Opg
(3w
ks)
1.04
±0.1
811
.53±
2.04
0.73
±0.2
28.
60±2
.38
0.02
07<0
.000
10.
0558
Calcif Tissue Int. Author manuscript; available in PMC 2012 July 1.
NIH
-PA Author Manuscript
NIH
-PA Author Manuscript
NIH
-PA Author Manuscript
Childress et al. Page 28
TAB
LE 3
B
Com
para
tive
fem
oral
RN
A e
xpre
ssio
n of
WT
and
Nm
p4-K
O m
ice
treat
ed w
ith P
TH o
r veh
icle
for 2
wks
(num
ber o
f mic
e/ex
perim
enta
l gro
up=6
–9) a
ndha
rves
ted
1 hr
or 2
4 hr
afte
r the
last
inje
ctio
n. T
he li
sted
p-v
alue
s wer
e de
term
ined
with
a tw
o-fa
ctor
AN
OV
A. A
Tuk
ey’s
HSD
pos
t hoc
test
was
use
d to
dete
rmin
e di
ffer
ence
s bet
wee
n tre
atm
ent g
roup
s if a
sign
ifica
nt g
enot
ype
× tre
atm
ent i
nter
actio
n w
as in
dica
ted.
Gro
ups n
ot c
onne
cted
by
the
sam
e le
tter
are
sign
ifica
ntly
diff
eren
t.
GE
NE
WT
KO
2-W
AY
AN
OV
A p
-val
ues
VE
HPT
HV
EH
PTH
Gen
otyp
eT
reat
men
tG
ene
× T
reat
1hr p
ost-i
njec
tion
M-c
sf1.
13±0
.72
2.14
±0.7
01.
19±0
.09
2.87
±0.5
30.
1056
<0.0
001
0.16
65
Mcp
-10.
79±0
.20
2.60
±0.9
00.
99±0
.24
2.61
±0.7
00.
6657
<0.0
001
0.71
56
Bcl2
0.96
±0.1
21.
02±0
.14
1.06
±0.2
01.
03±0
.08
0.29
970.
7913
0.45
63
Bax
1.02
±0.2
50.
91±0
.14
0.69
±0.1
20.
71±0
.04
0.00
050.
4604
0.33
21
Nur
r10.
69±0
.22
56.3
7±6.
562.
06±1
.49
58.6
2±14
.05
0.57
50<0
.000
10.
8914
Mkp
-10.
83±0
.09
2.31
±0.9
01.
13±0
.48
1.95
±0.3
20.
8708
<0.0
001
0.10
22
JunD
0.80
±0.1
60.
94±0
.16
0.78
±0.1
91.
10±0
.16
0.33
660.
0036
0.22
06
Smad
30.
78±0
.12
1.97
±0.3
41.
05±0
.26
2.14
±0.6
30.
1736
<0.0
001
0.74
03
Lef1
0.99
±0.1
91.
52±0
.30
1.08
±0.2
11.
36±0
.27
0.71
960.
0006
0.22
93
Rage
0.87
±0.1
60.
74±0
.13
1.07
±0.3
50.
72±0
.27
0.36
550.
0261
0.28
29
24hr
pos
t-inj
ectio
n
Runx
20.
86±0
.21
1.45
±0.3
40.
59±0
.23
1.35
±0.8
40.
2960
0.00
070.
6482
Ost
erix
0.63
±0.2
01.
61±0
.48
0.49
±0.3
71.
67±0
.96
0.83
85<0
.000
10.
6460
Col
1a1
0.92
±0.1
42.
35±0
.65
0.75
±0.4
92.
70±2
.45
0.84
240.
0017
0.59
64
Alpl
0.96
±0.1
82.
95±0
.69
0.81
±0.4
72.
42±1
.63
0.32
86<0
.000
10.
5814
Mm
p13
0.73
±0.2
11.
05±0
.28
0.51
±0.2
21.
23±0
.61
0.39
870.
0007
0.39
97
Sost
1.17
±0.2
21.
79±0
.31
1.15
±0.3
81.
59±0
.33
0.33
28<0
.000
10.
4419
Bmp2
1.01
±0.1
41.
41±0
.24
0.91
±0.2
61.
15±0
.39
0.08
980.
0036
0.43
94
Pthr
10.
86±0
.23
1.59
±0.4
00.
68±0
.28
1.38
±0.6
80.
2223
<0.0
001
0.90
71
Pthr
p0.
75±0
.18
1.10
±0.4
40.
89±0
.44
1.00
±0.4
40.
9024
0.11
540.
4214
Calcif Tissue Int. Author manuscript; available in PMC 2012 July 1.
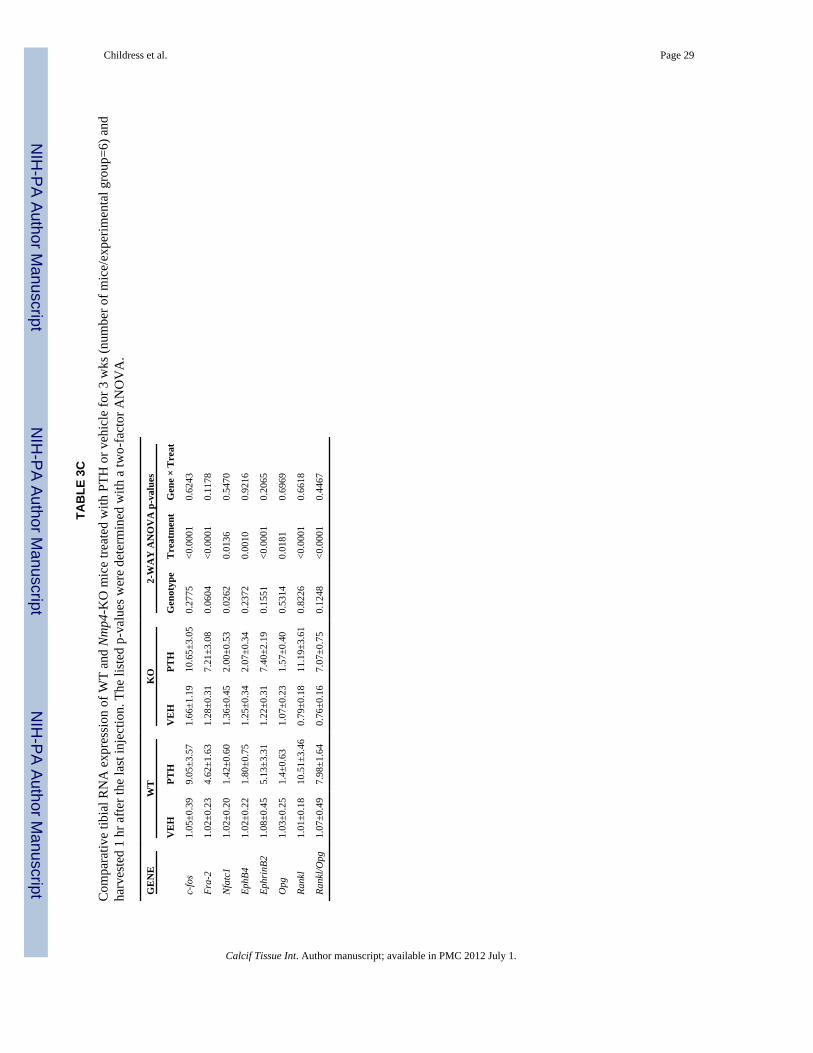
NIH
-PA Author Manuscript
NIH
-PA Author Manuscript
NIH
-PA Author Manuscript
Childress et al. Page 29
TAB
LE 3
C
Com
para
tive
tibia
l RN
A e
xpre
ssio
n of
WT
and
Nm
p4-K
O m
ice
treat
ed w
ith P
TH o
r veh
icle
for 3
wks
(num
ber o
f mic
e/ex
perim
enta
l gro
up=6
) and
harv
este
d 1
hr a
fter t
he la
st in
ject
ion.
The
list
ed p
-val
ues w
ere
dete
rmin
ed w
ith a
two-
fact
or A
NO
VA
.
GE
NE
WT
KO
2-W
AY
AN
OV
A p
-val
ues
VE
HPT
HV
EH
PTH
Gen
otyp
eT
reat
men
tG
ene
× T
reat
c-fo
s1.
05±0
.39
9.05
±3.5
71.
66±1
.19
10.6
5±3.
050.
2775
<0.0
001
0.62
43
Fra-
21.
02±0
.23
4.62
±1.6
31.
28±0
.31
7.21
±3.0
80.
0604
<0.0
001
0.11
78
Nfa
tc1
1.02
±0.2
01.
42±0
.60
1.36
±0.4
52.
00±0
.53
0.02
620.
0136
0.54
70
EphB
41.
02±0
.22
1.80
±0.7
51.
25±0
.34
2.07
±0.3
40.
2372
0.00
100.
9216
Ephr
inB2
1.08
±0.4
55.
13±3
.31
1.22
±0.3
17.
40±2
.19
0.15
51<0
.000
10.
2065
Opg
1.03
±0.2
51.
4±0.
631.
07±0
.23
1.57
±0.4
00.
5314
0.01
810.
6969
Rank
l1.
01±0
.18
10.5
1±3.
460.
79±0
.18
11.1
9±3.
610.
8226
<0.0
001
0.66
18
Rank
l/Opg
1.07
±0.4
97.
98±1
.64
0.76
±0.1
67.
07±0
.75
0.12
48<0
.000
10.
4467
Calcif Tissue Int. Author manuscript; available in PMC 2012 July 1.