Embed Size (px)
Citation preview

NASA CR 174993
N/LR/
LARGE SCALE PROP-FAN
STRUCTURAL DESIGN STUDY
Volume II
Preliminary Design of SR-7
By: L.C. Billman et al
HAMILTON STANDARD DIVISIONUNITED TECHNOLOGIES
Prepared forNational Aeronautics and Space Administration
NASA-Lewis Research Center
Contract NAS3-22394
https://ntrs.nasa.gov/search.jsp?R=19900000728 2018-07-15T13:13:37+00:00Z

CR 174993
SUBJECT
8.0
CONTENTS
TASK VII - PRELIMINARY DESIGN OF SR-7
8.I Deslgn Input Parameter Selection
8.1.1 Introduction
8.2 Revlew of Related Studies, Analyses and TestEfforts
8.2.1 Aerodynamic/Acoustic8.2.2 Structural
8.3 Industry Survey
8.4 Aerodynamic, Acoustlc andStudy
Structural Trade-Off
8.4.1 Sensltivity Factors
8.4.2 Prop-Fan and Gear Box WeightGeneraIizatlons
8.4.3 Fuselage Acoustic Treatment Penalty8.4.4 Airplane landlng Gear Weight Penalty
8.4.5 Prop-Fan Gearbox Acquisition andMaintenance Cost Generalization
8.4.6 Trade-Off Study Parameters8.4.7 Discussion of Results
8.4.8 Sensitivity Factor Check8.4.9 0.7 Mach Number Results
8.5 Design Requirements
8.5.1 Introduction8.5.2 Object8.5.3 Method
8.68.7
Design Input DeflnitionDesign Selectlon Document
PAGE
1
1
1
1
i
3
.5
9
9
I0
1,3
14
15
2053
53
.59
.59
.5959
.59
.59
PRECEDLNG PAGE BLANK NOT FILMED
iii

CR 174993
SUBJECT
9.0
CONTENTS(Continued)
TASK Vll - DESIGN ANALYSIS
9.1 Aerodynamic Excitation Analysis
g°
9.9.9.9.9.9.9.
1 t1 21 31 41 51 61.71.8
Introduction
Summary of ResultsAnalytical Methods
Model Descriptions
Analysis ProcedureResults
DiscussionRecommendations
9.2 Aerodynamic Analysls
9.2.1 Introduction
9.2.2 Analytical Methods
9.2.3 Model Description
9.2.4 Analysis and Results9.2.5 Summary
9.3 Acoustic Analysls
9.3.1 Introduction9.3.2 Noise Prediction Method
9.3.3 Operating Conditions9.3.4 Calculation Results
9.4 Testbed-Size Blade Structural Analysis
9.4.1 Introduction
9.4.2 Selection of Initial Design
9.4.3 Operating Conditions
9.4.4 Design Evaluation Criteria9.4.5 Calculation Technique
9.4.6 Design Procedures
9.4.7 Pre-Deflection Study
9.4,8 Design Iteration Sequence9.4.9 SR-7-21 Blade Geometry
9.4.10 SR-7-21 Analysis Results9.4.11 Results
Configuration
PAGE
63
63
6363
666868949595
97
979797102105
106
106
106106107
112
112
1171141151191241.o9130
1341.241.52
|V

SUBJECT
APPENDIX D
APPENDIX E
CONTENTS(Continued)
9.5 Full Size Blade Structural Analysis
9.5.]
9.5.29.5.3
9.5.49.5.5
Introduction
Blade Concept Model Description
Retention Model Descrlptlon
AnalyslsConclusions
DESIGN REQUIREMENTS FOR ADVANCED TURBOPROP BLADES SR-7
DESIGN SELECTION DOCUMENT FOR NASA LeRC NAS3-22394
CR 174993
PAGE
154
154155
161161
188
D-l
E-l
v/v i


FIGURE
8.1
8.28.38.48.58.68.78.78.78.88.98.108.118.128.138.148.158.16
8.16
8.17
8.17
8.18
8.18
8.19
8.19
CR 174993
ILLUSTRATIONS
PAGE
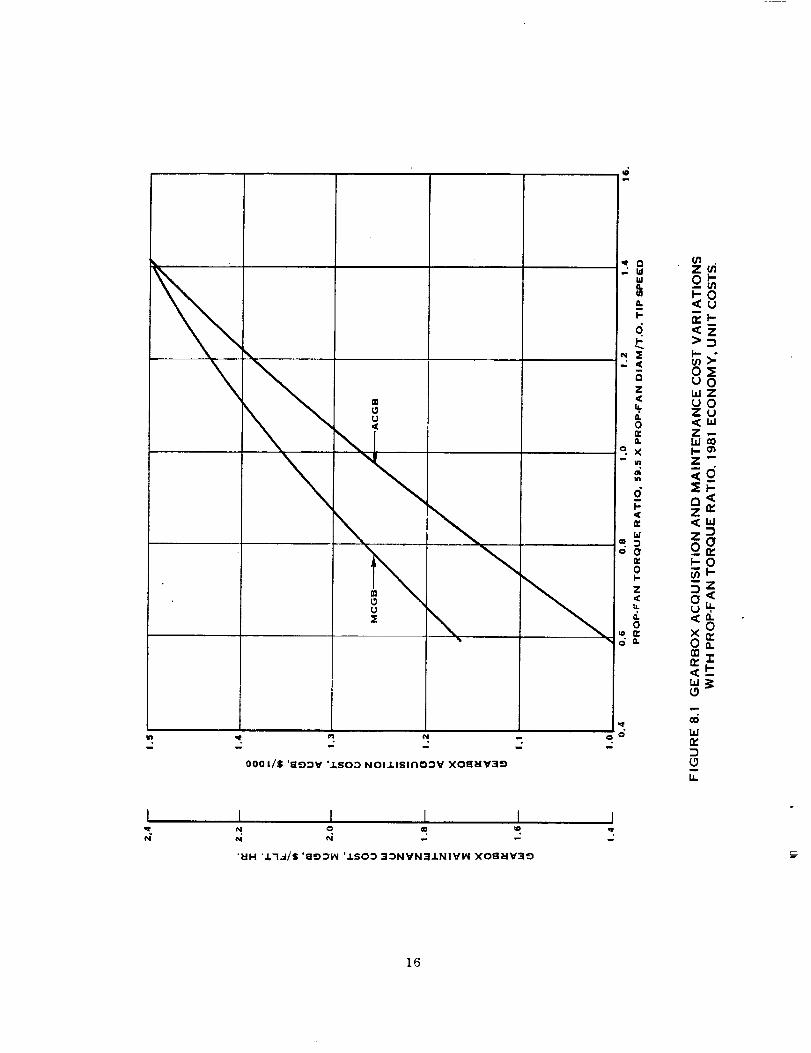
Gearbox Acqulsltion and Maintenance Cost Varlations
wlth Prop-Fan Torque Ratlo, 1981 Economy, Unlt Costs 16Sweep Angle Distribution 17Thickness Ratio Dlstribut10n 18Planform Distrlbutlon 19
Integrated Deslgn Lift Coefficient Distribution 21Twist Distribution 22
Stacking Distribution 23Stacklng Distribution (Cont'd) 24Stacking D1stributlon (Cont'd) 25
Centerbody Blockage 26Velocity Distribution 2?
Net Efficiency vs. Power Loading 30Peak Noise vs. Power Loading 31
Improvement in Fuel Burn vs. Power Loading 32Improvement In Direct Operating Cost vs. Power Loading _3
Improvement In Fuel Burned vs. Power Loadlng 34
Component Weights vs. Power Load|ng 35Net Efflclency, Peak Noise and Improvement in Fuel
Burned and Direct Operating Cost vs. Number of Blades 38
Net Efficiency, Peak Noise and Improvement in FuelBurned and Direct Operating Cost vs. Number of Blades(Cont'd) 39
Net EffIclency, Peak Nolse and Improvement in FuelBurned and Direct Operating Cost vs. Tip Speed and
Power Loadlng For Varying Tip Sweep 40
Net Efflciency, Peak Noise and Improvement in FuelBurned and Direct Operating Cost vs. Tip Speed and
Power Loading for Varylng Tip Sweep (Cont'd) 41Net Efflclency, Peak Noise and Improvement in Fuel Burned
and Direct Operating Cost vs. Tip Sweep For VaryingNumber of Blades 42
Net EFficiency, Peak Noise and Improvement in Fuel Burnedand Direct Operating Cost vs. Tip Sweep for VaryingNumber of Blades (Cont'd) 43
Net Efflclency, Peak Nolse and Improvement in Fuel Burned
and Direct Operating Cost vs. Tip Speed and Power
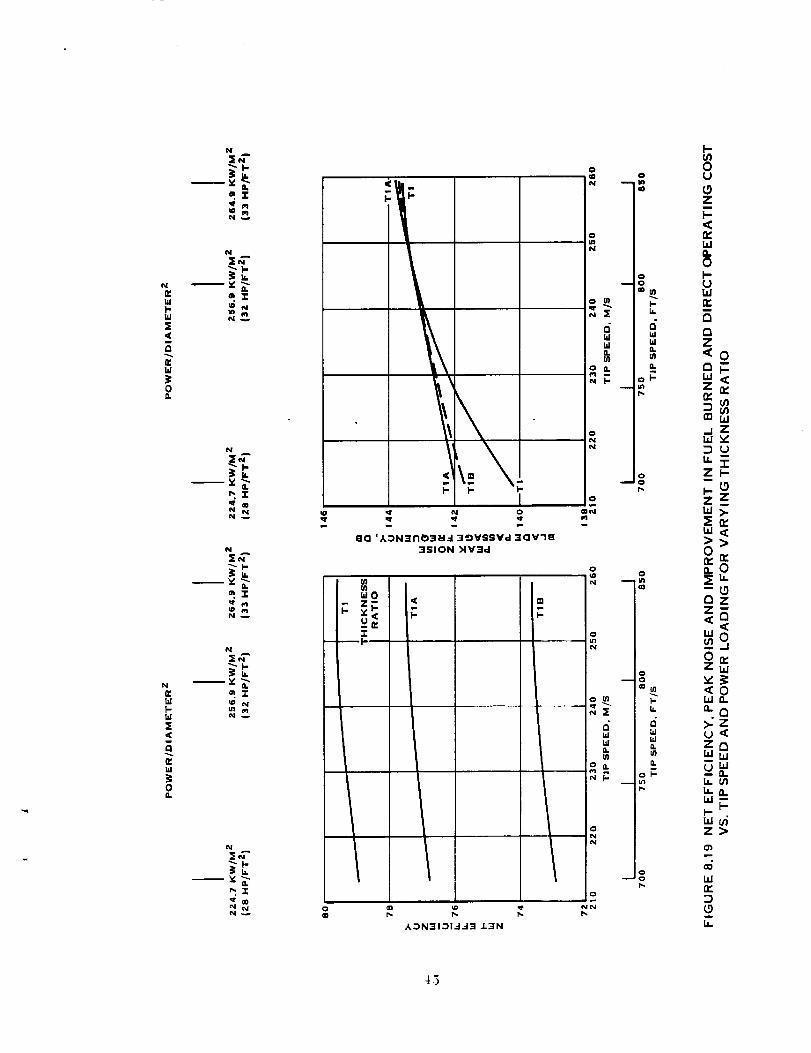
Loading for Varylng Thickness Ratio 45Net Efficiency, Peak Nolse and Improvement in Fuel Burned
and Direct Operating Cost vs. Tlp Speed and PowerLoading for Varying Thickness Ratio (Cont'd) 46
vii

FIGURE
8.20
8.20
8.21
8.21
8.22
8.22
8.23
8.23
8.24
8.249.1
9.29.3
9.49.5
9.69.7
9.89.99.109.10
9.119.129.12
CR 174993
ILLUSTRATIONS(Continued)
PAGE
Net Efficlency, Peak Noise and Improvement in Fuel Burnedand Direct Operating Cost vs. Tip Speed and Power
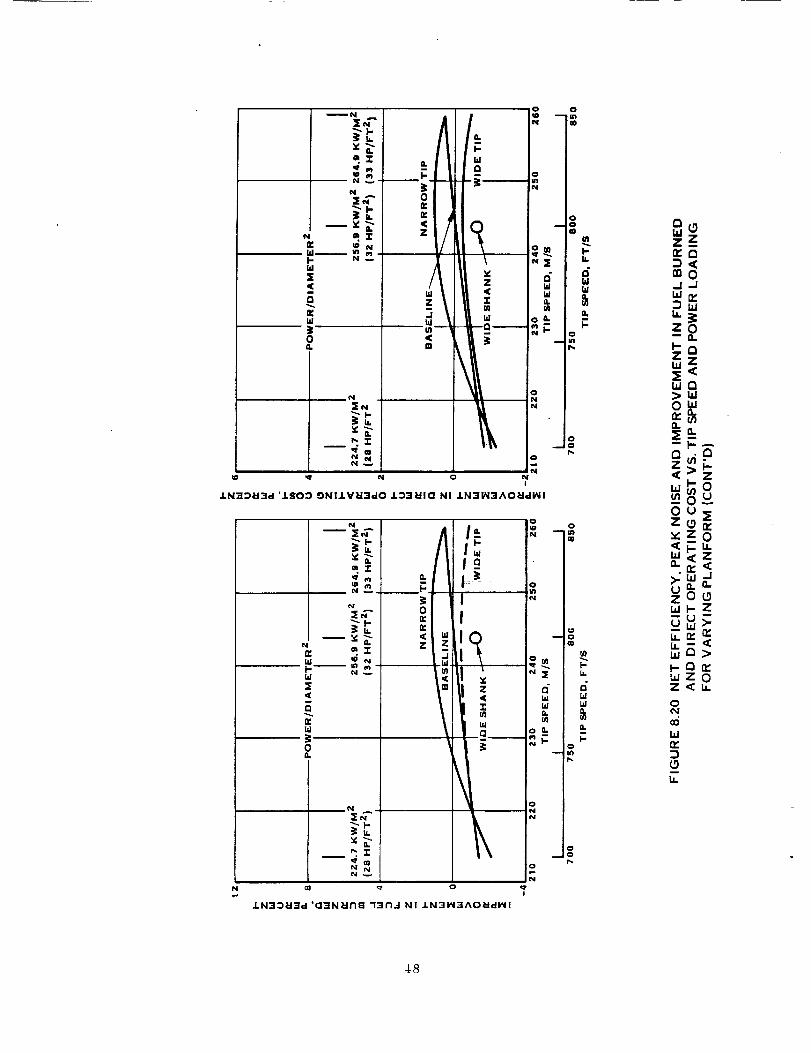
Loading for Varylng Planform 47Net Efficiency, Peak Noise and Improvement In Fuel Burned
and Direct Operating Cost vs. Tip Speed and PowerLoading for Varying P1anform (Cont'd) 48
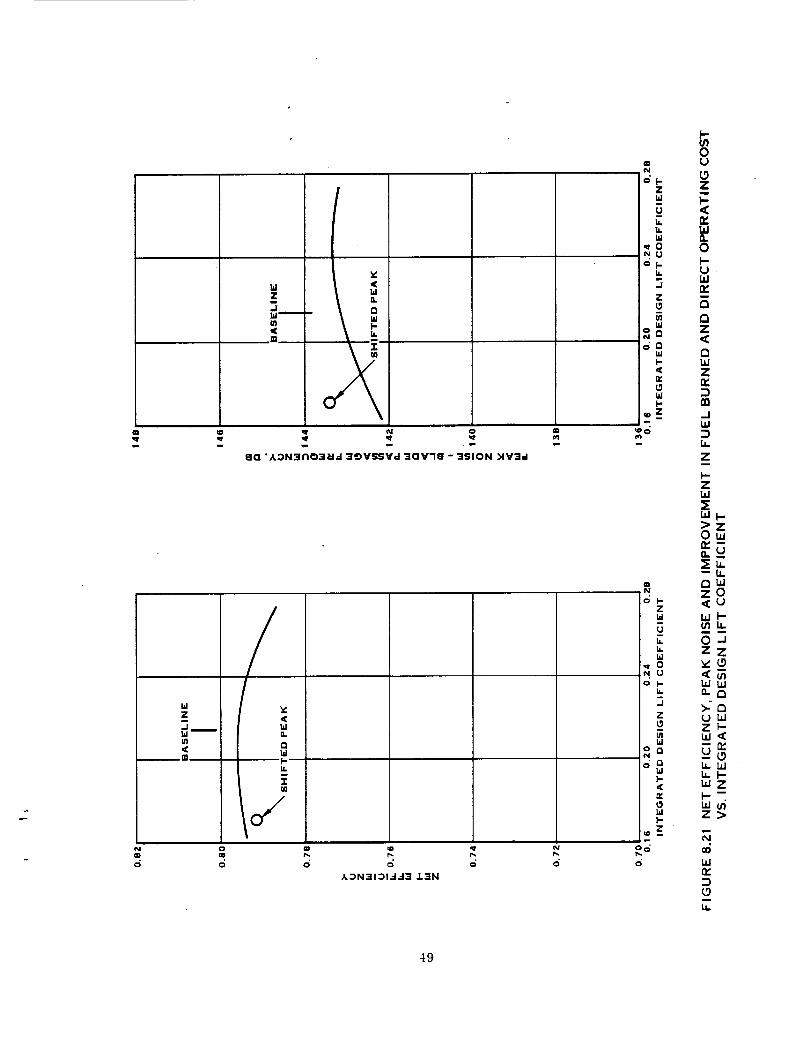
Net Efficiency, Peak Noise and Improvement in Fuel Burnedand Direct Operating Cost vs. Integrated Design LiftCoefficlent 49
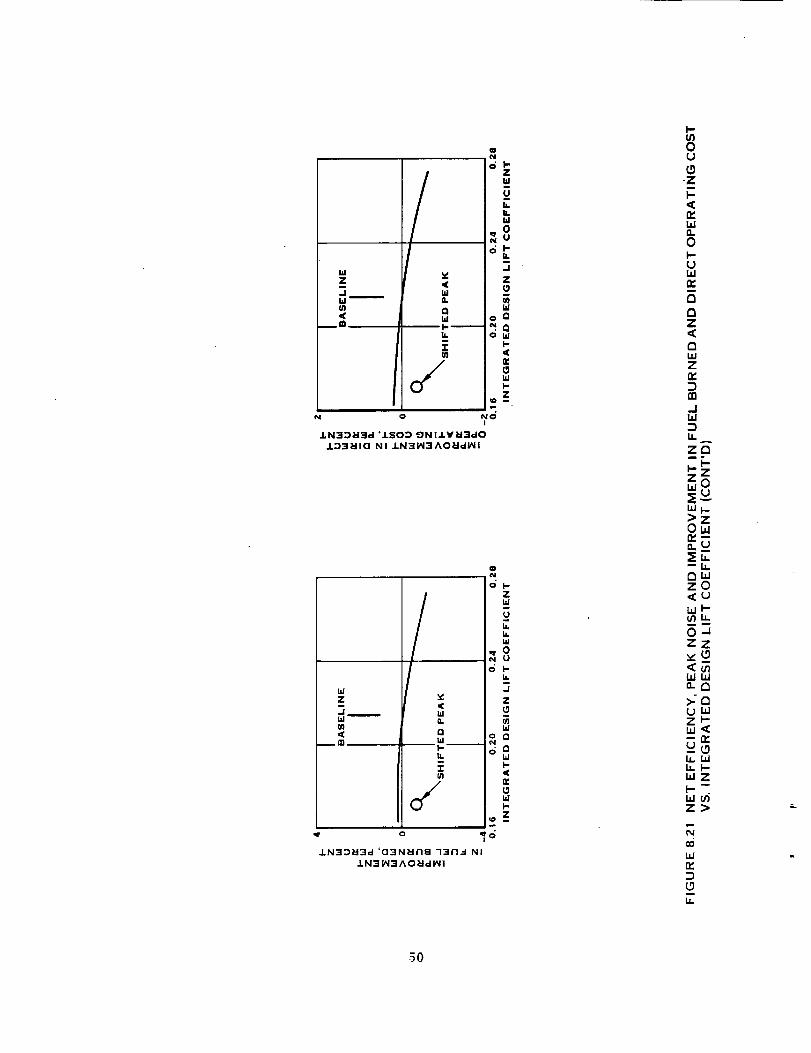
Net Efflclency, Peak Noise and Improvement in Fuel Burnedand Direct Operating Cost vs. Integrated Design LiftCoefficlent (Cont'd) 50
Net Efficiency, Peak Noise and Improvement In Fuel Burned
and Direct Operating Cost vs. Twist Change 51Net Efficiency, Peak Noise and Improvement In Fuel Burned
and Direct Operating Cost vs. Twist Change (Cont'd) 52
Net Efficiency, Peak Noise and Improvement in Fuel Burnedand Direct Operating Cost vs. Stacking Line Change 54
Net Efficiency, Peak Noise and Improvement In Fuel Burned
and Direct Operating Cost vs. Stacking Line Change(Cont'd) 55
Selected Blade Characteristics 61Selected Blade Characteristics (cont'd) 62
Schematic of Prop-Fan Aircraft 69Schematic of B-52B Aircraft 70
Schematic of C-141 Aircraft 71Schematic of DC-9 Aircraft 72Schematic of Gulf Stream II Aircraft 73Schematic of KC-135A Aircraft 74
Geometric Parameters for Which EFQ Sensitivities Were
Calculated 76Baseline EF Diagram for Prop-Fan Aircraft 78
Baseline EF Diagram for B-52 Aircraft 79B-52 EFQ Sensitivity to Changes in Prop-Fan Orientation 80
B-52 EFQ Sensitivity to Changes in Prop-Fan Orientation(Concluded) 81
Baseline EF Diagram for C-141 Aircraft 82C-141 EFQ Sensitivity to Changes in Prop-Fan Orientation 83
C-141 EFQ Sensitivity to Changes in Prop-Fan Orientation
(Concluded) 84
viii

FIGURE
9.13
9.149.14
9.15
9.16
9.16
9.17
9.18
9.18
9.199.20
9.21
9.229.23
9.249.25
9.26
9.27
9.28
9.29
9.30
9 319 32
9 339 34
9 359 36
9.37
9.389.39
9.40
9.41
9.429.43
9.449.459.46
9.47
CR 174993
ILLUSTRATIONS(Continued)
PAGE
Baseline EF Diagram for DC-9 Aircraft 85
DC-9 EFQ Sensltivity to Changes In Prop-Fan Orientation 86DC-9 EFQ Sensitivity to Changes In Prop-Fan Orientatlon
(Concluded) 8?Baseline EF Diagram for GS-II Aircraft S8GS-II EFQ Sensitivity to Changes In Prop-Fan Orientation 89
GS-II EFQ Sensitivity to Changes In Prop-Fan Orientation(Concluded) 90
Baseline EF Diagram for KC-135 Aircraft 91
KC-135 Sensitivity to Changes In Prop-Fan Orientation 92
KC-135 Sensitivity to Changes in Prop-Fan Orientation(Concluded) 93
Schematic of Prop-Fan Aircraft 98
Sign Conventlons 103
Design Stress Criteria 116Deslgn Frequency Criteria Avoidance Zones 117
High Speed Stability Criteria 120Finite Element Model 121
Cyclic Stress Correction Factor vs. R/RT,p 123Deflectlon Result Comparison for Different Analysis
Methods 125
Piecewlse Linear Result Comparison for Different Analysis
Methods (Steady-State Cruise) 126
Geometry Converter 127Finlte Element Geometry Modifier 128
Deslgn Modifications Necessary to Achieve Satisfactory
Design 135Planform Modification to Achieve Successful Design 136
SR-7-21 Fabrication 137
SR-7-21 Aerodynamic Description 138
SR-7-21 Sweep Line Coordinates 139SR-7-21 Deflections Measured Normal to 3/4 Station Chord 140SR-7-21 Rotations - Local Rotations About Pitch Change
Axls 141
SR-7-21 Spar - Maxlmum Spanwise Stress Results 143
SR-7-21 Shell - Maximum Sapnwise Stress Results 144
SR-7-2I Spar Stress 145SR-7-21 Shell Stress, Percent of Allowable Stress-Limit-
High Cycle Fatigue, Take-Off Climb Condition 146SR-7-21 Spar - Spanwise Stress - Low Cycle Fatigue 147
SR-7-21 Shell Spanwise Stress - Low Cycle Fatigue 148SR-7-21 Critical Speed Diagram 149
SR-7-21 Mode Shapes (Cruise Condition) 150
SR-7-2] Blade Damping 1_1SR-7-21 Stability Boundary 133Full Scale Prop-Fan Spar & Shell Concepts #I & #2 156
ix

FIGURE
9.489.49
9.509.51
9.52
9.53
9.549.55
9.569.57
9.58
9.599.60
9.619.62
9.639.64
9.65
9.669.67
9.68
9.69
9.70
9.71
9.72
9.73
ILLUSTRATIONS(Continued)
Hollow Steel Cross Section
Finite Element Model - Concept #1
F1nlte Element Model - Concept #1Finite Element Model - Concept #2
Concept #2 Retention Simulatlon
Analytical Flowpath
Campbell Diagram Concept #I Cruise ConditionCampbell Diagram Concept #2 Climb Condltlon
Campbell Diagram Concept #2 Cruise Condition
Normal Mode Shapes - Concept #2 - Cruise ConditionNormal Mode Shapes - Concept #I - Cruise Condition
Normal Mode Shapes - Concept #1 - Cruise CondltlonNormal Mode Shapes - Cruise Condition - Concept #I
Normal Mode Shapes - Concept #1 - Cru|se Condition
Unsta11 flutter Stabillty - Concept #2Unstalled Flutter Stability - Concept #2
Unstalled Flutter Stability - Concept #IUnstalled Flutter Stability Concept #1
Stability SummaryStress Strength Comparison - Concept #1 - Spar -
AMS 6415, 40-44 HRC
Stress/Strength Comparison - Concept #1 - Shell -181 E-Glass
Stress/Strength Comparison - Concept #2 - Spar -A1umlnum 7075-T73
Stress/Strength Comparison - Concept #2 - Shell -181 E-Glass
Stress/Strength Comparison - Concept #2 - Filler -8 Lb/Ft 3 Foam
Stress/Strength Comparison - Concept #2 - Sheath -Plated Nickel
Deflections - Concept #1 - Cruise Condition
CR 174993
PAGE
157158159160162
163166167168169
170171
172173175176177178179
180
181
182
183
184
185
187
X

TABLE
B.l
8.18.2
8.3
8.4
8586
8788
89
B I0
919.2
9.39.4
9.59.6
9.7
9.89.9
9.109.ll
9.12
9.13
9.149.159.169.179.18
9.19
9.20
9.219.22
9.23
TABLES
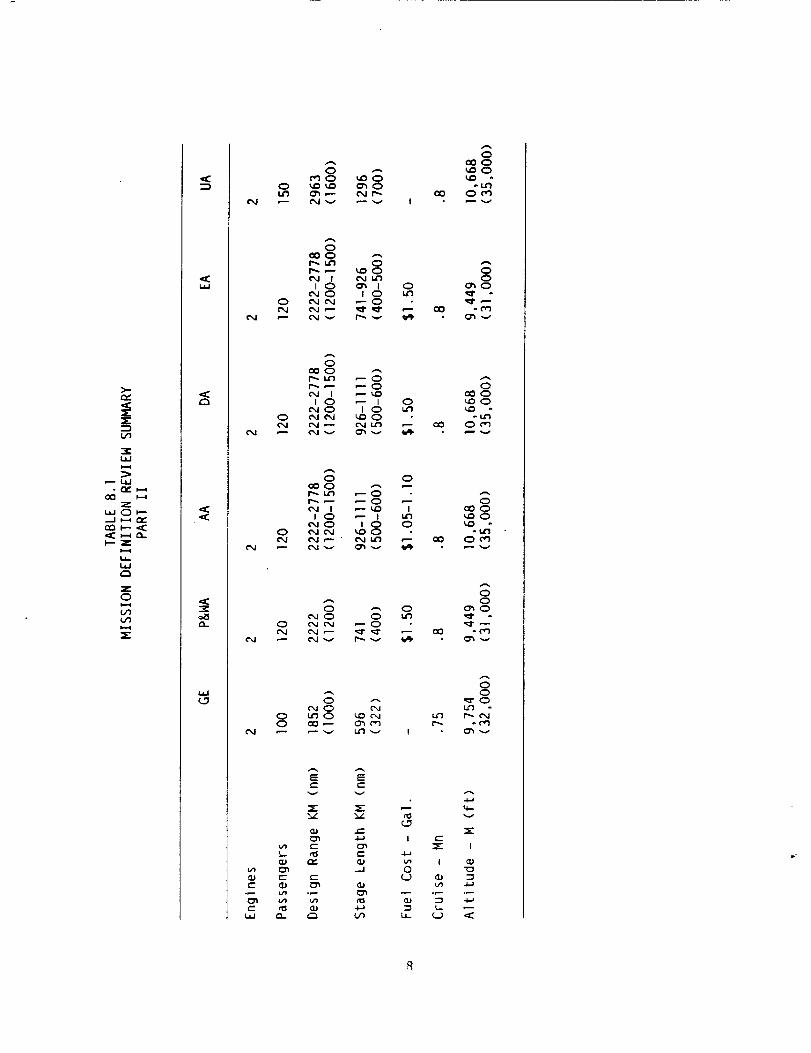
Mission Definition Review Summary Part IMission Definition Review Summary Part II
SR-7 Trade-Off Study Basellne Airplane and MissionDef_nitlon
Sensltivlty Factors for Typical Mission of 120 PAX,Twin Engine Transport Deflned in Table 8.2
List of Symbols
Baseline Blade Study ResultsSelected Operating Conditions for Trade-Off Study
Trade-Off Study ResultsM1sslon Sensitivity Factor Check Results0.7 Mach Number Results
Parameters of Selected Prop-FanProp-Fan Aircraft Parameters used in Excitation Study
List of SymbolsValues of Geometric Parameters for Baseline Aircraft
Aircraft Operating Conditions for Calculated
Equlvalent Excitation FactorsRatio of n-P Loads to l-P Loads for Baseline Aircraft
Values of Geometric Parameters for Prop-Fan Aircraft
SR-TL Estimated Installed EfficiencySR-7L Estimated Installed Airloads
List of SymbolsOperating Conditions used for Noise Calculations
Near-Field Noise for Three Tip Clearances At FullPower Takeoff, Free-Field Conditions
Near Field Noise for Three Tip Clearances At DesignCruise, Free-Field Conditions
Far-Field Noise Levels for the 9-Foot and 13.9-Foot
Diameter Prop-Fans (2-Engine Aircraft)SR-7 Design Configuration
Flight ConditionsCriteria for Stress Evaluation
Foreign Object Impact CriteriaComparison of Analysis Methods (Steady-State
Cruise Condition)
SR-7-21 Aerodynamic PerformanceBlade Load Conditions
Natural Frequencles
Steady Retention LoadsBlade Deflection - Concept #2
CR 174993
PAGE
10
II
28
3637
5657
6064
65
75
77
9699i00
101
104107
108
109
II0
113114
115
118
124134
164165186
188
xi/xii

CR 174993
SUMMARY
Hamilton Standard, under contract to NASA/Lewls, has conducted the effort to
analyze, evaluate and provide structura| designs for several advanced propel-
ler conflguratlons. In addition, aeromechanlcal deslgn requirements were es-tablished, blade fabrication concepts were screened, the feasibility of de-
signing a dynamic model was established, the adequacy of current design and
fabrication techniques was assessed and a prellm|nary design of SR-7 estab-lished. The specific tasks which were accomplished are:
A Design Requirements Document which contains the crltlcaloperatlon conditions, was generated for use in the structural
design analysls and dynamic model feaslbility analysls tasks;
A Blade Design Concept Defin|tlon Document, which defines the
blade fabrication concepts For use in the structural deslgn
analysis, was generated;
A Structural Design Analysis was conducted for slx bladeconflguratlon-fabricatlon concept combinations. The analysisevaluated stress, deflection, resonant frequency, stall and
classlcal flutter, and FOD;
The feasibillty of deslgning a dynamic model of a fu11-slze
blade configuration was established;
Based on the structural design analysis task, those items which
were unproven or beyond the state-of-the-art were assessed andIdentifled and a technology development plan was prepared;
The preIimlnary design of an advanced propeller for turbopropaircraft applications with design cruise speeds of Mach 0.7 to0.8 was established. This task included: the review of
related studies, analyses, and test efforts; an industry
survey; a large-scale Prop-Fan preliminary design analysis; the
deslgn analysls of a 9-foot dlameter Prop-Fan blade andpreliminary design of a 14-foot diameter blade.
Volume I of this report covers the effort through the preparation of thetechnology development plan and Volume II covers the preliminary design of anadvanced propeller.
xiii/xiv


CR ]74993
INTRODUCTION
In recent years, considerable attention has been directed toward Improvingaircraft fuel consumption. Studies have shown that the inherent efficiency
advantage that turboprop propulsion systems have demonstrated at lower cruise
speeds may now be extended to the higher speed of today's turbofan and tur-
bojet-powered aircraft. To achieve this goal, new propeller designs whlchfeature more blades w_th thln airfoils and aerodynamic sweep are required.
Since 1975, Hamilton Standard has been deeply involved with the NASA LewisResearch Center In the development of the advanced turboprop or Prop-Fan.
Many aircraft system studies have been accomplished for a variety of subsonic
air transport applIcat_ons, and all these studies have shown significant fuelsavings with Prop-Fan propulsion. The fuel savings potential of future
Prop-Fan powered aircraft Is generally 15-20% for commercial applications and
25-35% for military patrol aircraft compared to equal technology turbofansystems, depending upon the specific application, cruise speed, stage length
and other requirements.
To date, several small-scale, 0.6223 meter (24.5 inch) diameter models have
been designed, manufactured and subjected to a numberof tests. Tests havebeen conducted in both UTRC and NASA wind tunnels and on a modified NASA air-
plane. These tests have shown that propellers with 8-10 swept blades, high
tip speeds and high power loadings can offer increased fuel efficiencles at
speeds up to 0.8 Mn.
The purpose of this program was to establish full size structural concepts
for such blades; to define their structura] properties; to identify any new
design, analysis, or fabrication techniques which would be required; to de-termine the structural trade-offs involved with several blade shapes; to es-
tablish the feasibility of fabricating dynamlca]ly scaled models of bladesfor aeroelastic testing and to establish the preliminary design of an ad-
vanced propeller for turboprop aircraft appllcations with design cruise
speeds of 0.7 to 0.8 Mn.
The blade configurations for which large-scale designs would be developed inthls study were specified at the onset to be SR-2 (8-way), SR-3 (8-way), a
10-way version of SR-3 (same geometry with the chord reduced by the ratio8/I0), and SR-5. The SR-2, SR-3 (8-way), and SR-5 configurations had all
been designed and built as models for wind tunnel testing.
Later, the preliminary design of a new configuration, designated SR-7, wasdeveloped utilizing the initial results of this study along with other relat-
ed test and analysis efforts to date. It was intended that the SR-7 designwould be built in large-scale (9 ft. diameter) for later ground and flightresearch tests. The results of the initial design study of the SR-2, SR-3,
and SR-5 configurations are covered in Volume I (CR174992) of this report and
the preliminary design of SR-7 is covered in Volume II (CR174993).
xv/xvi

J_
fly

8.0 TASK Vll - PRELIMINARY DESIGN OF SR-7
8.1 DESIGN INPUT PARAMETER SELECTION
8.1.1 Introduction
This effort included the following tasks:
Review of related studies, analyses and test efforts, an industry
study, a trade-off study, a definitlon of the deslgn requirements,
• Definitlon of the input for structural design,
• Documentation of the selected design.
The following sections describe these tasks.
8.2 REVIEW OF RELATED STUDIES, ANALYSES AND TEST EFFORTS
8.2.1 Aerodynamic/Acoustic
A number of reports and oral briefings on the studies, analyses and test ef-
forts related to the application of Prop-Fans for high speed airplanes werereviewed. These reports and oral brieflngs are listed as References 1
through 24. The material was reviewed to assist in the selection of an optl-
mum Prop-Fan configuration from the vlewpoints of high efficiency, low noise,high reliability and ease of manufacture. Thls effort and the aerodynamic,
acoustic and structural tradeoff studies reported herein were used to estab-
lish a Prop-Fan configuration for a hypothetical airplane application.
The Boeing, Douglas and Lockheed companies conducted several studies respec-tively (references I-4, 6-I0). These studies showed that Prop-Fan powered
airplanes had significant direct operating cost (DOC) and fuel burned reduc-tions relative to turbo-fan powered airplanes. These studies made use of the
Hamilton Standard Prop-Fan performance, noise level, maintenance cost and
weight data packages (references 12 and 13). Each successive data package,including report SPO4A80 (reference 14), published in 1980, incorporates re-finements reflecting experience gained through model tests and method devel-
opment which have occurred over the past six years. Even though the data
package performance and noise levels have undergone refinements, the accom-panying changes in cabin acoustic treatment and installation losses have re-
sulted in very small changes in fuel burn and DOC (reference 4), relative toestimates using earlier data packs.
Most of the airplanes in the referenced reports cruise at 0.80 Mach numberand at an altitude of at least 9144M (30,000 ft.). The airplane benefits af-forded by Prop-Fans as compared to turbo-fan propulsion systems range between6% and 33% improvements in fuel burn and 5% to 15% improvements in direct op-erating cost. The transport alrp]anes studied vary between 45,360 Kg(I00,000 pounds), 92 passengers to nearly 136,000 Kg (300,000 pounds), 200passengers. The lower level of improvements were obtained In the BoeingRECAT (Reference 2) study. The smaller benefits were largely due to moreconservative estimations of the installed aerodynamic losses and near fieldnoise levels with the Prop-Fan propulsion systems.
The referenced reports generally showed that even larger fuel savings couldbe achieved with both lower cruise Mach numbers and shorter stage lengths.For example in the Dc-g feasibility study (Reference 8), 0.75 was shown to bethe optimum cruise Mach number. The reported DOC Improvements were predomin-antly reported for fuel prices of 30 and 60 cents per gallon, which are quitelow compared to today's prices. The 5% to 15% DOC improvements were reportedfor the higher fuel price and were at least 2% (two percentage units) higherthan with fuel priced at 30 cents per gallon. It was evident that the DOCimprovement with Prop-Fans would increase with escalating aviation fuelprices. Since it was also shown (Reference I) that the optimum cruise Machnumber decreased with Increasing fuel prices, the advantage of the Prop-Fanwould be further increased.
The referenced materla] helped in the selection of optimum Prop-Fan design
parameters in that it linked performance, noise, weight and costs with fullscale airplane economy and fuel efficiency. In most instances, the reports(References 4, 6 and 8) showed that practical varlatlons In power loading,
tip speed and number of blades had relatively small effects on DOC and fuelburn. Thls allows the Prop-Fan designer considerable latitude in tailoring
full scale Prop-Fans for each airplane and mission.
The amount of blade tip sweep, however, can have a potentially larger effecton the benefits. That is, should the structural integrity of the selected
Prop-Fan require a significant reduction in sweep, both the performance andthe noise levels would be adversely affected. Experience has shown that the
highly swept (48° tip sweep), lO blade, SR-5 Prop-Fan model (Reference 22)required geometric changes to Improve its structural integrity. The changes
required for acceptable structure (reduced sweep for example) and their ef-
fect on aerodynamic and acoustic performance are now being investigated. The_mportance of tip sweep for a lO bladed Prop-Fan for performance and nearfield noise trends has been shown in the data packages (RefeFence 12-14).
Efficiency falls off by about 3% for a tip sweep angle reduction from about38° to 20°. For this same change, the near field noise increases by about4dB. This level of increased noise would increase (Reference 2 and 4) the
fuselage sidewall acoustic treatment weight by about I/2% of the airplane
take-off gross weight.

Basedon the airplane studies reported here and Hamilton Standard's designexperience, the full-scale Prop-Fan Is expected to have 8 to lO blades and35° to 45° of tip sweep. The cruise rotational tlp speed is expected to fallbetween 213.4 m/s (?00 ft/s) and 243.8 m/s (800 ft/s) with a maximum loading
(Shaft Horsepower/Dlameter _) between 240.8 kw/m _ (30 hp/ft z) and 321.Ikw/m 2 (40 hp/ft 2) at an altitude of I0,668 meters (35,000 feet).
8.2.2 Structural
Various reports, oral briefings, analyses, and test efforts related to the
Prop-Fan application to high speed alrplanes were reviewed (References l
through 24). The concern with excitation, stability, and structural designIs emphasized in order to asslst in the selection of an optimum Prop-Fan con-
figuration wlth optimum aircraft integration.
This work will be used to affect the design tradeoffs In the areas of struc-tural concern for the fu11-scale SR-7 Prop-Fan and its companion testbed con-
figuration.
Lockheed Californla Company, Boeing Aircraft, and McDonnell Douglas Aircraft
have conducted studies sizing Prop-Fans for various alrcraft configurationsin References 1 through 11. In these studies, tradeoffs for performance and
structure are made and compared to existing turbo-fan conflgurations. These
studies have used-methods developed by Hamilton Standard for sizing the air-
craft geometry wherever it effects the interactlon between the aircraft and
the propeller.
Reference 4 shows the proposed Douglas DC-9 version of the aft-mounted
Prop-Fan along with discussions that show reduced drag for this configura-
tion. This configuration is also good for structural reasons, since it hasbeen Hamilton's experience that aft-mounted propellers experience less IP
excitation than forward mount propellers.
References 6 and 7 show Lockheed's proposals for the Prop-Fan testbed. The
following aircraft were investigated:
Lockheed C-141ALockheed JetStar
Convair 990
Grumman Gulfstream II
Boeing KC-135Boeing 737
Of these, the KC135 and the Gulfstream II are the recommended candidates for
the testbed. From the viewpoint of Prop-Fan excitation, the Gulfstream II isthe better choice because of the relative propeller to wing size. It is felt
that the propeller Is not in proper proportion to the wing on the other pro-
posed testbed aircraft, and are therefore not representative of a f_nal de-
sign and will not produce the proper excitation.
Reference 7 recommends I0 blades as opposed to 8 blades and a lower tipspeed. Lowering the tip speed could be a benefit depending on frequencyplacement. For highly swept blades, a lower tip speed would reduce the ten-dency of the leading edge to buckle, thereby, maintaining better torsionalcharacteristics of the Prop-Fan blade. This might keep the hlghly swept SR-5as a contender for the full scale design.
References 8 and 9 are the final oral briefing for the Douglas DC-9 Prop-Fan
feasibility and testbed study. These reports indicate that Douglas prefers a
propeller location at wlng level for a wing mounted nacelle. For mlnlmumexcitation, the propeller should be located above the wing. Future measure-ments should consider shaft moment and hub load measurements on both testbed
and final configuration.
Reference II Is a discussion of wind tunnel results including a simulatedslipstream over the wing. This discussion pertains to the SR7 design only by
virtue that it could be useful in estimating the llft distribution and flow
field of the wing in excitation calculations. Results show that up inboardswirl has less overall drag than up-outboard swirl. This is compatible with
Hamilton's knowledge that up-inboard rotation of propellers causes less exci-tatlon. It is recommended that up-inboard rotation propellers be considered
for all designs.
Reference 15 shows the results of Ames wind tunnel tests on the Prop-Fan,
wing, and fuselage combination. The pressure and lift distributions shouldbe useful in calculating flow fields. The effect of a leading edge extension
was determined in these tests and found to improve the drag of the aircraft.No notice was taken as to how it might effect blade excitation and/or
vibratory loads. It might be necessary to move the nacelle forward as theleading edge is extended. The wing is effectively being moved closer to the
propeller and the chord is being increased.
Reference 16 indicates that performance estimates are 10% higher than thecalculated values. Thls could imply that calculated vibratory loads due tothe flow field could also be low.
Reference 21 contains results of Boeing's finite element calculations of thewing pressure distribution and propeller swirl and its effects on perform-
ance. Again, modifications to the wing may effect blade excitations.
Up to this point, little of the information in the references cited show hard
and fast trends as to the structural integrity of the blades as effected bythe geometrical and loading parameters. Tip speed, number of blades, disk
loading, and blade loading are all adjusted based on design conditions andperformance and require that each design be fully investigated within its own
envelope. As an example, as the number of blades are increased, the disk
loading remaining more or less constant allows the load per blade to be re-duced. This allows a smaller blade to be designed to properly match the
loads. A parametric study for the Prop-Fan configurations is difficult to
generate because of the complexities of the analyses used. The effort thenbecomes one of designing for optimum performance and acoustics. The design

groups have showngood technique in designing for steady-loads and well un-derstood excitation. But deslgnlng In order to keep the Prop-Fan blade sta-ble dependson techniques and analyses that have not as yet been fully devel-oped at Hamilton Standard. _-
This area of vibratory loading and how it affects the design has not beendiscussed in the reference literature to any great extent. The Importance of
Flutter was demonstrated In wind tunnel tests of the SR-5 model Prop-Fan. As
indicated In Reference 23, areas of high vibratory stress were encountered athigh speeds and hlgh RPM. Tests of the SR-2 and SR-3 model Prop-Fans dld not
give any Indicatlon of Instab111tles: see References 19 and 20.
The results of this revlew indicate that there will be some radical changes
in the design. Specifically, the locatlon of the spar will probably moveforward, with an effort to keep the center of mass as far forward as pos-
sible. This will tend to reduce the possibility of classical flutter. These
trends were indicated in Flutter tests on conventional propellers as dis-cussed in Reference 24.
8.3 INDUSTRY SURVEY
An Industry survey to determine the mission definltion, and possible aircraft
configuratlon for Inltial applications of a Prop-Fan system was conducted.To accomplish thls, a mlsslon definition was established by Hamilton Standard
and submitted to major alrlines and alrframe and engine manufacturers forcomment.
The mission deflnltion established by Hamilton Standard was"
twin englne alrcraft
2222KM (1200 NM) - 2778KM (1500 NM) design range
926KM (500 NM) - 1111KM <600 NM) average stage length
$I.50/gai fuel (1981 economy)0.8 Mn cruise at I0668M (35000 FT)
This definition was reviewed by"
Boeing Commerclal Alrplane Company (BCAC)
Douglas Aircraft Company (DAC)Lockheed - California Company (LCC)
Lockheed - Georgia Company (LGC)Detroit Diesel Allison <DDA)
General Electric Company (GE)Pratt & Whitney Aircraft (P&WA)American Airlines (AA)Delta Airlines (DA)
Eastern Alrllnes (EA)United Airllnes (UA)

A summaryof the revlew is presented In Table 8.1.
Based on the results of this revlew, an average mission definition was pro-
vided to the NASA Project Manager who then provlded the A|rcraft Sensit|vlty
Coefficlents which were used in the trade-off study task (Reference Section8.4). The selected aircraft configuration and mission definition was the
Hamilton Standard (HS) estimate whlch Is very close to the Industry suKvey
average.

X
_Z
r_
Z0
r_
_D
U
_.)
0
00
0
0
°_
A
g ¢_I_ (_'__I"I I _ I 0
r_,-
I 0
¢',,1 v
0e,_O
v
A
0
I__'_ II 0
_0
-3_0
I 0_0(",.Il.l"l(:3"_v
0
i_ (.i-Il.l'Iv
,,,,.,.
,--0,--0
I 0_0
I"-,.I
0
0 0
e_e_ 0_ _0
I 0 _ I 0_0 IO 0i-_0 _c_O I
_0_0
_'- II 0
_0
_v
0C'JOr'-'.,,i._
I'M Ii 0
c'uOc'_lc',..lN_,C"...Iv
v
,r'-
0I.C}
v
.I-.I
_ v
I
-J 0 "_
0aO0'.00
Oe"_
0a_o
0
00
"_" 0,_-,'--0
.¢,,_
A
0_0
0¢"_
0
_0
O_v
0000_0
O_v
?
>-
_CZX
1.1.1
Z:"J 0 _--
n'_ I--- <C•=C _,-4 Q.
L_J
;[0
(._
Z
<CL_J
<C
<C
a-
W
0
0r_J
0
0
0
00
_n
(3.)
r--
_n
a_
0c_O
c_Iv
0cOO
II 0
eJO
(.,,j _
0aO0
I 0
o,,1¢,,4eNl_
,.000",0Nr_
v
0_='0
i 0--0
A_0,--0,---. _1_
II 0
'..00
0
,.-- CO
0
0 0aO0 _ ,--r'_ I._ _0I"._ _ _0 ;.--
I _'-_ II 0 ,_" I I£'1
('_v _7_ ,_.- _ •
0 P- 0_0 0(-x_ ('._ _0
e_Iv r,-.v
l_elv
v
(--
oJ..J
Q)
0
e-v
x/
e-
e-
I
I c-
O
0COO_._0
g_0
0000'._0
0_'_
0
=g,,.0
0("'1
$0
0",0
_:_,- _. (-,-)
00
_"0
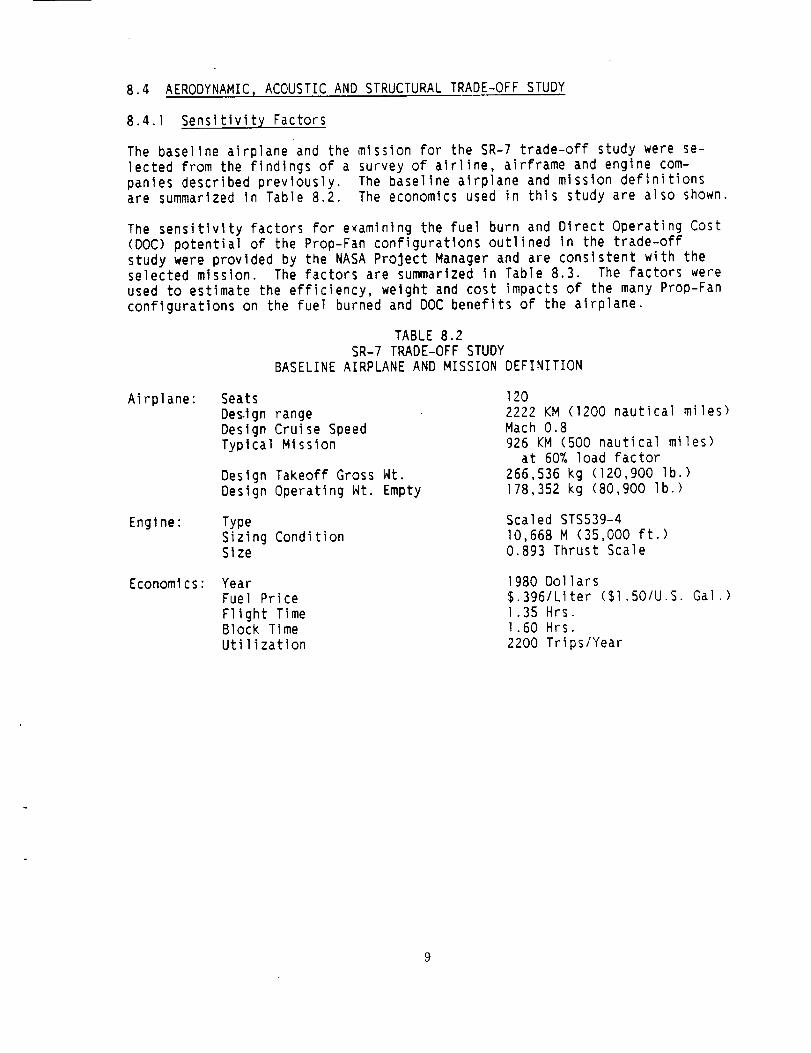
8.4 AERODYNAMIC, ACOUSTIC AND STRUCTURAL TRADE-OFF STUDY
8.4.1 Sensitivity Factors1
The baseline airplane and the mission for the SR'7 trade-off study were se-lected from the findings of a survey of alrline, airframe and engine com-panles described prevlously. The baseline alrplane and mission deflnitlonsare summarized In Table 8.2. The economics used in this study are also shown.
The sensitivity factors for examlnlng the fuel burn and Direct Operating Cost
(DOC) potential of the Prop-Fan configurations outlined In the trade-off
study were provlded by the NASA Project Manager and are conslstent with theselected mission. The factors are summarized in Table 8.3. The factors were
used to estimate the efficiency, weight and cost impacts of the many Prop-Fan
configurations on the fuel burned and DOC benefits of the alrplane.
TABLE 8.2
SR-7 TRADE-OFF STUDY
BASELINE AIRPLANE AND MISSION DEFINITION
Airplane" Seats
Des.lgn range
Design Cruise SpeedTypical Mission
Design Takeoff Gross Wt.
Deslgn Operating Nt. Empty
1202222 KM (1200 nautlcal miles)
Mach 0.8
926 KM (500 nautical miles)at 60% load factor
266,536 kg (120,900 lb.)178,352 kg (80,900 lb.)
Engine: Type
Sizing ConditionSize
Scaled STS539-4
I0,668 M (35,000 ft.)0.893 Thrust Scale
Economics: Year
Fuel Price
Flight TimeBlock Time
Utilization
1980 Dollars$.3961Liter ($1.501U.S. Gal.)1.35 Hrs.1.60 Hrs.
2200 Trlps/Year

TABLE8.3SENSITIVITYFACTORSFORTYPICALMISSIONOF
120 PAX, TWIN ENGINE TRANSPORT DEFINED IN TABLE 8.2
Change Caused By
Prop-Fan Configurations
Effect of Change On"%_Fue] Burned %ADOC
+] Pt. Prop-Fan Efficiencyfor the Airplane Mission
±2205 kg (I000 LB)/EnglneA(Prop-Fan + Gear Box) Weight
+4409 kg (200 LB)/Airplane
a (Acoustic Treatment + LandingGear ) Weight Penalty
_$100,000 Prop-Fan Price
;1.57% ;0.74%
+2.10% +1.30%
+2.38% +1.77%
+0.27%
+$11Fli'ght Hour Prop-Fan - ±0.10%Maintenance Cost
8.4.2 Prop-Fan and Gear Box Weight Generalizations
The Prop-Fan weights (WPF) used in the SR-7 trade-off study are for advanced
technology, double acting propellers. The weights are given by the equationpresented below, and include the blades, hub, pitch change and spinner"
NPF = (DPF"8'_)(TAF'7_)(B-'°_)(UTO'_)(PTO'3ZT)NF/104.2
where WF Is a weight factor dependent upon blade tip sweep (A); given by:
WF - .091 (A145) + .909
The terms in the weight equation are defined in Table 8.4. WPF is the weight
in kilograms per propeller.
Gear box weight variations were also included in the trade-off study and areas presented in the Hamilton Standard 1977 data pack (Reference 13). The
parametric variations in gear box weights (NGB) expressed by:
NGB = 5.34(PTO)(DPF)(GRF'_2)/UTO
where the gear ratio factor (GRF) is expressed as"
GRF : [(BASELINE UTO)/UTO][DPF/(BASELINE DPF)]
10
ACGB
ACPF
AF
b
b/D
BPF
CLD
CLI
db
DOC
DPF
GBF
h/b
MCBG
MCPF
PTO
R
r/R
SCD
UTO
VIVo
TAF
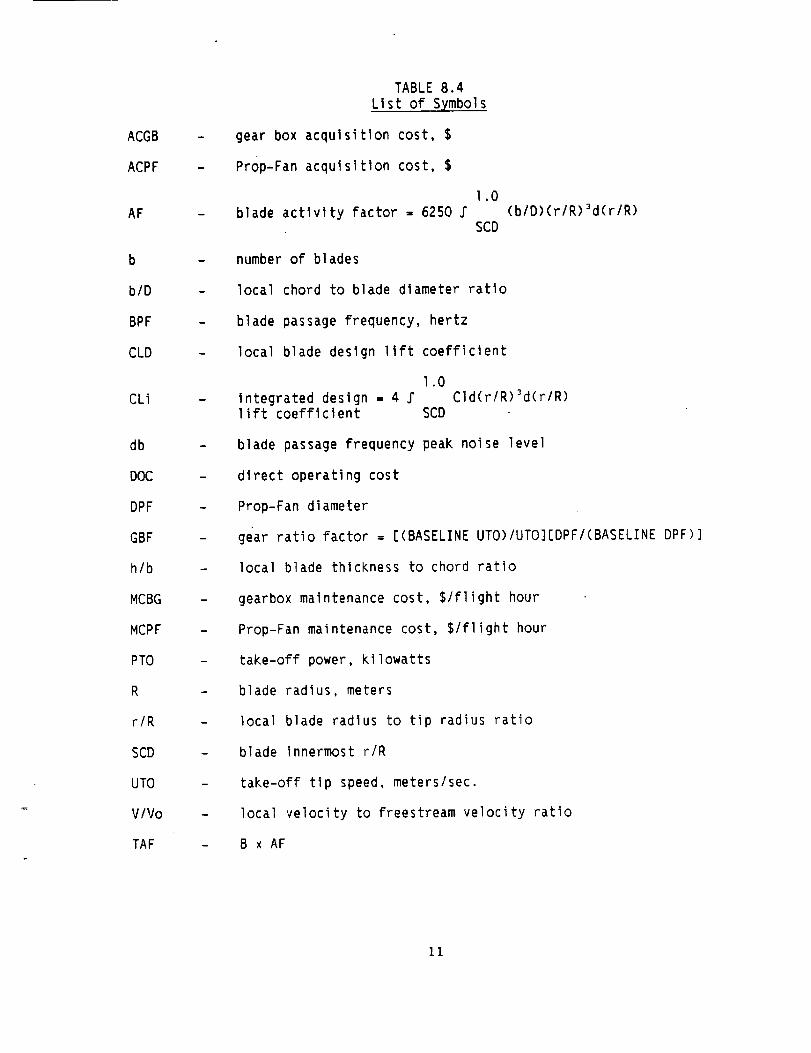
TABLE 8.4
List of Symbols
gear box acqulsitlon cost, $
Prop-Fan acqulsltlon cost, $
l.O
blade actlvlty factor - 6250 J" (b/D)(r/R)3d(r/R)SCD
number of blades
local chord to blade diameter ratlo
blade passage frequency, hertz
local blade design llft coefficlent
l.O
Integrated design - 4 J" Cld(r/R)3d(r/R)lift coeffIclent SCD
blade passage frequency peak noise leve]
direct operating cost
Prop-Fan d1ameter
gear ratio factor : [(BASELINE UTO)/UTO][DPF/(BASELINE DPF)]
local blade th|ckness to chord ratio
gearbox malntenance cost, S/flight hour
Prop-Fan maintenance cost, S/flight hour
take-off power, kilowatts
blade radlus, meters
local blade radlus to tip radius ratio
blade innermost r/R
take-off tip speed, meters/sec.
local velocity to freestream velocity ratio
BxAF
11

TAF
WF
WPF
WAT
WGB
WLG
X
Y
Z
e
O*
A
m
TABLE 8.4 LIST OF SYMBOLS(CONTINUED)
B x AF
weight factor : .091 (A/45) - .909
Prop-Fan weight, kilograms
acoustic treatment weight, Kilograms
gearbox weight, kilograms
landing gear weight, kilograms
inplane blade coordinate, meters along pitch change axis
inplane blade coordinate, meters perpendicular to pitch change
axis. Also clearance between fuselage and blade tip
axial blade coordinate, meters positive downstream
blade twist angle, degrees
camber angle, degrees
cone angle, degrees
sweep angle, degrees
acoustic treatment weight parameter
12

8.4.3 Fuselage Acoustic Treatment Penalty
Each Prop-Fan configuration incurred an acoustical treatment weight penalty
to the airplane In order to meet the 80 dBA interlor nolse level establishedfor the trade-off study. A theoretical treatment analysls was developed by
Revell, Balena and Koval at the Lockheed California Company. This acoustical
treatment analysis, with LCC's approval and assistance, was adapted for usein this study. The equations are presented below, and are based upon blade
passage frequencies (BPF) and the BPF noise levels for each Prop-Fan conflg-uration:
ACOUSTICAL TREATMENT HEIGHT PENALTY FORMULATION
Definitlon:
Reference acoustic treatment weight (NAT) parameter = _,e_
Adaptation of the LCC Analysis
The theoretical results obtained by Lockheed were found to be represented
very well by a mass law and BPF scaling. These scaling laws state that a 6dBnear-f_eld nolse reduction or a doubling of BPF halves HAT. Therefore, the
followlng generalization was developed:
WAT - (4.8B(BPFREF/BPF)[IO(dB - dBRE_)/20](aR_F(N)(DPF)(DF)
where HAT is the acoustic treatment weight penalty in kilograms.
From the number of theoretIcally defined points provided, the acousticaltreatment weight generalization represent LCC's results best with these ref-
erence (REF_ quantities:
BPF,er = 2]2
dBrer = 142.9 @ Y/DPF = 0.2= 138.g .0.4
= 136.g - 0.6= 134.9 = 0.8
= 133.9 - l.O
where Y Is the clearance between the fuselage and the blade tips, and Y/DPF
normalizes this clearance to the Prop-Fan diameter. For th_s parametric
study, the distance from the propeller centerline to the fuselage was Fixedat 4.92 meters (16.14 ft). Lockheed's theoretical analysis showed that a
smaller portion of the fuselage required treatment as the noise source was
moved closer. This was generalized as:
a_E_ = 1.25 (Y/DPF) + 4.6 (0.4 < Y/DPF < 0.8)= 5.1 (0.0 < Y/DPF < 0.4)
= 5.6 (0.8 < Y/DPF < l.O)
13
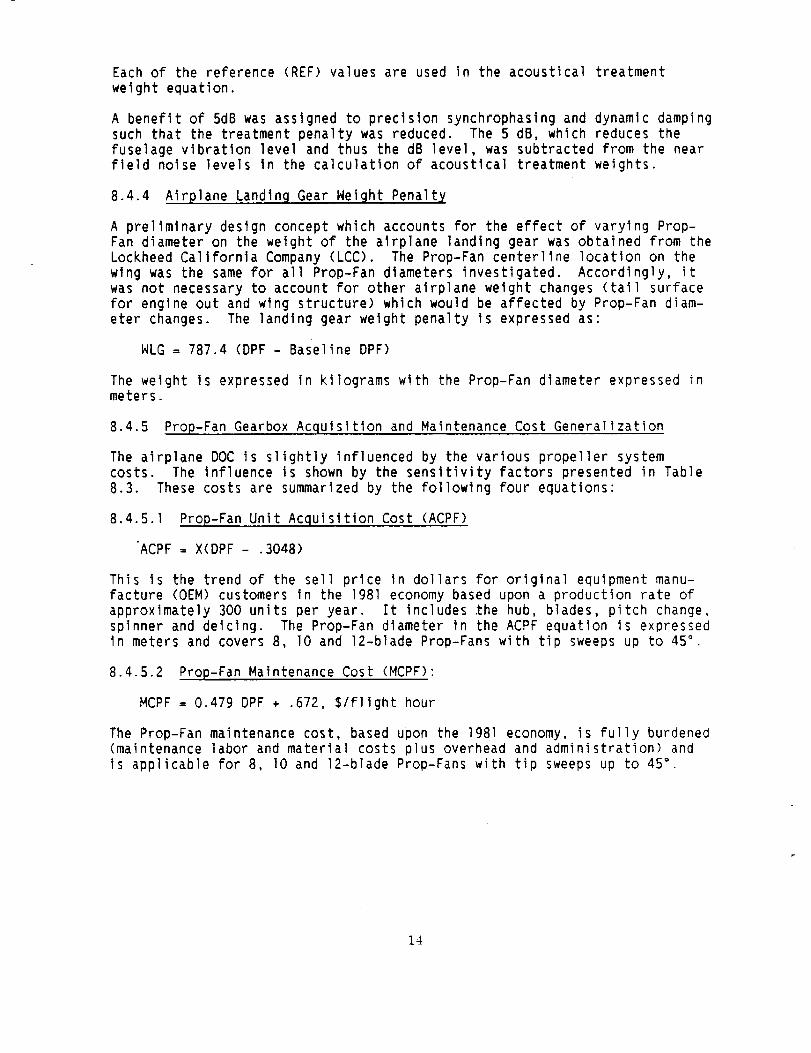
Eachof the reference (REF) values are used in the acoustical treatmentweight equation.
A benefit of 5dBwas assigned to precision synchrophasing and dynamic damping
such that the treatment penalty was reduced. The 5 dB, which reduces thefuselage vibration level and thus the dB level, was subtracted from the near
field noise levels In the calculation of acoustical treatment weights.
8.4.4 A_rplane Landlnq Gear Weight Penalty
A preliminary design concept which accounts for the effect of varying Prop-
Fan diameter on the weight of the airplane landing gear was obtained from theLockheed California Company (LCC). The Prop-Fan centerllne location on the
wlng was the same for all Prop-Fan diameters investigated. Accordingly, it
was not necessary to account for other airplane weight changes (tail surfacefor engine out and wlng structure) which would be affected by Prop-Fan diam-
eter changes. The landing gear weight penalty is expressed as:
WLG = 787.4 (DPF - Baseline DPF)
The weight Is expressed in kilograms with the Prop-Fan diameter expressed inmeters.
8.4.5 Prop-Fan Gearbox Acquisition and Maintenance Cost Generalization
The airplane DOC Is slightly influenced by the various propeller systemcosts. The influence is shown by the sensitivity factors presented in Table
8.3. These costs are summarized by the following four equations"
8.4.5.1 Prop-Fan Unit Acquisition Cost (ACPF)
ACPF : X(DPF - .3048)
This is the trend of the sell price in dollars for original equipment manu-facture (OEM) customers in the 1981 economy based upon a production rate of
approximately 300 units per year. It includes _he hub, blades, pitch change,spinner and deicing. The Prop-Fan diameter in the ACPF equatlon Is expressed
in meters and covers 8, lO and 12-blade Prop-Fans with tip sweeps up to 45 °.
8.4.5.2 Prop-Fan Maintenance Cost (MCPF)"
MCPF = 0.4?9 DPF + .672, S/flight hour
The Prop-Fan maintenance cost, based upon the 1981 economy, is fully burdened(maintenance labor and material costs plus overhead and administration) and
is applicable for 8, IO and 12-blade Prop-Fans with tip sweeps up to 45 °.
14

B.4.5.3 Gearbox Acqulsltlon (ACGB) and Maintenance Cost (MCGB)
The gearbox acquisition and maintenance cost generalizations are shown inFigure 8.l. These are unit costs In the 198I economy and are proportional to
Prop-Fan torque. The unit gearbox costs for the basellne Prop-Fan (noted In
Figure 8.1) are acquisition of l.O and maintenance of 2.114 dollars. Theseare shown at the torque ratio of 1.0 for the baseIlne Prop-Fan. The torque
ratio Is equal to the product of the indicated constant (59.5) and the ratloof diameter and takeoff tlp speed. The units for the torque ratlo are inde-
pendent of the system of units as long asboth the diameter and the length
units used in defining tip speed are consistent.
8.4.6 Trade-off Study Parameters
The parametric variables studied fall into two categories, flight condition
definition, and blade geometric properties, The aircraft is designed to op-erate at a crulse Mach number of 0.8 at an altitude of I0668M (35000 FT) with
an average cruise power of 4312 KW (5?82 HP). The combination of power/diameter _ and the Prop-Fan tip speed are optimized for three speeds using
the alrcraft sensitlvity parameters dlscussed in sectlon 8.4.1.
The Prop-Fan and blade geometric parameters investigated include number ofblades, and varlations in the radlaI distributions of blade sweep, thickness
ratio, design Integrated lift coefficient, twist and blade stacking. Each
geometric variable was systematically varied, changing only one variable at atime, to assess the effect of each variable on net efficiency, noise level,
percentage change of fuel burned and percentage change of direct operatlngcost.
The blade geometrlc radlaI distributlons used in the SR-7 trade-off study are
shown In Figures 8.2 through 8.7. Figure 8.2 presents the family of blade
sweep distributions studied, including the baseline blade which has a tipsweep of 39.6°,•
The sweeps range'from 0 up to 48 degrees at the blade tip. The latter sweep
Is similar to that of the SR-5 design. The case numbers shown refer to thetrade-off case numbers discussed later in the text.
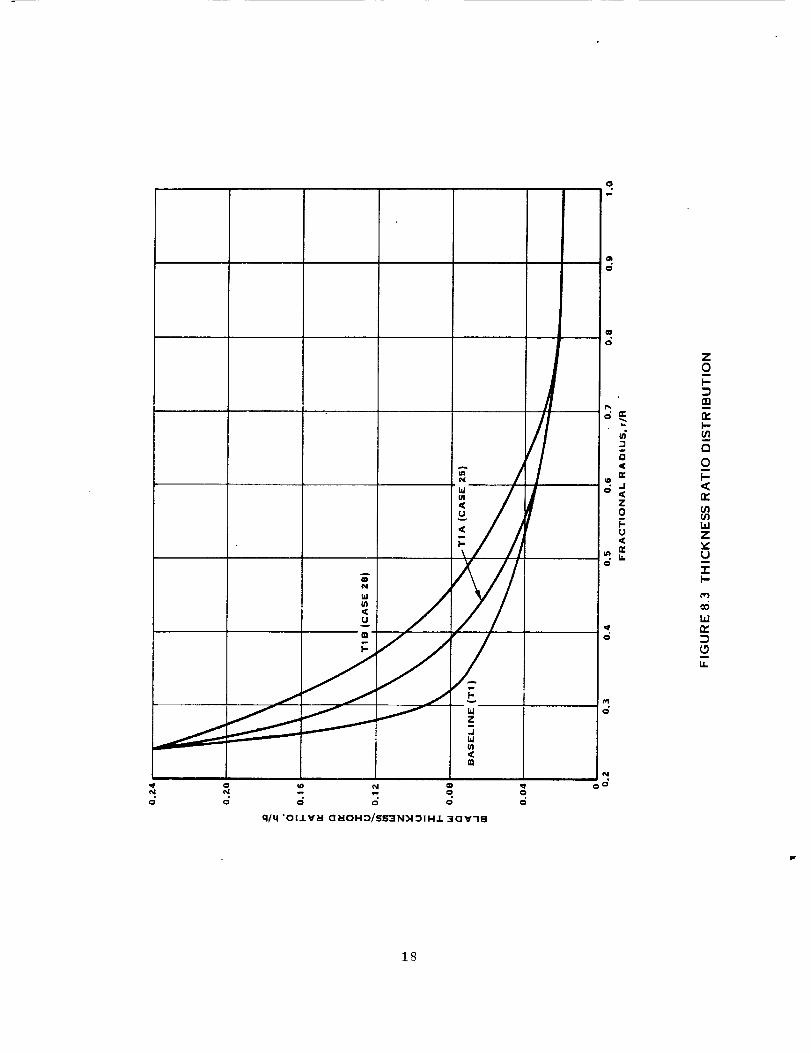
The three blade thickness ratio distributions assessed are shown In Figure8.3. The baseline TI distribution was used for the previous SR-I, SR-2,
SR-3, and SR-5 blade designs. Thickness ratios TIA and TIB have greaterthickness ratios inboard to provide potential structural benefits.
The blade planform shapes are shown in Figure 8.4. Two tip chord changesfrom a baseline are shown. In addition, a blade with a wider chord in theinboard area has been included because of its better structural charac-
teristics.
1.5
0 \:E
q. m N _m m _
000 I/$ '8gDV '.I.SOD NOI.LISInO_IV XOe_IV ":leJ
o om
bJ
r_
I"
0"I"
N :E•_ <
Z<
1.0¢L
o.×
dI-<
0I-
.icia.
ZU'i0 _---U'I
_0<U
F-
OIEUOWZUO
<UJZ--W_
Z"
_6_P
<WZ _0 o
_-ON_5zO<uu.,
Oa.II1
<_"'3
hiIZ
I
N
I I 1 IN 0 ¢0
':qH "J.-i-_/$ 'G_)DV¢ '.LSO3 30NVN3J.NIV_ XOe_IV30
16

0IllaI
L
i-
NN
w
-- ¢1i
hiu)<C8v
m
L_ L_,q
<ogo
k
O O O O O O
o.
n,r_
a<rv
z0
u
o
z0
m
I-
W
oz<(1.I.xJW
UJr_
[,
SqqU_3O - 3"IONY d33MS :3GY'18
1"/
0
o0
j'_/ J -
Ut
<m
in
o
q/q 'OIJ.VH O_OH:_/SS3NN_IH.L 3OV-IB
n,,.,..
<
n.
z0I-
U
<
Z0
I11
1--
a
0
<
Z
Um
-ei-
O'l
18

'v')
z_
"W <m m
Lm
0"t ":.o o
olq 'OlJ.V_l _I3J.:3LNVIO/O_IOHO :3OV"Ig
O
O
N
oO
=_.k.
(6
r_,¢r_
Z0I-,u<
Z0i
0
Z<
(3.
w
m,
19

Figure 8.5 presents the four design lift coefficients, C_o, distributlons
used In the trade-off study. The baseline CLo is identical to that used
for the SR-3 design. The lower camber distributlon shown was used for theSR-IM design. The higher camber variation shown completes the curve famlly.
In.additlon, the dlstributlon shown as a dashed 11ne In Figure 8.5 was se-
lected to assess the effect of shiftlng the peak Cto toward the mld portionof the blade.
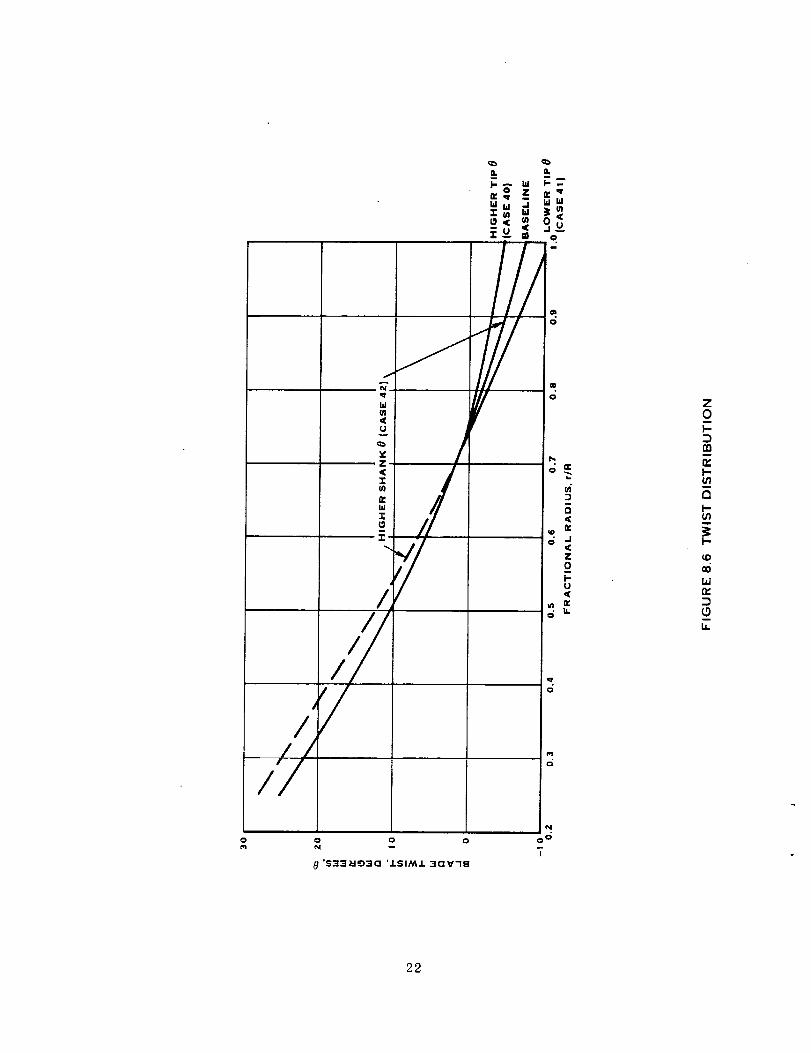
Varlous blade twlst dlstributlons are glven In Figure 8.6. Three tip twists,includlng the baseline were assessed In the trade-off study. A hlgher In-
board blade shank twist was also selected because of possible acoustic andblade choke margin advantages.
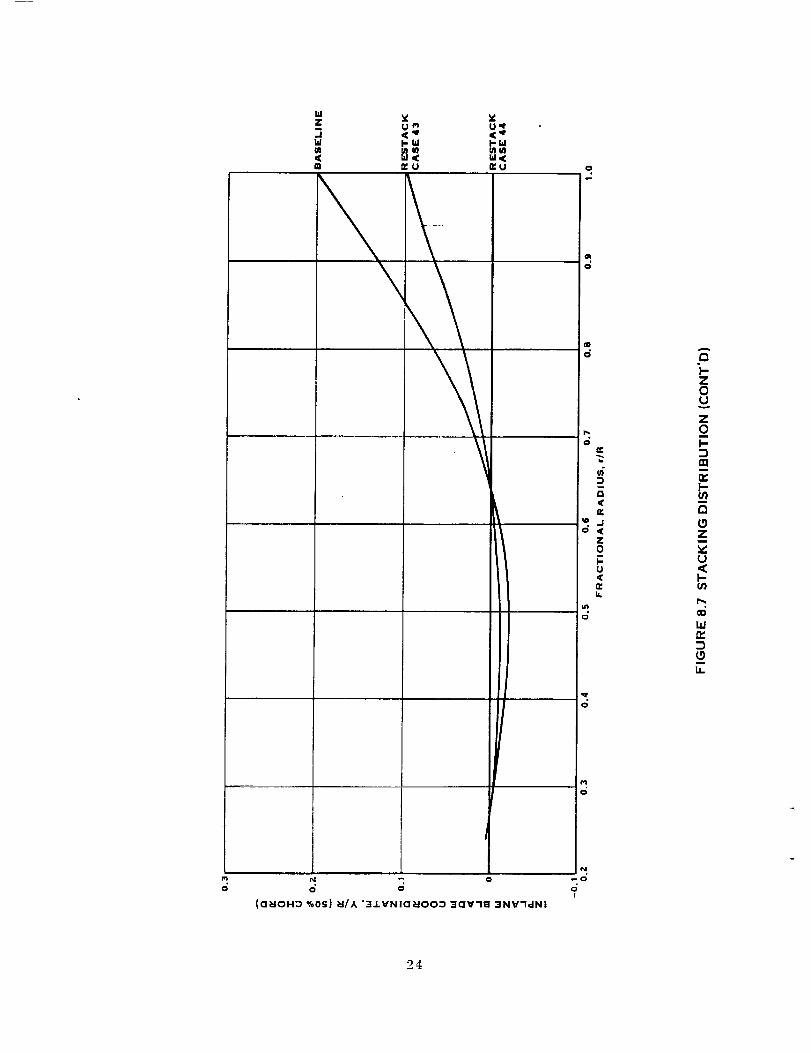
The final geometrlc blade parameter studled was the blade stacking, definedas the Fifty percent chord location in three dlmensional space. The non-
dlmenslonal, X, Y, Z coordinates of the half chord are shown in Figure 8.7for three blade stacklngs all having the same sweep. The basellne blade is
located on a hellcal surface (defined by the local resultant velocity direc-
tion) Includlng nacelle velocity perturbations, which are discussed below.
The reason for the two restacks was to reduce the In-plane lean (the Y co-
ordinate) to improve the blade structural integrity. Note In Figure 8.7 asthe Y/R is reduced the axial blade coordlnate, Z/R, increases 'to maintain
constant sweep.
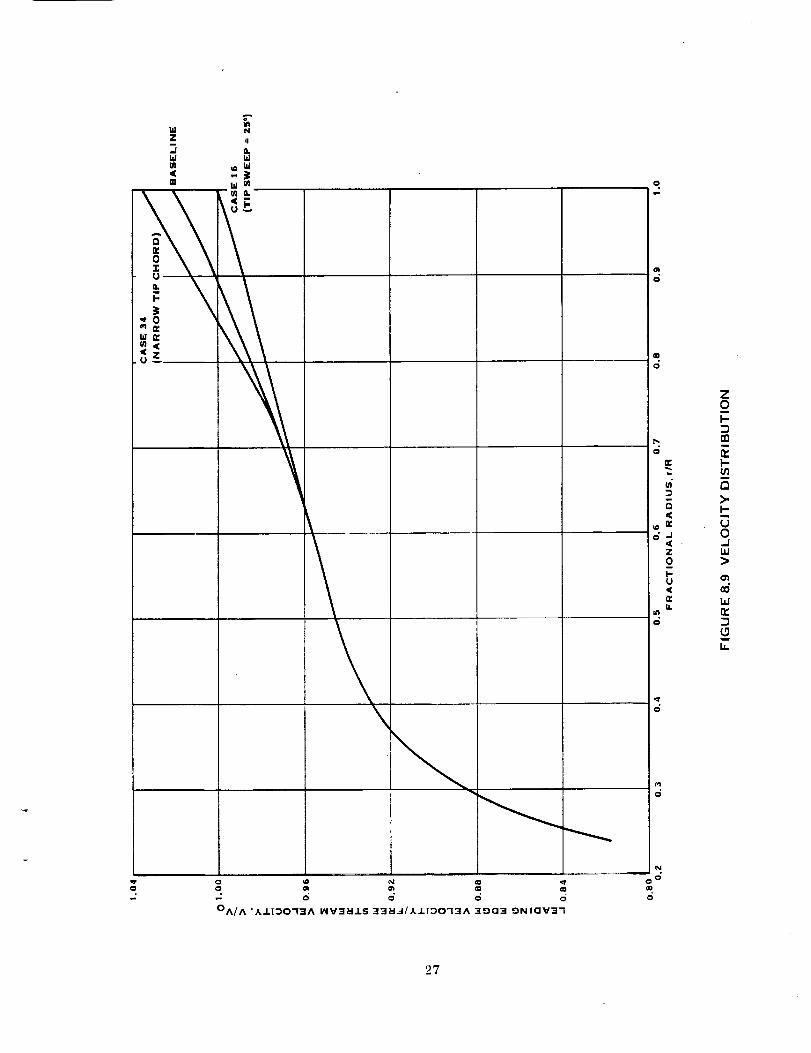
The splnner-nacelle body, retards the flow over the inner portion of the
blade and can accelerate the flow near the blade tip. Figure 8.8 shows thenacelle generated flow field perturbation in the vlcinity of the baseline
blade. Figure 8.9 shows the radial distribution of the velocity defined atthe blade leading edge. The narrow tip chord blade, and the 25° tip sweep
blade are used as representative blades to show how redefining the sweep orplanform redefines the nacelle retardation.
8.4.7 Discussion of Results
8.4.7.1 Basellne Blade Study - The baseline elght bladed Prop-Fan with shape
characteristics defined in the previous section, was evaluated over a rangeof tip speeds and power loadings to determine the performance and nolse le-vels. The tip speed was varied in four steps, 259.1M/S (850 FT/S), 243.8
M/S (80OFT/S), 213.4 M/S (700 FT/S), 182.9 M/S (600 FT/S) and the power load-Ing In three steps, between 301.0 KW/M 2 (37.5 HP/FT _) and 160.5 KW/M 2
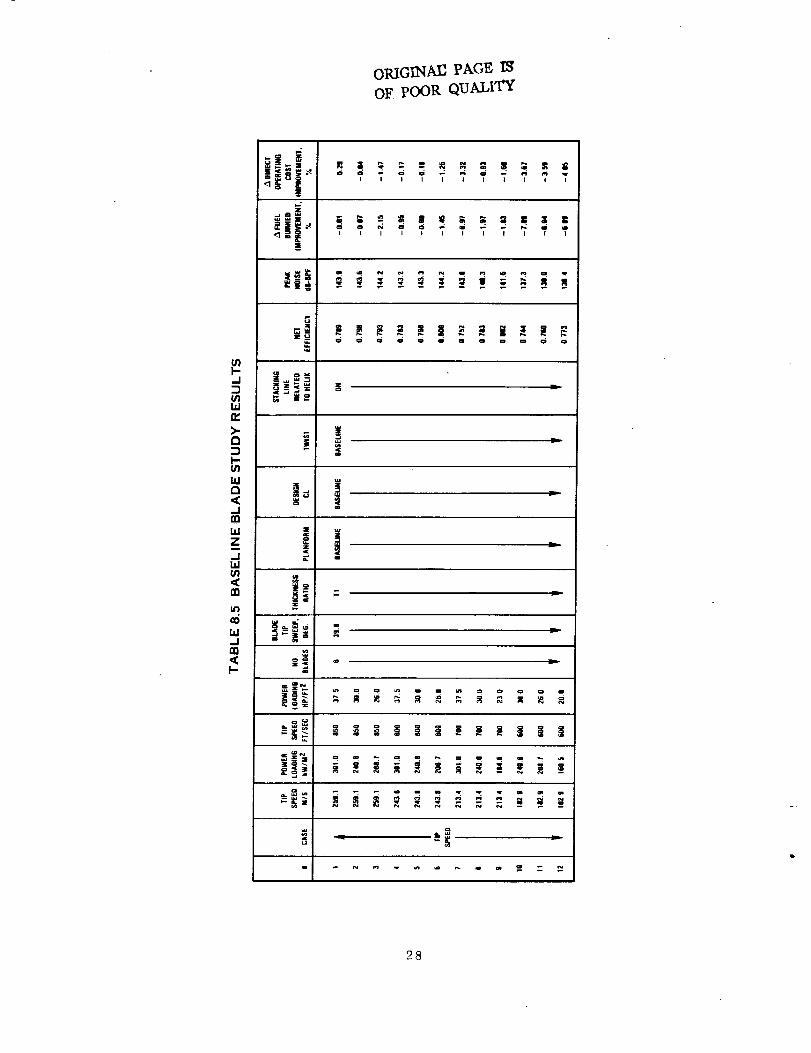
(20.0 HP/FT 2) to form a matrix of twelve points, shown In Table 8.5.
20

n,10m_E<-rUA
bJ
IId
_m wu
/f ,LI-IJi
-<
i
,it _ N
\
all
c_
O
C1"10 'J.N31DI -_3OD .1.'11"1 NOlS3a _OV'lg
OO
=u_
Q<n*_1<Z0
I-U<n,11,
z0m
I-
rar_I-U_
I--ZLI,I
LI.[a.laJ0U
14.
..J
z(3
bJQabJI-<r_(3LtJI-Z
coLIJrv.
(3LI=
21
J
/
f
b_U)
<u
vz<
n_bJ"7-
_L O.
r_< U
m o.
/l/"g °
0 0 0N
0 '_;313EI"J3C] '.LSIM.L 3av'lS
<
<z0
u<
N
0 o
7
01-.-
I-191
QI-(/i
I-
eiw
I,L
22

Z0
<XI- <0CX
_.ZO0
zO
Illp
_0N.Ji1_ tall.>
'S
m<k,111Id
a_Z m
<<u
-UJ<WI--
m 0 0 0
(CI_IOH3 %05) _I/X '3J.VNIO_IOO::) elOV'18 ]NV'1dN!
Z0w
i-
raI11i-
ra
zm
U<:I-
P_
o_i,d2:
1,1.
23
eq N
0 0 o
wz b__ u ¢'1 uq..I <q <qb# I-W I-m,m
w<m n*U n'U
%
0
(O:_OH::) %OS) H/A "3J.VNIO_IO0::) 3OYlE 3NV'IdN!
0
0
O<r_
9-Jo <
z0
u<tvb.
in
o
o
oa
_o
o
)-Z0Uw
Z0m
m
).-u)
QL_zm
b_U<I-ul
bJr.
(3
m,
24

kiv, i[
h.W
n'U m
/
q
w
,(u
u
Ill
0 0 0
0
((3HOH3 %0c_) _I/Z '3/VNIQHOO3 ":IQV'18 1YIXY
elld
LfJ
c_
o
e%i
-dO
mb
r_
Z0
}-u
Ii.
r_
zoU
Z0m
i-
n,l-(ll
z
LJ<EI--u}
LIJ/y
h
25

1.0
0.8
=_.u.
3
Q<r_.j 0.6<Z0
F-U<tvI;.
0.4
0,2
-0.6
1.00
V/V 0 = 0.9_
0.92
0.980.88
0.84
0.80
-0.4 -0,2
FRACTIONAL AXIAL LOCATION, Z/R
0.Z
BASELINE
PROP-FAN
0.4
FIGURE 8.8 CENTERBODY BLOCKAGE
2_
WZ
.IW
<m
g-inN
ii
al.t,t
_W,-3
0 0 0 0
O,&/**X 'A..LI_O"13/_ I_V:3_.LS _l':l_/,,kJ.l_O=l:3A ]_Da*:Jl _NIaV3=I
c_er
b
B
_. ne
Z
0
l-(J
,<n,
in
o
q.1
o
o Oco
o
Z0
I-
W
i-ra
g>,I-
@-Jw>
W
2T
ORIGINAl] PAGE I_
OF pOOR QUALITY
g)F-.J
(11hnfl=
>a
F-6"I
ult_<.J
WZi
in,n
=)
LO
w.J
<
j.! " ? , ? ? T 7 ? T 7 , ,
N N N
_..=.
78
The aerodynamicperformance for the baseline Prop-Fanwas calculated usingHamilton Standard programH4og, and is shownin Table 8.5 and Figure 8.10through 8.14 for the matrix of operating points. Also shownIn Figure 8.10Is measuredperformance For the SR-3Prop-Fan, as reported in Reference 20.The SR-3blade Is very similar to the baseline blade which has a slightlywider tip chord and slightly higher tip sweepangle. Performanceand noiselevel prediction (using Hamilton Standard programF091) differences betweenthe SR-3 and baseline Prop-Fans are insignificant. Comparlngtest data andpredictlon, the major differences occur at the 25g.1M/S (850 FT/S) tip speedand at the power loading extremes at 213.4 M/S (700 FT/S). The comparisonwasmadeto develop corrections to the predicted net efficiency to improvethe trade-off analysis accuracy. In general, the predicted net efficiencyincreases with Increasing tip speed levels for the baseline Prop-Fan. In
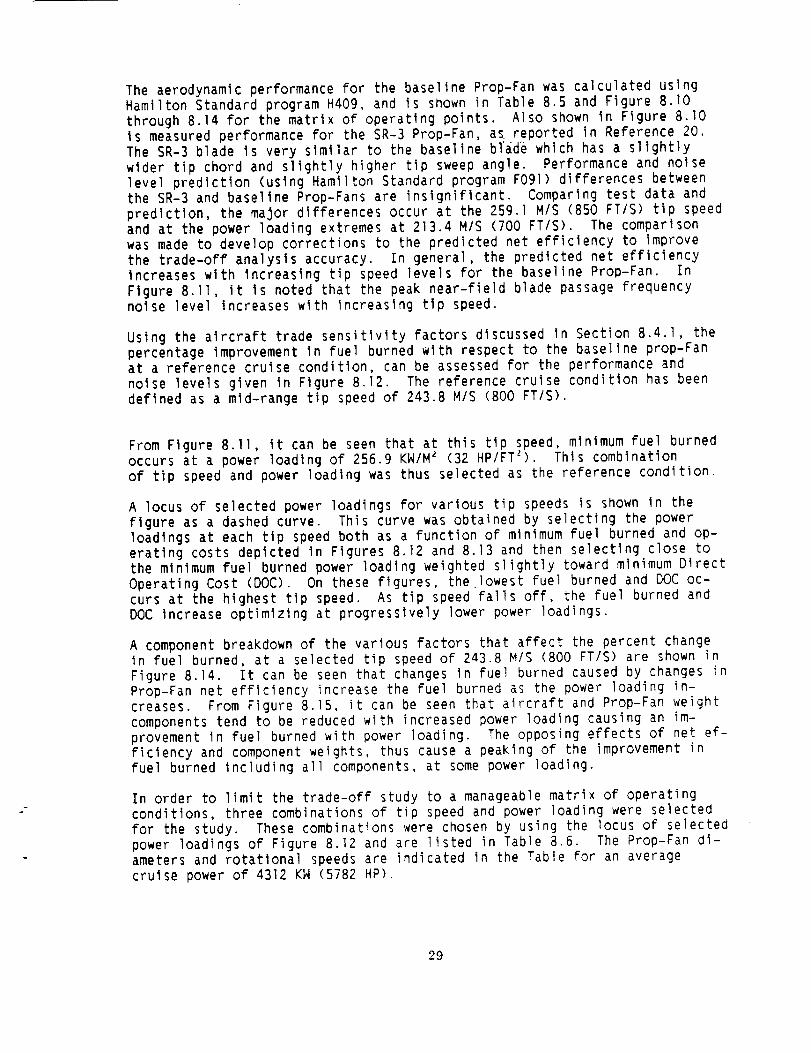
Figure 8.11, it Is noted that the peak near-field blade passage frequencynoise level increases with Increasing tlp speed.
Using the aircraft trade sensitivity factors discussed in Section 8.4.1, the
percentage Improvement in fuel burned with respect to the baseline prop-Fanat a reference cruise condition, can be assessed for the performance and
noise levels given In Figure 8.12. The reference cruise condition has been
defined as a mld-range tip speed of 243.8 M/S (800 FT/S).
From Figure 8.11, it can be seen that at this tip speed, minimum fuel burnedoccurs at a power loading of 256.9 KN/M _ (32 HP/FTZ). This combinationof tip speed and power loading was thus selected as the reference condition.
A locus of selected power loadings For varlous tip speeds is shown in the
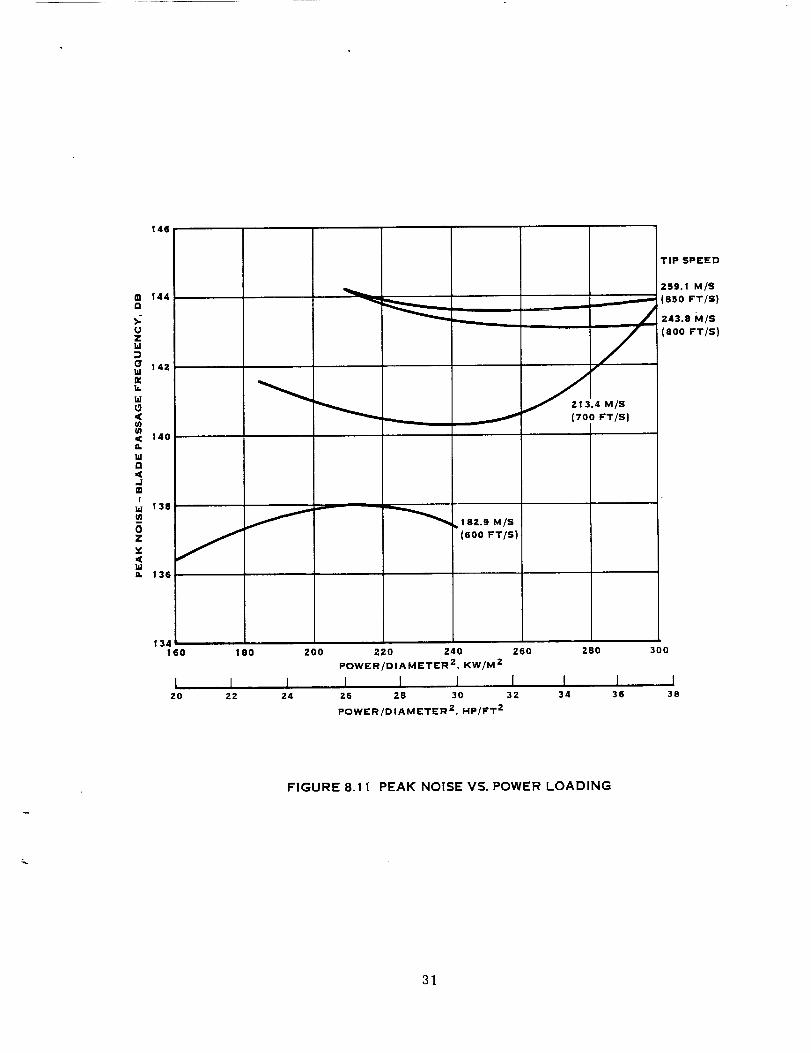
figure as a dashed curve. This curve was obtained by selecting the powerloadlngs at each tip speed both as a function of minimum fuel burned and op-
eratlng costs depicted In Figures 8.12 and 8.13 and then selecting close tothe minimum fuel burned power loading weighted slightly toward mlnimum Dlrect
Operating Cost (DOC). On these flgures, the lowest fuel burned and DOC oc-curs at the highest tip speed. As tip speed fails off, the fuel burned and
DOC Increase optimizing at progressively lower power loadings.
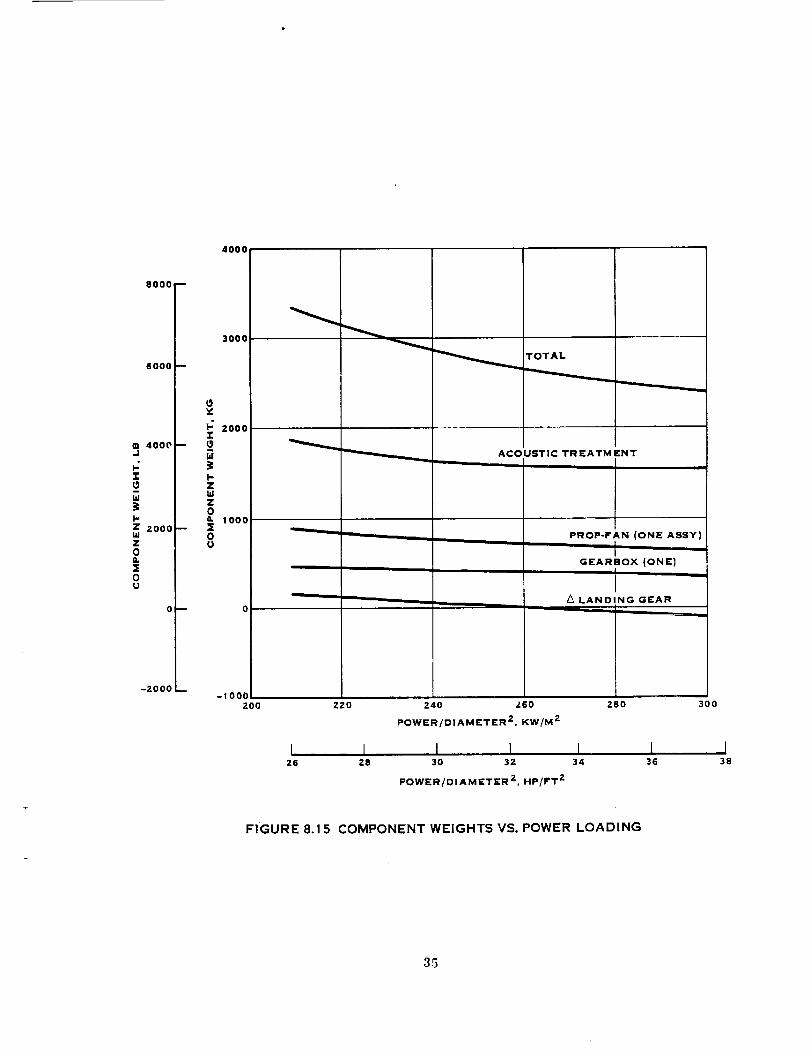
A component breakdown of the various factors that affect the percent changein fuel burned, at a selected tip speed of 243.8 M/S (800 FT/S) are shown inFigure 8.14. It can be seen that changes In fuel burned caused by changes inProp-Fan net efficiency increase the fuel burned as the power loading in-creases. From Figure 8.15, it can be seen that aircraft and Prop-Fan weight
components tend to be reduced with increased power loading causing an im-provement in Fuel burned with power loading. The opposing effects of net ef-
ficiency and component weights, thus cause a peaking of the improvement infuel burned including all components, at some power loading.
In order to limit the trade-off study to a manageable matrix of operating
conditions, three combinations of tip speed and power loading were selectedfor the study. These combinations were chosen by using the locus of selected
power loadings of Figure 8.12 and are listed in Table 8.6. The Prop-Fan di-
ameters and rotational speeds are indicated In the Table For an averagecruise power of 4312 KW (5782 HP).
_09

0.82
0.80
0.78
>-uZIdm
uEO.TeIt.bl
I.-IdZ
0.74
0.72
_L
TEST DATA (SR-3 PROP-FAN}
PREDICTED (BASELINE PROP-FAN)
182.9 M/S
(eoo FT/S)
0.70 r_
160 ! 80 200 220 240 260 280 300
I I2O Z2
POWER/DIAMETER 2, KW/M 2
1 I I I .I [24 26 28 30 32 34
POWER/DIAMETER 2, HP/FT 2
I36
TIPSPEED
259.1 M/S
(850 FT/S)
259.1 M/S
(850 FT/S)
243.8 M/S
800 FT/S}
!13.4 M/S
{7oo FT/S)
213.4 M/S
FT/S)
I38
FIGURE 8.10 NET EFFICIENCY VS. POWER LOADING
3O
mQ
(Jzld
Ii,w0<inIn<LId
<
mI
ld
0Z
Ig<Id
t46
144
142
140
138
136
---.....
TIP SPEED
I,m,i
zsg.I M/S
(85o FT/S)
z43.8 M/S
(800 F'T/S)
134180
I20
r
180 Z00
I2Z
__ ! 82.9 M/S
(600 FT/S)
IZ4
220 Z40 Z60 280
pOWER/DIAMETER 2, KW/M Z
I I I l iZ6 2B 30 32 34
pOWER/DIAMETER 2, HP/FT 2
I36
300
138
FIGURE 8.11 PEAK NOISE VS. POWER LOADING
31

I.-Z[dun,bJo. o
ciwz
11.Jw -2
IL
Z
I-ZilaZ -4ld>0Ili9.IE
-6
-8160
120
//
/
/I
III
jf LOCUS OF SELECTEDPOWER/DIAMIETER 2
BASED ON NEAR MINIMUM
FUEL BURNED AND DIRECT
OPERATING COST
182.9 M/S
_213.4 M/S
oo FT/S)
180 200 220 240 Z60 280
POWER/DIAMETER 2, KW/M 2
I I J I 1 1 I I22 24 26 28 30 32 34 36
POWER/DIAMETER z, HP/FT 2
TIP
SPEED
259,I MS
(8S0 FT/S)
243.8 M/S
(800 FT/S)
300
I38
FIGURE 8.12 IMPROVEMENT IN FUEL BURN VS. POWER LOADING
32
)-ZIllur__i 0
0u
z
<
uaa.oI-U
Z
Z
X -3ld>oIzn
TIP SPEED
f
y
Z13.4 M/S
(700 FT/S}
182.g M/S
(soo VT/S)
-5
160 180 200 220 24d
\
Z60 280
ZSg. 1 M/S
(sso FT/s)
243.8 M/S
(soo FT/S)
POWER/DIAMETER 2, KW/M 2
00
I ] I I 1 I I I I IZ0 22 24 Z6 Z8 30 32 :34 36 38
POWER/D IA METER 2, HP/FT 2
FIGURE 8.1:3 IMPROVEMENT IN DIRECT OPERATING COST VS. POWER LOADING
33

i-ZwUrvIda.
ILlZ
DM.JwD
Z
h,Zld
>0
a.
-!
-2
-3
EFFICIENCY
PROP-FAN AND
GEARBOX WE:IGHT X
ACOUSTIC
TREATMENT AND
LANDING GE;AR
GHT
x----....
200
I26
220 ,?,40 260
POWER/DIAMETER 2, KW/M 2
I I i I IZ8 30 3Z 34 36
POWER/DIAMET=R 2, HP/FT 2
280 300
I38
FIGURE 8.14 IMPROVEMENT IN FUEL BURNED VS. POWER LOADING
34 °
80OO
6000
400C
Z
W
Z 2000
Z0
X0U
-2000
ILl
T"ZldZ0
_ _0
4000
3000
2000
I ooo
-1000200 220
_ TOTAL
ACOUSTIC TREATMENT
,40 Z60
POWER/DIAMETER 2, KW/M 2
PROP-FAN (ONE ASSY)
GEARBOX lONE:)I
A LANDING GEAR
28O
I I I I IZ6 Z8 30 3Z 34
POWER/DIAMETER 2, HP/FT z
300
136
I38
FIGURE 8.1 5 COMPONENT WEIGHTS VS. POWER LOADING
3.G
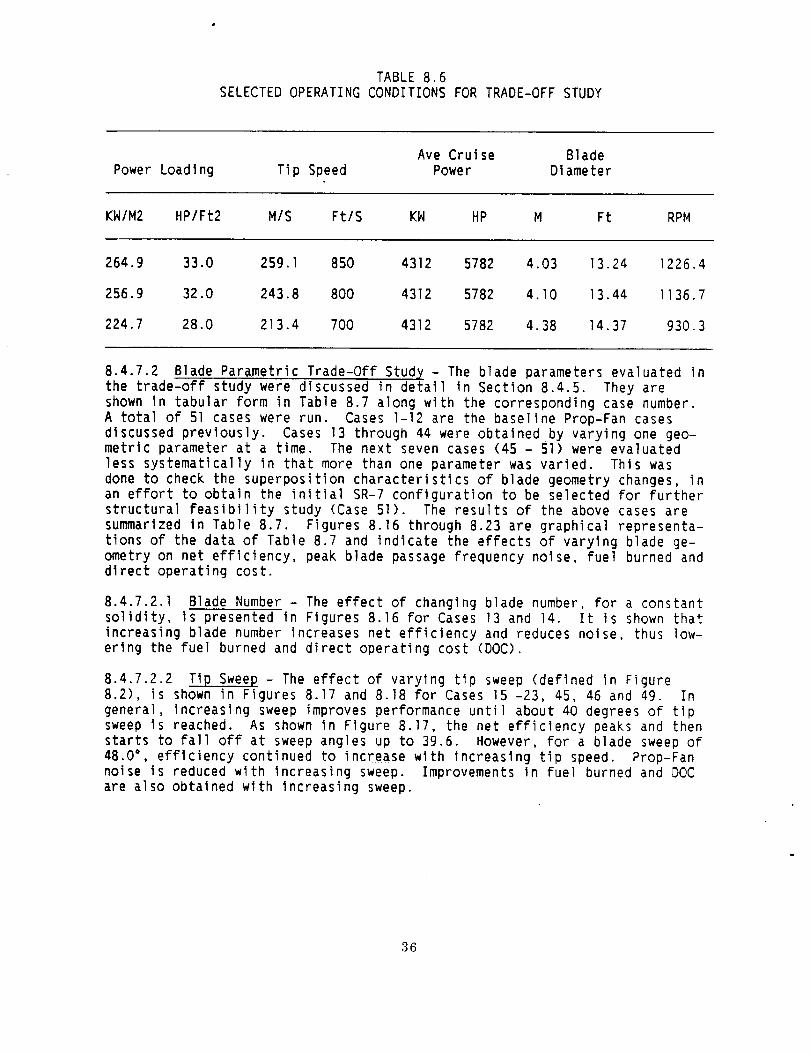
TABLE 8.6
SELECTED OPERATING CONDITIONS FOR TRADE-OFF STUDY
Power Loading
Ave Cruise Blade
Tip Speed Power Diameter
KW/M2 HP/Ft2 M/S Ft/S KW HP M Ft RPM
264.9 33.0 259.1 850 4312 5782 4.03 13.24 1226.4
256.9 32.0 243.8 800 4312 5782 4.10 13.44 1136.7
224.7 28.0 213.4 700 4312 5782 4.38 14.37 930.3
8.4.7.2 Blade Parametric Trade-Off Study - The blade parameters evaluated inthe trade-off study were discussed in detail In Section 8.4.5. They are
shown In tabular form in Table 8.7 along with the corresponding case number.A total of 51 cases were run. Cases 1-12 are the baseline Prop-Fan cases
discussed previously. Cases 13 through 44 were obtained by varying one geo-metric parameter at a time. The next seven cases (45 - 51) were evaluated
less systematically in that more than one parameter was varied. This was
done to check the superposition characteristics of blade geometry changes, inan effort to obtain the initial SR-7 configuration to be selected for furtherstructural feasibility study (Case 5]). The results of the above cases are
summarized in Table 8.7. Figures 8.16 through 8.23 are graphical representa-
tions of the data of Table 8.7 and indicate the effects of varying blade ge-ometry on net efficiency, peak blade passage frequency noise, fuel burned anddirect operating cost.
8.4.7.2.1 Blade Number - The effect of changing blade number, for a constantsolidity, is presented In Figures 8.16 for Cases 13 and 14. It is shown that
increasing blade number increases net efficiency and reduces no|se, thus low-ering the fuel burned and direct operating cost (DOC).
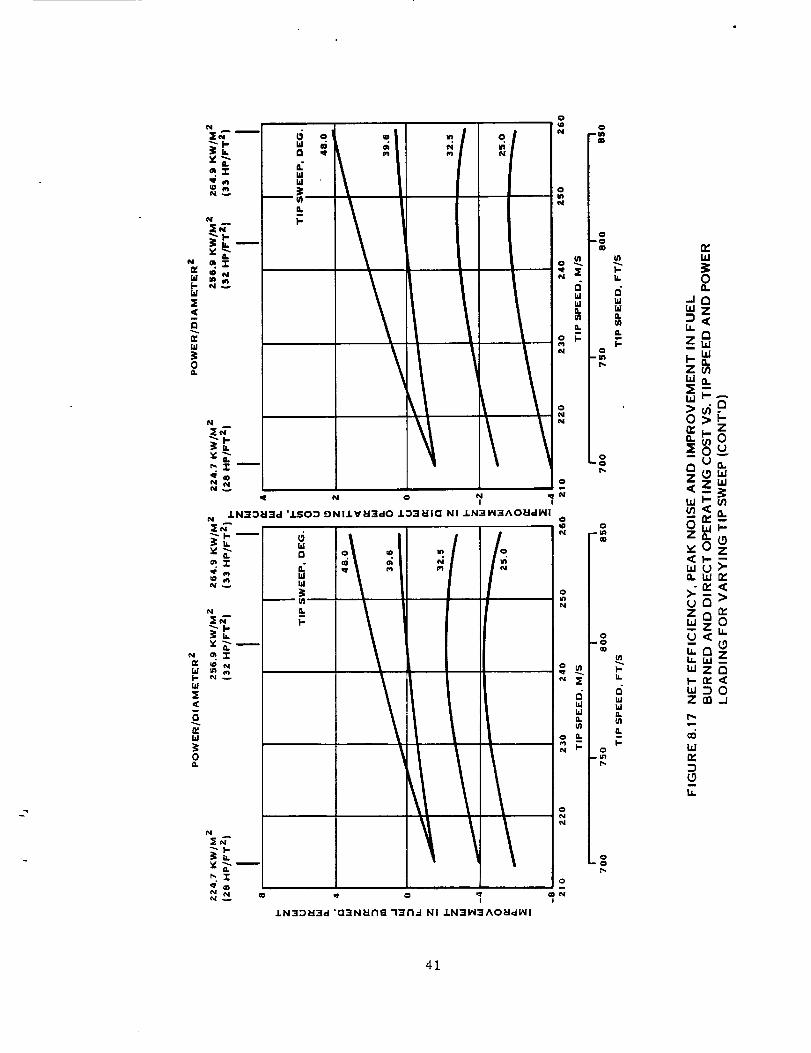
8.4.7.2.2 Tip Sweep - The effect of varying tip sweep (defined in Figure8.2), Is shown In Figures 8.17 and 8.18 for Cases 15 -23, 45, 46 and 49. In
general, increasing sweep improves performance until about 40 degrees of tip
sweep is reached. As shown in Figure 8.17, the net efficiency peaks and thenstarts to fall off at sweep angles up to 39.6. However, for a blade sweep of
48.0 °, efficiency continued to increase with Increasing tip speed. Prop-Fannoise is reduced with Increasing sweep. Improvements In fuel burned and DOCare also obtained with increasing sweep.
36

I---i
(/)l.dn,.)-
l--
IJ.
owrn
n,,I-
(DW-In_
1-
!i i"z_
_s
8
r_, N
_3
I IIIIII IIIIIIIIII III llllll I _I
I IIIIII I|1111_111 III IIIIII II II
3?

/
N,14p
0 W_P
UQ ' A_N3r!o_IlI_I--I 3e'JVSSYd :3(3Y"IH -- 3SION _lV3d
,O so _i' e¢
N_/. ,)l.3N3131 ..i.I 3 J.3N
a
Q<.Jm
o 0¢
01
_E3Z
N
WQ<.Jm
U.o 0m
Wm
Z
aLdZr_
m
.JbJ
Zm--<F-_I
wIj,.
w
--Z
Z>
Ldm_-oOUz_v,z
>.wuo-z oLdl--Ou_ W
t_m1,12
ii.
3_

#,4 O m _1) 'q
J.N':l:)t_13d 'JL,SO3 "3NI.LY_I3dO .L:_la NI J.N3Vi3AO_dHI
U)hi13<,,Jm
I,
=.o
Nila
2
Z
N
I/IU/
<..I111
o 0
L_fli
IE
Z
N 0
J.N3:)l!:13d 'Q3N_II'IE =13r'l_ NI .LN':IH3AO_IdHI
QuJZ_=.o_l.-mzjO
i4.1Z_-<I-,_izmbJ_IE ow
OUJi_111
--Z
Ou4Z><
I-
OuZ_vZ
z ow_
_ZZ<
ih
39

N
_Z
N
z_
o'rW "
X<
Q
0L
wI-LIIIE<
I1:111
0
N
N _ qm
N
L_Z
N
v_.m
N_
N
r,, Z
N _
O
o_4N
a.
-- I_i UI
w
N 0 m
8¢] 'A::)N3n_3Eh.4 3_OYSSYd :3(:]V'!8 - 3SION _lY3d
O
!'• , .
0 o 0
A :_N3 I:_ I..-1--13 .L"_N
N
L
0
_N
O
e_
o
o
I-
0U
(3ZI-<
W
0
U!,1
0z<
ul7
U.a.
z_-
zZUJ>=
>>
_o
_v_
r.._u.m
_ai_1--
40
N
r_Id
D-[d
<
rvW
30a.
f41
_v_JI-
W
<
r_bJ
0a.
o
e,,i
o_Z
N
_-r. 0
!
I-
.LN]::):q3d "a3N_IN_I "l-_n..-I NI .LN]I_I3AO_dI_41
W
F-
U_
0
_D
0-0
m
I--If.
IllIll
t_
I-
0,0
I-
W
W
I-
o
..]r_wZ
e_
ZmLdct
W
_.O z
ul_>"Q. Ld Q_
uJZe_I.,- _ <
WQ_
41

Inoinw
I
ZI _1
.I
m
SiG '_3N3NI_I_I.-I 3_VSSV -'13GY"I8 - _I$1ON _V3d
I
a.
1/!
0
0
0
w
,,:r N
hi W
b.a o0<-
3 ,JZ m
\wz
\ J•.,m WIn
<m
0_ I% I,,
A3N3131-1.-1:3 .L3N
I
Q.
a.
Nor-
O
o
I'-(/10U0Z
!--<
1.1.1
I-UW
z<Q
Z
,.J
I.- m
_<W_l>en
Ou_
--I.LI1_111
m_
U.
Z_.hlhl
U"'u.mu.a.
w-I--
h
_2

I11 I11mli. a
Id: "J zlz ® 31
_J
\
ql' N O
.LN3D_I3d'.LSOD _NI.LV_I=dO .L3_I_II(:I NI .LN:31N3AO_WI_II
N qI I
l.I
n
161
I-
0
I
b-
0U
Z
I--<r_w
F-UUJn_g
Z<
zo_
_Q
_'0zui v
F-mZWUlQIE<W ..J
Ou._0O.
zwm_
<<uj_
7__ Ld
h mLI. I_
I--
Z>
ei
Figure 8.18 presents net efflclency, noise, fuel burned and DOC, as a func-tion of tip sweep, at a power loading of 256.9 KN/M 2 (32 HP/FT 2) and a
tlp speed of 243.8 M/S (800 FT/S) for both an 8 and lO bladed Prop-Fan. As
shown in the flgure, an Improvement In both net efficiency and noise level is
evidenced as sweep Increases. Efficlency begins to peak beyond 40° and noiselevel continues to be suppressed. The flgure Indicates the fuel burned and
DOC peaking at 48° of sweep for the 10 bladed Prop-Fan, but not for 8 blades.
8.4.7.2.3 Thlckness Ratio - The next geometry parameter varied, Cases 24 -
29, Involved blade thickness ratio dlstrlbutlon, defined In Figure 8.3. Fig-ure 8.19 shows the effect of thickness ratlo on net efficlency and noise.
The major effect Is on performance, and Is caused by a combination of higher
profile losses and reduced choke margin with Increased thlckness ratio.Noise is affected only at the lower tip speeds. The figure shows the In-
crease In fuel burned and DOC at increased thickness ratios to be quite se-vere.
8.4.7.2.4 P1anform - Blade planform varlatlons, defined In Figure 8.4, in-clude Cases 31 - 36 of Table 8.7. Figure 8.20 shows that the effect of blade
planform on net efflclency and noise is hlghly dependent on tlp speed and
power loading. The narrow tip blade shows an improvement in performance atthe higher tlp speeds, and the wide tip blade Is better at lower tip speeds.
The wide shank blade shows an appreciable performance loss. The narrow tipblade results In lower noise over most of the tlp speed range. The Figure
shows the narrow tip planform to be the best planform for most tip speeds interms of reduced Fuel burned and DOC.
8.4.7.2.5 Design Life Coefficient - The blade design lift coefficient dis-tributions studies are shown In Figure 8.5 and include Cases 37 - 39 of Table
8.7. In Figure 8.21 the net efficiency and noise are plotted as a function
of integrated design lift coefficient, CLI.
The curve shows that the basellne CLD distribution Is best for performance;
whereas noise improves as CLI decreases. Shifting the peak design CL in-
board (Case 39) lowers efficiency and raises noise. The figure shows thatvery little Improvement in fuel burned or direct operating cost is attainable
by reducing the CLi below that of the baseline blade. However, ralsing the
integrated design CL, results in progresslvely increased losses.
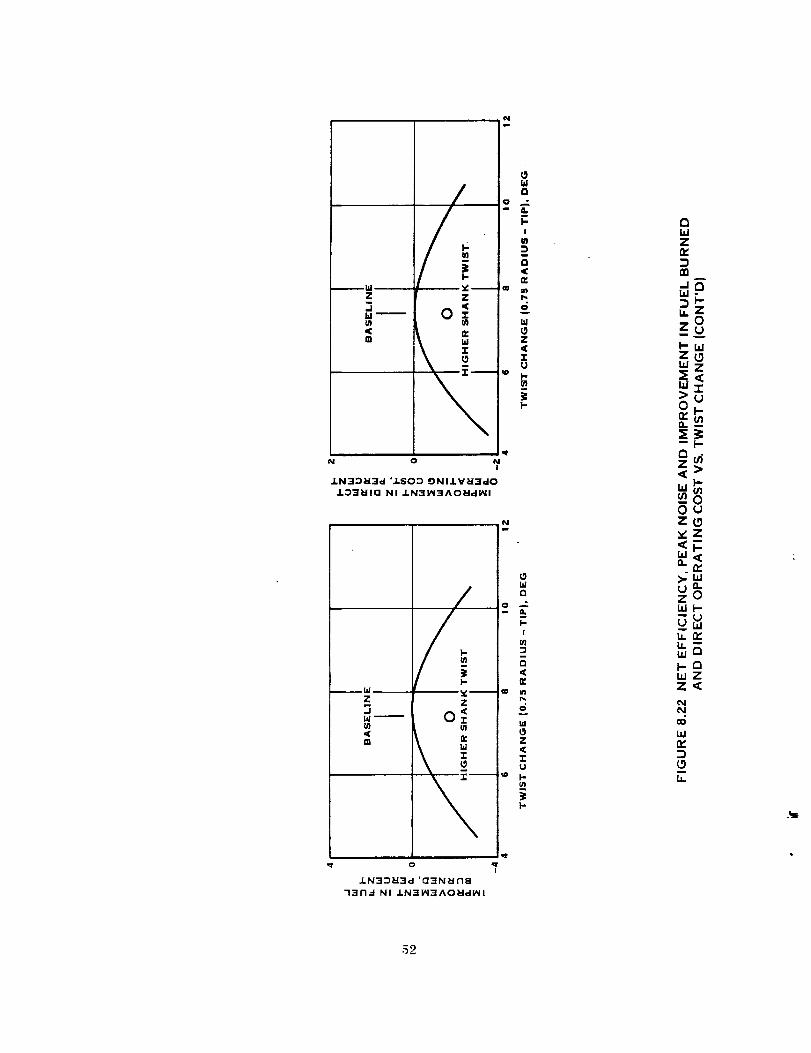
8.4.7.2.6 Twist - The blade twist distributions studies are shown in Figure8.6 and include three twist changes in the outer 25% of the blade and one in-
board retwist. The twist change plotted in Figure 8.22 includes Cases 40 -
42. The twist change between the .75 radius and the tip is shown as the ab-scissa of the figure. It is noted in the figure that the baseline twist
yields peak efficiency. The higher shank twist (Case 42) unloads the bladetip similar to the hlgh twist (Case 41), which has a lower tip blade angle.
Both cases show a large reduction in net efficiency. In contrast, unloadlng
the blade tip is beneficial in lowering the noise level. In the figure, itIs seen that efficiency and not noise is the driver, since improvement in
fuel burned and DOC peak at the baseline blade twist.
:[4
N
mv_.a.Z
N
U_
n' =b'r
Nv
<(2
n,;a
0a.
N
N v
N
N
N
:s_"
n, _-r
W v
<
Qre
0_L
N
N_
w
1
F-I
N 0
8Q 'A3N3rI,I_3_I.-I 3'OYSSVd "_QY"I8
:3SI ON :N V_ld
U)U)
uO- < m
I.- !- I-.
"t-
r,,, r,_
A:_N31:_1.'1.'13 /3N
O
O.
o
F--
0U
Z
<
un
0
U_Jn,
Z<0
Zn,n,
m W
w__U
ZI.-
i-0
ul<
0
_u.
e_7
<
-- .J
<0LLI_
_zI.)<
__,,,
1--u_ui
LI.

N
n,
Ld
I-
W
:E<Qr_
0a.
N
r_
Ldj..
lal
:E<
L_
0
N
N v
N
t'¢ v
mv_.r,,:Z
N
N
"I-
N
N
0.
N
N
r_-r
N N
VJ
wO
u,,,:z
<w
I-
i!
m
!-
I
owN
O.(/1
o
N_T
0
-g
dW
Id
p,.
P_
I-
W
W{1.U)
O.
0 I-
_6

N
,,=,
N
w
<
r_bJ
0n
e_wLOz_Z
mO_j-J
D_j
zo
Z zw
W_
elI_ __
l:lui
<I-
u_
vZ 0
o.
ul I,- Z
<u._>
U_7@7<:1,
e,l
4?
_N
a-r
N
N
"_" I..
N o.Zn, ;D N
laX<i
a
e_W
N
XN
m_.Z
N NN
0
z/ L
.Iw
0
N!
.LN'4_i3dl '.LSO::) _NIJ.V_:3dO .L33_IG NI J.N_IIN3AO_dlNI
N
N
r_
i-
W
N
m"r
N v
N
r,,,r
p rg.
_, i_I-.
I0
Z -.1
Z<
a
.LN=IDt!:i_Id 'C]'qNII:II'IG "l]rt_-I N! .LN3V/'=IAO_dI_II
o
N
0
0
0
l-b.
6bl
a.t_
iI-
l-
W
W
I-
Q_b,IzZ_Q
mO_1.-I
b.ll_
I-QZ_Z2<
OU_z_,¢z 0
_- <
Wf--7
W13_,
ulz0
i
b.
-_8
IiiZ
.J
w<
f
,(illG.
biI-,
o
80 'ADN3n_I_.-I '=I_VSSYd ":lOy'18 - 3$1ON _lV3d
_O
_o
/z- <
_m uO.
_--m-- I-_6
o
0• • .
0 o o
J_DN313t-I--13 J.3N
0
mN
Ol-Z111
U
Ii.Ii.W
Ol-Ii.
-I
z
ILl
cia
1,=<I11
Igi,=Z
coN
0
I'-
0U
zw
I-<
Wd,l0I'-UW
QZ<
QhiZW
--Ihi
h
Z
l--Z14.1
IEhi I->ZO_II:--
--hQ_JzO<cJhll--(/1 h
0-_ZZ
14.114.1
>.-_L) 1.1JZt-hi<
W
u-I-u_Z
Z>
LU
49
mN
z <
m a.
a
I..ik
z_n
I,-ZW
U
IkIkhi
:8It.
J
Z
hi
Q
I--
III
[,
Z
N O NOI
.LN]3_i_Id '.,LSO3 eJNl.,LV_'-IrdO
J.33_lla NI .LN31N3AO_dV, ii
@N
/Z- ,:1:
< a
I-If.
=
.LN3_13d 'a3N_lne -1:3n.-i NI.LN31_13 ^O_diAII
to
,To
o I.-Zw
U
i,u.I,/J0U
I-lk
-I
ZO
WQQWI-<rvO
I-
_z
5o
I-
oU
_Z
<n,14JEl.o
U1,1
Q
0Z,<r_ILlZn,
W.J
Zr_
>Z0,-
:E,,
C_"'z0<uLIJI--
0"ZZv(.O<ulI,Ihl
U_Z _-bJ<
n,
L6LIJ
wZI'-
7>
h

/
i_ i-_
SB(:] ',L:lN3n_'=lt:l.-I ]gVSSYd _l(3V'lll- 3SION )lV3d
/
,,,_ 0 2
m
X ._N 3131 ..-1..-13 J.3N
N
E
<>
_oUZ_
_9. vZ<-wl--o.<
.n,>-I_
_ 7"a 0_ WF..
-_. ___ b-iZ
< WZ
1-
.51
Z
.Ild
<#1
LIw/ °
o -"
0","
\° °¢ ¢1
ZZ <
ZU
I-
N 0ql'
i
.l.N]_)]"13d '.l.SO:) ='JNILV;B3dO
.l,::)3_ila Ni .i.N'_Ii_31AO_IdiNI
N
Z
..IW_In<m
Z
o
,.0
o
-I_11"1--I NI IN':I_I3AO_¢=Ii_I
I
52
Idn
=.
1-
!
mn<r_
inr_
w0Z<ZU
I--(n
I-.
bJZn,,
m
l,LI-
_Zo
_zgI-'w
ZIE<uJ_
0__
--I--
Q_Z><
I-wm---oouZ_
>.W
z 0_.il--m
w_
I..-_u.lZZ'¢
0O
bJ
n.,
[.6
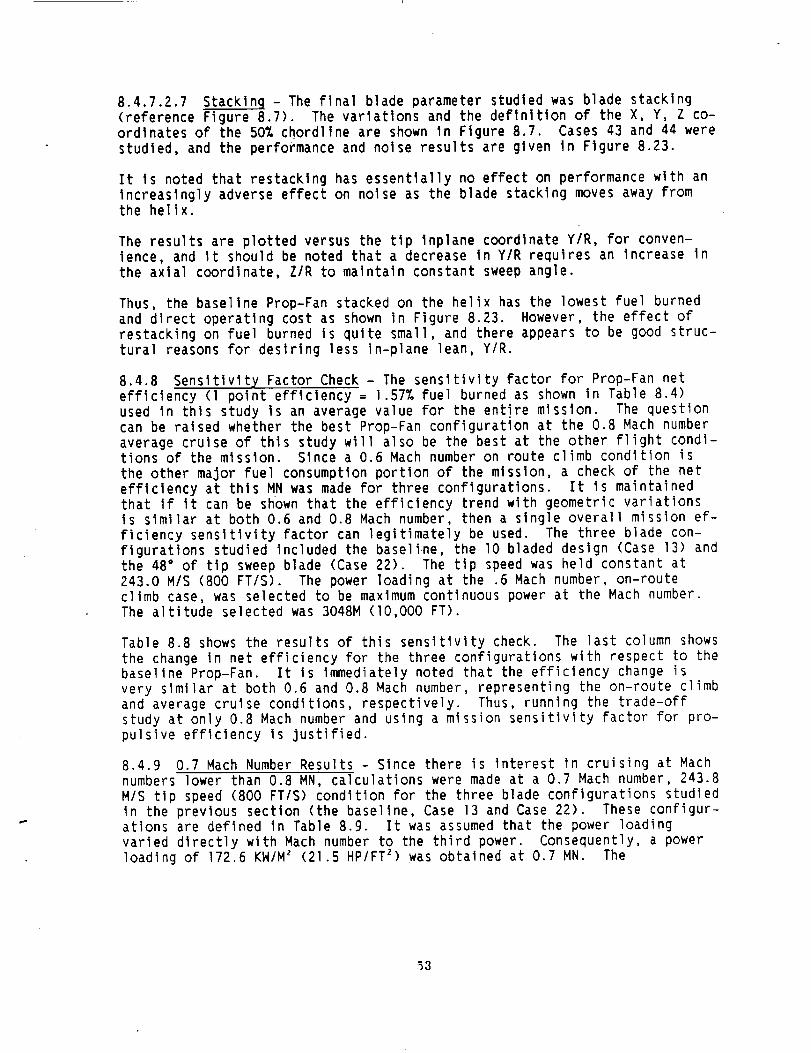
8.4.7.2.7 Stacklnl - The flnal blade parameter studied was blade stacking
(reference Figure 8.7). The variations and the deflnltion of the X, Y, Z co-ordinates of the 50% chordllne are shown in Figure 8.7. Cases 43 and 44 were
studied, and the performance and noise results are given in Figure 8.23.
It is noted that restacklng has essentially no effect on performance with an
increasingly adverse effect on noise as the blade stacking moves away fromthe helix.
The results are plotted versus the tip Inplane coordinate Y/R, for conven-lence, and It should be noted that a decrease in Y/R requlres an increase in
the axial coordinate, Z/R to malntaln constant sweep angle.
Thus, the basellne Prop-Fan stacked on the helix has the lowest Fuel burned
and dlrect operating cost as shown in Figure 8.23. However, the effect of
restacking on Fuel burned is quite small, and there appears to be good struc-tural reasons for desiring less In-plane lean, Y/R.
8.4.8 Sensitivity Factor Check - The sensitivity factor for Prop-Fan netefflclency (I point efficiency = 1.57% fuel burned as shown in Table 8.4)
used in thls study Is an average value for the entire mlssion. The questioncan be raised whether the best Prop-Fan configuration at the 0.8 Mach number
average crulse of this study wi11 also be the best at the other flight condi-tions of the mission. Since a 0.6 Mach number on route climb condition is
the other major fuel consumption portion of the mission, a check of the net
efflclency at thls MN was made for three conflguratlons. It is maintainedthat if it can be shown that the efficiency trend with geometric variatlonsis slmilar at both 0.6 and 0.8 Mach number, then a slngle overall mission ef-
ficlency sensltivity factor can legitimately be used. The three blade con-figuratlons studied Included the baseli.ne, the lO bladed design (Case 13) and
the 48° of tip sweep blade (Case 22). The tip speed was held constant at243.0 M/S (800 FT/S). The power loading at the .6 Mach number, on-routeclimb case, was selected to be maximum continuous power at the Mach number.
The altitude selected was 3048M (lO,O00 FT).
Table 8.8 shows the results of this sensitivity check. The last column shows
the change In net efflciency for the three configurations with respect to the
baseline Prop-Fan. It Is immediately noted that the efficiency change isvery slmilar at both 0.6 and 0.8 Mach number, representing the on-route climb
and average cruise conditions, respectively. Thus, running the trade-offstudy at only 0.8 Mach number and using a mlssion sensitlvity factor for pro-
pulsive efficiency is Justified.
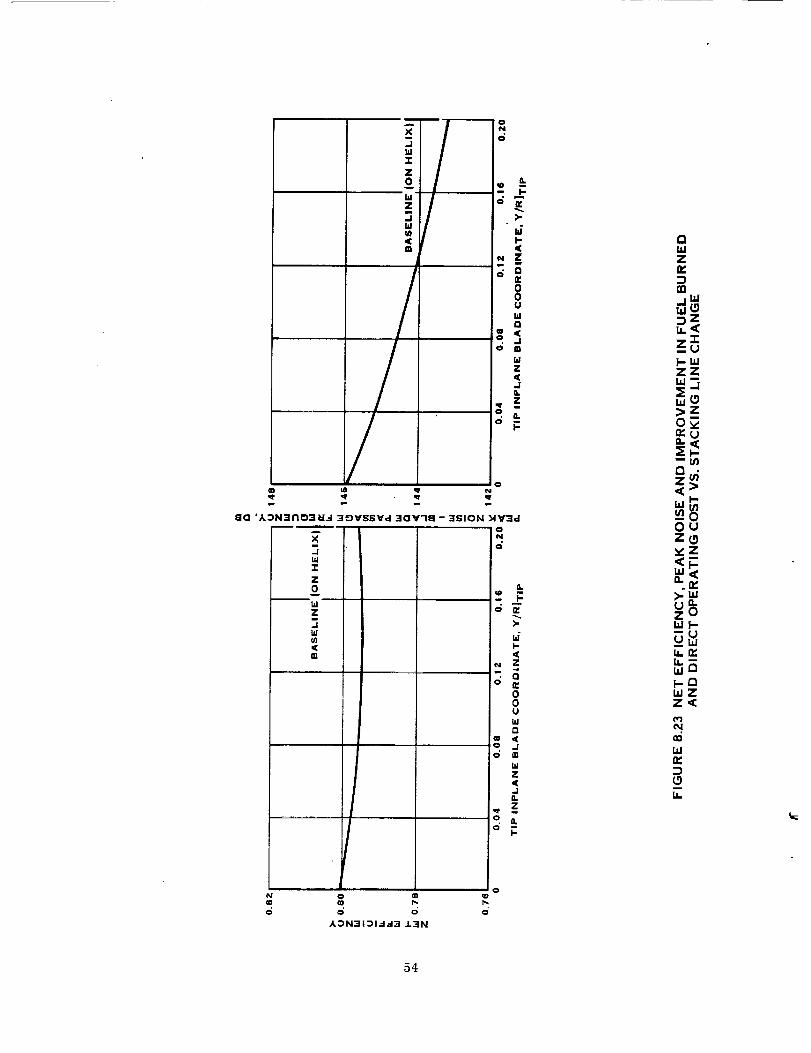
8.4.9 0.7 Mach Number Results - Since there Is interest in cruising at Mach
numbers lower than 0.8 MN, calculations were made at a 0.7 Mach number, 243.8
M/S tip speed (800 FT/S) condition for the three blade configurations studiedin the previous section (the baseline, Case 13 and Case 22). These configur-atlons are defined in Table 8.9. It was assumed that the power loading
varied directly with Mach number to the third power. Consequently, a power
loading of 172.6 KW/M z (21.5 HP/FT 2) was obtained at 0.7 MN. The
_3
O
O
O
a.
I-r_>-
. z
00(JW
0
W
Ld
Z
<
.JQ.
z
a.
k-
m
/O
,q
OtO %, N
,r
8(2 'A:_N:3n_3_.4 ]_VSSVd :3(:]Y'lg - 3_;ION _lY--Jd
N
O
r_ F.
O O
L
).
I-
<
N Z- Q
00
0
Z
<
.JL
z
O i!-
.J
"r
Z
0
_J
Zm.J
W(/1
<
m
o
,_N_ I _1 .d.d_ .].':IN
uJZn,
m_lww__Zu.<Z-r"
I- la,IZZ
w_
Z
OIJZ(3_'Z<p
>.l.U
z ol.d I,-
_14J
14.1I'QI.UZZ'<
(,r3
oo
i.U
n..
(3
14=
54

i.JwZ
Z
Zi.J_dw<m
@ _ N 0 N
.LN3_U3d 'J.gO:) ONI.LV_3clO .L:_3_IIQ NI .I.N_I_I3AOUdlNI
X
td
Z0
w
.LN:3;)_I_d 'Q_N_I'II3 "131"1..-1NI .I.N31_I]IAOUdi_II
O
N
O
O
O
O
O
o
o
o
O
oq,
LI-
>-
i-<Z
QQ:00uwQ<_1mIdZ<.IL_zeL
I"
it
>-
1"<Z
00U
WI:1
Z<,J0.Z
I-
wI-ZZ_0_u
..1 IIJuJ__z
z_"
zz,,,._
>zO_
_.<
e_4Z><
-oOOz_
._,,z<;
>,w
zOull,-
,.g
_zz<
eq

I-..I
l.s.l
Uw"I"
0I-.
e,
7-I-
I-
Zh.l
Z0i
h.l..I
I--
"-_! ! !- ! !.
"" i
]
i ii =-
i
-'_i_,
.._-.-_.-----...
q, I I "3. I ,-_ I
56
!iix_
"lEs
| _ _ ; il II I1
o I o o i
i ii-=12_i
° 1W _
1_1 I; =
Z | i
<IE
*iIll =,J
iii i_;_i "x_
.ii : _ : _ :
"-iii,i il z
- t I _ I _ I

0.7 Mach number efficlencies and nolse levels are shown in the table. At 0.7Mach number, the net efficlency Is higher and the noise levels are lower forall three blade configuratlons. In computing the change In fuel burned andDOC, it was assumed that the alrcraft sensitivity factors at M = 0.8 were ap-plicable at 0.7, It was also assumed that the acoustic treatment was sizedat 0.8 Mach number. Thus, the fuel burned and DOC are only effected byProp-Fan net efflciency. Based on these assumptions, it is'noted that a 0.7Mach number cruise reduces the fuel burned by 2.4 to 3.3%, depending on theconfiguration.
5_

8.5 DESIGN REQUIREMENTS
8.5.1 Introduction
In Task I of this study (reference Sectlon 3.0, Volume I), the design
requirements for the structural deslgn analysis to be conducted under TaskIII (reference Section 5.0, Volume I) were established.
8.s.2 Object
The object of thls task Is to reassess the design requirements established in
Task I and change them as necessary to cover the SR-7 Prop-Fan for use In
proposed wind tunnel and fllght tests and reflect any new Knowledge gainedslnce the flrst requirements were deflned.
8.5.3 Method
The studies being conducted under NASA contracts NAS3-22346 and NAS3-22347 by
Lockheed and McDonnell Douglas, and the effort conducted under Task III ofthls contract were reviewed. Based on these revlews, a new Deslgn Require-
ments Document was prepared and is included in Appendix D. A description of
the design methods used is also included.
The major differences between the old and new documents-is the incorporatlonof the latest flutter calculation method, and the design requirements and
goals for the SR-7.
8.6 DESIGN SELECTION
In general, the results of the trade-off study show that a high number of
very thin highly swept blades gives the optimum design from a fuel burn/DOCstandpoint. However, the results of Task III and other studies have shown
that it is not possible to structurally design this type of blade usingstate-of-the-art materials and manufacturing processes.
Therefore, the Prop-Fan selected for the initial structural analysis has
eight blades and is moderately swept. The selected Prop-Fan is defined inTable 8.10. When compared to the baseline blade, thls configuration yields a
fuel burn loss of I/2 percent (reference Table 8.7, configuration 51).
8.7 DESIGN SELECTION DOCUMENT
A design selection document was prepared and Is Included in Appendix E.
59

TABLE 8.10PARAMETERS OF SELECTED PROP-FAN
Testbed Production
Mach Number (at 35,000 Feet)
Number of Blades
Tip Speed (feet/second)
Power Loading (SHP/D _)
Tip Diameter (feet)
Chord Ratio
Thickness Ratio
Twist Angle
Camber Angle
Cone Angle
Design Lift CoefFicient
Sweep Angle
Sweep Coordinates
Fabrication Concept
0.8 0.8
8 8
800 800
32 32
9.0 14.0
See Figure 8.24
See Figure 8.24
See Figure 8.24
See Figure 8.24
See Figure 8.24
See Figure 8.24
See Figure 8.24
See Figure 8.24
•Solid Aluminum -Hollow Steel
Spar Spar
•Fiberglass Shell ,Fiberglass Shell•Nickel Sheath .Titanium Sheath
•Foam Fill -Honeycomb Fill
and
•Solid Aluminum
Spar
•Fiberglass Shell•Nlckel Sheath
•Foam Fi]l
60
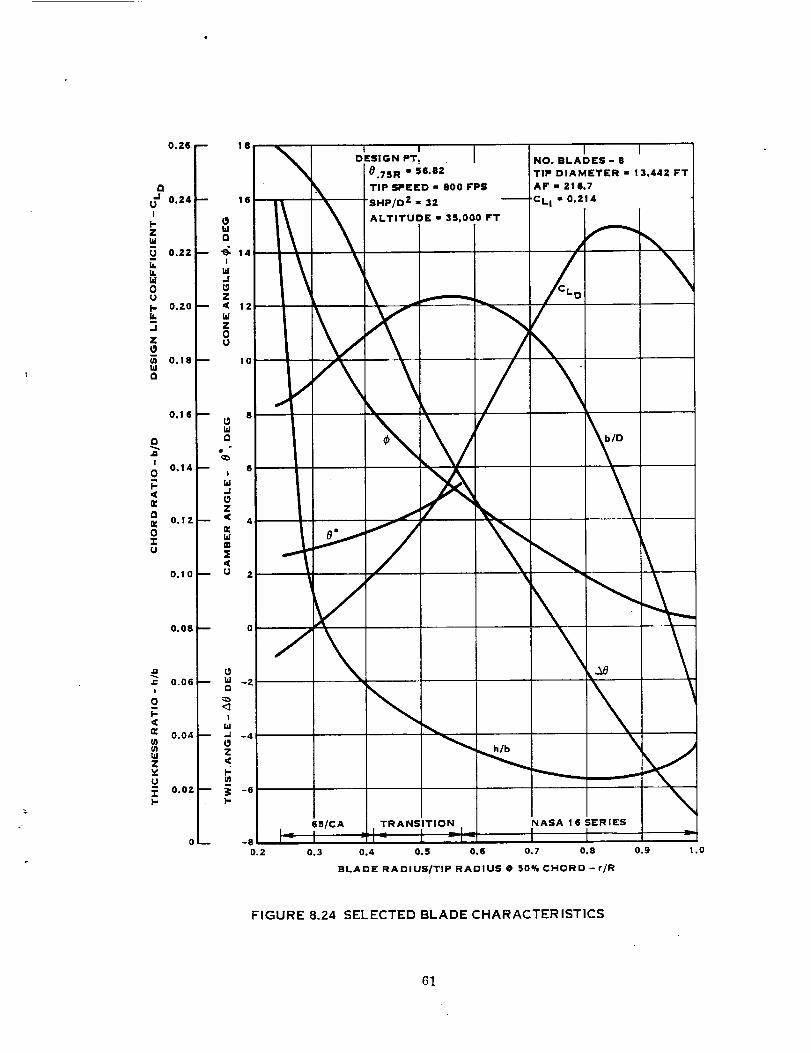
£3
I
l-ZILl
11,Ii,
0ui-lk
.1
Z(3
Illa
0
,12
I
0I
]-<r_£3r_0"rU
_.=!
0
I-<rev)vlwZ
U
"rI-
0.26
0.24
0.2Z
0.Z0
0.18
0.16
0.14
0.12
0.10
0.08
0.06
0.04
0.0Z
\
!o
8
\
-80.2
I INO. BLADES - 8
TIP DIAMETER " 13.442 FT
AF - 21 6.7
'CLI ,, 0.214
i6S/CA TRANSITION NASA 10 SERIES
I :'- ' -'- ' [l-- L --L-- I
0.3 0.4 0.5 0.6 0.7 0.8
BLADE: RADIUS/TIP RADIUS @ 50% CHORD-r/R
\
0.9 1.0
FIGURE 8.24 SELECTED BLADE CHARACTERISTICS

48 B
44 m
40 --
36
32_
28 m
241_
I,iG
<_20I
w.I
Z< 16_
ta
8_
4
0
1.2 w
1.1 -_"
!.0--
0.gm
0.8
0.7
0.6
0.5
N
0.4
0.3_
O_
-0.1 _
-0.2 --
-0.3
0.24
0.22
0.20
0.18
-- 0.16
-- 0.14
-- 0.12:
m r_ 0.I
N
E
_ >" 0.0
TIP SPEED = 800 FPS
SHPID2 - 32
ALTITUDE = 35,000 FT
0.7!_ R t 56.82o
SWEEPLINE COORDINATES
///
f Q/_Z/
//R
/, /*0.06 / R
0.04
0.02 /
-O.0Z
/x,. -;/-0.04 / _, .....
/-0.06
0.2 0,3 0.4 0.5 0.6 0.7 0.8 0,9
r/R
1.0
FIGURE 8.24 SELECTED BLADE CHARACTERISTICS (CONT'D)
62
9.0 TASK VII - DESIGN ANALYSIS
9.1 AERODYNAMIC EXCITAT.ION ANALYSIS
9.1.1 Introduction
A propeller aerodynamic excitation sensitivity study was performed on fivecandidate Prop-Fan test bed aircraft. These aircraft were the Gulfstream II,KC-135A, C-141, DC-9, and the B-52B. Aerodynamic excitations were also cal-
culated for a representative Prop-Fan alrcraft. The representative Prop-Fan
aircraft was speclfically designed wlth a Prop-Fan propulsion system based on
the requirements set forth in Table 9.1.
In performing the sensitivity study, effects on aerodynamic excitations for
variations of the following parameters were considered: Prop-Fan axis angu-lar orientation wlth aircraft (nacelle downtllt, and toe-ln), Prop-Fan posi-
tion relative to the wing, wing sweep, directlon of Prop-Fan rotation, and
Prop-Fan diameter. The effects of fuselage size, and nacelle slze were not
investigated. The aerodynamic excitation results from this study wl]l beused to assess how similar the aerodynamic excitations on a testbed aircraftinstallation would be to an aircraft designed for Prop-Fan propulsion.
Theory shows that the aerodynamic excitation of propeller blades due to theaircraft characterlstlcs and operating conditlons are related to the angular-
ity of the flow into the propeller, A or 9, and the alrcraft operationdynamic pressure, q , I/2(pV2). A list of symbols is provided inTable 9.2. Because of this, it is common practice to define the aircraft
flow field vibratory 1oadlng on the propeller either In terms of aerodynamicexcitation Aq or In terms of excitation factor, EF, which Is related to Aq by
the relationship Aq : 409EF. In this study, the aerodynamlc excltatlon of
the Prop-Fan Is being defined in terms of Excitation Factor, EF.
9.1.2 Summary of Results
The total contribution of the higher orders for all the candldate aircraft
other than the Prop-Fan Aircraft defined in Table 9.1, varied from II to 23%of the total EFQ. This is compared to a 37.5% contribution of the higher
orders for the Prop-Fan alrcraft. There are representative Prop-Fan instal-lations that have lower riP's, as have been reported _n previous NASA stud-
les. Specifically, EF evaluations in support of NASA, contract NAS2-10178,performed for Douglas Aircraft indicated small nP contributions for overwing
nacelle type Installations, similar to the testbeds reported on here.
The five candidate aircraft exhibited similar sensitlvity trends for each of
the geometric parameters evaluated.
Of all the parameters evaluated, EFQ is sensitive to nacelle downtilt (high
and low speeds), axial position (high and low speeds), and nacelle vertical
displacement (only high speeds).
63
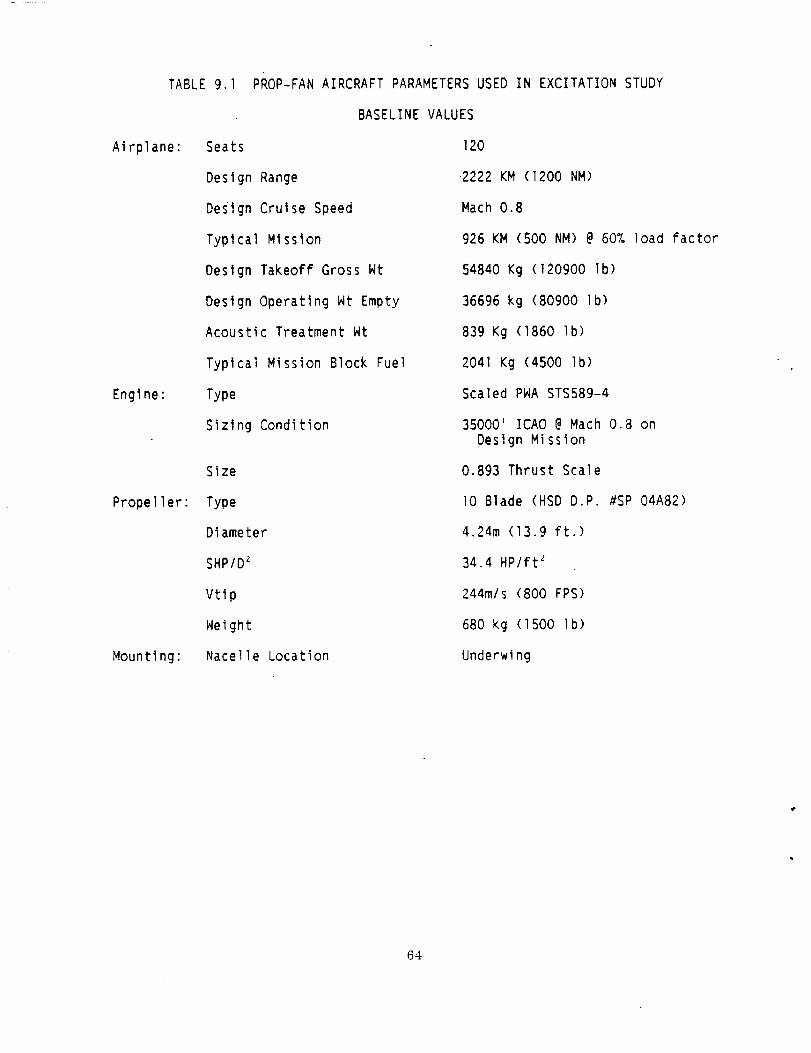
TABLE9.1
Airplane:
Engine:
Propeller:
Mounting:
PROP-FANAIRCRAFTPARAMETERSUSEDIN EXCITATIONSTUDY
BASELINEVALUES
Seats
Design Range
Design Cruise Speed
Typical Mission
Design Takeoff Gross Wt
Deslgn Operating Wt Empty
Acoustic Treatment Wt
Typical Mission Block Fuel
Type
Sizing Condition
Size
Type
Diameter
SHP/D2
Vtlp
Neight
Nacelle Location
120
2222 KM (1200 NM)
Mach 0.8
926 KM (500 NM) @ 60% load factor
54840 Kg (120900 Ib)
36696 kg (80900 Ib)
839 Kg (1860 Ib)
2041Kg (4500 Ib)
Scaled PWA STS589-4
35000' ICAO @Mach 0.8 onDesign Misslon
0,893 Thrust Scale
lO Blade (HSD D.P. #SP 04A82)
4.24m (13.9 ft.)
34.4 HP/ft _
244m/s (800 FPS)
680 kg (1500 Ib)
Underwlng
64

A
D
EFo
N
n-P
P1
P2
P3
P4
P5
V_As
WLE
WM
_A
_R
_T
aEFQ
TABLE 9.2. LIST OF SYMBOLS
Vertical location of Prop-Fan centerline with respect to wing zero
lift line, positive when Prop-Fan above wing, m.
Prop-Fan Diameter, m.
Excitation Factor (VE_slI79) _, degrees
Direction of Propeller Rotation, positive when blades nearest fuse-lage are going up.
nth order response of blade
Ist order Fourier Coefficients of blade shank bending
2nd order Fourier Coefflclents of blade shank bending
3rd order Fourier Coefficlents of blade shank bending
4th order Fourier Coefficients of blade shank bending
5th order Fourier Coefficients of blade shank bending
Velocity, equivalent airspeed, m/s.
Distance from Prop-Fan plane of rotation to wing leading edge
In dlrectlon of fuselage centerline, position Prop-Fan ahead of wingleadlng edge, m.
Average Inflow angle with respect to Prop-Fan centerline, positivewhen flow Is coming from below, degrees
Inflow angle of advancing blade at 75% radius, deg.
Nacelle downtilt angle from wing zero lift line, positive nose down,
deg.
Inflow angle of retreating blade at 75% radius, deg.
Nacelle toeln angle from fuselage centerline, deg.
Change in Equivalent Excitation Factor from Baseline Aircraft Valueof EFQ. Positive value implies Increase In EFQ.
[EFQ - EFQ (Baseline)].
65
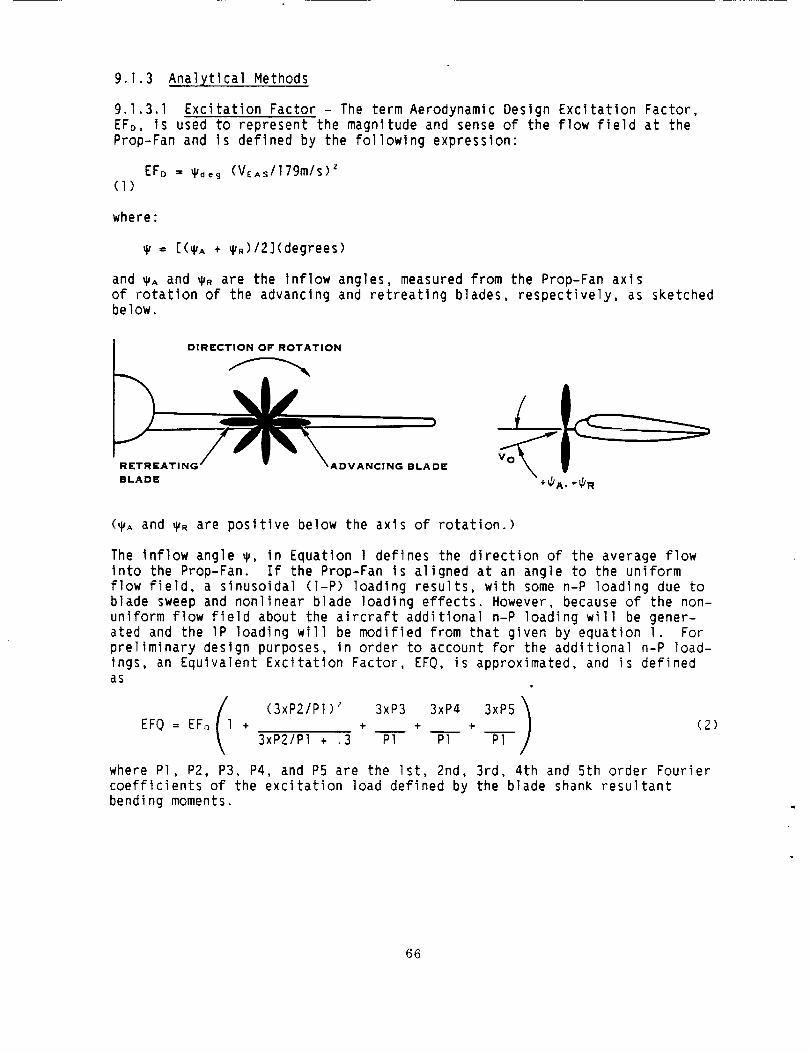
9.l.3 Analytlcal Methods
9.1.3.1 Excitatlon Factor - The term Aerodynamic Design Excitation Factor,
EFD, is used to represent the magnitude and sense of the flow field at the
Prop-Fan and is defined by the fo]lowlng expression"
EFD = gdeg (V_sl17gmls) z(I)
where:
= [(_A + _R)12](degrees)
and _A and _R are the inflow angles, measured from the Prop-Fan axls
of rotatlon of the advancing and retreating blades, respectively, as sketchedbelow.
DIRECTION OF ROTATION
RETREATING
BLADE
I,DVANClNG BLADE
/
+_/A,
J
_R
(gA and _R are positive below the axis of rotation.)
The inflow angle _, In Equation I defines the direction of the average flowinto the Prop-Fan. If the Prop-Fan is aligned at an angle to the uniform
flow field, a slnusoidal (l-P) loadlng results, with some n-P loading due toblade sweep and nonlinear blade loading effects. However, because of the non-
uniform flow field about the aircraft additional n-P loading will be gener-
ated and the IP loading will be modified from that given by equation I. Forpreliminary deslgn purposes, in order to account for the additional n-P Ioad-Ings, an Equivalent Excitation Factor, EFQ, is approximated, and is definedas
EFQ = EFo l + + + + (2)3xP2/PI + .3 _ PT
where PI, P2, P3, P4, and P5 are the Ist, 2nd, 3rd, 4th and 5th order Fouriercoefficients of the excitation load defined by the blade shank resultantbending moments.
66

Normally, the increase In EF due to higher n-P Ioadings Is between 10 and25%; however, for cases where the IP level approaches zero resultlng In lower
EFQ values, the higher order excitations contribute a larger percentage of
the tota] EFQ.
For normal aircraft operation, the maximum Excltatlon Factor occurs at one or
both of the following aircraft operating condltlons:
a° Maximum aircraft gross weight, and minimum aircraft speed without
flaps.
b. Minimum aircraft gross weight, and maximum aircraft speed.
9.1.3.2 Flow-Field Calculation - The flow-field at the plane of the Prop-Fan
due to the presence of the aircraft for a given altitude is calculated using
an incompressible - Invlscid potential flow computer program developed atHamilton Standard. Thls program computes the flow-fleld about individual
aircraft components separately and uses the superposltion principle to com-bine these flow-fields to obtain the total flow-field. The fuselage and na-
celle are treated as axisymmetric Ranklne bodies, while the wing is analyzedas a swept lifting llne. The velocity perturbations due to axial flow and
cross flow are considered on all alrcraft components, (wing, nacelle and
fuselage). The program also accounts for the effects of the propeller slip-stream and swirl on the aircraft and, therefore, flow-field. The influence
of the tail surfaces has been found to be negligible. Consequently, these
surfaces were not considered In the calculations for wlng mounted Prop-Fans.
Thls flow-fleld calculation requires s1gniflcantly less information about the
aircraft geometry than do other more elaborate methods, such as the wellknown Hess Code. Computer costs are also signiflcantly less for this proce-dure than for the more elaborate panel methods. An extenslve comparison of
this aircraft flow field program with the Hess code method revealed reason-
able agreement: see reference 25. This flow field program has been used forseveral decades at Hamilton Standard for accurately predicting propeller
deslgn loads.
9.1.3.3 Aerodynamic Loads - The Prop-Fan aerodynamlc loads are calculated in
the presence of the aircraft flow field. These loads are Fourier analyzed toobtaIn the harmonic components of the loads, which are used to calculate the
Equivalent Excitation Factor, (EFQ; equation 2). The ]P loads are based onthe difference between those for the advancing and retreating blades.
The aerodynamic spanwlse loadlngs of the Prop-Fan blades are calculated at a
series of azimuthal positions as the Prop-Fan makes one revolution. Thesecalculatlons are made using a form of the Go]dstein-Locke propeller vortex
analysis of reference 26, with the assumption of quasl-steady aerodynamics.
67

9.].4 Model Descriptions
All aircraft examined were configured with a 2.74 meter (9 ft.) diameter
Prop-Fan, except for the representative Prop-Fan aircraft whlch had a 4.24meter (13.9 ft) diameter Prop-Fan. Figures 9.1 - 9.6 are schematic represen-
tatlons of the Prop-Fan Aircraft, B-52B, C-141, DC-9, GS-II, and KC-I35A air-
craft respectively, with a Prop-Fan installation. The figures were drawn tothe same scale so that the differences between them are readily apparent.
As shown in Figure 9.], the Prop-Fan aircraft installation is a low wing de-
sign with about 34° of leading edge wing sweep. The nacelle is locatedslightly below the wlng, about I wing chord ahead of the wing, and about 1.8
Prop-Fan diameters from the fuselage centerline (.8 diameter clearance). TheB-52B configuration in Figure 9.2 has the nacelle below the high wing at I/2
of a wing chord upstream of the wing leading edge and 2 Prop-Fan dlameters
from the fuselage centerline. The C-141 aircraft installation, see Figure9.3, is an over-the-wlng design, with the Prop-Fan less than half a wing
chord ahead of the wing leading edge, and ]-I/2 Prop-Fan diameters from thefuselage centerIine. Figure 9.4 shows the DC-9 aircraft installation with
the Prop-Fan slightly above the wing at about a wing chord ahead of it's
leading edge, and 2 Prop-Fan diameters from the fuselage centerline. TheDC-9 installation is very similar to that of the Prop-Fan aircraft, except
that the nacelle is above the wing. Figure 9.5 shows the Gulfstream II air-craft with the Prop-Fan slightly above the wing at about 2/3 of a wing chord
ahead of its leading edge and l I/2 Prop-Fan diameters from the fuselage cen-terllne. Like the B-52 and the Cl41, the KC-135A has a large wing chord, and
as shown in Figure 9.6, the Prop-Fan is mounted at less than I/2 of a wingchord ahead of its leading edge, and 2 diameters from the fuselage centerllne.
For the baseline version of each aircraft, the nacelle toe-in was assumed tobe zero and the nacelle downtilt was selected to obtain reasonable excitation
Factors.
Table 9.3 gives the pertinent baseline geometric parameters, as defined in
Figure 9.7, for the six aircraft studied.
9.1.5 Analysis Procedure
The Equivalent Excitation Factor <EFQ) was calculated, and an EFQ diagram was
generated, for the baseline configuration of each of the five candidate test-bed alrcraft and the Prop-Fan aircraft at the four alrcraft operating condi-
tions listed in Table 9.4. With these diagrams, EFQ can now be determined
For any velocity and gross weight by a simple cross plot. The sensitivity ofthe EFQ to changes in selected aircraft/Prop-Fan geometric parameters werecalculated for the more critical operating conditions l and 4 in Table 9.4.
The eight alrcraft/Prop-Fan geometric parameters for which the EFQ sensitiv-itles were calculated are defined in Figure 9.7. The sensitivity for any one
of these parameters was calculated, by holding the other seven constant.Thus, for example, when the spanwise location of the Prop-Fan axis, WM <Fig-
ure 9.7) was varied, the distance of the Prop-Fan plane ahead of the wing
leading edge, WLE in Flgure 9.7, was held constant.
68

f
!I
I-z
%
I!
i !!
L_J
Ii.
u
z
II.
0
II.
i,
0l.i
ILl-I-
111
IDI.i..
69

<r_u
<m
@U
<
W
e_
7o
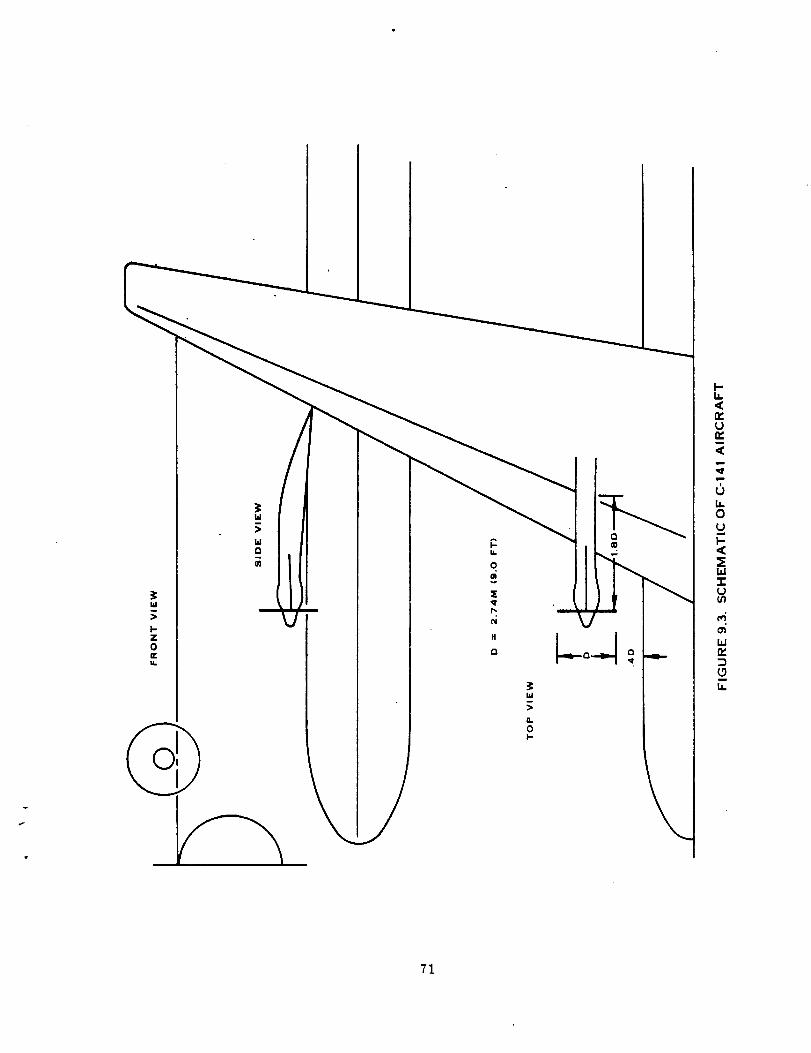
v
_r
71

Lll
I"Z0a_LL.
Illr_
\
\
r-h
0abv
X
r_
11
/
If
tycj
Ut_IL0ui
l-
W
LLIr_
m
iI
72

W
I-Z
orrLL
W
0
91
\
!
I_
/
v
_I_i_
w
QI0I-
\
l--Lain
C_
Q_m
wa_
Lllml
It
0_Jl-
W
ir
L_a_
c_
LL
7S
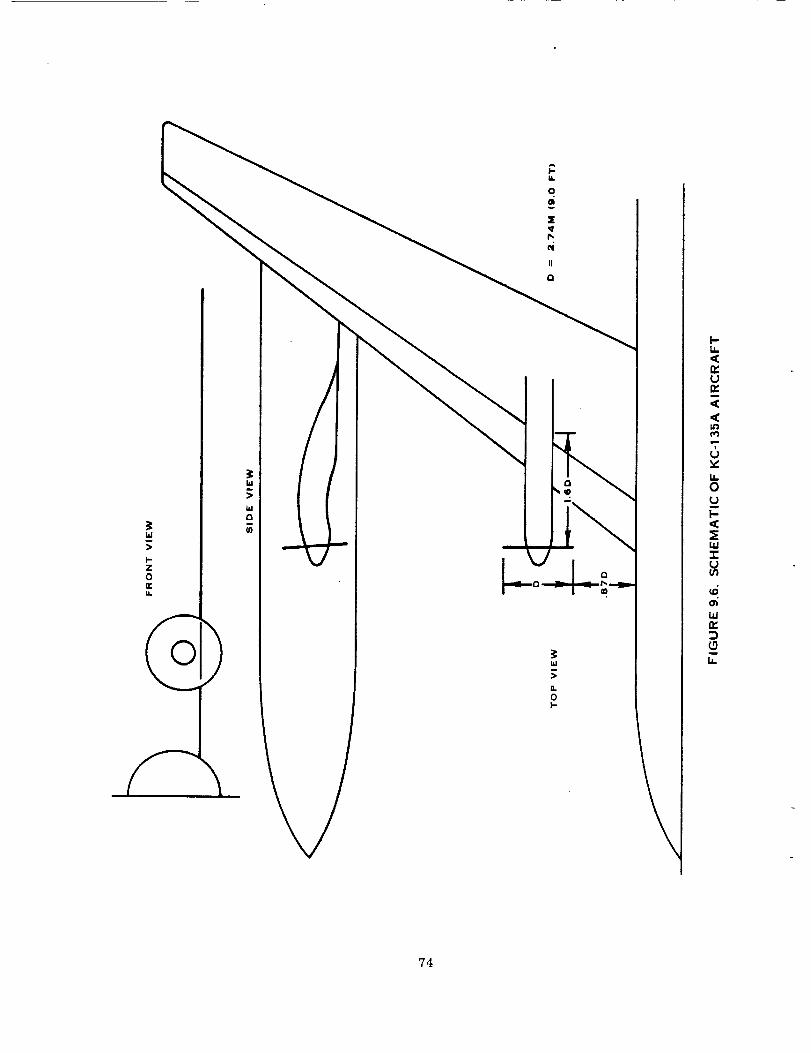
l,i,l
a.
oI-
I-I.i.
U
"7c_
I.L.CD_Jm
I-
_E111"I"
a_w
D
I.L.
74
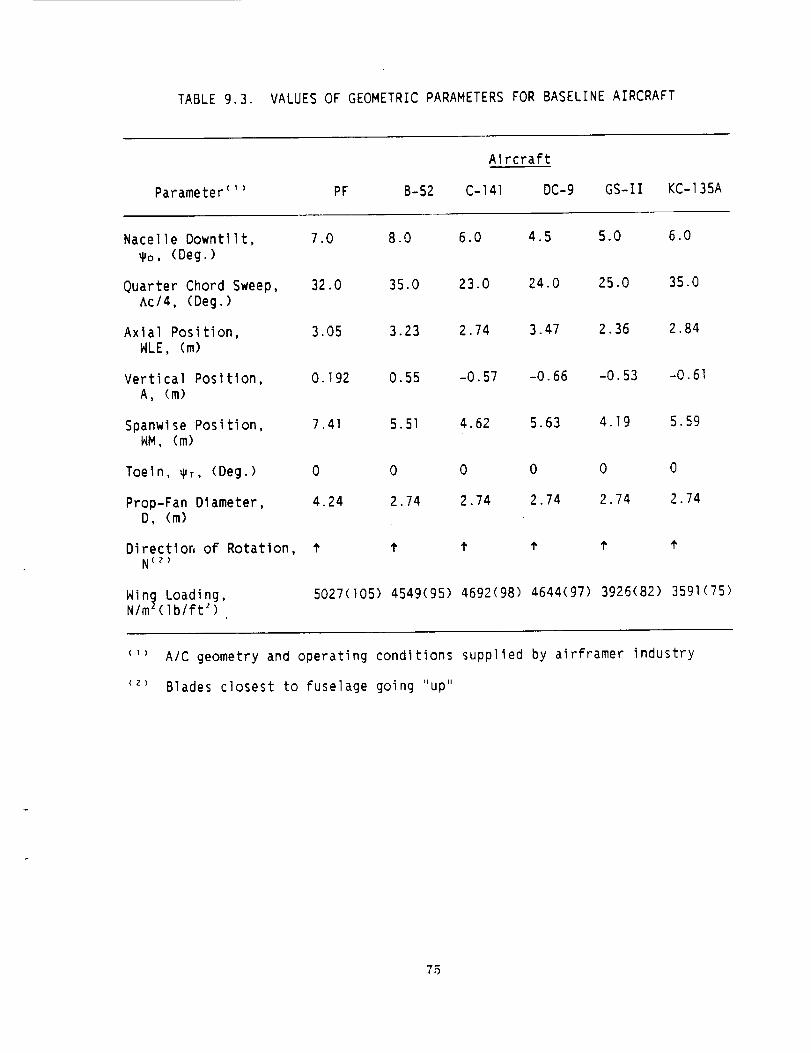
TABLE 9.3. VALUES OF GEOMETRIC PARAMETERS FOR BASELINE AIRCRAFT
Aircraft
Parameter _'_ PF B-52 C-141 DC-9 GS-II KC-135A
Nacelle Downtilt,
_o, (Deg.)
Quarter Chord Sweep,
Ac/4, (Deg.)
Axial Position,
WLE, (m)
Vertical Position,
A, (m)
Spanwise Position,WM, (m)
Toeln, 9T, (Deg.)
Prop-Fan Diameter,D, (m)
Direction of Rotation,N(2)
Wing Loading,N/m'(Ib/ft z)
7.0 8.0 6.0 4.5 5.0 6.0
32.0 35.0 23.0 24.0 25.0 35.0
3.05 3.23 2.74 3.47 2.36 2.84
0.192 0.55 -0.57 -0.66 -0.53 -0.61
7.41 5.51 4.62 5.63 4.19 5.59
0 0 0 0 0 0
4.24 2.74 2.74 2.74 2.74 2.74
t t t 1' t
5027(t05) 4549(95) 4692(98) 4644(97) 3926(82) 3591(75)
('_ A/C geometry and operating conditions supplied by alrframer industry
(2_ Blades closest to fuselage going "up"
75

.,_ A 0
0 n,
_o o®
oo .o ='_:_c
n,< _+ <z i
,,,-'__ _o _'_ _+z
u. w < Zo_z - _,
oZi _..,:"< - _ _
iv z - < <- a. _ z
\ /
w1-<-I
U.J<
w
w
u,I
I-
r,w
I-
Zw
ou.w
U
o
(/1n-LdPLd=E<n-<
U
n,
i11:E0i,i(9
p;o_LdE
(D
h
7_

TABLE 9.4 AIRCRAFT OPERATING CONDITIONS FOR CALCULATED
EQUIVALENT EXCITATION FACTORS
Operating Conditlons
Aircraft
PF B-52B C-141 DC-9 GS-II KC-135A
I •
°
,
,
Maximum Gross
Weight (Kg) 54900 171800 143600 41140 29600 83000Minimum Airspeed (I_
(m/s EAS) 93 88 139 73 93 93
Minimum Gross
Weight (Kg) 38600 84900 62600 27940 15380 48600
Minimum Airspeed ('_(m/s EAS) 93 88 139 73 93 93
Maximum Gross
Weight (Kg) 54900 171800 143600 41140 29600 83000
Maximum Airspeed(m/s EAS) 136 141 153 171 141 147
Mlnimum Gross
Weight (Kg) 38600 89900 62600 27940 15380 48600
Maximum Airspeed(m/s EAS) 136 141 153 171 141 147
('_ W/o flaps and with gear up.
77

id
vU._J
0I"O<Ik
ZZ0
F-
I-"
X
2
0
"2
-460
T
I
80 TO0 1t0 120 130 140 150 160
EQUIVALENT VELOCITY, (M/S)
m I-P EF
• E:FQ
170 180
FIGURE 9.8. BASELINE EF DIAGRAM FOR PROP FAN AIRCRAFT
"/8

2
0
-2
-460
I
\IO
80 lOO 11o 15o 16o 17o 18o
I"P EF
• EFQ
i'
120 130 140
EQUIVALENT VELOCITY. (M/S)
FIGURE 9.9. BASELINE EF DIAGRAM FOR B-52 AIRCRAFT
79

z_v
Id .
z_<z<1U
-1 -
dIkA
u_z_
v
Id .
<W:=<1U
5dzmw_
Zu<-1
u
wzo
zw<-1-ru
I2.8
....... I I I I3,@ 3.4 3.8 4.2
AXIAL DISTANCE FROM WING LEADING'.DGE TO PROP PLANE, WLE, (M).
GRO66
WEIGHT (KG)
171800
------ 84900
Q BASELINE
VELOCITY
EAS (M/S)
88
141
AIRCRAFT
---"_- i"_ I I
1 I ! I I
4 5 6 7 B
SPANWISE DISTANCE FROM FUSELAGE PpTO PROP _.WM, (M),
I
o -1 ! I !
S
-1 | i I I I-,S -.4 0 .4 .S
VERTICAL DISTANCE FROM WING ZERO LIFT LINE TO PROPi_,A, (M)1
IO
-i I I I I30 34 38 42 46
WING QUARTER CHORD SWEEP. _'_.C/4. (DEG.)
FIGURE 9.10. B-52 EFQ SENSITIVITY TO CHANGES IN PROP-FAN ORIENTATION
80

d
Id
i w
Id
Z
-rU
I i
o
°I i
//
//
/
I I ///._**__
//
//
/
f i i i0 7 8 9
NACELLE DOWNTILT ANGLE._ D (DEG.)
I
d
I_/ . 0
Z _
<W•T" "1U
d
"'d
Id . 0_oZ _.<ldZ.'IU
-I
l,
IO
I I I i nI i m I JL---.- 6 m I.
I I I I
PROP. ROTATION DOWN AT FUSELAGE, N
m_,_. A ""_ 'a'_ _' S.i=.. _ _ __ 1I
I , _ _ I
I I i I I-2 -I 0 1 2
NACELLE TOO'IN ANGLE.'__'T, (DEG.)
I
d
ldZCI
,., o I
Z
=U
-I I2.2
I I _ .'--- --- "--- I v
I I I I2,4 2.8 2..8 3.0
PROP. DIAMETER. D. {M)
GROSS
WEIGHT (KG)
_ 1'71800
m _ 84900
VELOCITY
EAS {M/S)
88
141
Q BASELINE AIRCRAFT
FIGURE 9.10. (CONCLUDED)

4
WC_v
0I-o,(U.
z0mI.-<I-
xw
2
o
-2
-4
62600 KG, _
L
\I
143600
60 80 100 110 -120 130 14o lS0 160
EQUIVALENT VELOCITY (M/S)
.,,,m.m I"P EF
• [FQ
170
FIGURE 9,I1. BASELINE EF DIAGRAM FOR C-141 AIRCRAFT
KG.
180
82

2
1
d
"'e
vW .000
<Z_
U
-I
-2
I 1 !I
'
I I I I I2.0 2.4 2.8 3.2 3.6
GROSS
WEIGHT(KG)
143600
m I 62600
VELOCITY
EAS (M/S)
139
153
_) BASELINE AIRCRAFT
AXIAL DISTANCE FROM WING LEADING EDGE TO PROP PLANE, WLE, (M).
!
d
we
Id 0 ,m_ h .-_ n__, -_, m• ' . v --_ _IImI i00
<"1""1
U
•i I I I I I4,0 4.4 4.8 S.2 S.6
SPANWISE DISTANCE FROM FUSELAGE (_¢TO PROP _r.' WM. (MI.
dLI."'0
I,dZQ
v
ZW<'I"rU
ol
/
m , I I I
I I I I I".8 -.4 O .4 .8
VERTICAL DISTANCE FROM WING ZERO LIFT LINE TO PROP ¢¢.A, (M)
I
d,,,0
idzQ
v
Zw<"I"rU
-I
m _ i __ .---i I
I I I I I16 20 24 28 32
WING QUARTER CHORD SWEEP.,_.C/4. (DEG.)
FIGURE 9.12. C-141 EFQ SENSITIVITY TO CHANGES IN PROP-FAN ORIENTATION
83

d
v
bJ .
Z_<l_JZ_U
2 :,
//
//// /
//
///
. t _ _ I I
dLL
v
W .
Z _-<W
u
I
4 5 iS 7 8
NACELLE DOWNTILT ANGLE,_/D, (DEG.)
0 i
-! ,
GROSS VELOCITY
WEIGHTIKG) EAS (M/S)
143600 139
------ 62600 153
Q BASELINE AIRCRAFT
I
L I I I I
PROP. ROTATION DOWN AT FUSELAGE, N
d
ZQm
ZLd
'.rU
-1
\
I l I I J
"2 -I O I 2
NACELLE TOEIN ANGLE._TJ T, (DEG.)
d
_J
ZQ
Z,,,<<zu
o I
-I !2.2
I I I I2.4 2.6 2.8 3.0
PROP, DIAMETER. D, (M)
FIGURE 9.12. {CONCLUDED)

Idav
Id
0I-U<1,1.
z0
I-,.
uX
ILl
2
0
"2
-4GO
mm I"P EF
• EFQ
80 100 110 120 130 140 150 160
EQUIVALENT VELOCITY, (M/S)
170 180
FIGURE 9.13. BASELINE EF DIAGRAM FOR DC-9 AIRCRAFT
85
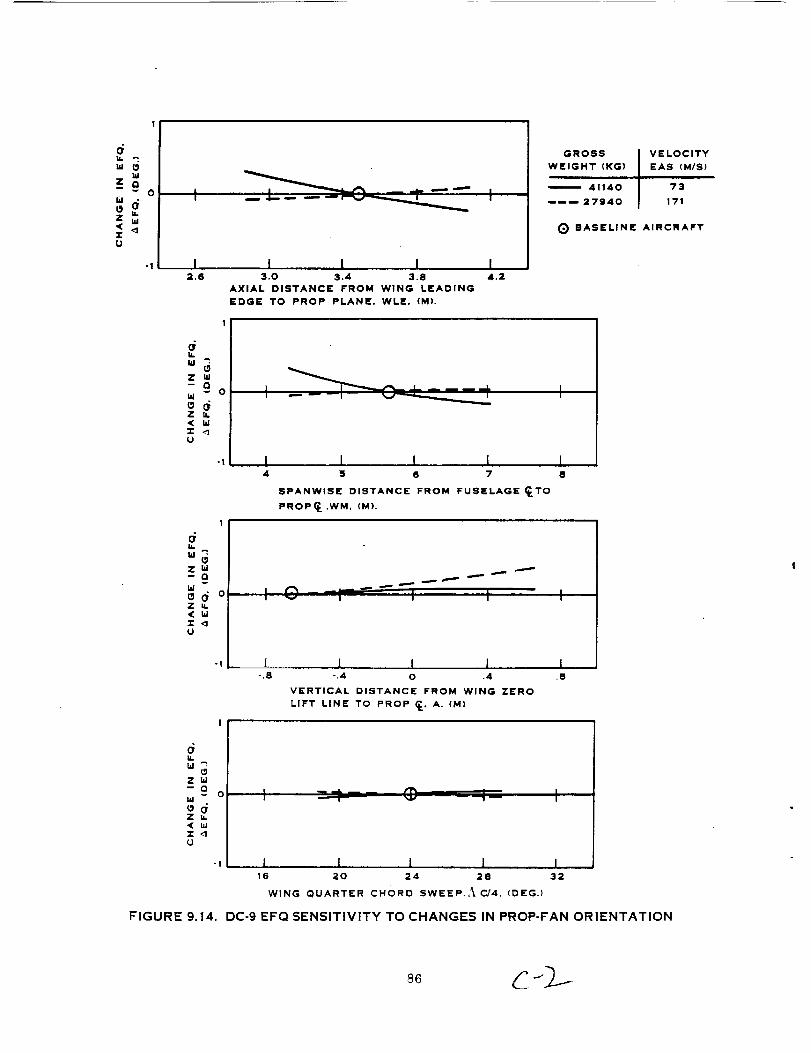
dIi. --:
v 0
Z
"rU
2.6
d
Z id-- a
v OId
Z< Id•I- <1U
1
it.
wL_Z Id
v
¢_d oZ _.
< W
U
d
Z W-- Q
w 0
Z< _JZ <1U
-!
i I I3.0 3.4 3.8
AXIAL DISTANCE FROM WING LEADING
EDGE TO PROP PLANE. WLE. (M).
I4.2
GROSS VELOCITY
WEIGHT (KG) EAS (M/S)
41140 73
mii 27940 171
E) BASELINE AIRCRAFT
I _ _ I I I _ I
I ! I I I4 S 6 7 S
SPANWISE DISTANCE FROM FUSELAGE _.TO
PROP__,WM, (M).
I O--, I I I
I I I I l-.8 -.4 O .4 .8
VERTICAL DISTANCE FROM WING ZERO
LIFT LINE TO PROP _p, A. (M]
-- m _I/ -- --"-'I_ I
I I I l I16 20 24 28 32
WING QUARTER CHORD SWEEP. A CJ4, (DEG.)
FIGURE 9.14. DC-9 EFQ SENSITIVITY TO CHANGES IN PROP-FAN ORIENTATION
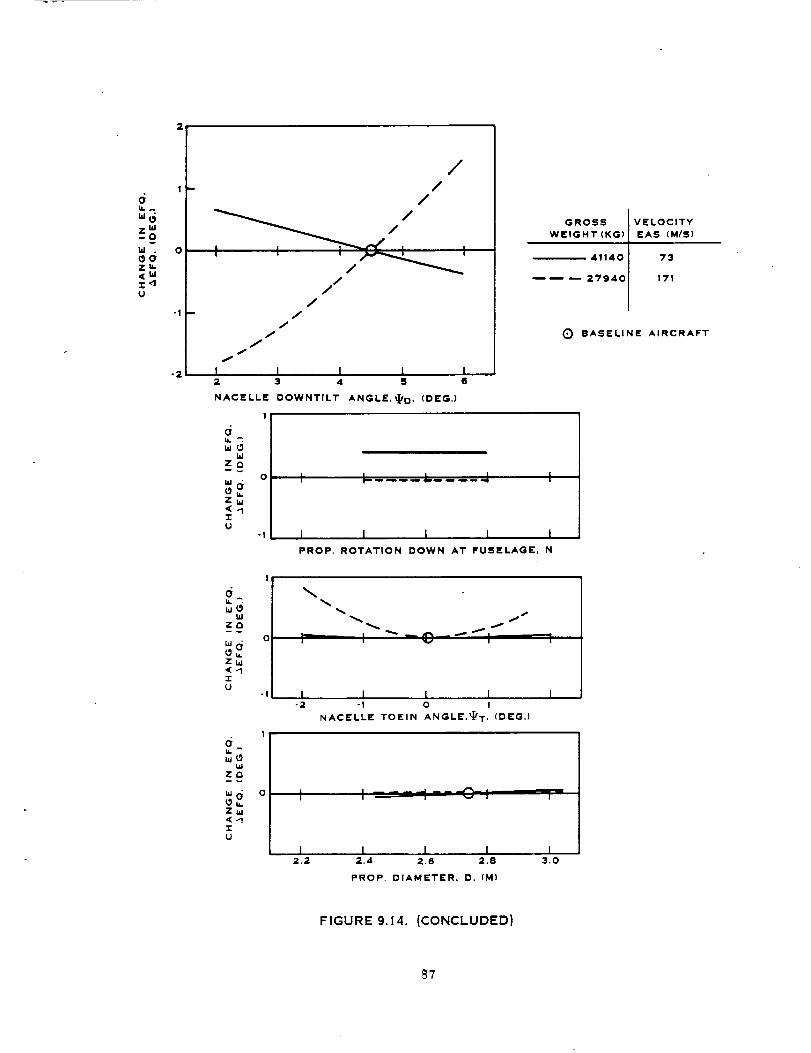
dIt, A
v
Id .
<-i-<1u
0
-2
//
/
//
JJ
J
//
//
I I L L2 3 4 S
NACELLE DOWNTILT ANGLE,_T/D. (DEG,)
1!
dIk --:
hJ
zo
Id
z
.ru
I I J. .1 I
I I I 1 lPROP. ROTATION DOWN AT FUSELAGE, N
GROSS
WEIGHT (KG)
41140
2?940
VELOCITY
EAS (M/S)
73
171
C) BASELINE AIRCRAFT
d
bJ
ZQ
i,d
ZW
<-1
u
(_
w_W
z_
zw<-1-rU
1 I ! ....... I I"2 -I O 1
NACELLE TOEIN ANGLE._ T, (DEG.)
t I ----: ---_, ,' ,
I 1 • [ J
2.2 2.4 2.6 2.8 3.0
PROP. DIAMETER. D. (M)
FIGURE 9.14. (CONCLUDED)
8?
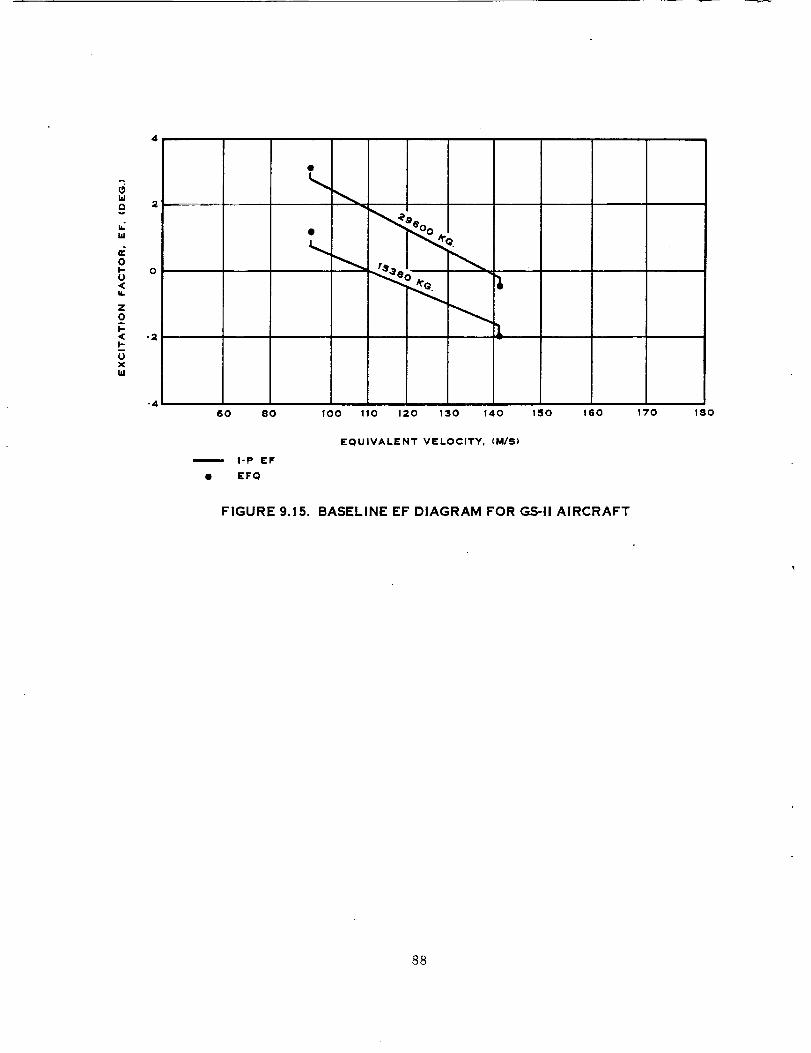
IdDv
Id
OI-O<14.
zO
I-<k.
xId
2
0
"2
-460
m I'P EF
£FQ
1
80 100 110 120 130 140 150 160
EQUIVALENT VELOCITY, (M/S)
170 180
FIGURE 9.15. BASELINE EF DIAGRAM FOR GS-II AIRCRAFT
88

d
-- OId
Z
-rU
I1.6
deL
"dz_ o
z
,rU
-1
I
d
z_Q 0
W v
<
u
-I
d
- 0W
Z
2:U
I I I2.0 2.4 2.8
AXIAL DISTANCE FROM WING LEADING
EDGE TO PROP PLANE, WLE, (M),
I3.2
I _ l -- I
I I I i I3.,* 3.a 4.a 4.6 s.o
SPANWISE DISTANCE FROM FUSELAGE_TOPROP _. WM. (M).
I _ I I I
I I I I I-.8 -,4 0 .4 .8
VERTICAL DISTANCE FROM WING ZERO
LIFT LINE TO PROP _;. A, (M)
.... _ I -- I I
I ....I I I I20 24 28 32 36
WING QUARTER CHORD SWEEP, __C/4. (DEG.)
GROSS VE LOCITY
WEIGHT (KG} EAS (M/S)
29600 93
.... 15380 141
(_) BASELINE AIRCRAFT
FIGURE 9.16. GS-ll EFQ SENSITIVITY TO CHANGES IN PROP-FAN ORIENTATION
_9

U.A
"'L_
v
ld .
<
u
2
I
0
-2
dIkA
w_
v
Id .
_0z _.<LdZ<1U
d
Id ._0Z u.<Ldz_u
d
W
ZQv
z_j<<1zo
/J
Jf
jftf
f/
/
//
I I I I I3 4 S 6 7
NACELLE DOWNTILT ANGLE._ D, (DEG.)
.!
t _..... -[ ..... J I
I I I I I
o
PROP, ROTATION DOWN AT FUSELAGE, N
_m,, ! L _ __ i
• I L I J L"2 -1 0 ! 2
NACELLE TOEIN ANGLE._I/T, (DEG.)
GROSS
WEIGHT (KG)
29600
15380
VELOCITY
EAS (M/S)
93
141
(_ BASELINE AIRCRAFT
I I ] ,_'__
1 I I I I2.2 2.4 2.6 2.8 3.0
PROP. DIAMETER, D, (M)
FIGURE 9.16. (CONCLUDED)
9O

IdQv
bJ
d0
u<
z0
I-<I-
xta
2
0
-2
-4
$
%.
$
60 80 100 110 120 130 140 150 160
m I-P EF EQUIVALENT VELOCITY, (M/S)
• EFQ
FIGURE 9,17. BASELINE EF DIAGRAM FOR KC-135 AIRCRAFT
170 180
9i

,,,(_w
zam v
z
,rU
| m
0
-| m
I ....l I2.2 2.6 3.0
AXIAL DISTANCE FROM WING LEADING
I
it. ":
w_
Zciw
Ld
Z
ZU
d
I !3.4 3.6
GROSS
WEIGHT (KG)
_83OOO
R _ m 46600
Q BASELINE
VELOCITY
EAS (M/S)
93
147
AIRCRAFT
EDGE TO PROP PLANE. WLE, CM).
v
td ._OZ _.<(Ld
U
dw_
wzr_
zw
"t-O
o, I
-1 J4.8
I I I I5.2 5.6 6.0 6.4
SPANWISE DISTANCE FROM FUSELAGE_. TO PROP_. ,WM, (M).
I
_ , ,' IU _ I I I
I I I 1 I-.8 -.4 o ,4 .8
VERTICAL DISTANCE FROM WING ZERO LIFT LINE TO PROP_..A.(M)
L I I I I30 34 38 42 46
WING QUARTER CHORD SWEEP, AC/4, (DEG.)
FIGURE 9.18. KC-135 SENSITIVITY TO CHANGES IN PROP-FAN ORIENTATION
02

d
v
Id .
'.r<_U
-2
//
//
//
/
I
/
//
//
1/
I l I I I4 5 6 7 8
NACELLE DOWNTILT ANGLE,_ D. (DEG.)
v
[d .
Z _<ld=,du
o
-1
1 .... L I I
I I I I I
PROP. ROTATION DOWN AT FUSELAGE, N
GROSS IVELOCITY
WEIGHT(KG) t EAS (M/S)
_3000 I 93
_----488001 147
Q BASELINE AIRCRAFT
d
v
Id .
-i-<1u
d
W .
Z u-<WZ, do
o
0 I
-1
I I M#' I
s
J I I 1 I"2 -I 0 1 2
NACELLE TOEIN ANGLE._T. (DEG.)
I I J I I2.2 2.4 2.6 2.8 3.0
PROP, DIAMETER. D. (M)
FIGURE 9.18. (CONCLUDED)
93

9.1.6 Results
The EFQ diagram for the Prop-Fan aircraft with a 4.24 m (13.9 ft.) diameterProp-Fan is shown in Figure 9.8. The square of the equivalent airspeed is
plotted on the abscissa by utilizing the appropriate graph paper with a lin-
ear scale. The Equivalent Excitation Factor EFQ is thus assumed to followthe EFD, which is a linear function of the equivalent airspeed squared. The
lowest airspeed for which the Equivalent Excitation Factor is shown repre-sents the minimum aircraft airspeed without flaps (aircraft operating points
l and 2 in Table 9.4), and the maximum airspeed to which the curve is drawn
represents the maxlmum alrcraft cruise airspeed (aircraft operating points 3and 4 in Table 9.4).
The EFQ diagram for the basellne candidate aircraft and the results of the
sensitivity study are presented respectively in Figures 9.9 - 9.18: Figures9.9 and 9.10 being for the B-52, Figures 9.11 and 9.12 for the C-141, Figures
9.13 and 9.14 for the DC-9, Figures 9.15 and 9.16 for the Gulfstream II and
Figures 9.17 and 9.18 for the KC-135A.
In general, the five candidate aircraft exhibit similar trends, with the fol-
lowing observations:
a. The EFQ is very sensitive to the nacelle downtilt, with increasedsensitivity at the higher airspeed because of the high dynamic pressure.
b. The distance ahead of the wing (axial position) has a pronounced
effect on the EFQ primarily due to the wing circulation. The sensitivity ofEFQ to axial position decreases with increased airspeed, e.g., has a greater
effect during low speed climb than high speed cruise (due to increased wingcirculation at low speed).
c. The vertical placement of the nacelle with respect to the wing chordhas a significant, consistent affect on EFQ at high speeds. At low speed,all a_rcraft show little affect of vertical nacelle placement because of the
large angle of attack of the wing.
d. The effect of spanwlse location of the nacelle on the wing is minor,except for the B-52B, whlch shows a somewhat higher sensitivity at low
speed. Because of the nonlinearity affects of this parameter, the sensitiv-
ity is influenced by the initial baseline spanwise position.
e. Ning sweep has a negligible effect on EFQ for all the candidate air-craft. This is probably because the nacelle locations on the baseline air-
craft are sufflciently ahead of the wing to minimize the changes in w_ng cir-culation with blade radius due to wing sweep.
f. Nacelle toe out effects primarily the EFQ at maximum velocity and
has virtually no effect on the EFQ at low speeds, except for the C-141. Thisis because the pitch inflow ang]es are low at high speeds and high at low
speeds. The C-141 is more sensitive to toe in or toe out because of the rel-
atively close proximity of the Prop-Fan axis to the fuselage.
94

g. Only the DC-9and KC-135Ashowany sensltlvity to direction of rota-tion of the Prop-Fan. For these aircraft, downward rotation at the fuselage
increases the low speed EFQ.
h. EFQ is basically insensitive to Prop-Fan diameter over the range ofdiameters studied for all the candidate aircraft.
9.1.7 Dlscusslon
Most of the aircraft showed slmilar and meaningful sensitivity trends, in
spite of the significant differences in the alrcraft geometry and nacelle
placement. The EFQ showed the most sensitivity to the axial location of the
Prop-Fan ahead of the wing, the nacelle downtilt and the toe In.
Table 9.5 is a summary of the resulting equivalent deslgn IP, basic IP, and
relative higher order excitations for the maximum gross weight - minimum air
speed, and minimum gross weight - maximum air speed conditlons for the Prop-Fan and all the candidate aircraft in their baseline configuratlons. Also
Included for reference is the DC-9-80 study estimates for a nonoptimlzed In-
stallation. With the exception of the Prop-Fan Aircraft, the changes in the
excitations were due malnly to changes in the IP component. As indicated inTable 9.5, the total contribution of the higher orders for all the candidate
aircraft was relatively small (l.e., II-23% vs. 37.5% for the Prop-Fan Air-craft). Since the baseline aircraft are all so different, it is difficult to
determine why there are significant differences in the higher order excita-tlons between the candidate aircraft.
Using the sensitivities developed In this study, It should be possible to
position a Prop-Fan nacelle on any of the candidate testbed aircraft toachieve a reasonable EFQ of approximately 3.5 - 4.5.
9.1.8 Recommendations
It is recommended that a more detailed EF analysis be performed on the final
testbed aircraft as part of future NASA efforts. Thls detailed analysisshould include a more accurate flow-field distribution, as well as a more ac-curate definition of the aircraft and its operating condltions. This Kind of
detailed analysis will lead us to an installation design which more
accurately achieves the desired excitation factor levels.
95

TABLE9.5. RATIOOFn-P LOADSTOI-P LOADSFORBASELINEAIRCRAFT
EF(I-P)
P2/PI
P3/PI
P4/PI
P5/PI
EFQ/EF(I-P)
EFQ
Maximum Gross Weight - Minimum Airspeed
_-Fan
3.06
0.319
0.133
0.055
0.022
|.375
4.20
B-52
3 95
0 277
0 008
0 006
0 002
l 149
4 54
C-141 DC-9 GS-II
2.42 3.54 2.75
0.266 0.095 0.127
0.079 0.065 0.090
0.02l 0.006 0.022
0.006 0.002 0.007
].230 1.107 1.157
2.98 3.92 3.18
KC-135A DC9-80
2 89 2.55
0 125 0.036
0 060 0.005
0 014 -
0 004
1 I15 1.02
3 22 2.60
EF(I-P)
P2/PI
P3/PI
P4/PI
P5/PI
EFQ/EF(I-P)
EFQ
Minimum Gross Weight - Maximum Airspeed
Prop-Fan B-52 C-] 41
1.44 3.27 2.55
0.437 0.255 0.413
O.161 0.045 0.083
0.076 0.012 0.022
0.033 0.003 0.006
1.529 1.178 1.350
2.20 3.85 3.44
DC-9
2 16
0 130
0 034
0 008
0 002
l 083
2 34
GS-I_£
1.65
0.218
0.074
0.023
0.008
1.196
1.97
KC-135A
2 09
0 278
0 078
0 025
0 008
1 244
2 50
DC9-80
3.68
0.025
0.016
0.005
1.065
.392
96

9.2 AERODYNAMIC ANALYSIS
9.2.1 Introduction
The influence of the aircraft flow-field on the aerodynamic efficiency of theProp-Fan was evaluated at seven aircraft operating condltions. The aerody-namic twisting moments, slde loads and shaft moments were also evaluated forthese operating conditions.
9.2.2 Analytical Methods
9.2.2.1 Flow-Field Calculation - The flow field at the plane of the Prop-
Fan, due to the presence of the aircraft, for a given altitude Is calculated
using an Incompressible-lnviscld potential flow computer program developed atHamilton Standard. This program computes the flow-fleld about individual
aircraft components separately and uses the superposition principle to com-bine these flow-fields to obtain the total flow-fleld. The fuselage and na-
celle are treated as axlsymmetrlc Rankine bodies, while the wing Is analyzed
as a swept lifting line. The velocity perturbations due to axial flow andcross flow are considered on all aircraft components (wing, nacelle and fuse-
lage). The program also accounts for the effects of the propeller slipstreamand swlrl on the aircraft flow-fi'eld. The influence of the tail surfaces has
been found to be negligible. Consequently, these surfaces were not consid-ered in the calculations for wing mounted Prop-Fans. This flow-field calcu-
lation requires significantly less information about the aircraft geometrythan do other more elaborate methods, such as the Hess code. An extensive
comparison of this aircraft flow field program with the Hess code method re-vealed reasonable agreement; see Reference 25. Thls flow field program hasbeen used for several decades at Hamilton Standard for accurately predicting
propeller design loads.
9.2.2.2 Aerodynamic Loads - The Prop-Fan aerodynamic loads are calculated inthe presence of the alrcraft Flow field uslng the Goldstein-Locke propeller
vortex strip analyses of reference 26, with the assumption of quasi-steadyaerody- namics. The spanwlse aerodynamic loads on the Prop-Fan blades are
calculated at a series of azimuthal positions as the Prop-Fan makes onerevo|ution. These loads are radially integrated and Fourier analyzed to
obtain the harmonic components of the blade airloads. The aerodynamictwisting moments about the blade pitch change axis are calculated for an
isolated Prop-Fan operating in an azimuthally uniform flow field.
9.2.3 Model Description
The aircraft used in thls study is a scaled version of the "Prop-Fan Air-craft" used in the reference 27 study. Figure 9.19 shows a schematic of this
aircraft, and Table 9.6 lists some of the geometric parameters of this air-
craft. The Prop-Fan geometry used in this study is that of the SR-7 asdefined In Section 8.6.
97
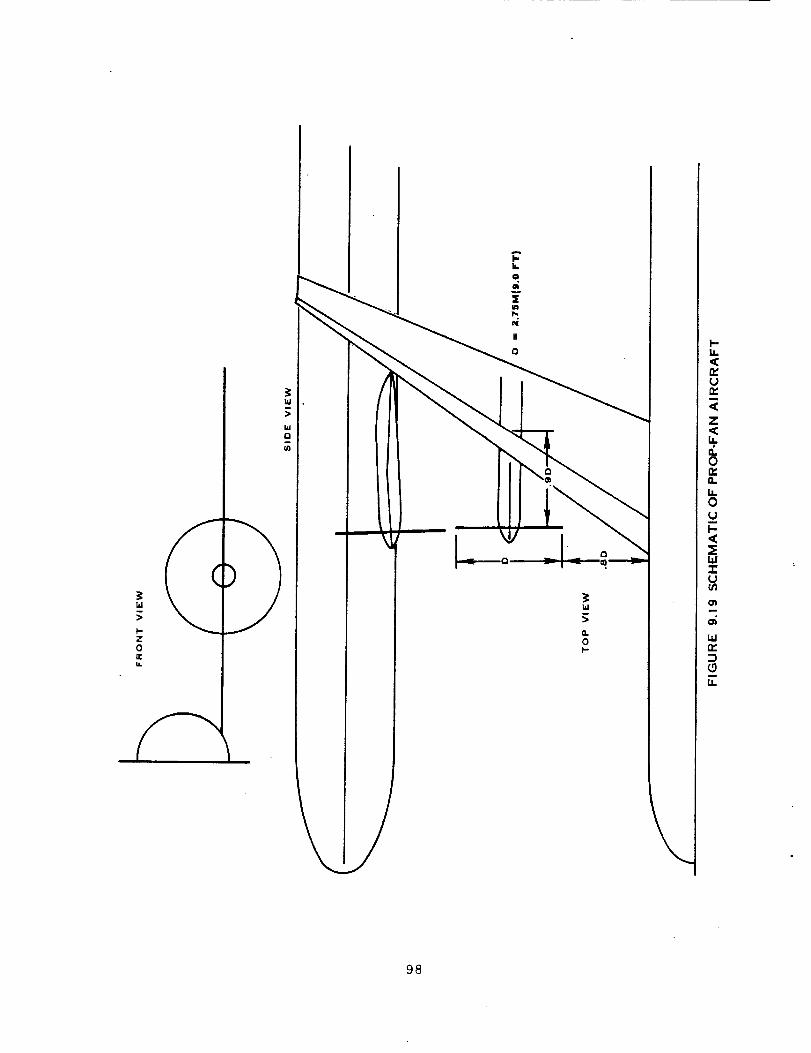
W
>
I-,Z0rrLL
l,J
n,J
0
I"IL
°_E
1-14,
a_(.Jn_
Z<
0n_Q=
LI=0LJI-,<_E14,1"I"U
q_
c_
n_
LO
98

TABLE 9.6. VALUES OF GEOMETRIC PARAMETERS FOR PROP-FAN AIRCRAFT
Parameter Value
Nacelle Downtilt
Quarter Chord Sweep
Prop-Fan Diameter
Toeln Angle
Maximum Gross Weight ('_
Minimum Gross Weight (_
Wing Area ('_
Maximum Wing Loading
Direction of Rotation
7.0 deg.
32.0 deg.
2.75 m (9.0 ft)
0.0 deg.
22993 kg (50?00 Ibs)
16145 kg (35600 Ibs)
44.9 m2 (483 ftz)
512 kg/m z (105 Ib/ft _)
Blades nx)vlng vertically upward @ fuselage.
(I)A/C geometry scaled from airframes industry supplied A/C for 4.24 m
(13.9 ft) Prop-Fan.
99

>..
Z
u-,,J
._.1
..J
Z
X
C.n
--Ir'..-.
I
w
u1
ogl
A
Z ,",
C=l. _;
•e- v
"T'bL
:14_,_
4-_v,,.--,
4Z
r_X
4.-I_ .,C P.,
O .-- x./_. G;v
O
O
_ O_
I I1_ 1111
_ _0_
0 000 _000
• ° . - ,
14--o (]a r_o _.. (...) r'_o
-_" v _ _ _v _ _ x .,_-_ _._
_ _o
°0..
III III
_ _O_• ° . . °
_ _0_
_00
0 000 _000
A
0 _-_ _'-_ u_ Ou'_ _ ,',_ u"_
_/ v._ :_ _-s,_ _ _,_ x 4._ v_ _- _. O0 _ _
O" 0
0-- 0
x
°_
_- O_
_- 0__ r--
or-c -_ k-- b--
If II II
- ,J1
I00
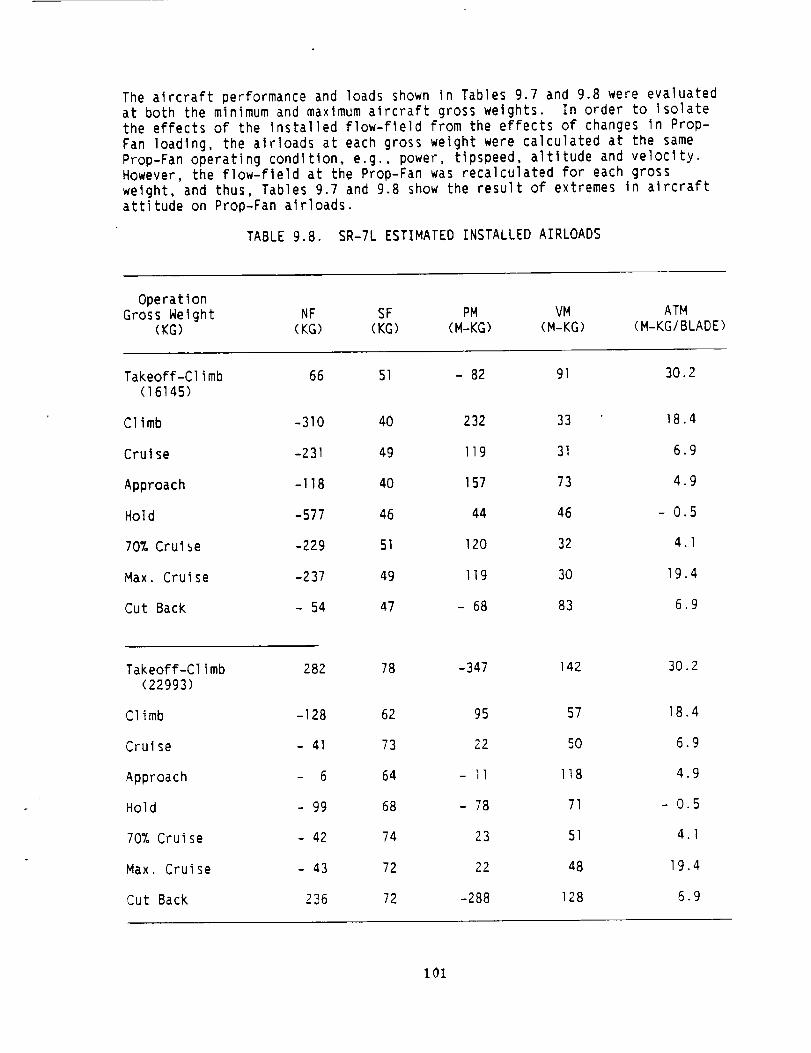
The alrcraft performance and loads shown in Tables 9.7 and 9.8 were evaluatedat both the minimum and maxlmum aircraft gross weights. In order to Isolatethe effects of the Installed flow-fleld from the effects of changes in Prop-
Fan loading, the alrloads at each gross weight were calculated at the sameProp-Fan operating condltion, e.g., power, tipspeed, altitude and velocity,However, the flow-fleld at the Prop-Fan was recalculated for each grosswelght, and thus, Tables 9.7 and 9.8 show the result of extremes in alrcraftattitude on Prop-Fan alrloads.
TABLE 9.8. SR-7L ESTIMATED INSTALLED AIRLOADS
OperationGross Welght NF SF PM VM ATM
(KG) (KG) (KG) (M-KG) (M-KG) (M-KG/BLADE)
Takeoff-Climb 66 51 - 82 91 30.2(16145)
Climb -310 40 232 33 18.4
Cruise -231 49 119 31 6.9
Approach -118 40 157 73 4.9
Hold -577 46 44 46 - 0.5
70% Cruise -229 51 120 32 4.1
Max. Cruise -237 49 119 30 19.4
Cut Back - 54 47 - 68 83 6.9
Takeoff-Climb 282 78 -347 142 30.2(22993)
Climb -128 62 95 57 18.4
Cruise - 41 73 22 50 6.9
Approach - 6 64 - II 118 4.9
Hold - 99 68 - 78 71 - 0.5
70_ Cruise 42 74 23 51 4.1
Max. Cruise - 43 72 22 48 19.4
Cut Back 236 72 -288 128 6.9
I01

9.2.4 Analysis and Results
The flow-field around the aircraft was calculated for each operating condi-
tion with the aircraft angle of attack chosen such that the wlng lift equaled
the aircraft gross weight.
Figure 9.20 shows the sign convention used in present|ng the efficiency le-
vels and air loads determined In this study. Table 9.9 Is a list of the
symbols used. Table 9.7 presents the calculated efficiency levels for eachoperating condition. Three efficiencies are shown in the table, n_so is
the net efficiency of the Prop-Fan at zero angle of attack In the presence ofthe nacelle, i.e., Isolated efficiency. Obviously, these values will be the
same at both aircraft gross weights, nSHAFT iS the efficiency of the
Prop-Fan in the presence of the aircraft flow-fleld based on the thrust
developed on the Prop-Fan drlve shaft (nSHA_T)" Because the Prop-Fan
shaft may not be aligned with the direction of flight, a third efficiency,nFL,GHT iS shown in Table 9.7 and is based on the net thrust In the
flight direction, as determined from the followlng equation:
TFLtGHT " TSHAFr X COS(_NAC) + Nr X Sin(CNAC)
N_ is the "normal force" which is shown In Figure 9.20; NF iS usuallypositive for :NAC > 0, and negative for :NAC < 0. The nacelle angle
of attack, mNAC, iS dependent upon the alrcraft angle of attack and the
downtilt angle of the nacelle. The downtilt angle of the nacelle is very Je-pendent upon the axial distance between the wing and the nacelle, that dis-
tance has not been optimized for this aircraft, and therefore, the downtilt
angle may not be optimlzed.
Table 9.7 shows a loss in cruise flight efficiency (n,so - nFL,GHT)
of 2.1% at minimum aircraft gross welght, and 0.8% at maximum alrcraft gross
weight due to installation effects. Shaft efflciency, nSHAFT, for thisoperating condition was not changed at minlmum gross weight, but was reduced
by 0.5% at maximum gross weight from the isolated Prop-Fan efficiency level.In order to assess the influence of downtilt angle on flight efficiency the
downtilt angle was reduced by l° and the cruise case rerun at minimum gross
weight. The flight efficiency loss dropped from 2.1% to l.l%.
Shaft efficiency losses of less than 0.9_ due to the effect of the aircraftflow-field on the Prop-Fan blade loading can be seen in Table 9.7. A slightgain in shaft efficiency is shown in Table 9.7 for several cases where thegain in efficiency, when the Prop-Fan is operating at an axial velocity lowerthan free stream due to nacelle angle of attack, over comes the losses en-countered due to the non-uniformity of the flow field. The normal force,side force, pitching moment and yawing moments calculated from the once perrevolution loading on the blades Is shown In Table 9.8.
Table 9.8 also lists the aerodynamic twisting moment about the pitch change
axis. This was calculated for an azimuthally uniform flow-field.
102

Z
o_u.
0n_
j-
103
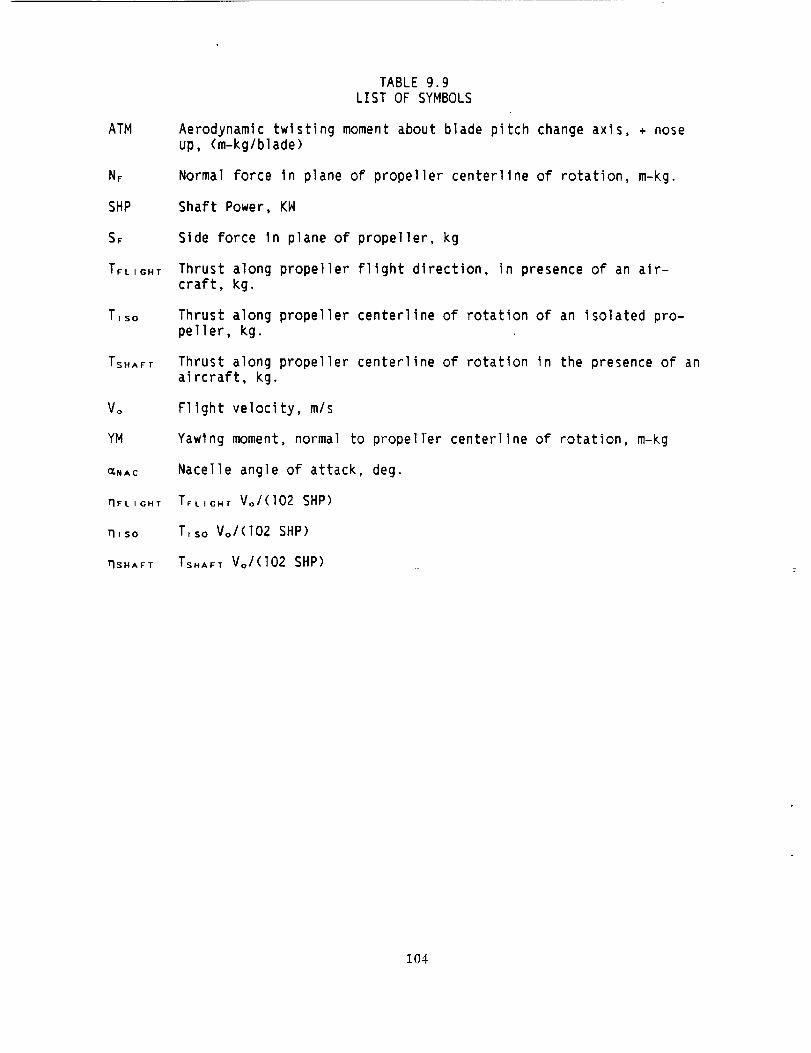
ATM
NF
SHP
SF
TFLIGHT
Tiso
TSHAFT
Vo
YM
_NAC
_FLIGHT
q_so
qSHAFT
TABLE 9.9
LIST OF SYMBOLS
Aerodynamic twisting moment about blade pitch change axls, + nose
up, (m-kg/blade)
Normal force in plane of propeller centerllne of rotation, m-kg.
Shaft Power, KW
Side force In plane of propeller, kg
Thrust along propeller flight direction, in presence of an air-
craft, kg.
Thrust along propeller centerline of rotation of an isolated pro-
peller, kg.
Thrust along propeller centerline of rotation In the presence of an
aircraft, kg.
Flight velocity, m/s
Yawing moment, normal to propeITer centerllne of rotation, m-kg
Nacelle angle of attack, deg.
TFLIGHT Vo/(102 SHP)
T,so Vo/(IO2 SHP)
TSHAFT Vo/(102 SHP)
104

9.2.5 Summary
ShaFt efficlency losses of less than 112% may be expected due to the alrcraftflow-field.
Cruise flight efficlency losses up to 2.1% were calculated, due primarily tothe nacelle angle of attack. .A reduction in the crulse efficiency loss from2.1% to 1.1% was calculated by reduclng the downtilt angle 1.0 degree.
105

9.3 ACOUSTIC ANALYSIS
9.3.1 Introduction
Noise levels have been calculated for the SR-7 Prop-Fan configuration(defined In Section 8.6) In two versions; 9-foot diameter and 13.9-foot
diameter. The 13.9 foQt diameter was chosen as it corresponds to the size
required for the aircraft defined in Sectlon 8.3. Near-field noise wascalculated for the design cruise and take-off operating conditions.Far-field noise levels was calculated for three conditions representative ofFAR-36 certification. Thls section also Includes a description of the
methods used to calculate the nolse, the operating conditions selected, the
calculation results in tabular form and a brief discussion of the calculation
results.
9.3.2 Noise Prediction Method
Noise predictions were made using the Hamilton Standard Prop-Fan nolse Pre-
diction Computer Program based on the frequency domain propeller noise theory
developed by Hanson (Reference 28). Near and far-field calculatlons of mono-pole (thickness), dipole (loading), and quadrupole noise sources are included
in this program. For far-field predictions, the noise due to the interactionof non-uniform inflow with the Prop-Fan are a]so Included. Sources of non-
uniform inflow include distortion due to the alrplane geometry (wing circula-
tion, fuselage and nacelle blockage, etc.) and geometric inflow due to air-
craft angle-of-attack.
The noise prediction program is coupled to the Hamilton Standard aerodynamic
performance programs, which provide the Prop-Fan geometry (thickness, chord,twist and sweep distributions of the blade) and aerodynamic loads necessaryfor a noise calculation.
9.3.3 Operatinq Conditions
The airplane used is the same as the one used in the design trade-off study.
This airplane was used to establish the flow-fleld at the propeller for far-field noise calculations. The operating conditions selected for analysis
were the full-power take-off, cut-back power take-off (far-field only), ap-proach and design cruise (near-field only) conditions. The cut-back power
condition is representative of SR-7 operation during noise certification.The cut-back power condition was defined as "the thrust level required to
maintain level flight with one engine out or a minimum of 4% climb gradi-ent" This meets the requirements of FAR Part 36 for power cut-back condi-
tions. This resulted in a requirement of 65% of the thrust available at full
power and some reduction in tip speed. A complete description of the operat-
ing conditions used Is included in TaDle 9.10. All calculations were donefor acoustic standard day conditions (77°F and 70% relative humidity at sea
level) assuming twin-engine airplanes.
106

TABLE 9.10. OPERATING CONDITIONS USED FOR NOISE CALCULATIONS
Condi t1 onAltitude Flight Disk Loading Tip Rotatlonal Types of Noise(feet) Math No. SHP/D 2 Speed (ft/sec) Calculations
Ful|-PowerTakeoff
Cut-Back
PowerTakeoff
Approach
Cruise
SL .2 74.1 800 Near and FarField
SL .2 41.6 700 Far Field
SL .2 16.8 650 Far Field
35,000 .8 32.0 800 Near Field
9.3.4 Calculation Results
9.3.4.1 Near-Field - Tables 9.II and 9.12 summarize the free field noise
calculated for three tip clearances and seven fore and aft locations for the
full power take-off and design cruise conditions. The fore and aft locations(axla] positions) represent measurement stations on the fuselage, with O.
being the plane of rotation. Positive values denote axlaI positions forward,and negative values denote positions aft of the plane of rotation. The tip
clearance and axlal positions were normalized by the Prop-Fan dlameter forthese caicu]ations, so the noise levels presented are valid for the 9-foot or
the 13.9-foot diameter SR-7.
It should be noted that the directlvity patterns are different for the take-
off and cruise flight speeds due to changes in the source characteristics and
propagatlon with changing flight Mach number. Therefore, different directiv-ity points were selected for the two operating conditions so that the data
presented includes the maximum noise at the fuselage.
The joint levels at Blade Passage Frequency (BPF) and its harmonics for the
design cruise condition are much higher than those for the take-off conditiondue to the higher tip relative Mach number at cruise <I.147 vs. 0.744).
107

TABLE 9.11. NEAR FIELD NOISE FOR THREE TIP CLEARANCES
AT FULL POWER TAKEOFF, FREE-FIELD CONDITIONS
Axlal Position Along Fuselage, X/D,from Plane of Rotation
BPF Aft ForwardHarmonlc -I.0 -.7 -.4 -.I .2 .5 ,8
O.5DClearance
0.SDClearance
I.ODClearance
1 I08.0 118.1 126.2 129.2 125.6 117.2 106.42 72.1 91.0 106.4 112.8 106.9 92.9 72.8
3 40.3 67.2 87.9 96.4 89.3 69.5 44.44 6.9 42.5 70,0 82.1 74.5 50.5 t7.55 -26.3 18.0 52.3 67.8 59.6 31.1 -9.8
OASPL 108.0 118.1 126.2 129.3 125.7 117.2 106.4
1 114.0 120.7 125.1 126.0 122.9 117.1 109.82 85.5 98.2 107.1 109.7 105.2 95.6 82.73 59.1 77,2 89.8 94.2 89.1 75,8 58.04 32.5 56.6 73.4 79.9 74.6 58.9 36.35 6.1 36.0 57.2 65,8 60.1 41.7 14.1
OASPL 114.0 120.7 125.2 126.1 123.0 117.1 109.8
1 I16.0 121.1 124.2 124.4 121.6 I16.8 llO.72 90.4 100.3 I06.7 108.l I04.3 96.5 86.1
3 66.4 80.6 90.0 92.9 88.7 78.1 63.44 42.6 61.5 74.2 78.7 74.3 61.9 43.6
5 18.9 42.5 58.4 64.6 59.9 45.5 23.5
OASPL 116.0 121.1 124.3 124.5 121.7 116.8 110.7
108

TABLE9.12, NEARFIELDNOISEFORTHREETIP CLEARANCESATDESIGNCRUISE,FREE-FIELDCONDITIONS
Axial Position Along Fuselage, X/D,from Plane of Rotation
BPF Aft ForwardHarmonic -.6 -.4 -.2 -.I 0 .3 .6
0.SDClearance 1 129.1 138.0 146.1 146.8 144.6 141.7 127.1
2 123.4 138.3 143.9 142.6 141.1 136.8 115.1
3 124.0 135.8 138.1 134.0 132.6 135.8 123.04 119.9 131.8 134.0 127.7 127.2 131.6 118.8
5 I15.8 128.3 124.8 125.2 I18.7 127.6 ll6.1
0.8D
Clearance
OASPL 131.5 142.8 148.7 148.4 146.4 144.0 129.4
1 133.5 140.4 143.8 143.3 141.6 141.7 133.2
2 131.6 140.0 141.0 139.4 138.6 137.2 126.53 130.7 135.7 134.6 130.4 130.4 133.2 130.3
4 127.5 129.8 130.3 124.3 125.0 127.8 127.6
5 124.5 125.0 ll5.0 122.1 I16.4 124.1 127.0
I.ODClearance
OASPL 137.6 144.l 146.1 145.0 143.6 143.6 136.7
] 135.4 140.5 142.3 141.5 140.1 140.9 135.22 134.3 I39.4 139.3 137.8 137.3 I36.3 130.1
3 132.3 134.8 132.3 128.8 129.1 131.7 13].44 128.3 129.4 127.4 122.8 123.7 126.2 128.5
5 124.7 126.8 I18.4 120.3 ll5.1 122.2 127.0
OASPL 139.5 143.9 144.4 143.3 142.2 142.7 138.4
9.3.4.2 Far-Field - Noise calculations for noise certification conditionsare summarized in Table 9.]3. The noise was ca]culated at l/2-second inter-
vals and integrated to glve the Effective Perceived Noise Level (EPNL) as re-quired in Federal Aircraft Regulations Part 36. The EPNL values are present-
ed in Table 9.13 for two types of calculations; l) assuming free-field condi-
tions (no ground reflections) and 2) assuming the measurlng microphone is 4feet above a grass-covered earth surface, as required for FAR-36 certifi-cation.
109
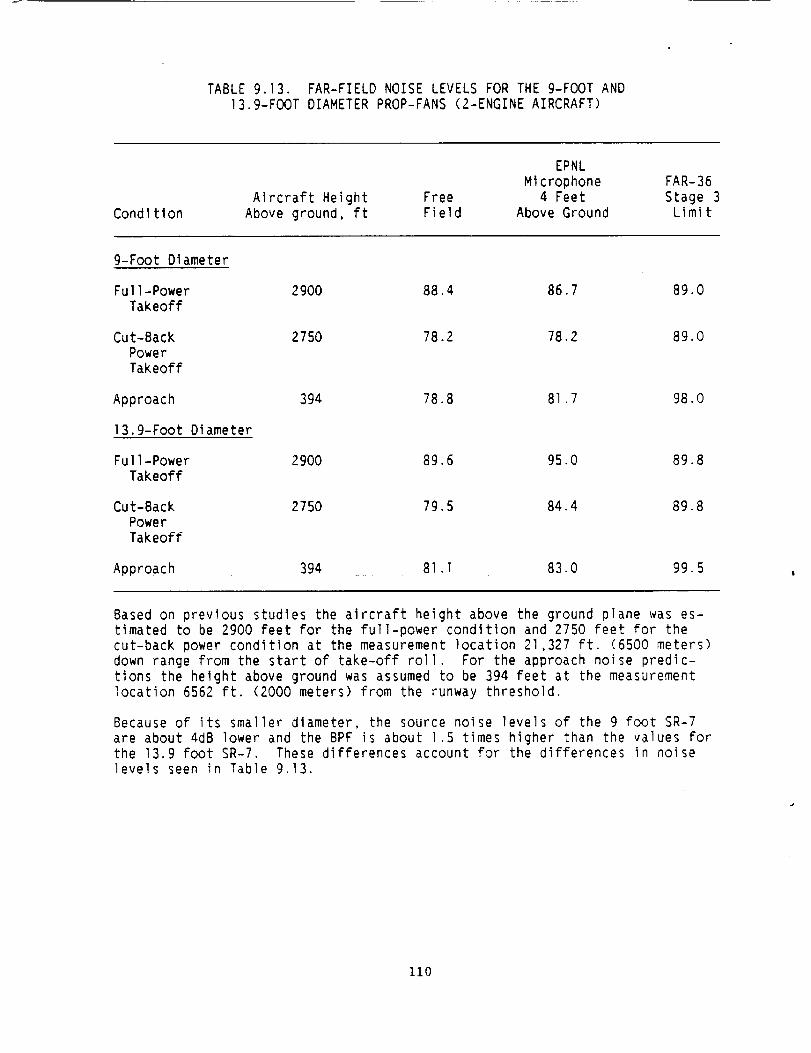
TABLE9.13. FAR-FIELDNOISELEVELSFORTHE9-FOOTAND13.9-FOOTDIAMETERPROP-FANS(2-ENGINEAIRCRAFT)
ConditlonAlrcraft Height
Above ground, ft
EPNLMicrophone FAR-36
Free 4 Feet Stage 3Field AboveGround Limit
9-Foot DIameter
Full-PowerTakeoff
Cut-Back
Power
Takeoff
2900 88.4 86.7 89.0
2750 78.2 78.2 89.0
Approach 394 78.8 81.7 98.0
13.9-Foot Diameter
Full-Power
Takeoff
Cut-BackPower
Takeoff
2900 89.6 95.0 89.8
2750 79.5 84.4 89.8
Approach 394 81.1 83.0 99.5
Based on previous studies the aircraft height above the ground plane was es-timated to be 2900 feet for the full-power condition and 2750 feet for the
cut-back power condition at the measurement location 21,327 ft. (6500 meters)
down range from the start of take-off roll. For the approach noise predic-tions the height above ground was assumed to be 394 feet at the measurement
location 6562 ft. (2000 meters) from the runway threshold.
Because of its smaller diameter, the source noise levels of the 9 foot SR-7
are about 4dB lower and the BPF is about 1.5 times higher than the values forthe 13.9 foot SR-7. These differences account for the differences in noise
levels seen in Table 9.13.
110

For example, the free-field EPNLvalues for the 9-foot SR-?are about 1.3EPNdBlower than those of the 13.9 Foot SR-7, although the source level is4dB lower. This is explained by the Fact that the EPNLIs frequency weight-ed, and the higher BPFof the smaller Prop-Fan is welghted more heavily thanthat of the larger.
The EPNLvalues are also dependenton the presence of the ground plane, be-cause the sound reflected from the ground plane can relnforce or interferewith the direct soundat the measurementmicrophone. The Frequencyof theincident sound determines whether reinforcement or interference occurs For agiven microphoneposition. As an example, consider the full power take-offflyover case. At 800 ft/sec tip speedthe BPFis 146.6 Hz For the 13.9 footdiameter Prop-Fan and 226.4 Hz for the 9 foot diameter Prop-Fan. For afour-foot microphoneheight the sound reflected From the ground will causemaximumreinforcement of the incident soundat 135 Hz and will cause maximuminterference (cancellation) at 210 Hz. Since the BPFof the 13.9 Foot Prop-Fan Is close to the reinforcement peak, the EPNLwith ground reflection isincreased 5.4 dB relative to the Free-field level, while the EPNLwith groundreflection for the 9 foot diameter Prop-Fan is reduced 1.7 dB relative to theFree field level by the cancellation. Thus, for a microphone located 4 ft.above a ground plane, the reduction in EPNLfor the reduction In diameter isI'.2 EPNdBdue to source noise reduction and an additional 7.1 EPNdBdue todifferent ground reflection effects.
At the power cut-back condition (tip speed reduced to 700 ft/sec) the BPF Isreduced for both diameters resulting in different ground reflection effects.The reduction in source level (free-field EPNL) due to power cut-back Is
about lO dB for both diameters. The BPF of the i3.9 ft. SR-7 is reduced from
the maximum reinforcement frequency and that of the 9-foot SR-7 Is reducedfrom the maximum interference frequency. Thus, the change in noise caused by
reduclng the diameter from 13.9 to 9 Ft. |s 4.9 EPNdB due to the effects of
ground reflection. These examples illustrate the dependence of the far-fieldnoise on Flyover geometry, showing that there is a complex interaction of di-ameter, blade passage frequency, and measurement microphone height above the
ground plane.
Finally, FAR-36 noise requlrements are shown in Table 9.13 For the two diame-ters at the take-off, cut-back take-off, and approach conditions. These lim-
its are based on alrcraft gross weight and number of engines. From HamiltonStandard studies, the aircraft weight with the 9-foot SR-7 was estimated to
be 50,200 lb. while that for the 13.9-foot SR-7 was estimated to be 121,O00
lb.
It is apparent from Table 9.13 that both the 9-foot diameter and 13-foot di-ameter SR-7's will meet the FAR Part 36 requirements with power cutback.
111

9.4 TESTBED-SIZE BLADE STRUCTURAL ANALYSIS
9.4.1 Introduction
A program to study the structural feasibllity of full-slze, high speed, ad-
vanced Prop-Fan blades was previously completed under Task 3 of this contractand reported in Volume I. As a continuation of that effort, this task es-
tablishes the preliminary design of a 2.74 meter (9 ft) diameter blade ofthis type. Results of the previous study were incorporated in the Initial
configuration selection process, along with preliminary parametric variations
of tip speed, number of blades, disk loading, thickness, chord width, and
blade stacking parameters of sweep and offset. The aero-acoustlc parametric
study is reported in Section 8.0. Many design iterations were required todefine an acceptable preliminary design which was also optimized (within costand schedule constraints) for structural integrity, aerodynamic efficiency,
low noise, aero-elastlc stability, high reliability, and ease of fabrication.
9.4.2 Selection of Initial Design Configuration
As mentioned in the introduction, results of a previous full-size blade fea-
sibility study, along with preliminary aero-acoustlc optimization studies,
were revlewed prior to the selection of an initial design configuratlon forthe SR-7 blade Unfortunately, the former study showed that the recommended,
aero-acoustically optimum design, would not be structurally feaslble. Thatis, a large number of thin, highly swept blades, built of conventional mater-
ials, most likely would not meet the stress, resonant frequency, and/or
aero-elastic stabillty requirements of a high-speed Prop-Fan Installation.In fact, without some sort of structural modification, all blades of the ear-ller full-slze study were found deflcient, relative to hlgh-speed aero-
elastic stability. Variations in external/internal geometry were not permit-
ted within the scope of the earlier full slze study. Therefore, additional
parametric structural studies were performed at the start of this program ontwo moderately swept blades from that earller study, prior to the selectionof an initial configuration. Also, stacking variations were explored as a
means of improving the stability of a small, highly swept, solid titanium,model blade (SR-5) found to be unstable durlng wind tunnel tests.
The two blades selected from the full-size study, for additional evaluation,
were the elghtand ten-bladed SR-3 configurations which had moderate sweep,
and conventional solid aluminum spars, covered with glass-fabric-reinforced,
epoxy resin shells. The individual effects on stability of changing tipchord width, center of gravity location, and resonant frequency level were
explored. Analysis showed that individual changes in these parameters forthe narrower, ten-bladed, SR-3 configuration produced only minor improvements
not capable of meeting high-speed stability requirements. On the other hand,
significant stability improvements were predicted for the wider, eight-bladed, SR-3 design. These were attained by moving the center-of-gravity
forward toward the blade leading edge, narrowing the blade tip width, and in-
creasing both the resonant frequencies and the degree of separation betweenthem.
112

An aerodynamic optimization study was also conducted, and reported in Sectlon8.4. Thls study examined the influence of tlp speed, number of blades, disk
loading, as well as thickness, chordwidth, and sweep distributions on effi-
clency, noise, fuel consumption, and direct operating cost. The baseline
blade design In this study was an eight-bladed design similar to the SR-3 de-sign. From a fuel consumption viewpoint, this study showed the followingmodlficatlons to be beneficial; increasing the number of blades, Increaslng
sweep, narrowing the blade tlp chord, and maintaining the blade thickness-to-chord ratio.
Since each of the above studies recommended dlfferent blade characterlstIcs,
compromises were required to yield a successful design. The blade chosen re-
sembled the SR-3 elght-bladed deslgn. This configuration is compared to the
baseline deslgn In Table 9.14. It was chosen for many reasons. Itsaerodynamic performance is nearly the same as the performance of the baselineblade. Stress results from the 3.35 m (ll ft) diameter SR-3 design study and
from the structural optimum study show that this SR-7 blade configuration can
be designed to satisfy the stress crlterla. Frequency results from the sametwo studies indicate that this configuration can also satisfy frequency
criteria. The stability study also recommended a modified SR-3 eight-bladed
design. Foreign object impact results for the SR-3 eight-bladed deslgn, in
the large-scale blade feasibility study, satisfled the design requirements;
Implylng that the SR-7 design should also satisfy the requirements.
TABLE 9.14. SR-7 DESIGN CONFIGURATION
Initial
Baseline Configuration
Number of Blades
Tip Diameter, m (ft)Tip Speed, m/sec (ft/sec)
Forward Speed, Mn
Tip Sweep Angle, de_Power Loading, KW/W'(HP/Ft 2)
EfficiencyNoise (BPF)
(Fuel Burned)
(Direct Operating Cost)
8 8
2.74 (9.00) 2.74 (9.00)244 (800) 244 (800)
0.8 0.8
39.8 36256.8 (32.0) 256.8 (32.0)
0.795 0.791143.2 144.5
Base +l.16 (greater)Base +0.69 (higher)
113

The fabrication concept chosen For the Initla] SR-7 design configuration was
the same as that assumed for the large-scale SR-3 elght-blade study. This
concept has a forged, solid aluminum spar; woven, fiberglass cloth rein-
Forced, epoxy resin shell; and Iightwelght Foam fil] in the shell cavities.This is a current, service-proven fabrication method, and hence eliminates
the need for developing new fabrication technology. The sheath material was
changed from titanium to nickel. Its higher density a_ds in moving the cen-ter of gravity forward which was shown to be beneficial to blade stability.
Using nlckel for the sheath material Is also a current, servlce-proven fabri-
cation process. Additlonally, the spar was moved toward the leading edge ofthe b|ade, again to move the center of gravity Forward for stability purposes.
9.4.3 Operatlng Conditions
The SR-7 preliminary blade design was analyzed to satisfy the design require-ments at two specific flight condltions. Design cruise and take-off climb.These are summarized in Table 9.15. The cruise condition was used to evalu-
ate high speed stability, frequencies, and elastlc deflections of the bladewhile the take-off/climb condition was used to evaluate combined steady and
cyclic stress levels as well as deflections. In addition to the above oper-
ating conditions, two overspeed cases were also analyzed to evaluate theblades ability to withstand high centrifugal forces due to inadvertent over-
speeds. The first is a 25% overspeed which produces, roughly, a 50% increaseIn load; while the second is a 40% overspeed, resulting In roughly twice the
centrifugal load. These latter two cases were analyzed only after a bladewas found which satisfied the requirements of the two flight conditions.
TABLE 9.15. FLIGHT CONDITIONS
Cruise Take-off/Climb
Velocity, MnAltitude, m (Ft)
Propeller Speed, rpmPower Loading, Kw/M _ (HP/Ft_) *Excitation Factor
0.8 0.2
I0,668 (35,000) Sea Level1698 1698256.8 (32) 570.7 (Tl.l)
- 4.5
"Based on 2.74 m (9 ft) diameter.
114
9.4.4 Design Evaluation Criteria
The SR-7 blade design criteria is specified In the design requirements docu-
ment, "Design Requirements for Advanced Turboprop Blades, SR-7" (reference
Appendix D).
The stress requirements are reproduced in Figure 9.21. Combined steady and
cyclic stresses are plotted on a modified Goodman diagram for comparison tomaterial allowables For each blade component. Deslgn stress allowables arebased on conservative assessments of each material's strength, environment,
slze factors as well as full-scale fatigue tests. Stresses for the take-
off/climb conditions condition were evaluated against the fatlgue require-
ments in Table 9.16.
TABLE 9.16. CRITERIA FOR STRESS EVALUATION
(I) High-cycle fatigue - designed for infinite life, i.e., I0a cycles.
(2) Low-cycle fatigue - designed for 50,000 start/stop cycles, from no stress
to peak stress.
(3) 25% overspeed - the steady stress shall be below the 0.2% offset yield
strength for homogenous metal materials, or below the 5% change in elas-tic modulus limit for fiber reinforced resin materials.
(4) 40% overspeed - the steady stress shall be below the utlimate tensilestrength for homogenous metal materials, or below the fracture limit forfiber reinforced resin materials.
In order to avoid dynamic magnification from operating too near a resonant
Frequency, resonance avoidance zones are speclfled at Integer orders (IP, 2P,3P, etc) of design RPM as shown in Figure 9.22. These zones are defined both
as a percentage of the rotational speed and the corresponding integer fre-
quency. The avoidance band Is I0% for 2-P during flight operating and in-creases to 20_ for ground operation due to potential exposure to rear-
quartering cross-winds Flowing over the wing and/or fuselage. This groundoperation percentage decreases with P-order, down to 2.5% for the 5-P inter-section.
The foreign object impact design criteria is summarized in Table 9.17, whichspecifies the size of the object and the damage limit for each impact sizeclassification. In terms of evaluating the blade designs, the moderate im-
pact criteria can be satisfied if the spar stress remains below the 0.2% off-
set yield stress, For homogenous metal materials, or below the 5% change inelastic modulus limit for fiber reinforced resin materials. The major impact
criteria can be satisfied if the spar stress remains below the ultimate ten-
sile strength, for homogeneous metal materials, and below the fracture limit,for fiber reinforced resin material.
115

in(tl
e_I-(n
Um.JU>._J
• DESIGN FOR IN FINIT_E+I-IFE DUE TO HIGH CYCLE FATIGUE (_10 O C_YCLES)• LOW cYcLE FATIGUE IS BASED ON 50.000 START/STOP CYCLES FROM
NO STRESS TO PEAK STRESS• DESIGN LIMITS BASED ON CONSERVATIVE ASSESSMENT OF MATERIAL STRENGTHS,
ENVIRONMENT. SIZE FACTORS. AND ON FULL SCALE FATIGUE TESTS
_70 • OVERSPEED CRITERIAA) 25_ O.S. BELOW YIELD
4 B) 40._ O.S. BELOW UTS
FIGURE 9.21 DESIGN STRESS CRITERIA
116

NO RESONANCE
PERMITTED IN FLIGHT
),.Uz[,J
OruJ
Lh
I,-Z
Z0
b4
lada'C,,.Itel
GROUND
OPERATION
IP
G SPEED
ROTATIONAL SPEED
FIGURE 9.22 DESIGN FREQUENCY CRITERIA AVOIDANCE ZONES
117

Minor Impact
Moderate Impact
Major Impact
TABLE 9.17. FOREIGN OBJECT IMPACT CRITERIA
- Sand, small stones, up to 4 oz. birds
- No damage to basic blade structure- Continued operation
- 2 inch hailstones, up to 2 pound birds- Loss of material or alrfoil distortion acceptable
- operatlon at 75% power for 5 minutes- No metal fragments will penetrate fuselage- Rotor unbalance force <5000#'s
- Up to 4 pound bird- Loss of material or airfoil distortion acceptable
- Ability to feather- No meta| fragments will penetrate fuselage- Rotor unbalance force <25,000#'s
118
The design criteria for blade stability Includes requirements for high speed(unstalled flutter) as well as low speed (stall flutter). The onset of the
unstalled flutter is not permitted to occur below the Mach number/flutter
boundary offset from flight profile as shown in Figure 9.23. In addition the
predicted onset of unsta|led flutter at 4267 m. (14,000 ft) must be greaterthan 0.8 m to allow testing In the Modane wind tunnel. These unstalled flut-
ter requlrements are to be met with blade frequencies degraded by 15_ at alloperating speeds, up to I05% of the normal maximum. The propeller must also
be free of stall flutter up to 120% maxlmum (baseline) power at lO0_ rpm.
9.4.5 Calculation Technlque
Finite element analysis was used to calculate the deflections, stresses, res-
onant frequencies and mode shapes of the SR-7 blade design. The finite ele-ment model is illustrated in Figure 9.24. An In-house three-dlmensional fln-
ite element analysis program, BESTRAN, was used as the primary analysis pro-
gram. BESTRAN is very similar to NASTRAN. In fact, comparative analyses ofan intermediate blade design, conducted part way through this design itera-
tion process, showed the two programs yielded identical results. Results ofthe comparative analyses are presented at the end of this section. In the
past, the BESTRAN method has also been confirmed through correlation of pre-dicted versus measured deflections, stresses, and frequencies of spar/shell
blades. Also, a variety of pre- and post-processors, available only for
BESTRAN, at the time, gave it a clear advantage for use as an Iterative tool.
For each operatlng condition, a spanwlse distribution of in-plane and out-
of-plane airload was obtained. These alrload distributions were integratedand converted to resultant forces acting at each of the specific finite ele-
ment model stations. This force was then distributed equally among the nodes
across the model station, except at the leading and trailing edge nodes where
no force was applied. Thls procedure was performed at the take-off/climbcondition for both the steady-state and cyclic alrloads, since blade combinedstresses were evaluated at this condition. The forces for the steady-state
cruise condition, on the other hand were not distributed across the chord
since thls condition was used only as an indicator of cruise deflectlons and
steady-state stress in the blade.
The steady-state operating conditions were analyzed using the steady-stateairloads as well as the centrifugal loads and differential stiffening effects
caused by rotation. The cycllc operating conditions were analyzed using the
differentia] stiffening effects from the steady state case, and applying the
cyclic alrloads due to an equivalent excitation factor (EF), adjusted to ac-count for flow distortion through the plane of the propeller. As specified
in the design requirements, the basic EF attributed to IP (once-per-revolution) excitation is 3.30. However, an additional amount of excitation
was lumped into the IP cyclic analysis to account for potential higher-order(riP)harmonics. This raises the total equivalent EF to 4.5. The assumed
magnification factor is I.O for the IP excitation and 3.0 for the nP excita-tions.
119
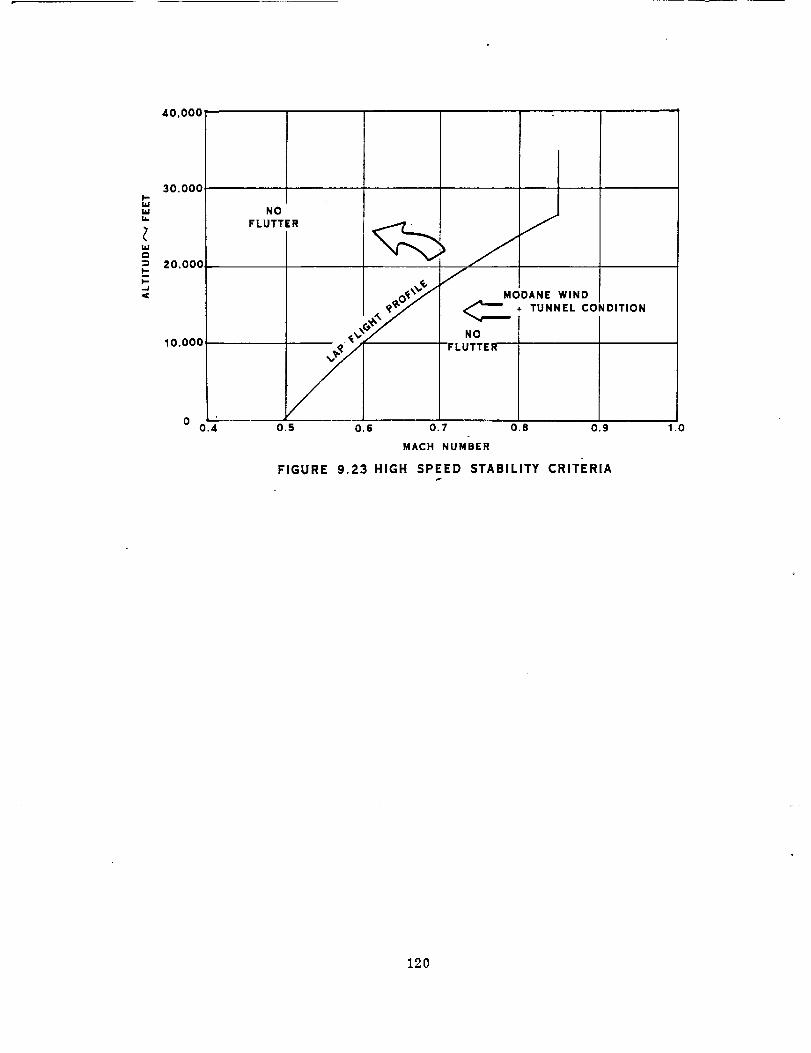
I"bkl
ZL
I,IJ
I"UI--l..J
"C
40,000
30,000
20,000
10,000
00.4
NOFLUTTER
PL
J
DITION
JMOOANE WIND
'_, + TUNNEL CON
NOFLUTTER
1.00.5 0.6 0.7 0.8 0.9
MACH NUMBER
FIGURE 9.23 HIGH SPEED STABILITY CRITERIAf
120

x
ELEMENT MODEL
121

An empirically derived correction factor was applied to the cyclic stressesbecause measured IP response stresses for small, solid metal, swept bladeswere higher than the calculated stresses. Thls correction factor varied withradius as is shown in Figure 9.25. The factor was applied only to the cal-culated cyclic stresses for the blade.
Resonant frequencies and mode shapes were calculated using a hybrid finiteelement technique requiring both BESTRAN and NASTRAN solution codes. Themass, stiffness, and differential stiffening matrices were calculated usingBESTRAN. These matrices were then modified to represent appropriate Inputfor the NASTRAN elgenvalue solver. This technique yielded the primary fre-quencies and mode shapes very quickly. Experience has shown these results tobe in excellent agreement with those obtained from lengthy BESTRAN determin-ant search methods.
The second BESTRAN method employed the same solution process except that it
was repeated in a stepwlse manner, Increasing the load between each step, and
correcting the model for deflection and cumulative differential stiffness,based on cumulative stress. This latter method provides a better approxima-tion of blade non-11near behavior. (Reference 29).
The final two methods employed the NSC NASTRAN code. The NASTRAN FEA modelwas generated by converting the multi-layered BESTRAN model to an equivalentsingle-layered NASTRAN composite element model. The first NASTRAN method isan iterated solution capable of accounting for large displacements. Theloads are first applied/generated In the statlc position to determine an ap-proximate deflected posltion.
Subsequent solutions utilize the last deflected position to recalculate the
loads for application once again to the static model. Relative strains/displacements are compared after each calculat$on until they fall within ac-
ceptable tolerance bands, which is indicative of achieving equilibrium. Thesecond NASTRAN method involved a piecewise linear technique, based on the
similar BESTRAN'procedure of small, linear, load steps described above.
During blade design iterations on the SR-7 blade, one intermediate design wasselected to evaluate differences between various finite element solution
techniques. Excellent agreement was found among the varlous methods. Re-sults are presented below for comparison purposes.
The first two techniques involve solutions with the BESTRAN code. In the
first method, centrifugal loads and airloads are applied to the static geome-try in a single load step. Differential stiffenlng is employed to account
for restoring centrifugal effects.
122
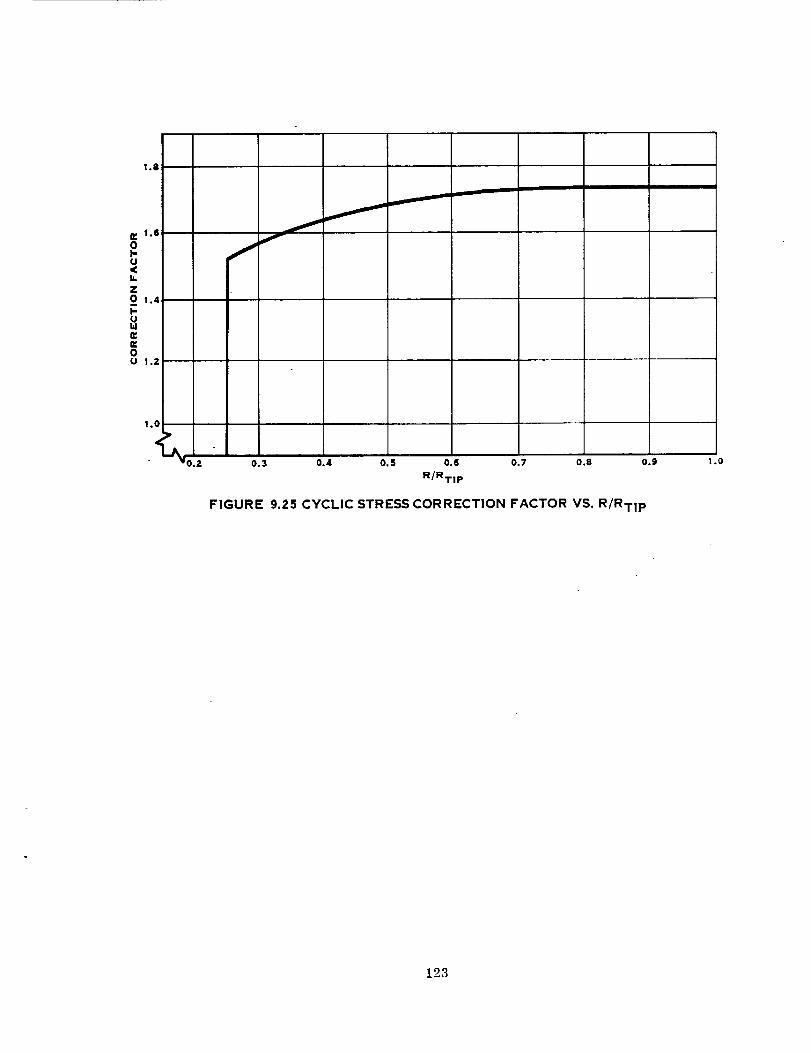
1.8
n, !.6oI-u<Ii.
Z0 !.4
I-uILlr_r_0U 1.2
......--,, mmmmmmmmmmmmmm
!.0
I_A0.2 0.3 0.4 0.5 O.6 0.7 0.8 0.9
R/RT! P
FIGURE 9.25 CYCLIC STRESS CORRECTION FACTOR VS. R/RT! P
1.0
123

Deflection results from the different analytical techniques are compared inFigures 9.26 and 9.27, while frequencies and stabilitles are compared inTable 9.18. Steady-state deflection contours for both methods are shown inFigure9.26. The cumulative piecewise linear deflectlons of the blade tip,using BESTRAN and NASTRAN, are compared in Figure 9.27. Table 9.18 lists theresonant frequencies and the stabilities based on the corresponding modeshapes. The latter results were not calculated using the NASTRAN plecewlselinear method. Stress comparisons are not possible because stresses for theMSC NASTRAN element were not available and/or valid at the time of calcula-tion. In all cases, the methods show excellent agreement.
TABLE 9.18. COMPARISON OF ANALYSIS METHODS(STEADY-STATE CRUISE CONDITION)
BESTRAN NASTRAN
ITEM One Load Iterated
Step P.W.L. @ Full Load P.W.L.
Tip Defl.@ Mid Chord 0.861 0.842 0.846 0.849
Resonant
Frequenciesl 42.5 42.6 41.I2 73.8 73.9 74.0
3 I03.8 103.9 IQ2.7
4 145.3 144.7 136.3
5 177.4 177.8 173.46 226.4 225.1 211.8
NotCalc'd
StabilityIsolated Blade 1.01Mn l.Ol Mn 0.98 Mn NotAt Sea Level Calc'd
9.4.6 Design Procedures
Two computerized procedures were developed to aid in the finite element de-
sign iteration process. The first was a code which provided quick conver-sions between aerodynamic 3-D stacking (global x, y, z coordinates of mid-
chord) and structural stacking (sweep and offset, measured parallel and nor-
mal to chord). See Figure 9.28. The second procedure provided rapid capa-bility to modify geometric aistributions of an existing finite element mod-
el: stacking, blade chord and/or spar widths, as well as blade thickness,
with or without accompanying shell thickness variations. See Figure 9.29.
124
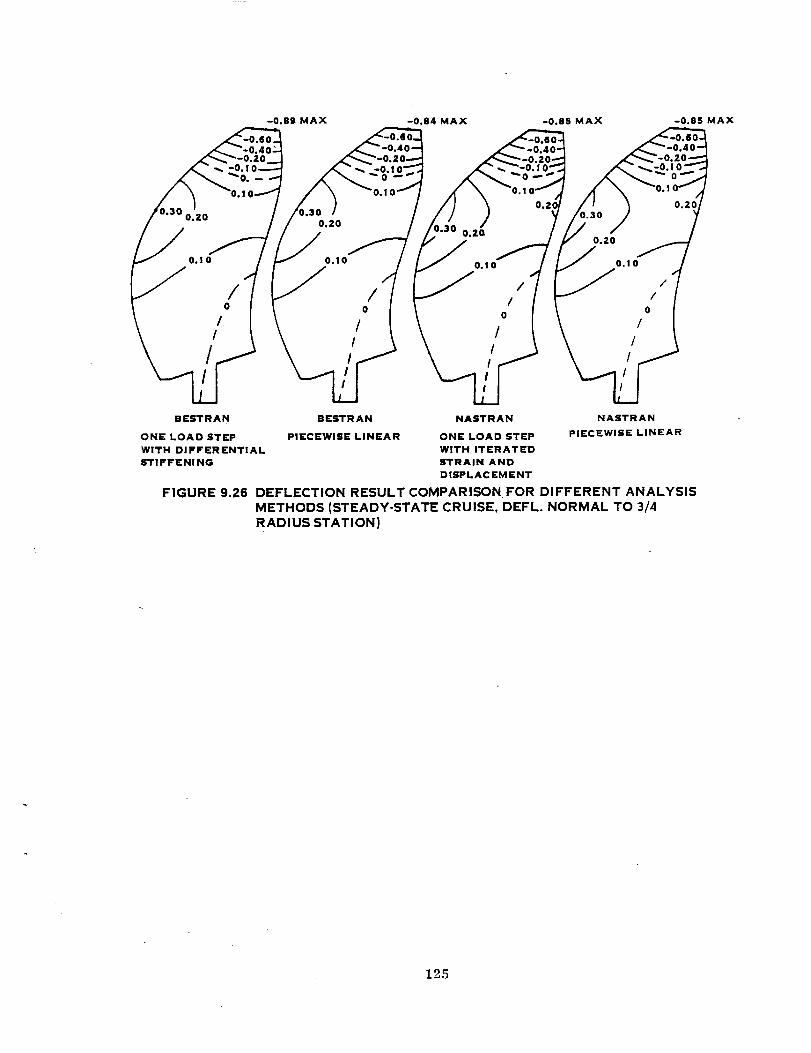
-0.89 MAX -0.84 MAX -0.85 MAX -0.85 MAX
__ o_:_:_ooo._ S._o:°_i _.-o_-- °!W/ 1._4 ,.;.--o., t_ _'l o._;_loi_l/o.,_!l°_° , /.& i I)"" I_o.,o_ / !_o.,o-'-7./ o.,o
/ o,7 0,'7 o,"1/ // //
BESTRAN BESTRAN NASTRAN NASTRAN
ONE LOAD STEP PIECEWISE LINEAR ONE LOAD STEP PIECEWISE LINEAR
WITH DIFFERENTIAL WITH ITERATED
STIFFENING STRAIN AND
DISPLACEMENT
FIGURE 9.26 DEFLECTION RESULT COMPARISON FOR DIFFERENT ANALYSIS
METHODS (STEADY-STATE CRUISE, DEFL. NORMAL TO 3/4RADIUS STATION)
125

1,0 _'
Z .80I-
_J[,J,.Ila.
e_
0z
:E
eL
.2
./o/
0
I ITOTAL TIP DEFLECTION
VERSUS
PERCENT LOADi
NAS"RAN--
L
f
BESTRAN
20 40 60 80 100
PERCENT LOAD
FIGURE 9.27 PIECEW1SE LINEAR RESULT COMPARISON FOR DIFFERENT
ANALYSIS METHODS (STEADY-STATE CRUISE)
126

AERODYNAMIC STACKING 5TR'UCTURAL STACKING
XYZ
x -_
Y
--" ""-'- _PED
_ CONICALGEROMETRY
iy]zSWEEP OFFS
6.. _'PROJECTED) ,
_ _--,
I GEOMETRY
.FIGURE 9.28 GEOMETRY CONVERTER
127
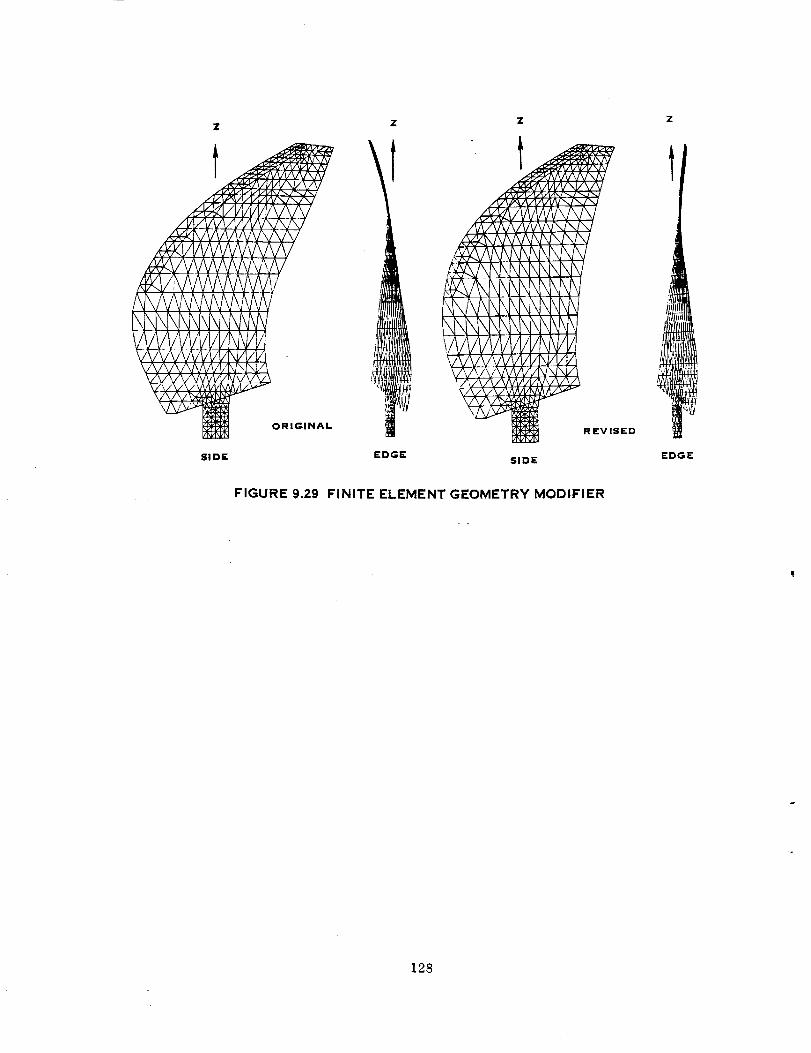
Z
t
SIDE
ORIGINAl.
FIGURE 9.29
z
EDGE
Z Z
__ REVISED
SIDE EDGE
FINITE ELEMENT GEOMETRY MODIFIER
128
For expediency, early finite element models, and analyses of those modelswere conducted with the blade already In the desired aerodynamic posltion.It was assumed that deflections would be nearly linear and the the blade.cou]d be "pre-deflected" an amount equal and opposite to that predicted usingthe desired aerodynamic position, thereby defining the static posltion formanufacturing. This assumption was later studied as described below. Finiteelement differential stiffenlng terms were utilized for both the steady stateand resonant frequency analyses, again, using the model geometry corres-ponding to the desired aerodynamic position. Many iterations were performedusing the stacking geometry converter and finite element model modiflerprogram described earlier.
Criterla evaluated In most iterations for the design included aero/acoustic
performance (in terms of fuel burn and Direct Operating Cost (DOC)), steady-state deflection and stress, resonant frequency placement, mode shapes, and
aero-eIastlc stability. Steady state and cyclic stress were also combined toevaluate blade llfe at the take-off climb condition. Finally, preliminary
configurations were established which met the design criteria.
9.4.7 Pre-deflection Study
The objective of this study was to identify a blade design that not only sat-isfled the design criteria, but also attained the desired aerodynamic shape
when deflected under load at the Design Cruise condition. The process of de-
terminlng the static geometry that deflects to the deslred aerodynamic shapehas been termed pre-deflecting the blade. The resulting static shape is
called the pre-deflected geometry. In the iterative blade design process,the BESTRAN single load step analysis was used as the primary analytical
tool. The designs were not pre-deflected, since it was assumed that the
blade would behave almost linearly. That Is, the analysis results from ap-plying the loads to the blade geometry in the desired aerodynamic position
would be nearly the same as the analysis results from applying the loads tothe blade in the pre-deflected position. This process was continued until
the design satisfied the stress, frequency, and stability criteria before
pre-deflecting.
At this point, a pre-deflectlon analysis was performed on the blade geome-
try. The pre-deflected statlc geometry was iterated using the BESTRAN single
load step analysis until the operating geometry was sufficiently close to thedesired aerodynamic shape. The analysis results of this pre-deflected geome-try were then compared to the design criteria. This design was also studied
using a BESTRAN piecewise linear analysis. It was anticlpated that the
results from the single load step analysis and the piecewise linear analysiswould be similar.
In practice, the results from the single load step analysis of the initial
pre-deflected geometry exhibited significantly higher deflections, higherstresses, and lower stability, as compared to the results before pre-deflect-
ing. At this point, a NASTRAN single load step iterated solution was per-
formed on the blade design, and it confirmed the high deflections.
129
Iteratlons were continued on the blade deslgn that existed before pre-deflecting until the deflections were reduced. This deslgn was pre-deflectedand analyzed, but its deflections were very similar to the deflections of theprevious pre-deflected blade deslgn. Pre-deflecting the blade was thendropped as a design procedure slnce the beneflclal characteristics of theinitial geometry were belng changed by pre-deflection. Instead, thepre-deflected geometry was modified and analyzed, and these iterationsresulted in a blade design that satisfled the design requirements.
9.4.8 Design Iteration Sequence
The iteration process to find an acceptable design turned out to be very
lengthy. Nearly sixty configurations were considered; forty of those werefully analyzed. As the iterations progressed, parametric trends were de-
duced; and these trends were used in the determination of the next configura-tion to be analyzed. This section will review this iteration sequence and
will highlight important designs during that sequence.
The initial SR-7 configuration analyzed structurally (#I) had excellent
stability (unstalled flutter), but had unacceptable combined stress in theshell, had poor frequency placement and had high steady-state deflections.
Seven iterations were then performed as an attempt to reduce the steady
stress. The resulting design (#5C) had a wider spar in the high stress area,and had a greatly different offset distribution. This design had lower
steady-state deflections and lower steady-state stress than design #1.However, the design was still overstressed (from combined steady and cyclic
stress results), had unacceptable frequency placement, and had extremely lowstability. The first mode shape deflection isocontour plot showed increased
coupling between the torsional and bending mode of the blade, as compared todesign #3. Design #5C also had lower values for fuel burn and DOC, both of
which are related to aerodynamic efficiency and noise calculations.
Since the most significant difference between designs #I and #5C was in theoffset distribution, an intermediate offset curve was chosen for the next de-
sign to determine why the stability decreased drastically from #1 to #5C.Two iterations yielded design #6A. This design had reduced tip thickness,
and an offset curve midway between #1 and #5C. Analysis of #6A showedsteady-state deflections that were slightly higher than #5C but still lowerthan #1. Steady-state stresses were comparable to the stress of #5C. Com-
bined steady and cyclic stressing was not calculated for #6A, but was ex-
pected to be similar to those of #5C, since the steady stress was similar.
Hence, since #5C was overstressed, the stresses in #6A will probably need to
be reduced in order to be acceptable. Design #6A had unacceptable frequencyplacement, but significantly higher stability, although the stability wasstill not acceptable. The dramatic increase in stability was due to the
change in mode shapes. The increase in edgewise stiffness due to reducing
the amount of tip offset reduced the amount of bending and torsional couplingin the first few modes. (These modes are the most influential in stability
calculations.) In aqdition, design #6A snowed significant reduction in fuelburn and DOC.
130
Twotechniques were then used to increase the thickness of the blade in thehigh stress region in order to reduce this stress. In the first, design #6C,the thickness-to-chord (t/b) ratlo was increased in the region of highstress. The resulting deflections were slightly lower than design #6A. The
steady stress in the spar Increased slightly, but the shell steady stress de-
creased slightly. Most Importantly, the combined stress showed a great Im-
provement over design #5C. The shell combined stress was now marginally ac-ceptable, although the spar stress was unacceptable. In addition, the
stabllity was also not acceptable, but the frequency placement was good. Theperformance was simllar to #5C, which was worse than #6A. Hence, increaslng
the t/b ratlo helped the structural design, but hurt the aerodynamic per-Formance.
The second technique increased the chord-to-dlameter (b/D) ratio in the area
of high steady stress, while maintaining the t/b ratio of #6A. In thls de-sign, #7, maintaining the t/b ratio kept the performance similar to #6A. The
steady-state deflections and stress was similar to #6A, while the stabilityshowed a slight Increase. Based on the results of these two designs, an in-crease in the overall thickness of the blade should be done by changing the
b/D ratio and not by changing the t/b ratio, In order to maintain aerodynamic
performance.
Since design #6A had shown an improvement In stability compared to #5C, ad-ditional modificatlon of the offset curve was pursued in attempts to ralse
the stability to an acceptable level. These iterations resulted in deslgn#13.
In this design, the sweep was reduced slightly and the offset was also re-duced. This combination of sweep and offset curves produced a static geome-
try with a _'straight leading edge", that is, the leadlng edge region of theoutboa1"d half of the blade was visually allgned nearly in a plane. This
should increase the edgewise stiffness of the blade in the same manner that a
flat plate has a higher edgewise stiffness than a curved plate.
Analysis results of design #13 showed excellent stability, higher than thatof #6A and #I. The change in mode shapes was agaln responsible for the sta-
bility increase. The mode shapes for #13 showed even less coupling in the
bending and torslonal behavior than in #6A. Frequency placement and steady-state deflections were satisfactory. The performance of #13 was the lowest
of all designs studied thus far, primarily due to the decrease in sweep.Comblned stress results were similar to #6C with marginally acceptable shell
stress and unacceptable spar stress. This design demonstrated that the sta-bility is very sensitive to the amount of bending and torsional coupling in
the mode shapes, and that this coupling can be controlled by the blade stack-
ing (i.e., sweep and offset).
131

To regain some of the performance that was lost in design #13, design #14 had
a sweep midway between #13 and #6A, which had very good performance. Theoffset had less curve than the average of #13 and #6A. Most Importantly, the
stability was less than both #13 and #6A. Hence the amount of curvature inthe offset distribution in the outboard region of the blade also has a signi-
ficant influence on blade stability.
Blade #14 had performance results that were nearly the same as the initialdesign #1. The steady-state stresses were the lowest of all the designs
studied thus far, apparently due to the reduced sweep. Since designs #13 and
#14 showed that stability can be improved by changes In the offset distribu-tlon, the obJectlve of the next set of Iterations was to reduce the combined
stresses to an acceptable level, while maintaining stability.
The result of these iterations was design #18A. Thls design had the sweep
distribution from design #14 and all other characteristics from design #7.
The analysis results showed this design had satisfactory combined stresslevels and frequency placement. However, the stability and performance val-
ues were slightly less than desired, and the steady-state deflections were
slightly more than desired.
The offset curve was then modified to produce the straight leading edge ef-
fect used in design #13. These iterations produced deslgn #1BE. The stabil-
Ity increased to an acceptable value, and the frequency placement remainedacceptable. The combined stress levels improved above the satisfactory val-
ues from design #18A. Steady-state deflections were slightly higher and per-
formance was slightly lower than desired. However, the values for blade #1BEwere accepted.
The second phase of the blade design iteration sequence was then initiated:
pre-deflectlng the blade design. Design #18E was pre-deflected from its de-
sired position, and this new static geometry, #ISE(PRE), was analyzed. Theresults showed that thls pre-deflected design had unsatisfactory steady-statedeflections and stresses, and unsatisfactory combined stress levels. Stabil-
ity dropped to slightly below the acceptable level. Only the frequencyplacement and performance were satisfactory. A NASTRAN single load step it-erated solution (ref. Para 9.3.7) was performed on #18E(PRE) and predicted
similar steady-state deflections.
After several iterations to reduce sweep and modify chordwidth and thickness
In the high stress area, design #20A was reached. In its initial geometry(not pre-deflected geometry), this design satisfied all criteria, except its
performance was very poor. The steady-state deflections, at the tip, wereone-third less than the deflections of #18E. As a confirmation of the
steady-state deflections of #20A predicted by the BESTRAN single load step
analysis, three other methods of analysis were also used on #20A. (The re-
sults presented in Flgure 9.26 are based on these four analyses.) A
132

BESTRAN plecewise linear analysis was performed to verify the linear behaviorof the blade design. Since the results of the single load step analysis andpiecewlse linear analysis demonstrated excellent agreement, the use of the]inear, single load step_analysls is justified as-ah analysis method. ANASTRAN single load step, iterated solution was the second method that wasused to check results. The predicted deflections were in excellent agreementwith the two BESTRAN analysis results. NASTRAN frequency results showedslight variations In certaln modes, due to differences in the element formu-latlon between the two programs, but nonetheless, the results are in verygood agreement. A NASTRAN plecewlse linear analysis also showed excellentdeflectlon agreement. The stabIllty predictions based on the mode shapesfrom the first three methods showed excellent correlation.
Because blade #2OA satisfied a|] preliminary design criteria (although it had
very low performance), and since the deflections of #20A were significantlyless than those of #1BE, a pre-deflectlon analysis was performed on design
#2OA. Once a pre-deflected blade design is found that satisfles the design
criteria, further iterations on the pre-deflected geometry would be performed
to increase the performance level, if necessary. The pre-deflected blade#20A(PRE) was expected to have lower stress and deflections than #18E(PRE)because the deflections of #20A were much less than those of #1BE. However,
analysls results of blade #20A(PRE) showed deflections nearly as high as thedeflections of #18E(PRE). The steady-state stresses were similar to #1BE,and the combined stress results showed #2OA(PRE) to be overstressed.
Since analysis of both pre-deflected blade designs #18E(PRE) and #2OA(PRE)
yielded results that were drastically different from the analysls results of
thelr initial geometries, some beneficlal characteristic of the Initial ge-ometries was apparently being eliminated by pre-deflecting. Since the de-
flection patterns showed that the offset increases toward the tip on designs#1BE and #2OA, the stralght leadlng edge concept that was developed in design
#13 is being eliminated by pre-deflecting the geometry. The straight leading
edge concept was shown to be responsible for increasing the edgewise stiff-ness and uncoupllng the bending and torsional behavior of the blade. Theseeffects increased the stability and tended to reduce the steady-state deflec-tions. Therefore, the declsion was made to incorporate the straight leading
edge concept in the static blade shape and not to pre-deflect the blade ge-ometry to obtain the running shape. The blade performance would be evaluated
for the resulting operating geometry of the blade.
For design #21, the sweep was increased over the sweep of design #2OA toraise the performance. The results of the analysis showed satisfactory com-bined stress levels, frequency placement and stability. The performance was
slightly less than desired, but was acceptable. Blade design #21 was thusaccepted as the final blade iteration in this study.
133
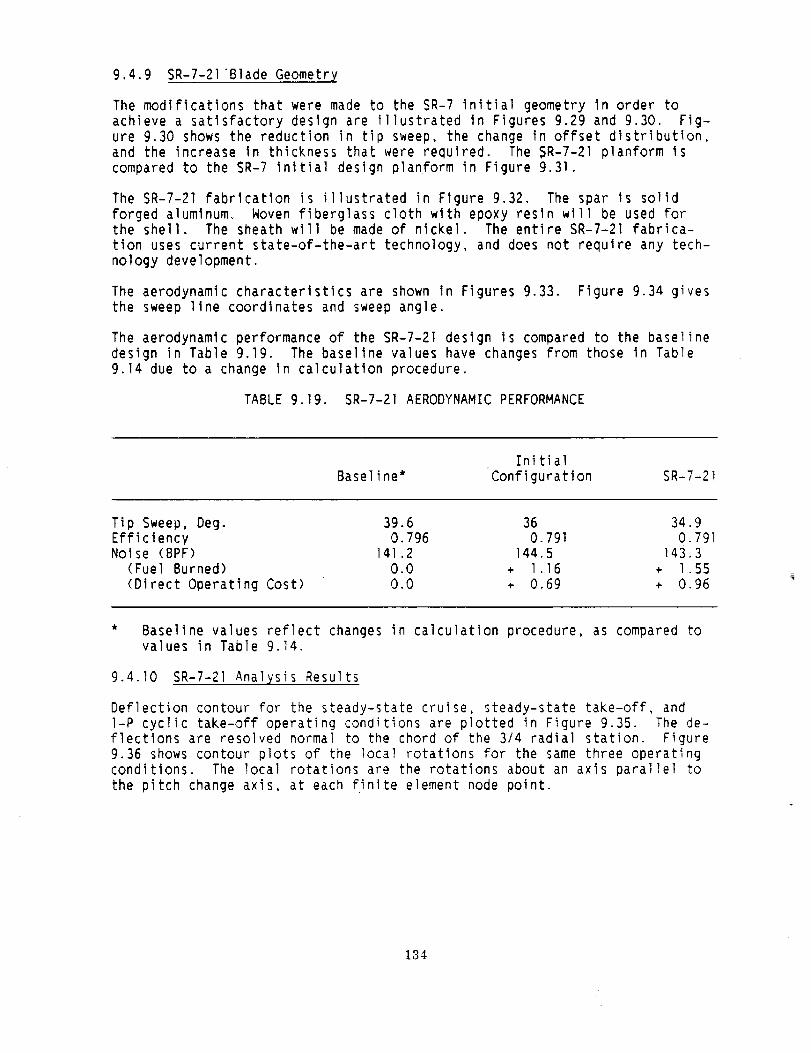
9.4.9 SR-7-2l'Blade Geometry
The modifications that were made to the SR-7 Inltial geometry in order toachieve a satisfactory design are i11ustrated In Figures 9.29 and 9.30. Fig-ure 9.30 shows the reduction in tip sweep, the change In offset distribution,and the increase in thickness that were required. The $R-7-21 planform iscompared to the SR-7 inltial deslgn planform in Figure 9.31.
The SR-7-21 fabrication Is iIIustrated in Figure 9.32. The spar is solld
forged aIumlnum. Woven fiberglass cloth with epoxy resin will be used forthe shell. The sheath will be made of nickel. The entire SR-7-21 fabrica-
tion uses current state-of-the-art technology, and does not require any tech-
nology development.
The aerodynamic characteristics are shown in Figures 9.33. Figure 9.34 givesthe sweep llne coordlnates and sweep angle.
The aerodynamic performance of the SR-7-21 design is compared to the baseline
design in Table 9.19. The baseline values have changes from those in Table9.14 due to a change in calculation procedure.
TABLE 9.19. SR-7-21 AERODYNAMIC PERFORMANCE
Initial
Baseline* Configuration SR-7-21
Tip Sweep, Deg. 39.6 36 34.9Efficiency 0.796 0.791 0.791Noise (BPF) 141.2 144.5 143.3
(Fuel Burned) 0.0 + 1.16 + 1.55
(Direct Operating Cost) 0.0 + 0.69 + 0.96
Baseline values reflect changes in calculation procedure, as compared tovalues in Table 9.14.
9.4.10 SR-7-21 Analysis Results
Deflection contour for the steady-state cruise, steady-state take-off, and
l-P cyclic take-off operating conditions are plotted in Figure 9.35. The de-flections are resolved normal to the chord of the 3/4 radial station. Figure9.36 shows contour plots of the local rotations for the same three operating
conditions. The local rotations are the rotations about an axis parallel to
the pitch change axis, at each Finite element node point.
134

/
//
t
\
DESIRED /
OFFSET FOR
• LOW STRESS
fOFFSET REQUIRED
FOR STABILITY
OFFSET
L__.__J-1.O O 1.O
T/B
• TIP SWEEP REDUCED
• OFFSET DICTATED BY STABILITY
REQUIREMENTS
• THICKNESS RATIO iNCREASED
SLIGHTLY i
INCREASED THICKNESS
D TO REDUCE STRESS)
ROOT TIP ]
RADIUS
FIGURE 9.30 DESIGN MODIFICATIONS NECESSARY TO ACHIEVE SATISFACTORY
DESIGN
135
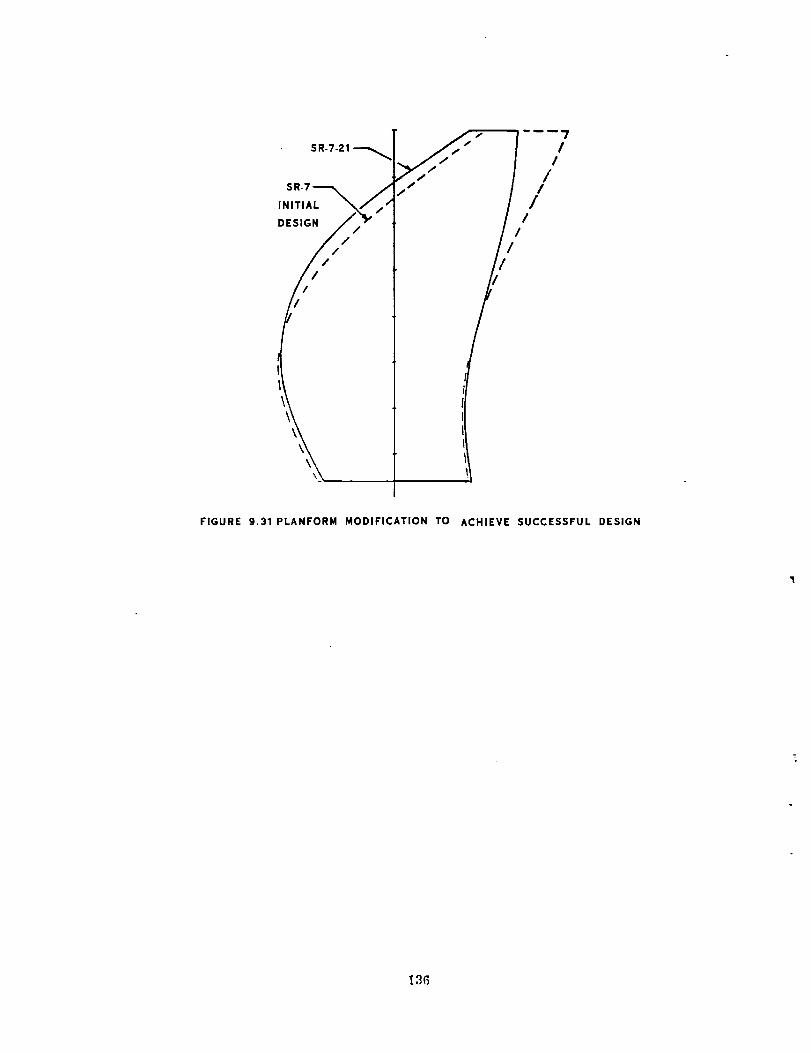
\\
___"" 1--f 7/
/
/
/
FIGURE 9.31 PLANFORM MODIFICATION TO ACHIEVE SUCCESSFUL DESIGN
I36
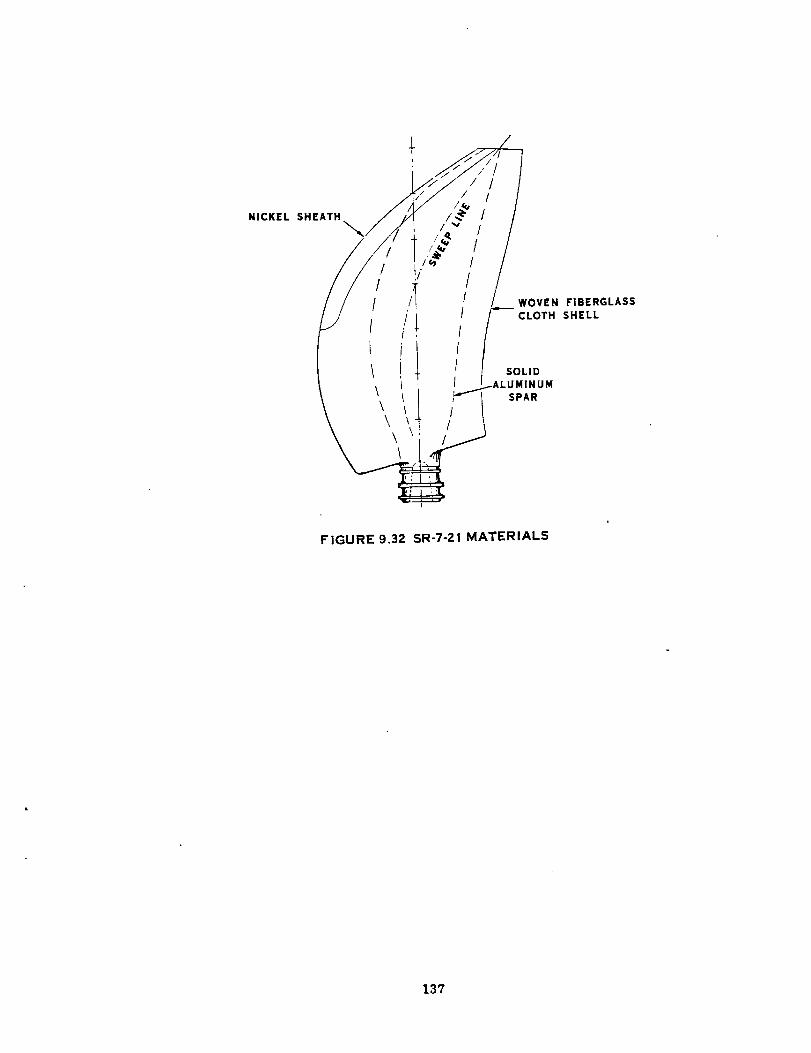
N-ICK£ L SHEATH
I /i ' / WOVEN FIBERGLASS
/,/i /7-o_o.._._..i _ ii /l i i_ ,_ ,0.,o
FIGURE 9.32 SR-7-21 MATERIALS
137
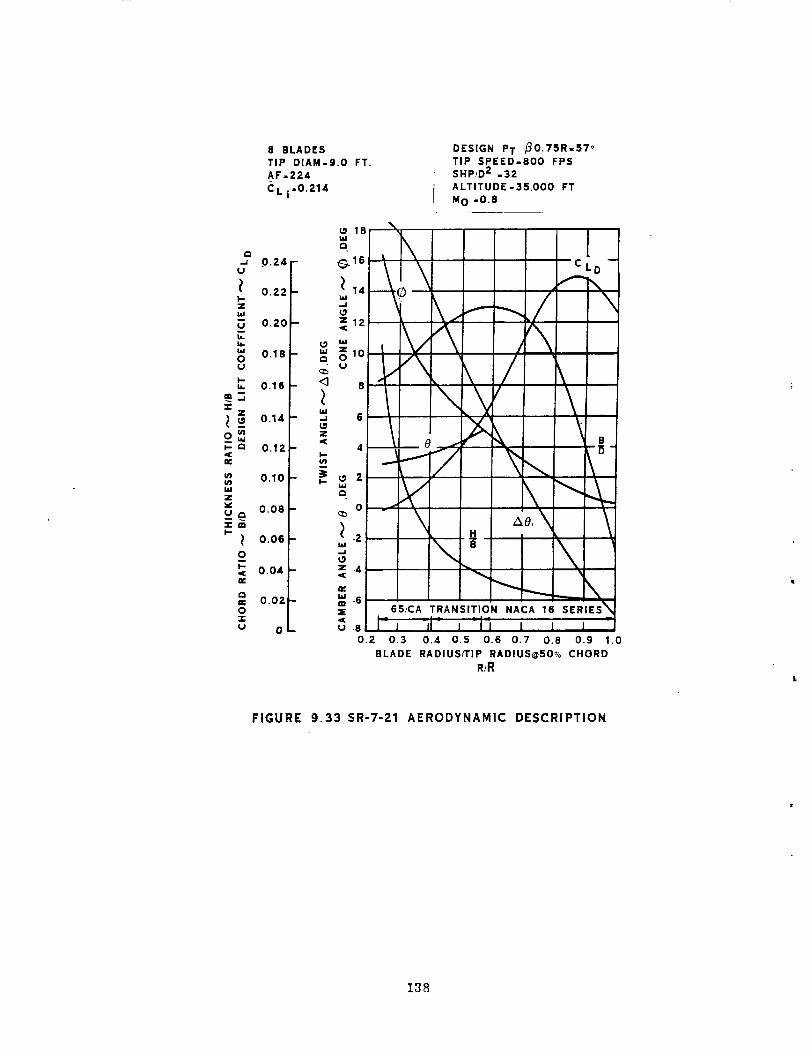
8 BLADES
TIP DIAM=9.0 FT.
AF-224
C L i-0.214
DESIGN PT /30"75R'57°
TIP SPEED-800 FPSSHP/D 2 -32
i ALTITUDE =35,000 FTM 0 _0.8
0 18 "n /
° \ 1a
G. 16 L CL D
512 "t •
a
<1 8 _"
.i / \ /B
4 0 --"
0 w j
° \ \_-z H_, ..
z .4 _._
_ -6 ,e,,I
3£ 65/CA TRANSITION NACA 16 SERIES_
u 8 l I I
0.2 0.3 0.4 0.5 0.6 0.7 0.8 0.9 1.0
BLADE RADIUS/TIP RADIUS@50% CHORD
R/R
FIGURE 9.33 SR-7-21 AERODYNAMIC DESCRIPTION
138

4O
36
32
28
24
M,I2O
<-?
_ 16
12
• 8
-4T., SPeED-aoo.,sSlip/D2-32ALTITUDE -35,000 FT, e_0.75R.57 o
Mo=O'B 12
Xlm
1.0 w
0.9--
0.8--
0.7!_
0._-
¢; --
0,4--
NIO:
0.3--
>.Ira
0.2--
0,1--
0--
FIGURE 9.34 5R-7-21
0.20
0.18
0.14
0.1
0.1(
!
/0.08 / /
0,06 / i
oo, / , /
oo-°.°, /_
0.04 / _ .I
/
//
0.06 ,-0.2 0.3 0.4 0.5 0.6 0,7 0.8
r"
SWEEP LINE COORDINATES
__
,//
/
,!R
//
0.9 1.0
139
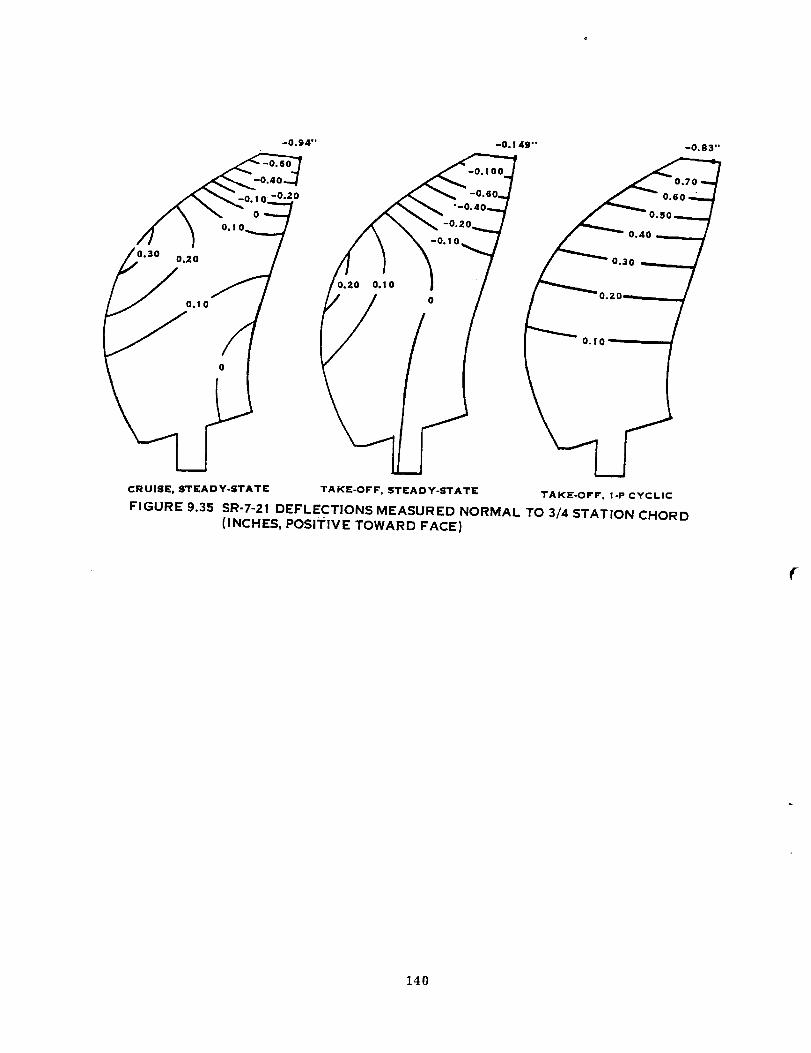
-0.94"
o
-0. 149"
0.40
0.30
CR U|SE:, STEADY-STATE TAKE-OFF, STEADY-STATE TAKE-OFF. I-P CYCLIC
FIGURE 9.35 5R-7-2! DEFLECTIONS MEASURED NORMAL TO 3/4 STATION CHORD(INCHES, PosITIVE TOWARD FACE)
f
140
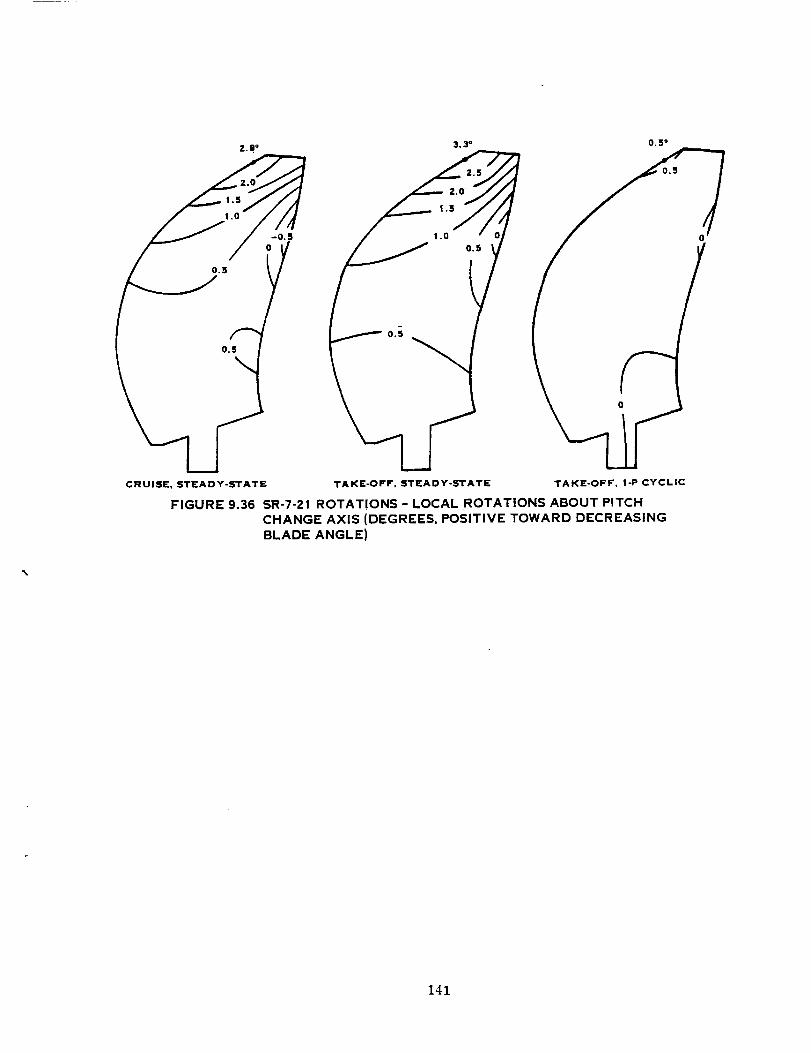
0.5
CRUISE, STEADY-STATE
FIGURE 9.36
3.3 °
TAKE-OFF, STEADY-STATE
0°5 °
TAKE-OFF, I-P CYCLIC
SR-7-21 ROTATIONS - LOCAL ROTATIONS ABOUT PITCH
CHANGE AXIS (DEGREES, POSITIVE TOWARD DECREASINGBLADE ANGLE)
141

The steady-state and cyclic operating condition stresses were combined and
plotted on Goodman diagrams. The cyclic stress was multiplied by the correc-tion factor as discussed in Section 9.3.5 and plotted in Figure 9.25. The
resultlng combined stress was then compared to the material allowable stress
limit for the specific blade component. Flgures 9.37 and 9.38 show the highcycle fatigue, 25% overspeed, and 40% overspeed spanwise stress data points
for the spar and shell, respectively.
The high cycle fatigue stress state that Is plotted Is the point that has thehighest percent of material allowable stress limit in that blade component.The materlal allowable stress is the allowable cyclic stress at the specificsteady stress for a given data point. The ratio, expressed as a percent, ofthe actual cyc]ic stress to the allowable cyclic stress Is the percent of al-lowable l_mit for that stress state. This percent is calculated for each el-ement in the finite element model, and the data point with the maximum per-cent of allowable limit is determined and plotted on the goodman diagram.Contour plots of the percent of allowable limit for the face and camber sidesof the spar and she]l are shown in Figures 9.39 and 9.40, respectively.
For the 25% overspeed and 40% overspeed conditions, only the steady-state
stress was considered since the steady loads domlnate the cyclic loads. Themaximum steady-state stress point was determined and multipled by 1.5 and 2.0to account for the increased rotational speeds of the 25% overspeed and 40%
overspeed conditions, respectively.
The results in Figures 9.37 thru 9.40 show that the SR-7-21 blade design sat-
isfled the hlgh cycle fatigue, 25% overspeed and 40% overspeed stress re-
quirements.
The maximum low cycle fatigue stress point for the spar and shell for theSR-7-21 design are plotted on Goodman diagrams In Flgures 9.41 and 9.42, re-
spectively. This stress point represents the highest stress variation due tostart/stop cycling, from no stress to peak stress. The spar meets the low
cycle fatigue design criteria, but the shell is overstressed.
The first five resonant frequencies of the SR-7-21 blade are plotted as a
function of propeller speed in Figure 9.43. As described in Paragraph 9.3.4,the resonance avoidance zones are also shown. The mode shapes for the first
five modes at cruise operating speed are illustrated in Figure 9.44.
During the iteration sequence, a classical flutter Mach number of 0.9 wasused to screen blade designs. This analysis was based on an isolated bladeat sea level. For the SR-7-21, the c]assicaI flutter Mach number is 0.92,
and is illustrated In Figure 9.45. The stability boundary for this designwas then calculated for altitudes from sea level up to I0,668 m. (35,000 ft)
for three conditions: (1) cascade with a gap/chord ratio cut-off of 2.0 at
100% frequency, (2) cascade with a gap/chord ratio of 2.0 at 85% frequency
(15% degradation), and (3) full cascade from root to tip at I00% frequency.
142

loo
I- 8o
Jca u
ld ,J 60
_ Uu_
0 40u h,
u tdUa,
20
O T/O CLIMB (HIGH CYCLE FATIGUE)
[_ 25% OVERSPEED (STEADY STATE)
O 40% OVERSPEED (STEADY STATE)
• J J
F.ORGI.G__
0 20 40 60 80 t00STEADY STRESS (PERCENT OF" UTS)
FIGURE 9.37 SR-7-2! SPAR - MAXIMUM SPANWISE STRESS RESULTS
143

..... F
|00 _F' DESIGN L|M| T
_.o "_°_°'"_u"3n, u 6oI->._u '_HIGH CYCLE_U
-_ 40
uu
a.
o0 2O
FATIGUE
(T/O CUMB)
MATERIAL- WOVI:;N 181 STYLE
FIBERGLASS CLOTH
EPOXY RESIN
I1o PERCENT
MODULUS LOSS (I CYCLE) MINIMUM UTS
11 "CYCLE)I \
,. \ \
o, \40 60 80 ! 00
STEADY STRESS (PERCENT OF UTS)
FIGURE 9.38 SR-7-21 SHELL - MAXIMUM SPANWlSE STRESS RESULTS
144

7O\
FACE
5O
FIGURE
CAMBER
PERCENT OF ALLOWABLE
STRESS LIMIT-HIGH CYCLE FATIQUE
9.39 SR-7-21 SPAR STRESS
145

50
FACE CAMBER
PERCENT OF ALLOWABLE
STRESS LIMIT- HIGH CYCLE FATIQUE
FIGURE 9.40 SR-7-21 SHELL STRESS, PERCENT OF ALLOWABLE STRESS-LIMIT-HIGHCYCLE FATIGUE.TAKE-OFF CLIMB CONDITION (INCLUDING 1-PSTRESS FACTORS)
146

M
_u
_ 4ou
u>.u 2o
d
./o/
FIGURE 9.41
//
I IMATERIAL- ALUMINUM FORGING
7075-T73
' I5X !o 4 CYCLES
z0 40 60 80STEADY STRESS (PERCENT OF UTS)
SR-7-21 SPAR - SPANWlSE STRESS - LOW CYCLE FATIGUE
too
147

too
I-
ao..,l
•J 60n, u
u
u_) 40
_ zo
O,
4 CYCLES
-
FIGURE 9,42
to
2O
SR-7-21 SHELL
| !
MATERIAL - WOVEN 181 STYLE
FIBERGLASS CLOTH -
EPOXY RESINI
r MIT
4O 60
STEADY STRESS (PERCENT OF UTS)
SPANWlSE STRESS - LOW CYCLE FATIGUE
\80 100
148

eL
Uv
=o 100lad
O"
L_
200 _Gp
150
"
0 200 " 400 600 800 1000 1200 1400 1600 1800 2000
PROPELLER SPEED (RPM)
FIGURE 9.43 5R-7-21 CRITICAL SPEED DIAGRAM
149

CPS
CPS 73 CPS
//
//
cPs
s
FIGURE 9.44 SR-7-21 MODE SHAPES (CRUISE CONDITION)
150

.12
.10
.O8
OmI--
,,, ,06
zEz
_ .04
.0;
-.020
SEA LEVEL
ISOLATED BLADE
J/
MODE 2
INSTABILITY-_MODE 3 )"
MACH .92 )
I J.2 .4 .6 .8
FLIGHT MACH NUMBER
FIGURE 9.45 SR-7-21 BLADE DAMPING
1.0
151
The stability boundarles predicted by these three methodsare plotted versusthe SR-7-21 flight profile and the Modanetunnel test condition in Figure9.46. During the iteration sequence, conditions 2 and 3 were relaxed from
design requirements to design goals. Failure to satisfy a design goal wouldnot make the design unsatisfactory. However, the stability analysis results
indicate the SR-7-21 design will meet conditions l and 2. Hence the SR-7-21
blade design does satisfy the stability requirements.
A foreign object impact analysis was not performed on the SR-7-21. As re-ported in the large-scale, high speed advanced propeller blade feasibilitystudy (Section 5.0, Volume I), an SR-3 (8) style spar and shell blade designsatisfied all foreign object impact criteria. Since the SR-7-21 (and all thedesigns In the iteration sequence) is similar to the SR-3 (8) large-scaledesign, the SR-7-21 design is expected to have a sufficient foreign objectimpact capacity.
9.4.11 Results
The blade design iteration sequence yielded a great deal of parametric infor-mation about the designing of full-size, high speed advanced propeller
blades. The followlng parametric effects were observed:
a. Sweep
• Causes complex bending/torsional coupling of vibratory modes.
• Increase causes increased aerodynamic performance.
• Increase causes decreased classical flutter limit.
• Increase causes increase in steady-state stress.
b. Offset
Increase in curvature of offset distribution causes increasedsteady-state stress.
Straightening leading edge decreases bending/torsional couplingof vibratory modes.
• Straightening leading edge increases classical flutter limit.
c. Thickness-to-chord Ratio
Increase will generally cause decreased local stress and de-creased aerodynamic performance.
• Modifications will change the blade frequency placement.
152
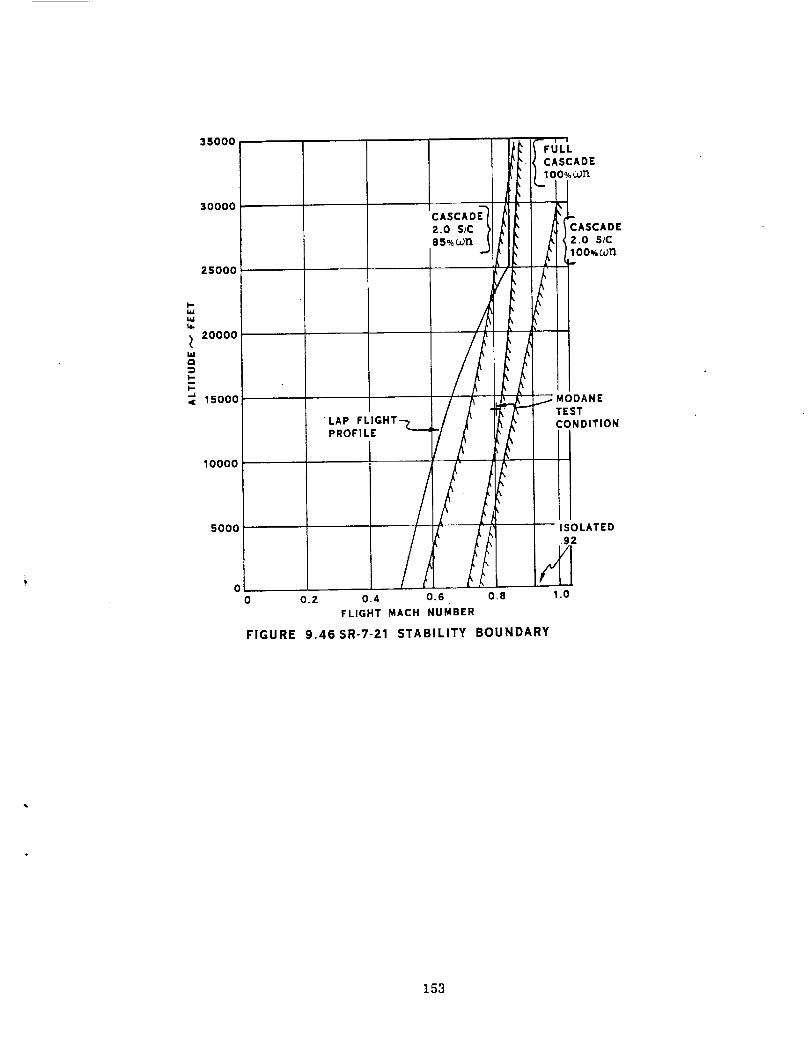
35000
30000
25000
20000
o
15000
10000
5000
CASCADE
2.0 SIC
85%_n
LAP
PROFILE
0
0 0.2 0.4 0.6 0.8
FLIGHT MACH NUMBER
FIGURE 9.46SR-7-21 STABILITY BOUNDARY
FULL
CASCADE
I00%_11
CASCADE
2.0 S/C
MODANE
TEST
CONDITION
ISOLATED
.92
1.0
153

d. Chord Width
Increase causes increase in actual thickness with minimum per-formance loss.
e. Advanced Composites in Shell
• Can decrease deflections and spar stress.
• Can improve stability.
• Requires advances in materials and manufacturing technology.
The SR-7-21 blade design satisfies the necessary design requirements to be
acceptable as the prellminary blade design. For the detailed blade design,the twist and camber dlstributions should be optimized for aero-acoustic per-
formance. A foreign object impact analysis should be performed on the de-talled blade design to verify that the Impact capacity is sufficient.
9.5 FULL SIZE BLADE STRUCTURAL ANALYSIS
9.5.1 Introduction
A program to structurally evaluate a full size blade with (14 foot diameter)the external conflguration of the SR-7 blade was conductedt to determine how
slmilar the 9 foot diameter testbed size blade design is to a full-slzedesign.
In accordance with the contract requirements, a blade fabrication concept was
submitted to the NASA Project Manager for approval prior to conducting theevaluation. A hollow steel spar, composite shell concept was suggested for
two reasons. First, a lower weight Prop-Fan system would result from the
lower blade weight, retention and pitch change loads: and second, the tech-nology for manufacture of a hollow steel spar was judged near term.
As the study progressed, the hollow steep spar blade did not appear to offer
a weight savings over a solid aluminum spar of this size, and some defi-clences were indicated by the analysis of the first model. The hollow steel
spar blade was locally overstressed in two regions and the unstalled fluttermargln was low. In view of these developments, the solid aluminum spar, com-
posite shell construction concept was adopted, and a structural evaluationconducted on this concept.
Presented in this section are the preparation, methods, and results of thestructural evaluation of a 14.0 foot (4.27 meter) diameter SR-7 blade. Com-
blned stress, frequency placement, stability, stress margins and deflectlons,calculated by a flnite element analysis for two load conditions, Cruise and
Climb, were used to evaluate the acceptability of the design concept.
154

9.5.2 Blade Conce_t Model Description
The aerodynamic geometry for the full size Prop-Fan blade was generated byscaling the existing 9.0 foot (2.74 meter) blade data to 14.0 feet (4.27 me-ters). Using this scaled data, finite element models for the two construc-tion concepts were generated. Both concepts were similar except for thespar. Concept #I had a hollow steel spar, while concept #2 had a solid alum-Inum spar.
Concept #I Concept #2
Hollow steel sparFiberglass shellTitanium leading edge sheathHoneycomb filler8.0" (20.32 cm) pitch diameter,2-row, ball bearing retentionAdhesive bond
Solid alumlnum sparFiberglass shellNickel leading edge sheathFoam filler9.40" (23.88 cm) pitch diameter,l-row, ball bearing retentionAdhesive bond
The spar geometry for concept #1 was established by keeping the same percent-age of airfoil chord and location within the airfoil as the 9.0 foot (2.74meter) blade until the wall thickness to internal radius ratlo became lessthan unity. The spar was then shifted toward the trailing edge of the bladeto keep this ratio at unity or above and faired back into the inboard spargeometry. An illustration of the spar reposltion and the comparison to thesolid and hollow spar geometry concepts are shown in Figures 9.47 and 9.48.
A node pattern generated for the spar, shell, sheath, and filler componentsdefining the quadrilateral, QUAD4, and triangular, TRIA3 elements in the MSC
Version 61b, NASTRAN bulk data deck is shown on Figures 9.49 and 9.50.
The QUAD4 elements were chosen because they are generally used by the indus-try to model hollow cylinders and give good results. The TRIA3 elements wereused to transition between regions having an unequal number of quadrilateralelements. Both elements have variable node thickness inputs and six degreesof freedom at each node. Rigid link, RBE2's were used to connect the spar,shell and filler nodes.
Concept #2 utilized the node pattern and element connectivity shown on Figure9.51 previously established for the 9.0 foot (2.74 meter) model and is a 14/9scale version of that model set up for an in-house flnite e]ement code,BESTRAN.
155

Z
SOLID SPAR__
_"_""..-_,,- 11ft_;" _ I
//i" k¢--"<>'<<>wY,' , ,..U/--'"'"t ', I /[
s>,,,,.L_,, t ," t
SPAR
FIGURE 9.47 FULL SCALE PROP-FAN SPAR & SHELL CONCEPTS # 1 & #2
156
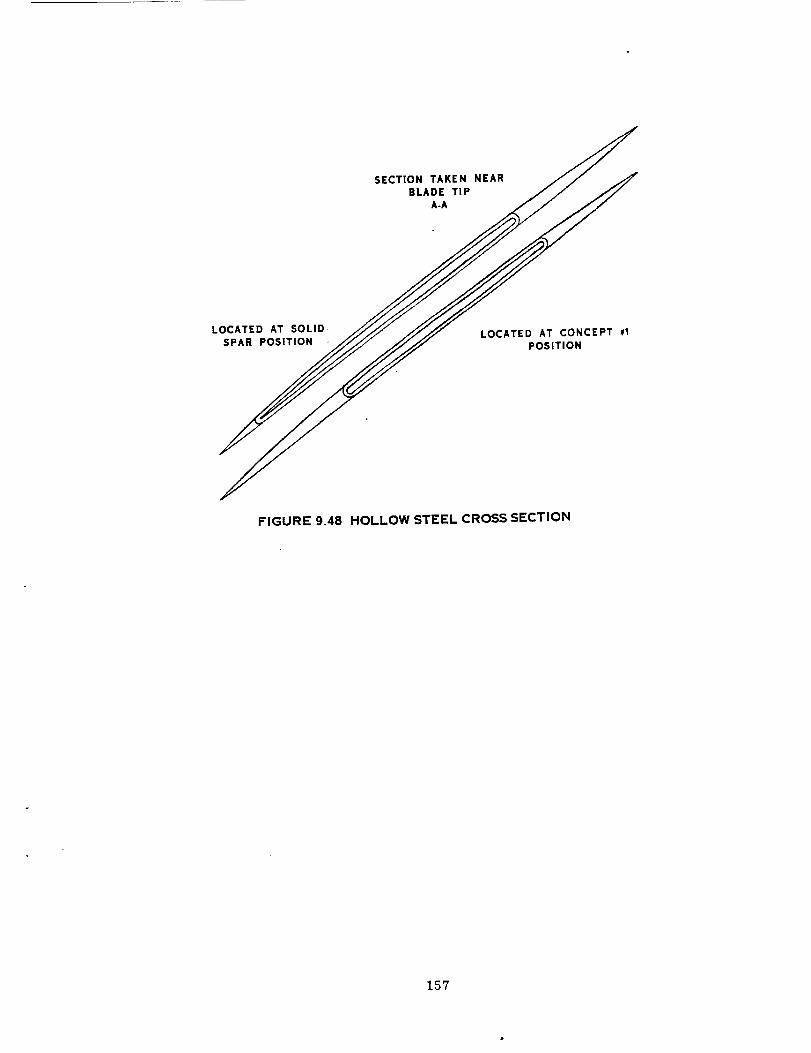
SECTION TAKEN NEARBLADE TIP
A-A
LOCATED AT SOLIDSPAR POSITION
LOCATED AT CONCEPT #1POSITION
FIGURE 9.48 HOLLOW STEEL CROSS SECTION
157

FIGURE 9.49 FINITE ELEMENT MODEL -CONCEPT#1
158

FILLER
HOLLOW SPAR
FIGURE9,50 FINITE ELEMENT MODEL-CONCEPT#1
159

oRIGI_J-' t'AG_ IS
oF. _,ooR QU_a_'r_
Y Xi
FIGURE 9.51 FINITE ELEMENT MODEL - CONCEPT #Z
160

g.5.3 Retention Model Description
The 2-row blade root retention for concept #I was modeled as an inflnitely
rigid attachment. Since the stiffness of this retention configuration had
not yet been analyzed, the nodes in thls region were constralned to zero mo-tion for the first series of calculations.
The retention model for concept #2, illustrated in Figure 9.52, was modeled
by springs scaled up from the 9.0 foot (2.74 meter) model. The moment springrates are simulated force couple springs attached at the pitch dlameter node
locations, and axial and torsional spring rates are attached to a centralnode location.
9.5.4 Analysis
The structural evaluation for the 14.0 foot (4.27 meter) SR-7 blade was con-
ducted in accordance with the requirements set forth in the design require-ments document (reference Appendix D) for stress, natural frequency, and sta-
bility for the Cruise and Climb condltions Imposed on the 9.0 foot (2.74 met-
er) blade design (reference Table 9.20). Finite element models of the blades(reference Figures 9.49 thru 9.51) were generated for both concepts #1 and #2
using scaled data from the 9.0 foot (2.74 meter) design. Concept #I was mod-eled using the variable thickness node, isoparametric plate elements QUAD4
and TRIA3, keeping element aspect ratios of 10 or less wherever posslble, forMSC NASTRAN Version 61b. Concept #2 was modeled using triangular plate ele-
ments, Type I and Type 5, for the in-house finite element code, BESTRAN, by
scaling the global coordinates of the SR-7 analytical model by 14/9. Al-though two different finite element codes were used for the evaluation, the
baslc solutlon sequence, shown on Figure 9.53 for the NASTRAN approach, wassimilar. A two-step method to Include the differential stiffenlng effects of
the centrifugal and air loads on the elements was employed by both se-quences. The one difference that occurred between the two sequences was that
concept #2 was placed in its deflected position after step l, and concept #1
geometry remained the same. This was because concept #2 had been generatedfrom the pre-deflected geometry of the SR-7 blade and concept #1 had never
been iterated on to establish a pre-deflected geometry.
161

PITCH CHANGE AXIS
(COLLINEAR WITH GLOBAL Z
BLADE SHANK MODEL
NOTES:
I) NODE 4 IS ALSO RESTRAINED FROM
TRANSLATING ALONG THE GLOBAL
X AND Y AXF-S
Z) AXIAL SPRING RATES ARE IN LB/IN
TORSIONAL SPRING RATE IS IN-LB/RAD
TYPICAL RIGID LINK (4 TOTAL
(MULTI-POINT CONSTRAINT
ATTACHED TO NODE 4)
IN-PLANE" AXIS
(NORMAL TO
ROTATION VECTOR)
KIN P AXIAL
.26 X 106
KIN P AXIAL AXIAL
! .Z6 X 1061.66 X 106
FIGURE 9.52 CONCEPT #2 RETENTION SIMULATION
162

MSC NASTR_A_N
BULK DATA
STEADY STATE
ST R E SSSOLUTION 64
RPM
1SOLUTION 3
J
M ASS
&
MODIFIED STIFFNESS
MATRICES
OUTPUT I
DATA _._
STORAGE
POST-PROCESSING
FIGURE 9.53 ANALYTICAL FLOWPATH
J
FORCED
FREQUENCY
RESPONSE
SOLUTION 26
163
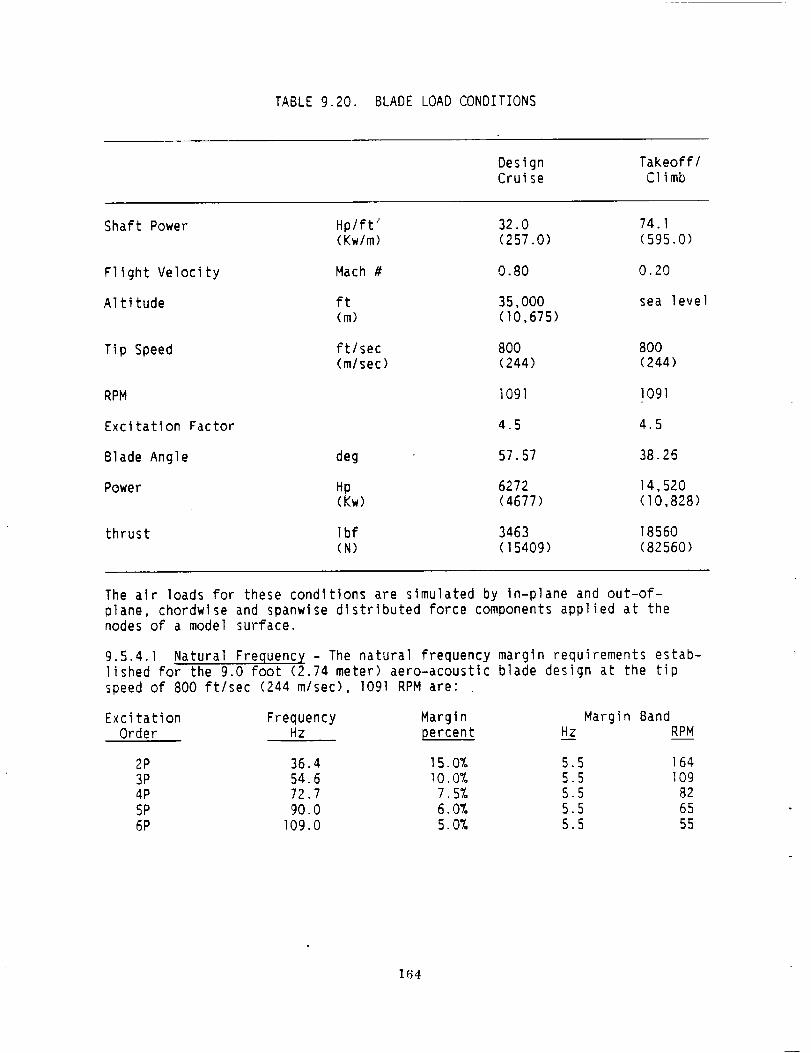
TABLE 9.20. BLADE LOAD CONDITIONS
DesignCruise
Takeoff/Climb
Shaft Power Hp/ft _ 32.0 74.1(Kw/m) (257.0) (595.0)
Flight Velocity Mach # 0.80 0.20
Altitude ft 35,000 sea level(m) (10,675)
Tip Speed ft/sec 800 800(mlsec) (244) (244)
RPM 1091 ]091
Excitation Factor 4.5 4.5
Blade Angle deg 57.57 38.26
Power Hp 6272 ]4,520(Kw) (4677) (I0,828)
thrust Ibf 3463 18560(N) (15409) (82560)
The air loads for these conditions are simulated by in-plane and out-of-
plane, chordwlse and spanwise distributed force components applied at thenodes of a model surface.
9.5.4.1 Natural Frequency - The natural frequency margin requirements estab-lished for the 9.0 foot (2.74 meter) aero-acoustic blade design at the tip
speed of 800 ft/sec (244 m/sec), 1091RPM are"
Excitation Frequency Margin Margin Band
Order Hz percent Hz RPM
2P 36.4 15.0% 5.5 1643P 54.6 10.0% 5.5 I09
4P 72.7 7.5% 5.5 82
5P 90.0 6.0% 5.5 656P 109.0 5.0% 5.5 55
164

The natural frequency characteristics for both blade concepts were calculatedat the two load condition and blade angle positions for Climb and Cruise,statically, and at speed. The elgenvalue results for the first four modeslisted in Table 9.21 were used to construct Campbell diagrams shownon Fig-ures 9.54 thru 9.56 for margin requirement checking.
Normal modeshapedeflection plots are shownon Figures 9.57 thru 9.61. Ascan be seen, not all margin requirements have been achieved with either con-cept. Mode2 of concept #2 intersects the lower corner of the 3P diamond.This modeIs sensitlve to retention stiffness and this intersection could be
altered by changing the retention geometry. Fine tuning of the blade was notpursued during thls phase of the evaluation.
TABLE 9.21. NATURAL FREQUENCIES
CONCEPT #I
800 ft/sec (244 m/sec) v<tip) 1091RPM
Retention stiffness : infinite for all degrees of freedom
Mode Cruise Margin Climb Margin
"32.8 hz -11% 32.8 hz -11%
2 62.9 hz +15% 59.3 hz + 9%
76.5 hz + 57. 79.9 hz + 7%
102.8 hz +12% 110.9 hz +I 47.
Mode
1
2
3
4
CONCEPT #2
800 ft/sec (244 m/sec) v(tip) 1091 RPMRetention stiffness - 38500000 in-lb/rad In-plane
= 50500000 in-lb/rad Out-of-plane= 48400000 in-lb/rad Torsion
= 17450000 Ib/in Radial
Cruise _ Climb
27.7 hz -24_ 29.3 hz
51.4 hz - 67. 49.5 hz
64.7 hz -II% 66.0 hz
95.1 hz + 5% 95.4 hZ
-19%
- 9%
- 9%
. 57.
165

",z-v
>.
U
Z[d
0
IL
.J
I'--
100
MODE 4
80 "MODE 3"
6O
4O
MODE 2
__ _sP__j5p 4P
,__J,,_'-.____,_-
looo. 120o. 14oo.ROTATIONALSPEED (RPM)
0 200. 400. 600. 800.
FIGURE 9.54 DIAGRAM CONCEPT # 1 CRUISE CONDITION
166

120
100
N
z
uz 80
o
u_
6O,,,,,1
,I[
I-,.
z 40
// ,t
I 6P
J
O.
J I
tII
0 200 400 600 800 1000 1200 1400
ROTATIONAL SPEED (RPM)
5P
j4PJ
_.3P
.._ 2 P
1600
FIGURE 9.55 DIAGRAM CONCEPT # 2 CLIMB CONDITION
167
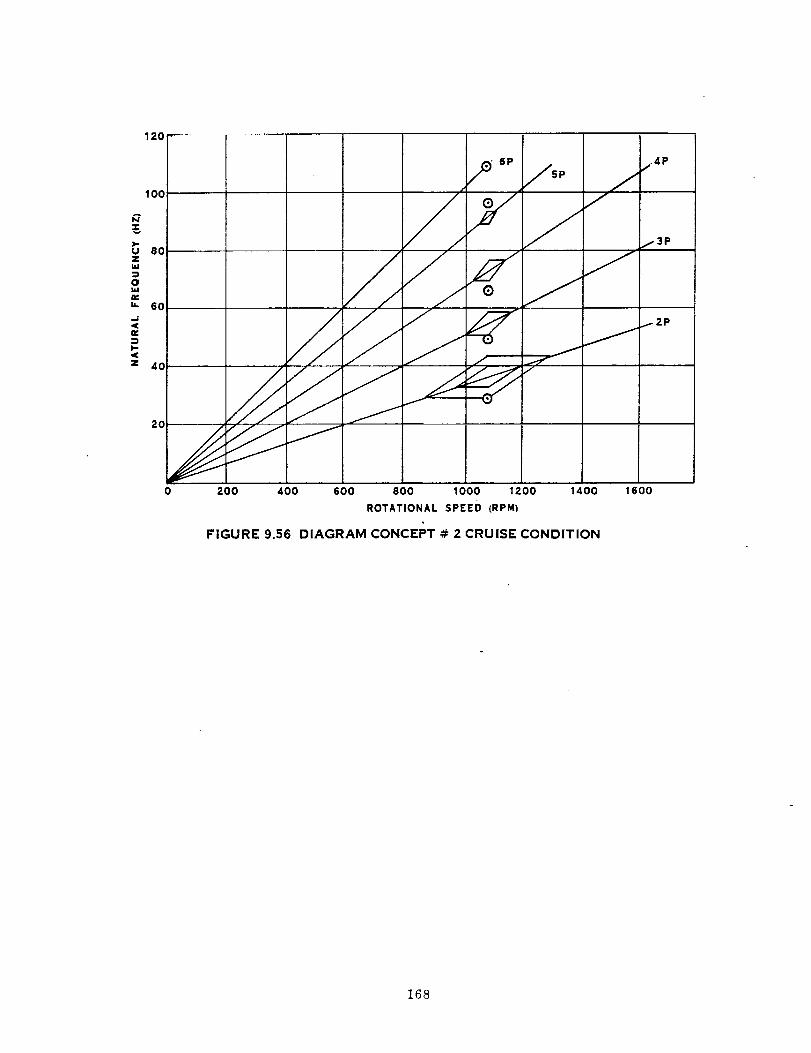
120
=_.>.,u
bJ
o_J
iJ.
,<n,,
i,-
z
100
80
60
4O
'6P
/
/.y
1600
/4P
13P
12P
0 200 400 600 800 1000 1200 1400
ROTATIONAL SPEED (RPM)
FIGURE 9.56 DIAGRAM CONCEPT # 2 CRUISE CONDITION
168

_3
0
"0
#4 0
#Z
O,
#5
FIGURE 9.57 NORMAL MODE SHAPES - CONCEPT #2 - CRUISE CONDITION
169

FIGURE 9.58 NORMAL MODE SHAPES- CONCEPT # 1 -CRUISE CONDITION
170

FIGURE 9.59 NORMAL MODE SHAPES - CONCEPT #1 - CRUISE CONDITION
171

FIGURE 9.60 NORMAL MODE SHAPES - CRUISE CONDITION - CONCEPT # 1
172

FIGURE 9.61 NORMAL MODE SHAPES- CONCEPT #I - CRUISE CONDITION
173
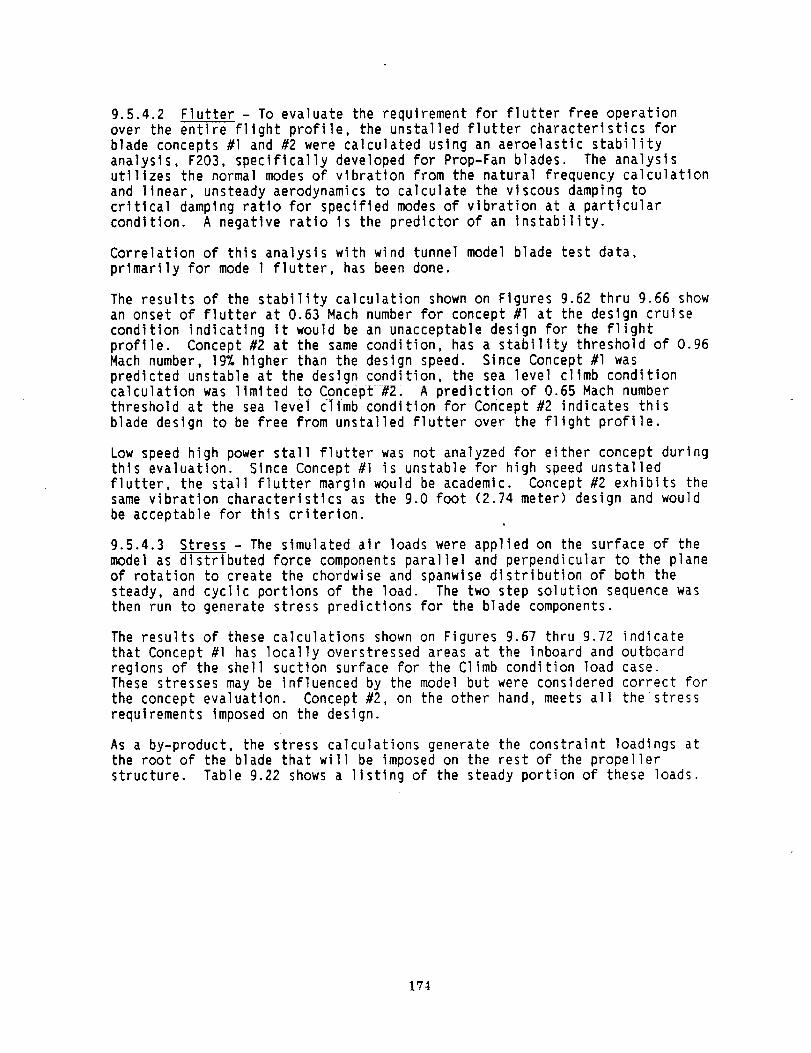
9.5.4.2 Flutter - To evaluate the requirement for flutter free operation
over the entire flight profile, the unstalled flutter characteristics for
blade concepts #1 and #2 were calculated using an aeroelastic stability
analysis, F203, specifically developed for Prop-Fan blades. The analyslsutilizes the normal modes of vibration from the natural frequency calculation
and linear, unsteady aerodynamics to calculate the viscous damping tocritical damping ratio for specified modes of vibration at a particular
condition. A negative ratio is the predictor of an instability.
Correlation of this analysis with wind tunnel model blade test data,
primarily for mode l flutter, has been done.
The results of the stability calculation shown on Figures 9.62 thru 9.66 showan onset of flutter at 0.63 Mach number for concept #1 at the design cruise
condition Indicatlng It would be an unacceptable design for the flight
profile. Concept #2 at the same condition, has a stability threshold of 0.96Mach number, 19Z higher than the design speed. Since Concept #1 was
predicted unstable at the design condition, the sea level climb conditioncalculation was limited to Concept #2, A prediction of 0.65 Mach numberthreshold at the sea level climb condition for Concept #2 indicates this
blade design to be free from unstalled flutter over the flight profile.
Low speed high power stall flutter was not analyzed for either concept during
this evaluation. Since Concept #I is unstable for high speed unstalledflutter, the stall flutter margin would be academic. Concept #2 exhibits thesame vibration characteristics as the 9.0 foot (2.74 meter) design and would
be acceptable for this criterion.
9.5.4.3 Stress - The simulated air loads were applied on the surface of the
model as distributed force components parallel and perpendicular to the plane
of rotation to create the chordwise and spanwise distribution of both thesteady, and cyclic portions of the load. The two step solution sequence was
then run to generate stress predictions for the blade components.
The results of these calculations shown on Figures 9.67 thru 9.72 indlcatethat Concept #1 has locally overstressed areas at the inboard and outboard
regions of the shell suction surface for the Climb condition load case.These stresses may be influenced by the model but were considered correct for
the concept evaluation. Concept #2, on the other hand, meets all the stress
requirements imposed on the design.
As a by-product, the stress calculations generate the constraint 1oadlngs atthe root of the blade that will be imposed on the rest of the propeller
structure. Table 9.22 shows a listing of the steady portion of these loads.
174

CONDITION:
CRUISE; 3S,000 FT., 0.80 MACH NO., 1091 RPM
LEAST STABLE INTERBLADEPHASE ANGLE
o.o] \_
sis(
0 0.02m
P<n*
Z
2 o.oi<Q
_30
> o
CALCULATION OPTIONS:
PARTIAL CASCADE 2.0 GAP/CHORD
THEORETICAL DATA
NO TIP LOSS
270 Z70
225
315
315
-0.010.6 0.9 ! .0
FLUTTER MN = 0.96
MODE 3
0.7 0.8
MACH NO.
MODE 4
MODE I
MODE 2
_MODE ]
FIGURE 9.62 UNSTALLED FLUTTER STABILITY -CONCEPT #2
175

0mI-<r_
Z
x<[3cnD0UU)
>
0.10
0.08
0.06
0°04
0.0Z
/0 2_°
DE4
_)!3S
\.o
_360
)El
)l 80
CONDITION: TAKE-OFF CLIMB
0.20 MACH NO.
35,000 FEET1091 RPM
CALCULATION OPTIONS:
PARTIAL CASCADE 2.0 GAP/CHORD
THEORETICAL DATA
NO TIP LOSS
0
FLUTTER MN = 0.65
270)MODE 2
MODE3
-0.0;l0,4 0.5 0.6 0,7 0.8
MACH NO.
FIGURE 9.63 UNSTALLED FLUTTER STABILITY - CONCEPT #2
176
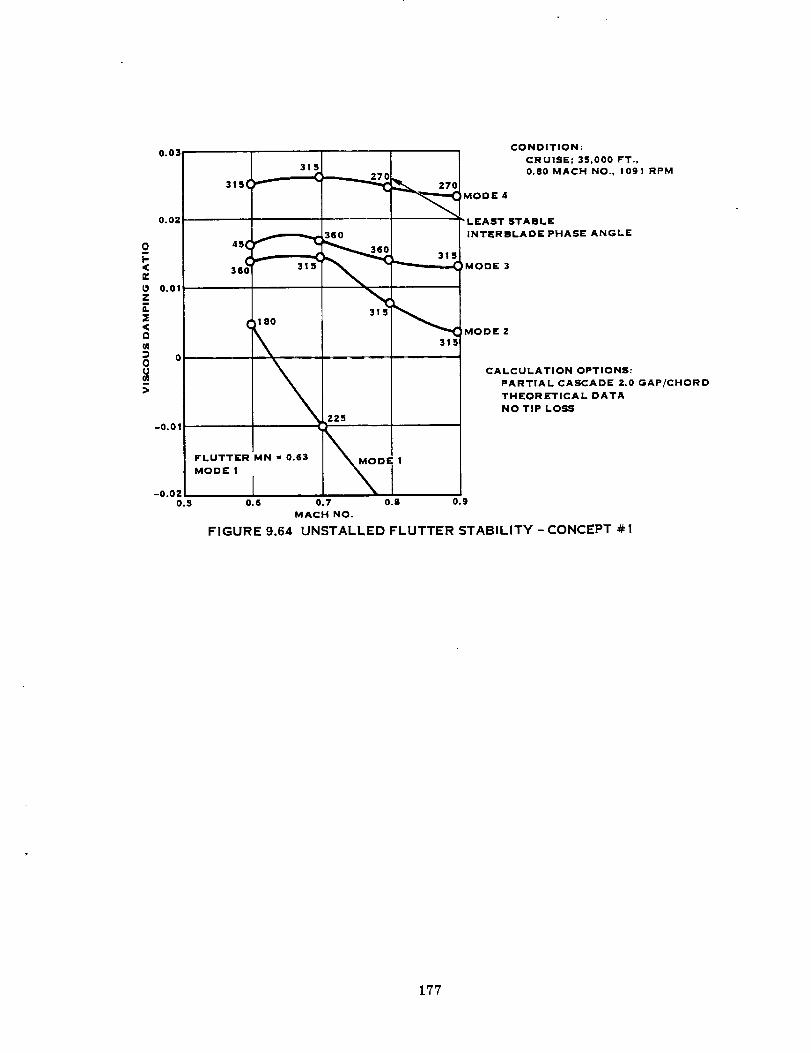
0m
<
ZL
X<
Ou
>
0.03
0.02
0.01
-0.01
-0.020.5
31s(_.-..---'_
38
FLUTTER MN = 0.63
MODE I
10.6
360
315
225
DE !
0.7 0.8
MACH NO.
315
FIGURE 9.64
CONDITION:
CRUISE; 35,000 FT.,0.80 MACH NO., 1091 RPM
MODE 4
-LEAST STABLE
INTERBLADE PHASE ANGLE
)MODE 3
_MODE 2
CALCULATION OPTIONS:
PARTIAL CASCADE 2.0 GAP/CHORD
THEORETICAL DATA
NO TiP LOSS
0.9
UNSTALLED FLUTTER STABILITY -CONCEPT # 1
177

40,000
30.000
la,lhJ
la.v
20,000
I--iI--,.I
,<
10.000
00.4
FIGURE
df'PARTIAL CASCADE 2.0
CRUliE MODE SHAPES
.ODE :_ fmSTA.lUTY /
0.5 0.6
9.65
S/CI
0.7 0.8 0.9
MACHf
UNSTALLED FLUTTER STABILITY CONCEPT#1
1.0
178

40,000
a
i-,
30,000
20,000
_o,ooor
OHOLLOW STEEL
SPARALUMINUM 0
SPAR
I
0.5 0.6
J
ALUMINUM SPARJ
0.7 0.8
MACH NO.
0.9 1.0
FIGURE 9.66 STABILITY SUMMARY
179
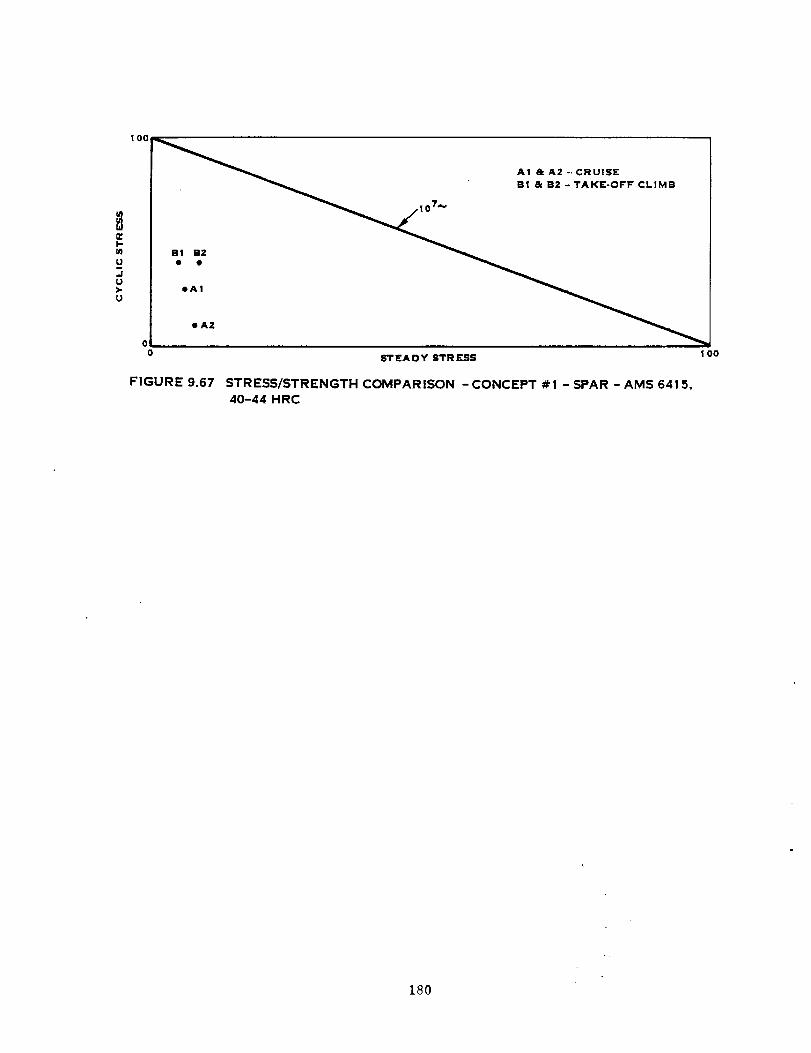
o
FIGURE 9.67
STEADY STRESS
STR ESS/STRENGTH COMPAR ISON -CONCEPT # 1 - SPAR - AMS 6415,40-44 HRC
| oo
180
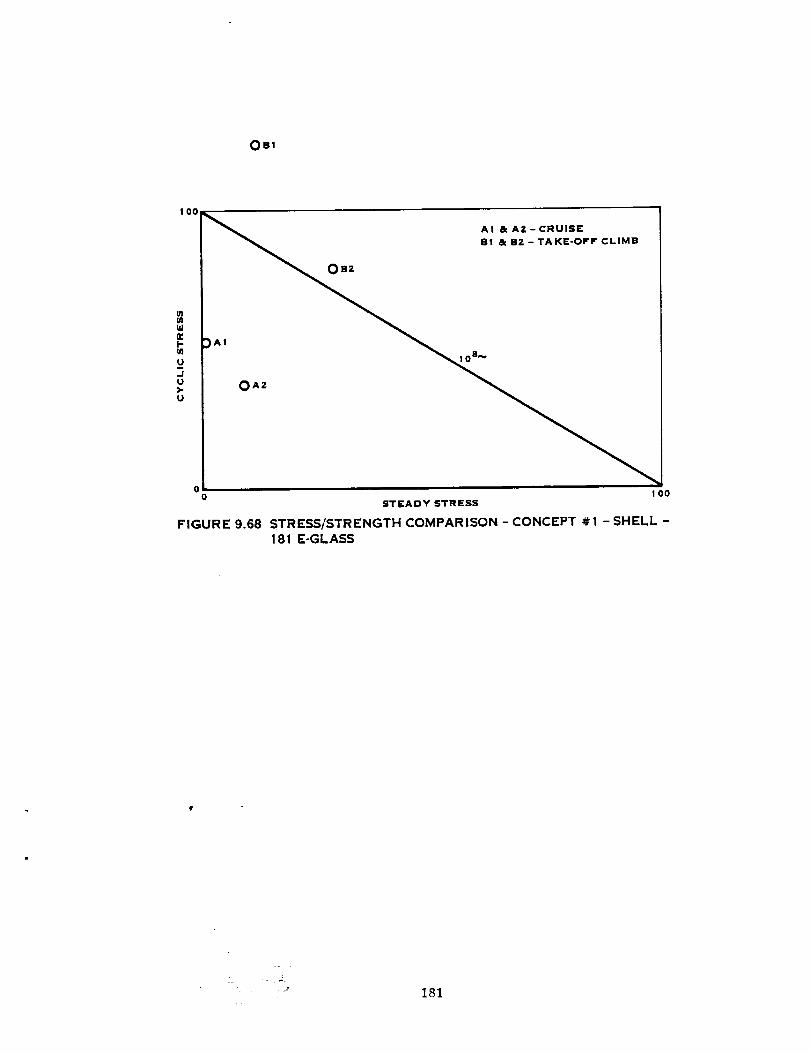
OBI
100_ AI & AZ-CRUISE
I _ B! &B2-TAKE-OFFCLIMB
; "-<.
0 I O0STEADY STRESS
FIGURE 9.68 STRESS/STRENGTH COMPARISON - CONCEPT # 1 - SHELL -! 81 E-GLASS
181
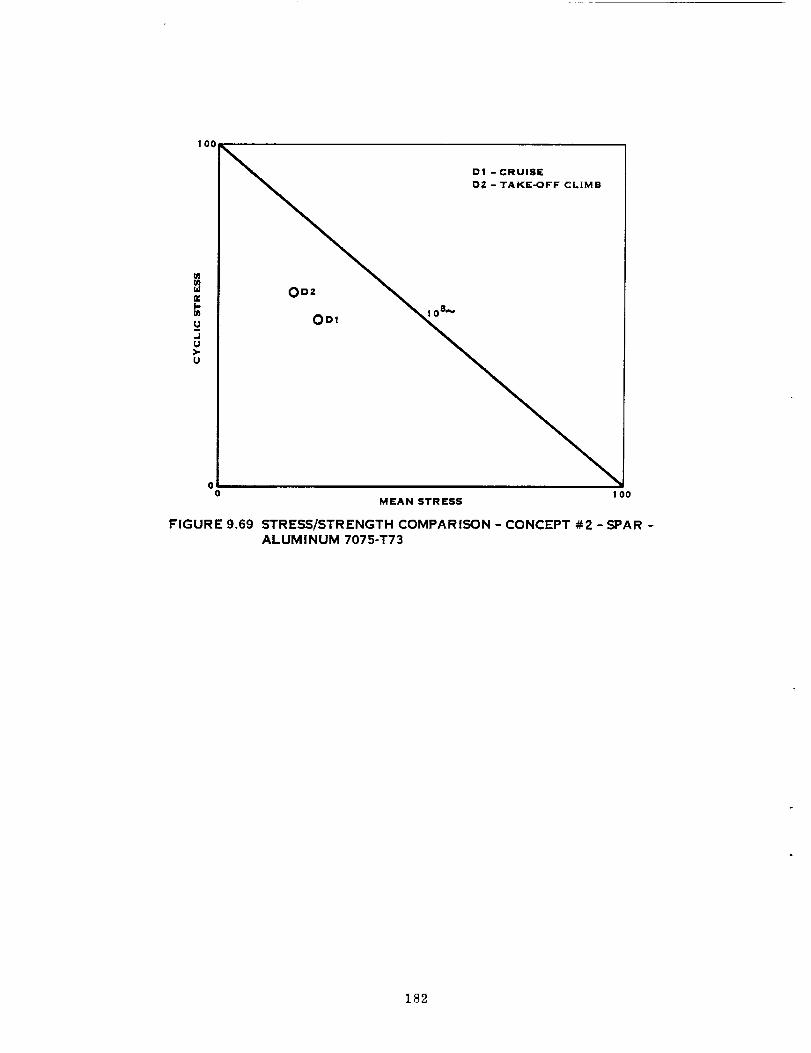
1oo
u
o
01 -CRUISE
D2 - TAKE-OFF CLIMB
0 I O0MEAN STRESS
FIGURE 9.69 STRESS/STRENGTH COMPARISON- CONCEPT #2- SPAR -ALUMINUM 7075-T73
182

100
FIGURE 9.7O
1000 MEAN STR ES5
STRESS/STRENGTH COMPARISON - CONCEPT #2 - SHELL -
181 E-GLASS
_" _ .._ 183

D1 - CRUISE
_ •
2
0
0 ! O0
FIGURE 9.71
M EAN STR ESS
STRESS/STRENGTH COMPARISON - CONCEPT #2 - FILLER -8 LB/FT 3 FOAM
184

lOO
u
2
FIGURE 9.72
- LIMB
ODz
0 100MEAN STRESS
STRESS/STRENGTH COMPAR ISON - CONCEPT #2 - SHEATH- PLATED NICKEL
185
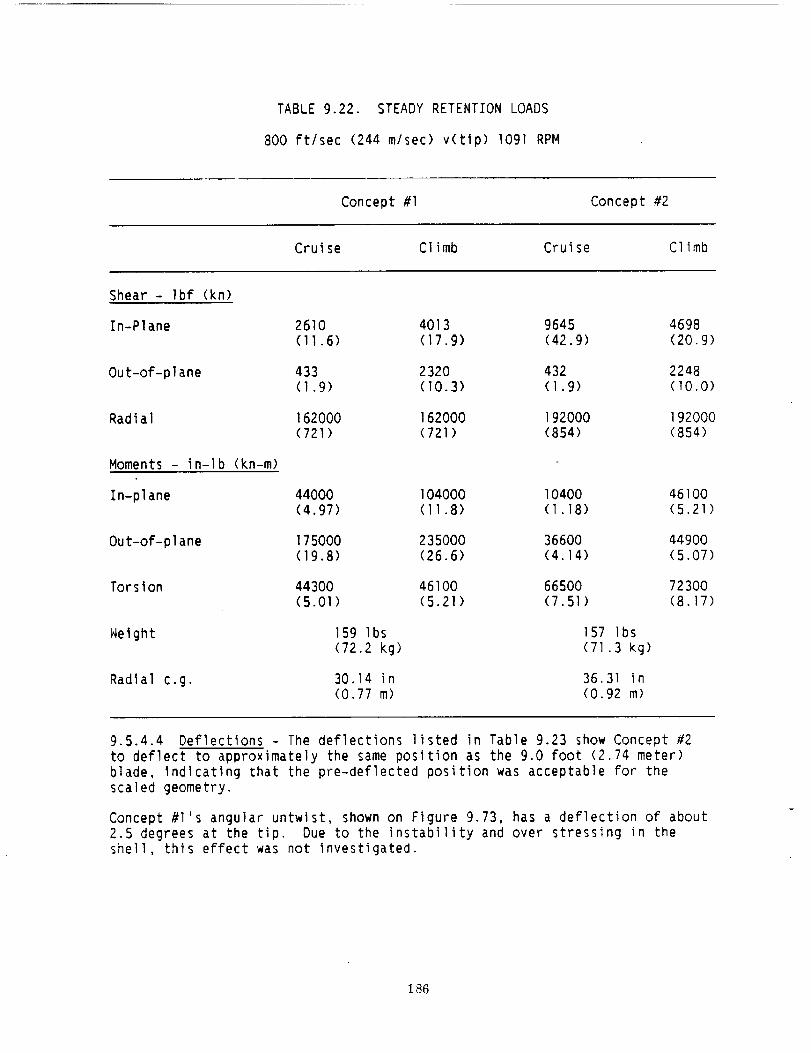
TABLE 9.22. STEADY RETENTION LOADS
800 ftlsec (244 mlsec) v(tip) 1091 RPM
Concept #I Concept #2
Cruise Climb Cruise Climb
Shear - Ibf (kn)
In-Plane 2610 4013 9645 4698(11.6) (17.9) (42.9) (20.9)
Out-of-plane 433 2320 432 2248(1.9) (10.3) (1.9) (I0.0)
Radial 162000 162000 192000 192000(721) <721) (854) (854)
Moments - In-lb (kn-m)
In-plane 44000 104000 10400 46100(4.97) (11.8) (1.18) (5.21)
Out-of-plane 175000 235000 36600 44900(19.8) (26.6) (4.14) (5.07)
Torsion 44300 46100 66500 72300(5.01) (5.21) (7.51) (8.17)
Weight 159 lbs 157 Ibs(72.2 kg) (71.3 kg)
Radial c.g. 30.14 in 36.31 in(0.77 m) (0.92 m)
9.5.4.4 Deflections - The deflections listed in Table 9.23 show Concept #2
to deflect to approximately the same position as the 9.0 foot (2.74 meter)
blade, indicating that the pre-deflected position was acceptable for the
scaled geometry.
Concept #1's angular untwist, shown on Figure 9.73, has a deflection of about
2.5 degrees at the tip. Due to the instability and over stressing in the
shell, this effect was not investigated.
186
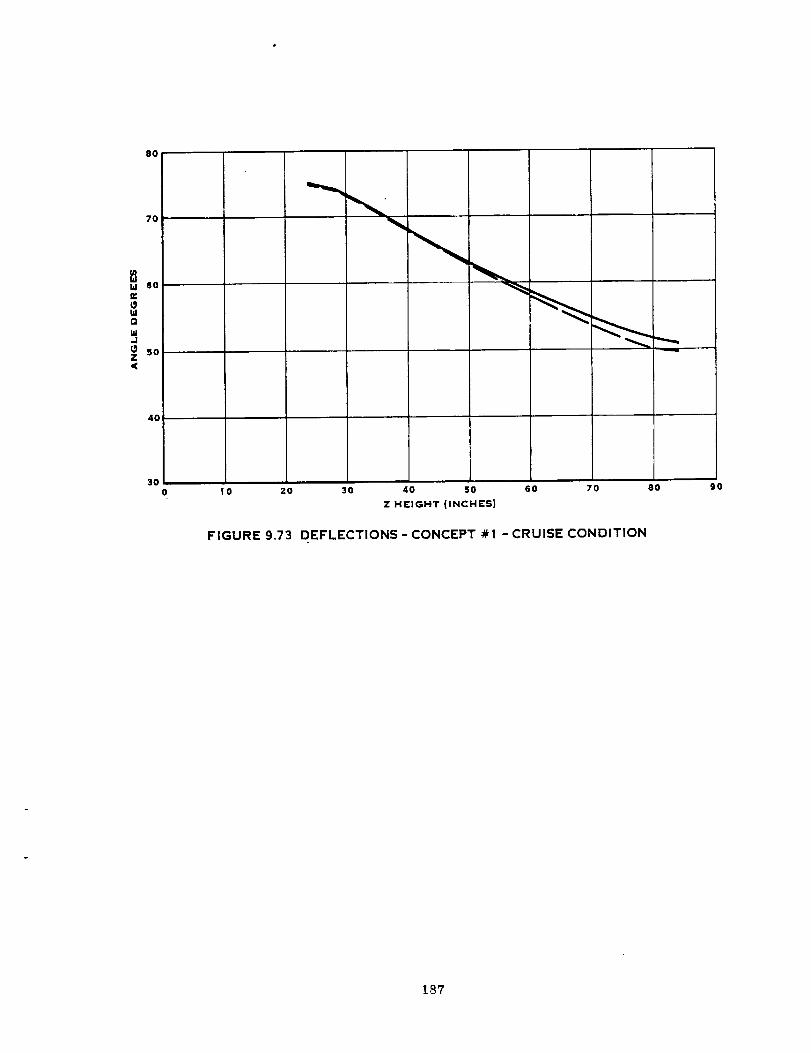
8O
7O
4O
300 ! 0 20 30 40 50 60 70
Z HEIGHT (INC:HESl
80
FIGURE 9.73 DEFLECTIONS - CONCEPT #1 - CRUISE CONDITION
_o
187

TABLE 9.23. BLADE DEFLECTION - CONCEPT #2
FLIGHT CONDITION
Rotations, Deg Design/Cruise T.O. Climb
Mid Tip 3.3 deg 2.2 degT.E. 3/4 Rad 1.2 deg l.l deg
FLIGHT CONDITION
Translations Design/Cruise T.O. C1 imb
Mid Tip -0.55 in -1.21 inT.E. 3/4 Rad 0.85 in 0.44 in
9.5.5 Conclusions
Concept #1 does not meet the design requirements. The shell is locally
over-stressed in two regions and it has a low stability threshold for the de-
sign cruise condition.
Concept #1 does have a lower centrifugal force and pitch change torsionloads; section stacklng modifications for reducing the in-plane and out-of-
plane bending moments and Increasing the stability threshold would produce a
lower total system weight.
Concept #2 meets all the evaluation requirements imposed. Since Concept #2is a scaled up version of the testbed size blade, the testbed size blade
design Is fully representative of a full slze design.
188

References
I. Kraus, E.F. and Van Abkoude, _.C.: CostlBeneflt Trade-offs for Reducingthe Energy Consumption of the Commercial Air Transportation System.Volume I: Technical Analysis, Volume II: Market and Economic Analysisand Summary Report, June 1976. NASA CR-137923, 4 & 5, Douglas AircraftCompany.
2. BCAC Preliminary Design Dept.: Energy Consumption Characteristics of
Transports Using the Prop-Fan Concept. Final Report, October 1976 andSummary Report, November 1976. NASA CR-137937,B. Boeing Commercial
Airplane Company.
3. Hopkins, J.P. and Wharton, H.E.: Study of the Cost/Benefit Trade-offsfor Reducing the Energy Consumption of the Commercial Air TransportationSystem. Final Report and Summary Report, August 1976. NASACR-137926,7. Lockheed California Company.
4. Revell, 3.D. and Tullis, R.H.:
Turboprop Transport Aircraft.
Californla Company.
Fuel Conservative Merits of Advanced
NASA CR-152096, August 1977. Lockheed
5. Dugan, J.F., Gatzen B.S., Adamson, W.M.: Prop-Fan Propulsion. SAE
Technical Paper 780995, November 1978.
6. Muehlbauer, J.S., et. aI: Turboprop Cargo Aircraft Systems Study,Phase I. NASA CR-159355. November 1980. Lockheed-Georgia Company.
7. Lockheed Study Team: Advanced Turboprop Testbed Systems Study. April21, 1981. Final Oral Briefing. Lockheed-Georgia Company.
8. K1otzsche, M. et. aI: Dr-9 Prop-Fan Feasibility Study. Final Oral
Briefing, May 20, 1981. NAS2-10178 Contract Study. Douglas AircraftCompany.
9. Klotzsche, M. et. al: Dr-9 Prop-Fan Testbed Study: Flnal Oral Briefing,
April 22, 1981. NASA Contract NAS3-22347. Douglas Aircraft Company.
I0. Schuetz, A.J.: Potential Appllcability of Prop-Fan Propulsion toMaritime Patrol Aircraft. Oral Commentary to SAE National Aerospace
Meeting, November 27, 1978. Lockheed Ca1_fornia Company.
If. Welge, H.R., Crowder, J.P.: Simulated Propeller Slipstream Effects on aSupercritical Wing. NASA CR-152138, June, 197B. Douglas AircraftCompany.
12. Generalized Prop-Fan Performance and Weight, SPOSA75, April 18, 1975.Hamilton Standard D1vision of United Technologies.
189

13. Prop-Fan Technology Study. Prepared for Naval Air Development Centerunder Contract No. N62269-77-C-0465. October 31, 1977. Hamilton
Standard Division of United Technologies.
14. Prop-Fan Parametric Data Package. SPO4ABO. October, 1980. HamiltonStandard Division of United Technologies.
15. Analysis of Mach 0.8 Turboprop Slipstream Ning/Nacelle Interactions.
July 9, 1981. NASA Contract NAS2-10881. Douglas Aircraft Company.
16. Black, D.M., Menthe, R.N. and Nalnauski, H.S.: Aerodynamic Design and
Performance Testing of an Advanced 30* Swept, Eight Bladed Propeller atMach Numbers from 0.2 to 0.85. September 1978. NASA CR 3047. Hamilton
Standard Division of United Technologles Corporation.
17. Metzger, F.B.: Progress and Trends in Propeller/Prop-Fan Noise
Technology. AIAA Technlcal Paper 80-0856, presented May 6-8, 1980.Hamilton Standard Division of United Technologles Corporatlpn.
18. Gatzen, B.S. and Adamson, N.M.: Prop-Fan Technlcal Progress Leading toTechnical Readiness. Technical Paper AIAA-81-O810 CP. Presented at
International Air Transportation Conference, May 26-28, 1981. HamiltonStandard.
19. Nalnauskl, H.S.: Aerodynamic Design and Performance Testing of an
Advanced Unswept Eight Bladed propeller at Mach Numbers From 0.2 to
0.85. Prepared under Contract NAS3-20252 by Hamilton Standard. August1977.
20. Rohrbach, C., F.B. Metzger, D.M. Black and R.M. Ladden: Evaluation ofWind Tunnel Performance Tests of an Advanced 45° Swept Eight Bladed
Propeller at Mach Numbers from 0.45 to 0.85. NASA CR-3405, March, 1982.
21. Boctor, M.S., et al.: An Analysis of Prop-Fan/Airframe Aerodynamic
Integration. NASA CR-152186, October 1978. Boeing Commercial Airplane
Company.
22. Rohrbach, C. et al.: Aerodynamic and Acoustic Design Report: lO Bladed,
Highly Swept Prop-Fan for Cruise at 0.80 Mach Number. Prepared undercontract NAS3-21724 by Hamilton Standard.
23. Memo to Cornell from LW. Smith - Trip Report - Visit to NASA-Lewis to
discuss Prop-Fan Model Tests, June 22, 1981.
24. Baker, John E., "The Effects of Various Parameters includlng Math Number
on Propeller Blade Flutter with Emphasis on Stall Flutter." NACARMLSOCI2b.
190
25. "NASA-AMESInstalled SR-2CProp-Fan Model Flow Field and ResponseCalculations" letter report to O. Mehmed,Project Manager, NASA-LewisResearchCenter, FromB.P. Rosenthaler, Hamilton Standard, July 14,]98l. (Contract No. NAS3-22755).
26. "On the Vortex Theoryof ScrewPropellers", S. Goldstein, Proceeding ofRoyal Society of Aviation, Vol. 123, 1929.
27. "Excitation Factor Sensitivity Study", Hamilton Standard, August, 1983,(NASA-LEWISContract NAS3-22394).
28. Hanson,D.B., "Near Field FrequencyDomainTheory for Propeller Noise",AIAA Paper No. 83-0688, presented April ll-13, AIAA 8th Aero-AcoustlcsConference, Atlanta, Georgia.
29. Large Displacements and Stability Analys|s of Nonlinear PropellerStructures; Aiello, R.A., and Chamis, C.C.; LeRC,NASATM82850.Presented at the lOth NASTRANUser's Colloquium, NewOrleans, LA,May 13-14, 1982.
191/192


APPENDIX D
D-1


_ UNITEDTECHNOLOGIESIXI_I_I]I_Y@I_I
DESIGN REQUIREMENTS
FOR
ADVANCED TURBOPROP BLADES
SR-7
Prepared as Part of
Propeller Blade Structural Design Study
NASA Contract NAS3-22394
November, 1983

_ UNITEDTECHNOLOGIES
Section
I
II
IT[
IV
V
TABLE OF CONTENTS
INTRODUC TION
APPROACH TO ANALYSIS
DESCRIPTION OF ANALYSES
DESIGN REQUIREMENTS
DESIGN GOALS
Page
1
2
5
24
32


_ UNITEDTECHNOLOGIESIIIIIIIIII-II011I_i=_.III@._II}IIiI
I. INTRODUCTION
In recent years, considerable attention has been directed toward reducing aircraft
fuel consumption. Studies have shown that the inherent efficiency advantage that turbo-
prop propulsion systems have demonstrated at 0.65 Mn may now be extended to the
higher cruise speeds of todays turbofan powered aircraft. In order to achieve this goal,
new propeller designs will require advancements such as thin, high speed airfoils and
aerodynamic sweep.
A program to conduct structural design studies of large scale blades of this type has
been funded by NASA LeRC. This program includes the establishment of structural
concepts for the fabrication of the SR-7 test bed Prop-Fan blade configuration, and the
definition of it's structural properties.
This document contains a description of the design process, and a description of the
analysis procedures which will be used during the study, and sets forth the require-ments to which the blade will be designed. Since F. O.D. and stall flutter are not
considered hard requirements for blade design based on todays technology, these two
subjects will be addressed under Design Goals.
It is our intent to develop a document which allows for some flexibility.
r 1
_ UNITEDTECHNOLOGIES
If. APPROACH TO ANALYSIS
During the program, the SR-7 configuration will be analyzed using a finite element
analysis method. This method is described below.
Finite Element Analysis Method (Ref. Figure 1)
The blade aerodynamic data, aerodynamic loads, external geometry and internal con-
struction are entered into SHEDS (Structured Hierarchical Engineering Data Storage)
using computer programs H250, H444, H882, H883 and H886 as indicated in the follow-
ing manner.
The blade aerodynamic inplane and out-of-plane loads are calculated using a computer
program (H444). The input to this program is the blade operating condition.
If composite laminates are used in the blade design, the elastic properties will be
calculated using a composite material laminate analysis program, H250_ This pro-
gram has the capability to calculate the laminate stress allowable based on the
orthotropic stress allowables of each layer.
The blade aerodynamic data, aerodynamic loads, and fabrication method are entered
into a computer program (H882) which creates streamline airfoil sections. The air-foil sections are based on a "library" of airfoil coordinate data for many standard air-
foils over a wide range of thickness ratios and camber levels. Internal cross-section
geometry coordinates, where required, and lead edge sheath definitions are alsocreated in H882. The streamline airfoil sections are then stacked relative to one
another by computer program H883 to produce the aero-acousttcally dictated three-
dimensional blade shape. The blade shape is generated by hiring the streamline air-
foil sections and internal blade geometry using spline curves in computer program
H884. Orthogonal planes are cut through the faired blade geometry at desired radial
locations for beam property calculations and manufacturing dimensional definition.
Blade section properties are calculated by computer program H886, based on the radial
station cross-sections. Equivalent cross-sectional properties for non-homogenous
blade components are also calculated using their elastic modulii and density ratios.
Pertinent cross-sectional properties are then integrated along the blade span to deter-
mine weight, blade stiffness distribution, and mass distribution.
The finite element model is generated using program F018. This program utilizes
the blade data from SHEDS and allows the designer to generate the model interactively
on a computer terminal.
The finite element analysis will be performed using a computerized general purpose
three-dimensional finite element program known as BESTRAN-H552. This is a pro-
gram comprising several specialized subprograms which work together, based on the

_ UNITEDTECHNOLOGIES
_[_[_
BLADE AERODYNAMIC
DEFINITION
tBLADE AERODYNAMIC
LOADS
(H444)
I
BLADE FABRICATION
METHODS
,tCOMPOSITE MATERIALS
LAMINATE ANALYSIS
(HZSO)
!
BLADE STRUCTURAL
DESCRIPTION
(H882, H883, 11884, N886)
ISHEDS
TFINITE ELEMENT MODEL
GENERATION
(F018)
FINITE ELEMENT ANALYSIS
(H552}
TCOORDINATE
TRANSFOR-MATfON
(FZ14)
t
H STABILITY ANALSYISAIRFOIL DATA (F203)
IFOD ANALYSIS
(H750/H9 I0)
FIGURE 1. FLOW DIAGRAM-FINITE ELEMENT ANALYSIS

UNITEDTECHNOLOGIES_&_O_©_
methods of finite element analysis. The analysis will calculate steady stresses and
deflections at speed. Frequency, mode shape, and stress distributions will be calcu-
lated at rest and at speed and used to generate the Campbell Plot.
The frequencies, model masses and mode shapes are then input into a stability pre-
processor (F214) that puts the data in a form that is compatible with the stability
analysis (F203). There are two basic reasons for this conversion.. One is that in
the finite element method, the blade is described by discrete elements that must be
converted to a beam type coordinate system, and the mode shapes converted to a three-
dimensional disptacement system. This is to better describe the effects of sweep and
twist. The second is a conversion to the blade section coordinator system. This
latter system is necessary because of small angle approximations in the aerodynamics
that are required by the linear analysis. This analysis will be used to predict stability
for both classical and stall flutter, (See Section HI F).
The blade design will then be subjected to a foreign object damage analysis using com-
puter programs H750/H910. These programs are a three mode interactive blade im-
pact analysis which utilizes a fluid missile model which is interactive with the dynamic
model response of the blade.
Blade Aerodynamic Design Analysis
The Compressible Vortex Program, H409, will be used for the aerodynamic design
and performance analysis of the SR-7 Prop-Fan. This program accounts for the
effects of supersonic Mach number zone of influence and the swept lifting line on the
induced velocities at the blades. The program utilizes two dimensional, compressible
airfoil data which is corrected for blade sweep, cascade interference and the blade
tip Mach cone.
Acoustic Analysis
An acoustic design analysis utilizing the Frequency Domain Near Field Noise
Prediction Method will be used during the aerodynamic design phase.

_ UNITEDTECHNOLOGIES
III.DESCRIPTION OF ANALYSES
A. Aerod}ummic Loads (H-444)
The once-per-revolution (1P) alrloads are computed by means of the Hamilton
Standard strip analysis program (Deck No. H444) utilizingtwo-dimensional
compressible airfoildata. An operating condition is defined in terms of
shafthorsepower, propeller rotationalspeed, pressure altitude,velocity,
ambient temperature and inflow angle. These parameters inturn define the
non-dimensional coefficientsrequired to do a strip analysis, namely, ad-
vance ratio,J and power coefficient,Cp, defined as:
J
Cp
where v
n
D
P
P
= v/nD
= P/p n3D 5
= true airspeed, feetper second
= propeller speed, rps
= diameter, feet
= power, ft. lbs./second
= density, lb. sec.2/ft.4
The advance ratioand inflow angle define the blade advance angle radially
and azimuthally.
An iterativeprocedure is then utilizedto calculate the blade angle at the
given operating conditionto absorb the proper power coefficient,Cp. Forexample, for the eight bladed Prop-Fan eight azimuthal positions are ex-
amined and the elemental power coefficientis integratedboth azimuthally
and radiallyuntilthe required Cp is attained.
Once the blade angle is determined, the elemental in-plane force (Fr) and
the elemental out-of-plane force (F_) are calculated at the advancing and re-P
treating positions. From these results, the change in in-plane and out-of-
plane force (F_r & F_p respectively) are determined. These loads are then
used in the multiazimuth analysis (H045) which is used in the determination
of the excitationfactor defined in IIID. The loads are also used as an input
to the BESTRAN analysis (H552).

UNITEDTECHNOLOGIES
B. Mechanical Loads
1. Steady Tension (H-028 or H-552)
The most obvious load on a propeller blade is due to centrifugal force.
Centrifugal force acts on blade mass elements to produce radial tensile
forces which are additive from the blade tip, R, down to any radius,
r 1, being studied. The total centrifugal load developed at radius r1, isfound by integrating as follows:
R
2 f ArdrC'L" = w Pr_
where _ is the angular rotation speed, p is the mass density of the
blade material, A is the blade cross sectionalarea and rI is the radius
of the blade section. This force is a pure tensile load when the cross
section mass centers are aligned on a single axis perpendicular to and
passing through the axis of rotation. This is commonly called the
"stacking axis".
2. Steady Bending (H-028 or H-552)
As a propeller blade rotates through the air, each portion of the blade
produces a liftand drag force. The magnitude of these forces are de-
terrainedby the specificcharacteristics of airfoilshape and its operat-
ing parameters as shown in Figure 2.
At any blade radial position,these aerodynamic forces, calculated with
a strip analysis program, can be resolved intotwo vectors, thrust (T),
and torque (Q), as shown in Figure 3. Also illustratedis the origin of a
secondary aerodynamic steady load, aerodynamic twisting moment. This
comes from the distance between the quarter chord point and the stack-
ing axis which is commonly the centerline of the blade retentionbearing
and the axis about which the blade angle control mechanism torque is
applied.
Summing these thrust and torque forces along the span of the blade yields
the total thrust and torque per blade. These distributed forces produce
bending moments in the cantilevered blade. From the preceding dis-
cussion of steady centrifugal loads, it is obvious that by offsetting the
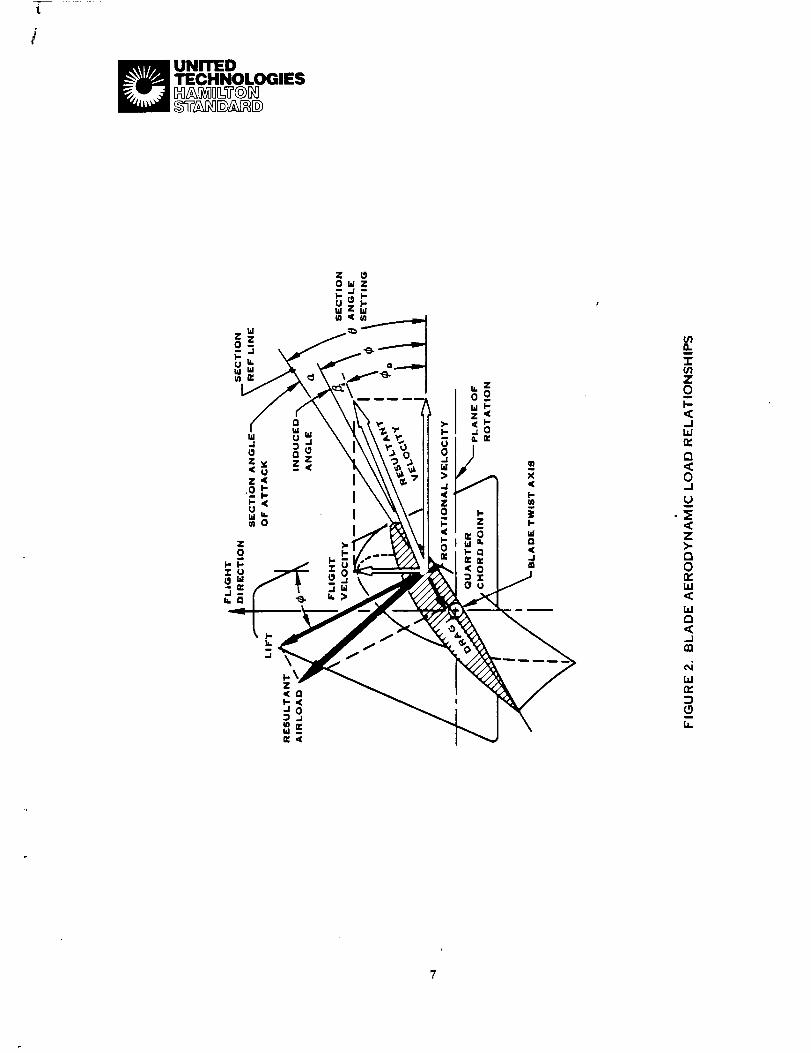
/
UNITEDTECHNOLOGIES
<
i
Z0m
!--<-1
t_<o.J
U
-:E<Z>-t_0r_T,i<
m<
i
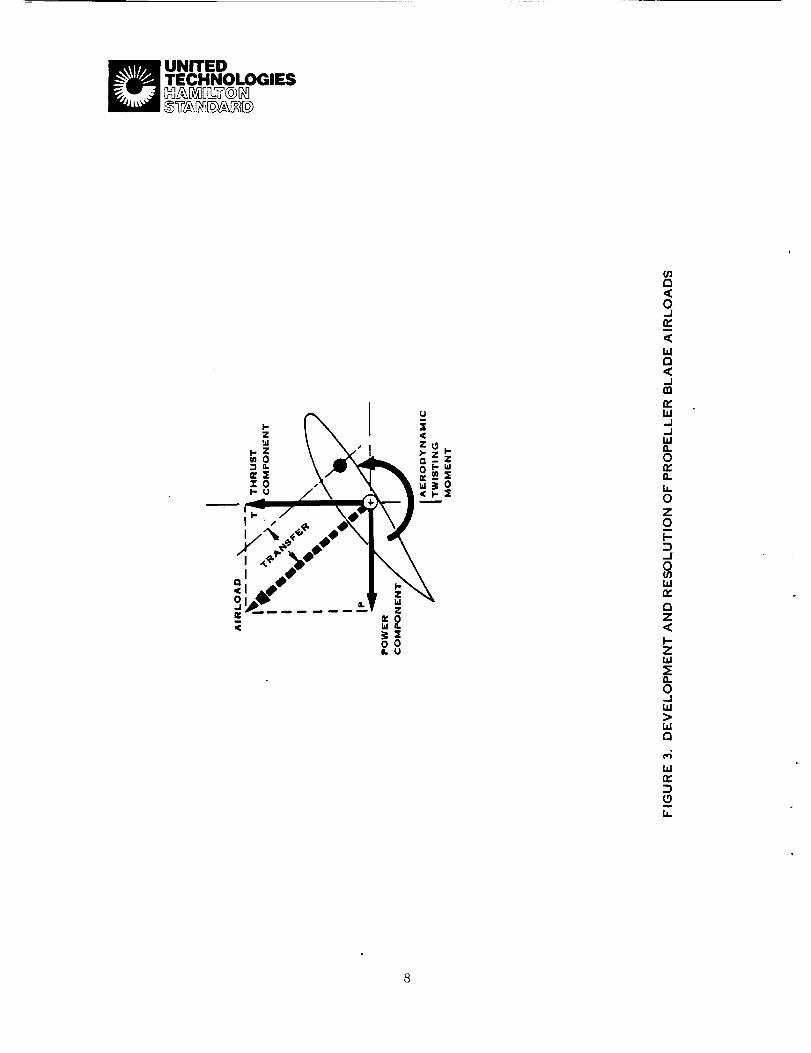
UNITEDTECHNOLOGIES
z <'.d • , Z
_-Z I >'_Z
0
_,/%**" "1_\_,:2oO° 1_- ,,'o< _1Q,.
O0o,. (J
<0_1r_
a
rn
r_W-J
ILl12.0r_I1.
0Z
0
.J0
WO_
aZ<
Zi,i
n0-1i,i
Q
O_

_ UNITEDTECHNOLOGIES
centers of gravity of the blade cross sections from the radial stacking
axis in a systematic fashion, centrifugal bending moments can be devel-oped in addition to the tensile loads. These moments are in a direction
which tends to return the displaced mass center to the radial axis and
are called centrifugal restoring moments. In some blades initial dis-
placements along the local section chordline (sweep) and/or perpendicu-
lar to the local section chordUne (offset) are built into the blade in order
to generate restoring moments which reduce the aerodynamic bending
moments.
3. Steady Untwist (H-886 or H-552)
Since a propeller blade operates in a radialcentrifugalforce fieldthere
are forces developed thattend to alignthe blade parallelto the plane of
rotation. Resolution of these forces about the stacking axis intocentri-
fugal twisting moments can be seen in Figure 4. In thisfigure the total
cross sectionalmass of a typicalblade radialelement is separated into
two centers of mass, one for the leading edge portion of blade at distance
"a" from the plane of rotation;and one for the trailingedge portion of the
blade atdistance 'q_"from the plane of rotation. Radial centrifugalforce
vectors, originatingfrom the propeller rotationalaxis can be drawn
through each of these mass centers. Each of these vectors may be
separated intoradial components parallelto the blade centerline and in-
plane components, PL and PT' parallelto the plane of rotation.
The two components, at moment arms "a" and '_" generate a centrifugal
twisting moment about the stacking axis which tries to align the section
with the plane of rotation. This twisting moment for any specific section
varies sinusoidally with the angular position of that section with respect
to the plane of rotation. Consequently, the twisting moment about the
stacking axis varies sinnsoidally with section blade angle referenced tothe plane of rotation over a period of 90 a.
The twisting moments of each incremental cross section of a blade can be
summed from tip to root resulting in a net twisting moment about the
stacking axis at the blade root. In most operating conditions this centri-
fugal twisting moment is opposite in sense to the previously discussed
aerodynamic twisting moment. The net twisting moment is a torque that
must be carried by the blade angle control mechanism in order to main-
tain blade angle setting.

UNITEDTECHNOLOGIES
.i i,!<
a
;ozI,,, a aZ<<
u ,.I ..I
I-Z
MidZ z
@
_J
<..J
r_
..i
ILl
0r_
0F.-Z
0._i
>
I-
w
14.
10

UNITEDTECHNOLOGIES
These same offsetmass forces lead to twisting moments within the blade
even when the net root twisting moment is zero. This is because a blade
has a builtintwist distributionand there can be no singleblade angle
settingwhich results in a zero twisting moment for allincremental sec-
tions along itsradial length. These internalcentrifugaltwistingmoments,
balanced by aerodynamic twistingmoments, act to reduce the built in
twist distributionof the blade, thus the common term "untwist". Itis
normal to correct for the untwist by building in a compensating amount
of pretwist. As with sweep and offset,pretwist can only be exactly cor-
rect for one operating condition.
The basic explanation of the mechanical loading of a blade given above has
been in beam theory terms. The blade is assumed clamped at somefixed location near the center of rotation. The classicalbeam section
properties are calculated for an appropriate number of blade segments
along the blade radiallength. The radial increment between segments
is chosen depending on the rapidityof geometric variation. These sec-
tions are then stacked in space relativeto a radial line,the stacking
axis, which passes through the axis of rotation. The mechanical body
forces are then determined for the appropriate rotationalspeed by sum-
ming from tipto root. The mathematical description of a twisted, taper-
ered, rotatingbeam subjected to distributedaerodynamic loading is a
complicated process. The methods, however, are well established and
proven by over forty years of application The use of modern computers
has made this task very straightforward.
All of the same mechanical loads can be calculated using finiteelement
analysis methods. The method in common use at Hamilton Standard Is
called BESTRAN. BESTBAN is a broad based system written in FOR-
TRAN language thatis similar to but much less comprehensive than
NASTRAN. Identicalresults have been obtained on comparative running
of the two programs. BESTRAN is more commonly used at Hamilton
Standard than NASTRAN because of a wide variety of pre- and post-
processing methods that are keyed to BESTRAN.
An auxiliaryprogram, STS70, is used for analyzing steady stresses and
deflectionsin rotatingstructures. Itapplies to structures that can be
modeled as plates or shellsof arbitrary shape and thickness. The analy-
sis recognizes centrifugalstiffeningeffect. There are eleven element
types availablewhich includetypes for isotropicor anisotropic materi-
als. Several blade types have been analyzed using BESTRAN. Detailed
comparisons with measured stresses and deflectionsconfirm the appli-
cabilityof this analysis method.
11

UNITEDTECHNOLOGIES
C. Critical Speeds (BESTRAN)
Every piece of rotating machinery has one or more "critical speeds". This
critical speed results from the coincidence of some periodic, speed depen-
dent forcing function and the natural frequency of the machine or some part
of the machine. Certainly any bladed rotating device must be examined for
critical speeds because of the many modes of resonant vibration the individ-
ual cantilevered blades can have and the various ways these blades modes can
combine to produce rotor modes. The periodic forcing functions can bemechanical in origin such as gyroscopic precession, unbalance, engine firing
torques, etc. or aerodynamic in origin such as an inclined flow field or adistroted flow field which becomes periodic to the propeller as it rotates
through it. It is important to note that this discussion does not include "self
excited" vibratory response - flutter phenomena. Flutter involves the inter-
action of the elastic motions of the blade and the aerodynamic loading and is
discussed in Section F.
In propellers, the foundation of a critical speed study is the determination
of the blade frequencies. Vibratory deflections that meet fatigue strength
criteria are small enough so that aerodynamic coupling can be neglected.
The hub to tip diameter ratios and the hub geometry is such that blade dy-
namic response is not influenced by hub dynamics. The blade retention
stiffness and blade angle control mechanism stiffness must be considered as
well as centrifugal stiffening effects.
The range of blade frequencies that are of interest is determined by the num-
ber of periodic forcing functions possible and the strength of those excitations.
For Prop-Fans of eight blades or more, excitations up to 5 per revolution
are judged to be significant. This Judgement is preliminary and will be biased
by the configuration and operating regime of each individual installation. Ac-cepting the 5 per revolution Judgement as appropriate for this study, all
blade frequencies that fall above 5 per revolution at maximum operating
speed need not be considered. This can be seen from Figure 8 which is an
an example of a standard Campbell Plot. Here the first, second, and thirdmodes would be studied for intersections with integer order exciting fre-
quencies, but the fourth mode would not be considered because there is no
critical speed near the operating regime.
The intersection of a blade frequency and an integer order excitation line isstudied because it represents the possibility of excitation at resonance where
the amplitude of response is limited only by the available damping. The lo-
cation of the critical speeds can be altered by the possible modes of rotor
vibration and the dynamic characteristics of the rotor mounting. Rotor
modes can be divided into four basic categories.
12

_ UNITEDTECHNOLOGIES
NZ!
U
I
Ik
4TH MOD£
4P
OPE;RATING
RANGE
FIGURE 5. CAMPBELL, PLOT
13

_ UNITEDTECHNOLOGIES
. Those in which the sum of the vibratory out of plane moments on the pro-
peller shaft is zero, but the sum of the forces is finite. This mode is
called "symmetrical" and is characterized by in-phase bending cf theblades which results in a fore and aft reaction on the rotor mounting.
e Those in which the sum of the vibratory moments on the propeller shaft
is finite, but the sum of the forces are zero. This mode is called "un-
symmetrical" and is characterized by a lateral or whirling reaction on
the rotor mounting.
o Those in which neither a vibratory moment nor a vibratory force is
transmitted to the rotor mounting. This mode is called "reactionless"
since the forces and motions are confined to the propeller; no loads or
motions are transmitted to the rotor mounting.
e Those in which both moments and forces are transmitted to the rotor
mounting. This mode can occur only at lP frequency due to an inclined
flow field or gyroscopic action. The 1P mode is unique in that it doesnot involve resonance although having blade frequencies near 1P will in-
crease the stress response due to inertial magnification.
The above categories only consider the out-of-plane bending and neglect shaft
torque effects. The first three categories are illustrated in Figure 6. The
third category is of particular interest with eight and ten bladed Prop-Fans.
The number of reactionless modes possible for an eight bladed rotor span
the range from 2P to 6P, 7P and 9P are whirl modes and 8P is a symmetrical
mode. Critical speeds for the first six exciting orders can be accurately
predicted from a knowledge of the rotor alone. Critical speeds from 7P to
9P would require a knowledge of the rotor mounting impedance. As men-
tioned earlier, however, excitations beyond 5P are weak enough to be ig-nored. With a ten bladed rotor, the reactionless modes extend from 2P
through 8P, 9t and llP are whirl modes and 10P is a symmetrical mode.
The static and rotating blade frequencies can be calculated by beam theory
or finite element analytical methods. The beam method will be discussed
first.
For the theoretical analysis of the flexural vibration of a propeller blade, itmust be constrained so that at some defined location near the center of ro-
tation only uniform rotational motion is possible. This condition of end fix-
ity was chosen to cover both symmetrical and unsymmetrical rotor modes.
The system is furthermore assumed to be linear, with small vibratory
14
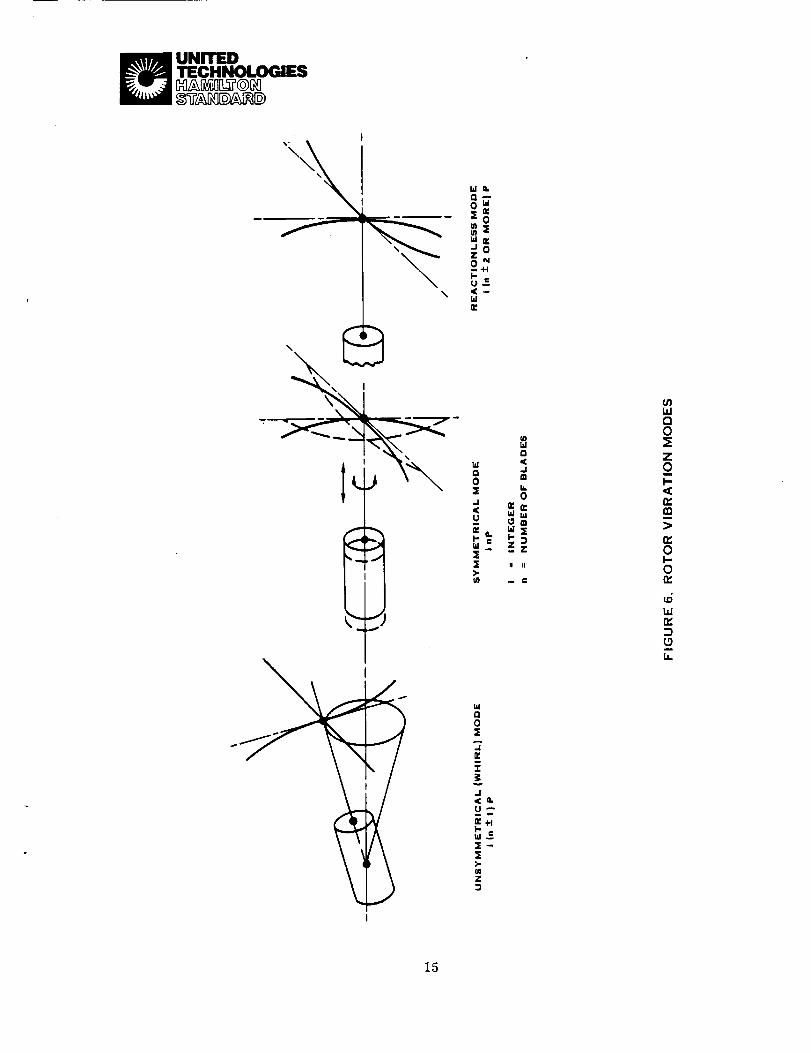
UNITEDTECHNOLOGIES
C2_
Ldr_
_o_
.Ji((J
i[i ._X
>.
r_0X
n*
.J
_j_m mr_+ t
X>.InZ
ld(2,(.Jm
Ik0
_zzII II
I.dr_o
ZolI-
W
r_oI-0r_
d
15
_ UNITEDTECHNOLOGIES
displacements, and simple beam bending theory is used. The differential
equations of equilibrium are first derived and transformed into integral
equations, and they are then examined in the form of a matrix equation for
a segmented blade, which permits the evaluation of vibratory response,
critical speeds, and normal modes by simple classical methods.
The finite element program used for frequency determination is the same as
described in Section III B. An auxiliary program, VIBR, is used that can
perform vibration analysis of a wide variety of simple and complex structures.
It determines vibratory response in the form of modal displacements for all
possible degrees of freedom on systems excited by specified vibratory forces
at the nodes or for specified vibratory frequencies. Problems involving
bending, longitudinal and torsional vibrations, gyroscopic coupling effects,and combinations of effects can be solved. Resonant frequencies are found by
a determinant search. Stress and deflection mode shapes can be generated
and plotted out for any of the determinate cross-overs. Twenty-five element
types are available to describe the blade which attests to broad based appli-
cability of this analysis.
D. Aerodynamic Excitation (HO39 & HO45)
The primary source of vibratory stresses in a turbine-driven aircraft pro-
pellet is the periodic variation in aerodynamic forces caused by asymmetry
in the direction and velocity of inflow to the propeller. Such periodic varia-
tions in force cause excitations at frequencies which are integer multiples
of the propeller speed. These excitations are referred to as "P" orders -
lP, 2P, 3P, etc. The most important of these P-order excitations is the
fundamental or 1P because it is, by far, the greatest in magnitude.
The unsymmetrical inflow to the propeller is caused by two major factors;
1) overall misalignment between the thrust axis and the incoming air velocity,
and, 2) distortions to the free-stream flow due to the lift on the aircraft wing
and distrubances due to flow past the other parts of the aircraft (fuselage,
nacelle, etc. ). The misalignment or angular inflow causes mostly lP ex-citation while the distortions tend to cause both 1P and higher order exci-
tations.
The aerodynamic excitations due to unsymmetric inflow are evaluated by
first determining the pattern of flow coming into the propeller for various
flight operating conditions. This is done by computerized analysis (H039)
which calculates the distrubances caused by the individual structural com-
ponents of the aircraft (wing, fuselage, nacelle, etc. ) and superimposing
them to give the total flow field seen by the propeller.
16

UNITEDTECHNOLOGIES
This program has the capabilityto handle three liftingsurfaces (thewing,
the pylon, and the tailsurface) either separately or simultaneously. The lift
for each ofthese surfaces is predetermined, with the totalliftbeing equal
to the aircraftgross weight. The propeller and nacelle can be located any-
where in the flow-fieldexcept on the centerline of any of the three lifting
surfaces. The flow-fieldeffects analyzed for the liftingsurfaces are; circu-
lationdue to lift,cross flow and rectilinearflow. The effectsof thickness
and sweep of the surface are accounted for. The liftingsurface velocity
components are computed by standard vortex methods that assume the velocity
is proportional to the circulationfunctions and is inversely proportional to
radius as given by:
Vw =4"7sw
and
where
vwr
dr"
SwdL
P
U
dD=dL
PU
= Velocity component radius r
= Radius from the center of the vortex
= Circulation functionor vortex strength element
= Surface semi-span
= Incremental liftalong the span
= Air density
= Local blade sectionvelocity
The velocity component is determined in the plane of the propeller and as-
sumes an ellipticalspanwise liftdistribution. The resultingvelocity is an
integratedeffectthat includes the bound vorticies as well as the trailingvor-
tex sheet.
The cross flow effectis a flow disturbance caused by the component of the
free stream normal to the liftingsurface chord passing around the lifting
surface planforra. The surface is assumed to have an ellipticalcross
17
_ UNITEDTECHNOLOGIES
section and the complex velocity potential is calculated for flow perpendicular
to the major axis of the ellipse.
The lifting surface rectilinear flow is a flow distrubance caused by the finite
thickness of the surface. The surface is again assumed to have an elliptical
cross section and assumes that the chord and thickness are constant. The
complex velocity potential is calculated for flow parallel to the major axis.
The flow field effects analyzed for the fuselage and nacelle are cross flow
and rectilinear flow.
The cross flow is treated as a complex velocity potential where the equations
are solved by treating the body as a number of equivalent cylinders. The
potential function is determined by distributing doublets of unknown strength,
oriented vertically, along the body axis. The doublet strength is then deter-
mined by setting the velocity potential equal to zero on the body surface.
For rectilinear flow, the body is assumed to be an asymetric rankine solid
containing a single point source.
For each of the components (wing, fuselage, nacelle, etc. ) the velocity per-
turbation is computed and superimposed on the free stream flow field in the
plane of the Prop-Fan. Axial and tangential flow components are then cal-culated.
These flow components are then input to a multiazimuth airload program
(HO45). This program accomplishes aerodynamic strip-analysis calcula-
tions at many azimuthal positions to obtain time-history variations of the
aerodynamic loads. Harmonic analysis is then performed on these loads
and the blade dynamic response is computed for each P-order harmonic.
Since the 1P aerodynamic excitation is the most important by virtue of its
magnitude, it is a principal factor controlling the design of a propeller blade.
It has been found that the magnitude of the lP excitation is roughly propor-
tional to the product of the inflow angle and the equivalent airspeed squared.
Therefore a parameter called Excitation Factor (EF) was defined as
EF = _ (3-_)'Ve 2, where _ is the inflow angle in degrees and Ve is the equiv-
alent airspeed in knots. Excitation Factor is a convenient measure of the
severity of 1P aerodynamic excitations, and the manner in which EF varies
with flight conditions is an important consideration.
18

_ UNITEDTECHNOLOGIES
This method was used to estimate the excitationsdue to the flow fieldsfor
Prop-Fan installationson both Douglas and Boeing preliminary design air-
craft. The results of these two studies along with a typicalapplicationutil-
izingan under the wing mounted Prop-Fan were used to generate an EF
which could be input intoour response program, HO26. As such, the results
do not represent any one particular aircraft.
E. Response (HO26)
The response of a propeller to periodic unsteady aerodynamic loads as mea-
sured by stress or deflectionamplitude is determined by four items:
1. The magnitude of the unsteady applied air loads.
2. The totalstiffnessof the blade which must include the centrifugalen-
hancement of the staticstiffness.
. The instantaneous elastic angular deflectionof the blade since itis a
firstorder influenceon the angle of attackof the distributedairfoil
sections. Bending motions and cross sectionaldistortionalso affectthe
thrust and torque generated by a propeller blade. These lattertwo dis-
tortions are negligiblysmall because of the inherent stiffnessand mass
of a propeller blade relativeto the magnitude of the cyclic air loads.
4. The proximity of a criticalspeed to a predominant harmonic of the un-
steady airload.
For this study, itis desirable to define an excitationfactorwhich is a mea-
sure of the totalvibratory excitation,includingthe nP harmonics. The way
a blade responds to nP excitationsisdependent upon criticalspeed locations
or nearness to resonance. In order to define an equivalent excitationfactor,
a magnification factor willbe assumed and applied to the nP excitations.
With beam modeling, allfour of these effects are handled. The method re-
quires a complete multi-degree of freedom model of the rotatingblade and
a harmonic descriptionof the unsteady air loading. The air loads are ap-
pliedwith proper periodicityas distributionsof thrust and torque forces
along the blade radial span. The twist deflectionsare iterateduntilequil-
ibrium is achieved. The resultingmodified radial airload distributionis
then used to calculatethe bending moments in the rotor coordinate and local
blade coordinate systems. The moments are modified by applying a dynamic
magnification factor based on the proximity of the harmonic content of the
19
UNITEDTECHNOLOGIES
unsteady loading and the critical speeds. This modified moment distribution
is used to calculate blade deflection and stressing. The blade root moments
and shear forces are also summed at the rotor attachment to predict rotor
hub and attachment loadings.
The use of a finite element model of the blade results in a more exact des-
cription of the blade structure but the interaction of this model with the ap-
plied airload is not as well modeled as with the beam approach. This is not
an inherent limitation of the finite element approach, the methodology has
not yet been developed. For this study, the moments and forces as defined
at the appropriate nodes along a line representing the center of pressure for
each radial airfoil section will be represented by distributed loads across
the respective blade chords. Stresses and deflections will be calculated for
each load case and the maximum difference anywhere in the airfoil will be
determined. This stress range will be combined with the appropriate steady
stress and used for the fatigue life determination.
F. Flutter (F214 and F203)
In the past, flutterin the classical sense, has not been a problem for conven-
tionalpropeller designs and conventional operating conditions. The Prop-
Fan, however, with itshigh activityfactor operated at dynamic pressures
much greater than those found in the conventional propeller environment.
The Prop-Fan also has more blade sweep and smaller thickness ratiosthan
conventional propellers. These reduced thickness ratiosmay result in a
reduction in stiffnesswithout an equivalent reduction in airloads. Conse-
quently, there is more concern with regard to blade stability. For this de-
sign study, both stalland classicalflutterwillbe investigatedusing the re-
cently developed stabilityanalysis, F203. The analysis has a linearnormal
mode complex eigenvalue solution,which provides totaldamping at high sub-
sonic Mach numbers on a singleblade. The initialstructural representation
can be depicted by BESTRAN or NASTRAN finiteelement methods, where
the response is described by modal deflections,modal frequencies and modal
mass for each element. The modes are fullycoupled and can be adjusted to
account for steady displacements caused by the steady air[oads defined by
the blade aerodynamic load program, H444.
The flutteranalysis, F203, requires that the structural description be trans-
formed to a beam type coordinate system defined at the blade sectionwhere
the modes are described in three dimensions. Since this is a linear analysis
with the definitionof the coordinate system as defined above, the inertialand
centrifugal effects at large thrust and blade angles can be better approximated.
20
UNITEDTECHNOLOGIES
The transformation is accomplished in a preprocessor (F214) which uses the
outputfrom BESTIqAN or NASTRAN and creates an input filefor the flutter
analysis.
The equations of motion are generalized in a normal modes approach and are
fullycoupled. The forcing functionswhich include quasi-steady and unsteady
functions, the effectivemass, damping and stiffnessterms are generated us-
ing linearaerodynamics.
The quasi-steady terms are developed from the vibratory displacements and
are provided in tables developed by Jordan, REF. 1, along with the unsteady
terms. These tables have been modified by methods similar to those used
by Cunningham, REF.2, to account for sweep effects. The unsteady aero-
dynamics, includingphase lag terms, are developed as a function of reduced
frequency. Prandtl-Glauret corrections are applied to the liftand moment
slopes to account for compressibility effects. Cascade effects are also in-
cluded in this analysis in accordance with the theory of BEF. 3.
The solution is a linearcomplex eigenvalue one solved by the P-K method of
REF.4. The aerodynamics are a function of frequency, and simultaneously
have a strong effecton modifying the response frequency of the blade. Con-
sequently, itis necessary to iteratethe solutionas itis modified by the aero-
dynamics. The results of the above methods produce the complex eigen-
vectors (or frequencies), and damping for allmodes.
By applying Steinman's theory, REF. 5, a method of approximating the aero-
dynamic forces and phase lag inthe stalledregion was obtained. The result-
ing new terms are then substitutedfor some of the aerodynamic terms in the
present analysis, and the solutionis carried out using the above mentioned
methods. The Steinman aerodynamics uses the local liftand moment curve
slopes. In our present analysis, the local liftand moment curve slopes are
computed using the Hamilton Standard stripanalysis program H444, so that
the real aerodynamic effectswillbe considered.
Additionally, an energy approach to the structural response was also devel-
oped as a solutionto the Steinman aerodynamics. Options are availableto
allow use of one or allof the above mentioned methods.
For allthe options, the output is in the form of damping and eigen frequencies
which are plottedas functionsof airspeed, RPM, blade angle and altitude.
The flutterboundaries can be determined from the points where the damping
goes through zero. Itis at these points where the response becomes unstable.
21

_ UNITEDTECHNOLOGIES
If the flutter boundary occurs outside the flight envelope, classical flutter
will not be present. If the value of horsepower, obtained at the point where
the damping ratio goes to zero, is larger than the power available, then stallflutter will not occur.
G. Foreign Object Damage Analysis (H750/H910)
The evaluation of foreign object impact resistance involves three steps:
1. The definition of the impact conditions;
2. The determination of the gross impact loads, blade response, and blade
stressing from the gross structural blade characteristics; and
3. The determination of local stressing based on detailed local stress
analysis.
The first step is fundamental to all of the blade designs since it depends only
on the engine characteristics, size and density of the foreign object, the
airspeed, and the radial impact position on the blade. For this program,
the operating condition which previous analyses have shown to be the most
severe will be used. A preprocessor determines the penetration of a cylin-
drical mass (representing the object) into the plane of the rotor and thus de-
fines the fundamental impact parameters of size, weight, velocity and angle
of impact of the slice of the ingested foreign object, which are needed for the
second step of the analysis.
Having defined the impact conditions, the gross blade impact load, response,
and stressing with time will then be calculated using the 3 dimensional (3
mode) computer program, H750/H910. The data stored in the SHEDS system
for the blade designs are the structural characteristics that are used by
H750/H910 in the FOD analysis.
The Three-Mode-Interactive Blade Impact Program utilizes a fluid missile
model which is interactive with the dynamic modal response of the blade.
This feature is essential to the analysis of FOD impacts, since the changing
impact angle due to blade twist, the physical size of the missile, the chang-
ing rate at which it spreads on the blade surface during the impact event and
the spreading mass thickness distribution have a large influence on blade
response. The three-mode analysis uses the three beam-type modes of vi-
bration to characterize the gross blade dynamics; i.e., the first flatwise
bending, the first edgewise bending and the first torsional modes. Although
22

_ UNITEDTECHNOLOGIES
coupling between blade modes is accounted for in the dynamic characteris-
tics input to the three-mode analysis, only the dynamic response of the bladeflatwise and torsional modes are coupled in the impact. This makes the cal-
culated blade response stresses slightly conservative.
The accuracy of the analytical methods has been confirmed by several tests.
In addition, the pressure distribution as calculated for the fluid missile mod-
el used by the three-mode analysis correlates quite well with test data.
After defining the gross blade characteristics, and the resulting impact loads,
gross stresses, and response with time for the various impacts, the blade
willthen be analyzed for local stressing in the impact region. This stress
willbe calculated using the impact load distributionand magnitude from the
gross impact analysis. The gross blade stresses and the localblade stress-
es are then compared to appropriate material stress allowables and to the
foreign object damage limitsas defined in the Design Reqnireme_s Docu-
ment to determine ifthe blade design satisfiesallof the specifieddesign
requirements.
H. Blade Aerodynamic Desi[_nAnalysis
For Prop-Fans, which are designed to operate at helical tip Mach numbersbetween 1.0 and 1.2; the relative velocity between the blade and wake vortex
segment may be supersonic. Since the Prop-Fan is basically a rotating wing
that creates a helical shaped wake, there are portions of the helix particu-
larly in the near wake, where the Biot-Savart relation does not apply. Sincethis relation indicates that the near wake contributes most to the induced
velocity at the blade, the predicted blade tip induced velocities are therefore
lower than they would be for subsonic helical Mach numbers. Consequently
higher loads will be carried to the blade tip region, since the induced losses
are reduced. A correction is therefore applied to the two-dimensional air-
foil data which negates some of the advantages offered by these lower in-duced losses. This correction lowers the lift and drag coefficients for theairfoils which are within the Mach cone and exhibit helical Mach numbers
greater than or equal to one.
I. Acoustic Analysis
The near field noise will be calculated using the Hamilton Standard Prop-Fan
noise calculation procedure. This procedure calculates thickness noise,loading noise and guadrupole noise contributions. The levels of five har-
monics of blade passing frequency will be calculated for three tip clearancesat the maximum noise location (i. e., plane of rotation).
23
UNITEDTECHNOLOGIES
.
e
3_
g
The far field noise for the two propellers will be calculated in terms of EPNL
for two operating conditions. This type of calculation will include unsteady
loading effects due to angle of attack and wing upwash.
REFERENCES
-5.
Jordan, P.F., "Aerodynamic Flutter Coefficients for Subsonic, Sonic, and
Supersonic Flow (Linear-Two-Dimensional Theory). Rep. No. Structures 141,
British R.A.E., April 1953, ARC. R&M 2932-1953.
Barmby, J.G., Cunningham, H.J., and Garrick, I.E., "Study of Effects of
Sweep on the Flutter of Cantilever Wings," NACA TN 2121, June 1950.
Smith, S.N., "Discrete Frequency Sound Generation in Axial Flow Turbomachines",Great Britain A.R.C. R&N[ No. 3709, 1971.
Hassig, Herman, "An Approximate True Damping Solutionof the Flutter
Equation by Determinant Iteration",J. Aircraft, Vol. 8, No. 11, November 1971.
Steinman, D.B., "Aerodynamic Theory of Bridge Oscillations," American
Society of Civil Engineers Transactions, Paper No. 2420, October 1949.
24

UNITEDTECHNOLOGIES
DESIGN RE(_UIREMENTS
A. Configurations
The configurationwhich willbe structurallyanalyzed is listedin the following
table.
Tip Speed (ft/sec)
Tip Diameter (feet)
Number of Blades
Tip Sweep (degrees)
ActivityFactor
Operating Conditions
_V _ .
BLADE DEFINITION
Be
SR-7
800
9
8
35.7
227
This section defines the operating conditions to be used during the design
study.
1. Load Spectrum
Condition
MIn Climb
Cruise
40% O'speed
Altitude Airspeed SHP Fan rpm
Seal Level 0.2Mn 6000 1698
35,000 feet 0.8Mn 2592 1698
35,000 feet 0.8Mn 0 2377
2. Foreign Object Damage
e
The foreign object damage analysis willbe conducted at the take/off
climb condition.
Excitation Factor
The maximum excitation factor was determined to occur at the following
condition.
Condition Altitude Airspeed Gross Weisht
Climb Sea Level 190 Knots 250,000 Ibs.
25

_ UNITEDTECHNOLOGIES
4. Centrifugal Twisting Moment
1
o
The centrifugallyinduced twisting moment at the blade root about the
blade retentionbearing centerline willbe calculated at maximum rated
speed as a function of blade angle setting. This will permit scaling for
other operating speeds and blade angles by the relationshipsdiscussed
in Section IIIB. 3. This twisting moment must be combined with aerody-
namic and frictiontwisting moments in order to size the blade angle con-
trol mechanism.
Overspeed
All elements of the rotating propeller will be designed to withstand 125%
overspeed or 150% centrifugalload with no inelasticdeformation.
All elements of the rotating propeller will be designed to withstand 140_
overspeed or 200% centrifugal load. This includes the blade, retention,disc, and blade angle control mechanism. Local inelastic deformation
will be permitted in all of these elements at this overspeed but the pro-
poller will be capable of changing pitch after exposure to 140% overspeed.
Flutter
The classicalflutterboundary will be computed using the methods pre-
viously described for various operating conditions. The requirements
are defined to be:
a. The calculated flutterMach number must be greater than the flight
profilegiven in the LAP lqFP (ExhibitA, Figure 1).
be At 14,000 ft. altitude,the calculated flutterMach number must be
greater than 0.8 at a test rig horsepower and IRPM equivalent to
the design power coefficientand advance ratioto allow testing in
the Modane wind tunnel.
Stallflutterwillbe calculated for various horsepowers and propeller
rpms.
7. Aerodynamic Loads
The aerodynamic loads willbe determined for the conditions listedin
IV B.1.
26
_ UNITEDTECHNOLOGIES
8. Mechanical Loads
a. Steady Tension
The steady tension loads willbe determined at 100%, 125%, and
140% of maximum rated speed.
b. Steady Bending
The centrifugallyinduced steady bending loads willbe determined at
100%, 125%, and 140% of maximum rated speed. The aerodynamical-
ly induced steady bending moment willbe determined at maximum
rated thrust and 100% speed only. Propeller overspeeds are gener-
allyassociated with a loss in thrustdue to a blade anglefault or ap-
plicationof negative torque, so that centrifugallyinduced bending
moments are dominant at 125% and 140% overspeed conditions.
c. Steady Untwist
The centrifugallyinduced steady untwist stresses willbe determined
at I00%, 125%, and 140% of maximum rated speed. The aerodynam-
icallyinduced twisting loads willbe determined at maximum rated
thrust and 100% speed only. The centrifugalloads would be domin-
ant at the overspeed conditions.
d. Other
Other loads are present but, particularlyfor large commercial
transport aircraft,the load limits set by the airframe and passenger
comfort keep the resultingpropeller stressing well within the capac-
ityof the propeller. These loads include:gyroscopic, hard landings,
gusts, etc.
C. Critical Speed Margins
The aerodynamically induced cyclic loads during cross-wind operation on the
ground are commonly more severe than experienced when the aircrafthas
forward airspeed. For the 2P excitation,the ground operation critical
speed margin shallbe a minimum of 20% of propeller speed and resonant
frequency. The flightmargin shallbe a minimum of 10% of propeller speed
and resonant frequency. This margin shallbe reduced inversely as the
exciting order is increased from 3P to 5P. No 1P criticalspeeds shallbe
27
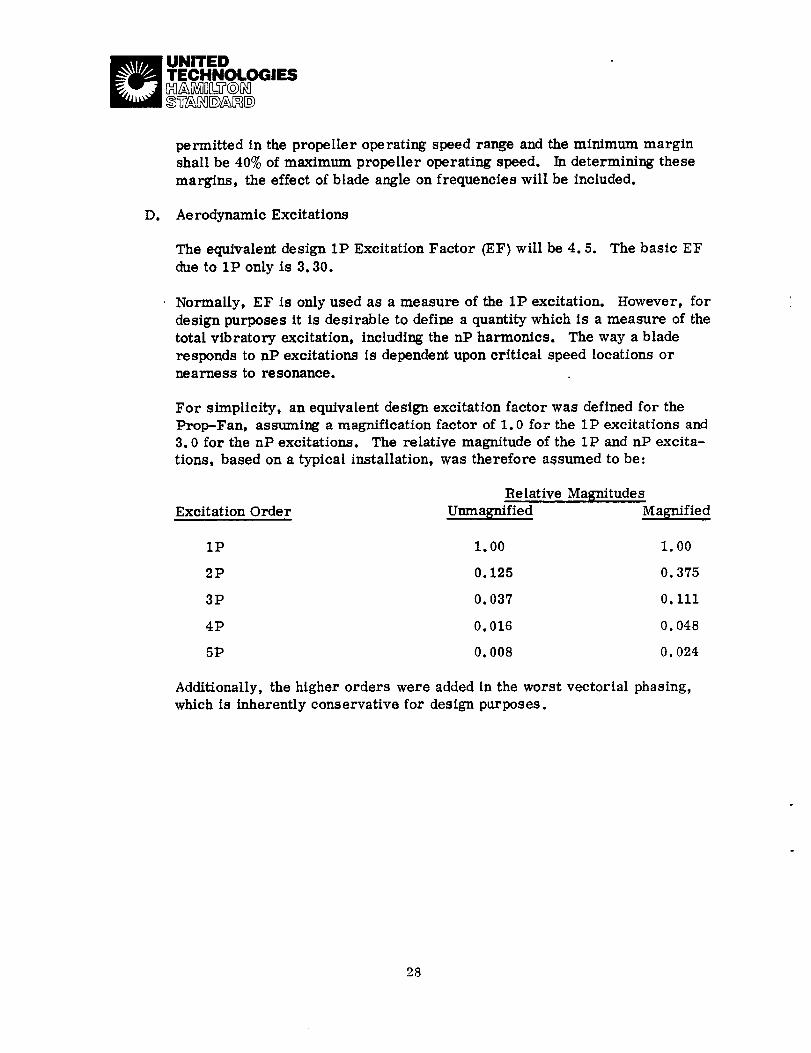
UNITEDTECHNOLOGIES
permitted in the propeller operating speed range and the minimum margin
shall be 40% of maximum propeller operating speed. Indetermining these
margins, the effectof blade angle on frequencies willbe included.
D. Aerodynamic Excitations
The equivalent design 1P Excitation Factor (EF) willbe 4.5. The basic EF
due to 1P only is 3.30.
Normally, EF is only used as a measure of the 1P excitation. However, for
design purposes itis desirable to define a quantitywhich is a measure of the
totalvibratory excitation,includingthe nP harmonics. The way a blade
responds to nP excitationsis dependent upon criticalspeed locations or
nearness to resonance.
For simplicity, an equivalent design excitationfactor was defined for the
Prop-Fan, assuming a magnification factor of I.0 for the lP excitations and
3.0 for the nP excitations. The relativemagnitude of the 1P and nP excita-
tions, based on a typicalinstallation,was therefore assumed to be:
Excitation OrderRelative Magnitudes
Unmagnified Magnified
lP 1.00 1.00
2P 0.125 0.375
3P 0.037 0.111
4P 0. 016 0. 048
5P 0.008 0.024
Additionally,the higher orders were added in the worst vectorial phasing,
which is inherently conservative for design purposes.
28
UNITEDTECHNOLOGIES
Comparisons made between measured and calculated 1P response stresses
have shown a lack of correlation for swept blades. Since the measured
stresses were higher than those calculated, a correction factor isbeing ap-
pliedto the calculatedvalues. Additionally, since the estimated effective
stress obtained using NASTRAN is greater than that obtained using BESTRAN,
a second correction factor is also being appliedto the calculated values. The
resultantcorrection factor, which is to be applied to the lP stresses only for
the SR-7 design, is indicatedin Figure 7.
E. Distortion Criteria
During normal operation a propeller blade distortselasticallydue to steady
and cyclic loads. The cyclicdeformations are small as compared with a
helicopter blade, small enough so that accurate structural response can be
determined without inclusionof aeroelastic coupling for allcyclic excitations
except that at 1P frequency. At lP frequency the aeroelastic effectscommonly
are lessthan 10% of the basic loading. Consequently, the elasticdistortions
due to cyclic loadingwill not be evaluated. Due to steady loads a propeller
blade can change diameter, sweep, offset,twist and camber. Width and
thickness changes are insignificant.Of these fivegeometric changes, only
offsetvariations have no aero-acoustic effect. The magnitude of the other
four distortionswill be determined to permit comparisons between construc-
tionconcepts.
No absolute limitswillbe set on distortion,other than those implied by stress
and buckling limits. The acceptabilityof distortionswithin the stress and
buckling limits should be determined by their affecton aero/acoustic perfor-
mance over the operating range. In thisprogram, the distortionswillbe
used as an evaluation of the fabricationconcept.
F. Flutter Margins
To provide a safetymargin, classicalfluttershould clear the Modane test
point of 14,000 ft. and the conditions of B6 above, with the blade natural
frequencies degraded by 15% at alloperating RPM's up to 105% of the nor-
mal maximum.
29

_ UNITEDTECHNOLOGIES
O
k
n,0I-U<Iko)m
Q.el-IdZ >"_ rn<
_ Q_ w
u,J .l
_uI-uO<Z
b.>,0._
a.w -
1...
liJ m
0
m
0
d
o X
o
d
Z<
I--
IJLIm
0Z
(/1ZoI---<..J
L__J<(J
r.DOli,in,"I--U1n
r,_
(/1
LI.IrY
(.9
h
3O
UNITEDTECHNOLOGIES_t_llll_,y@_
G. Stress Margins
He
The combined steady and cyclic stresses will be plottedon modified Goodman
Diagrams for the materials of construction. The strength boundaries will
represent a high probabilityof survival derived from experimental data on
specimens_and fullscale structures. As a minimum, the boundaries will
represent x - 3.5 ¢ lines. The start-stop stress range will be reflected
against a boundary for a lifeof 150 x 103 cycles. The high cycle combined
stresses willbe reflectedagainst a boundary for 100 x 10_ cycles or infinite
life.
The maximum elastic(nominal x kT) stressing due to a 120% overspeed andthe nominal stressing due to a 140% overspeed willbe kept below the 0.2_
offsetyield strength for homogenous metal materials. The change in elastic
modulii will be kept below 5% for fiber reinforced resin material regarding
these same overspeed requirements.
Features
1. Repairability
Consideration will be given to the use of materials in the blade which can
be repaired in the fieldin the event of minor damage in service.
2. Replacement
The blade retentiondesign will allow for the replacement of a single
blade in a Prop-Fan assembly while installedon an engine.
3. Leading Edge Protection
The outer portion of the blade leadingedge willbe protected with a
partialchord width metal sheath.
4. Lightning Protection (FAR part 25. 581)
Lightning protection willbe incorporated in the blade.
5. Ice Protection (FAR part 25 appecdLx C)
The inner portion of the blade leading edge will contain an electric
heater. However, the heater will not be connected and will
therefore not be functional. The heater is present to allow evalu-
ation of its effect, if any, on structural integrity.
31

_ UNITEDTECHNOLOGIES
6. Life and Reliability Goals
The blade will be designed for the following goals:
Maximum Continuous Stress
Level
Replacement Life
Mean Time Between Unscheduled
Blade Removals (8 blade set)
(inherent)
Infinite Life
35,000 hours
50,000 hours
32

_ UNITEDTECHNOLOGIES
V. DESIGN GOALS
A. Stall Flutter
The propeller shall be free of stall flutter up to 100% of take-off power at
100% design speed for forward thrust, and up to 20% of take-off power at
100% design speed for reverse thrust.
B. FOD Criteria
The foreign objects are classified into three categories as follows: minor,
moderate, and major impacts. Major and moderate impacts correlate with
Group I and II definitions in FAR Advisory Circular 33-1B dated April 22,
1970. Minor impacts include sand, small stones, and birds up to about four
ounces. Moderate impacts include two inch hailstoues and birds up to two
pounds. Major impacts include a single bird up to four pounds. The damagecriteria are as follows:
Minor Impacts - No damage allowed to basic blade structure. Operation will
continue without impediment.
Moderate Impacts - Damage can include loss of material or airfoildistortion.
Operation shallcontinue at 75% power minimum for fiveminutes. No
metal fragments shallbe lostwhich can penetrate the aircraftfuselage
pressure shell. Roughness shallbe tolerable and as a guide, rotor un-
balance force shah be kept below 5,000 pounds.
Major Impacts - Damage can include loss of material or airfoildistortion.
Abilityto feather the propeller must be maintained. A shutdown must
be accomplished without catostrophic effects on airframe structure. As
a guide, the rotor unbalance force shallbe kept below 25,000 pounds.
No metal fragments shallbe lostwhich can penetrate the aircraft fuse-
lage pressure shell.
33


APPENDIX E
E-I

DESIGN SELECTION DOCUMENT
FOR NASA LeRC
NAS3-22394
NOVEMBER,1983
HAMILTONSTANDARD
DIVISION OF UTC
WINDSORLOCKS, CONNECTICUT

INTRODUCTI ON
In response to predicted energy shortages with the associated
rising aviation fuel costs, NASA has sponsored studies of fuel
conserving aircraft and propulsion systems since 1975.
One of these propulsion systems, Prop-Fan, is a small diameter,
highly loaded, multibladed, variable pitch advanced turboprop.
Because of the high speed flight regime of the Prop-Fan with
cruise Mach numbers in the region of 0.7 to 0.8; the blades,
spinner and nacelle must be carefully integrated to minimize
the adverse effects of compressibility.
In various studies, the Prop-Fan has been found to offer sig-
nificant reductions in fuel burned and direct operating cost
when compared to turbo-fan powered aircraft. In view of the
attractive fuel savings potential of the Prop-Fan propulsive
system, NASA has included the Advanced Turboprop Project as part
of the of the Aircraft Energy Efficiency Program.
As a result of this study project, the seventh of a series of
single rotation (SR) Prop-Fans has been investigated and desig-
nated SR-7. The previous models, the SR-I, SR-IM, SR-2, SR-3,SR-5 and SR-6 have been tested in the NASA Lewis 2.44 by 1.83 M
(8 x 6 ft.) supersonic wind tunnel. Each has been designed fora 0.8 Mach number cruise condition and an altitude of 10688 M
(35000 ft.). Two of the models, the SR-I and SR-2 were pre-
viously tested in the United Technologies Research Center's
(UTRC) 2.44 M (8 ft.) high speed wind tunnel.
All of the previous models were designed to a specified tip
speed and power loading. In designing the SR-7, the tip speed
and power loading combination was selected to yield minimum fuelburned for a selected aircraft and mission.
This document describes the selection process that was used to
define the SR-7 blade configuration for the Large Advanced Pro-
peller (LAP) program.

THE OBJECTIVES OF THE SR-7 TRADEOFF STUDY
WERE TO PROVIDE A BASIS FOR SELECTION OF
A PROP-FAN CONFIGURATION FOR USE ON A
FULL-SIZE TRANSPORT, AND TO PROVIDE A
SCALABLE PROP-FAN CONFIGURATION FOR A
FLYING TESTBED.

A SURVEYOF PUBLISHED LITERATURE AND AIR-
LINE, AIRFRAME AND ENGINE MANUFACTURER
OPINION WAS REVIEWED TO DEFINE AN
AIRCRAFT AND MISSION FOR THE SR-7 DESIGN,
(FIGURE i).

16= -m
o
0
O O O O • • • • • •
r,i
L,I,,,

THE TRADEOFF STUDY WAS CONDUCTED AT THIS
CRUISE CONDITION BY VARYING BLADE GEO-
METRIC PARAMETERS TO ESTABLISH THE
PROP-FAN CONFIGURATION RESULTING IN THE
MINIMUM AIRCRAFT FUEL BURNED AND DIRECT
OPERATING COST. EACH BLADE DESIGN PARA-
METER WAS EVALUATED RELATIVE TO A BASE-
LINE BLADE. PARAMETERS STUDIED INCLUDED
TIP SPEED, POWER LOADING, BLADE NUMBER
AND DISTRIBUTIONS OF BLADE SWEEP, THICK-
NESS RATIO, PLANFORM, DESIGN LIFT COEFFI-
CIENT, TWIST AND BLADE STACKING (DEFINED
AS THE THREE-DIMENSIONAL HALF-CHORD LOCA-
TION). (FIGURE 2.)

X "=®
4-a
_[_ "--
..J
n
Eo
m
a_
L__
4.J
r_ E
Q.
_o
x
.tz
inm
im
n
slm
00
Y
r
r
v
Y
0 _ 0 00 _ 0 _ 0i| r v r
OD r_ _JD 00
gn
v
aw
zu
Z@U
v
W
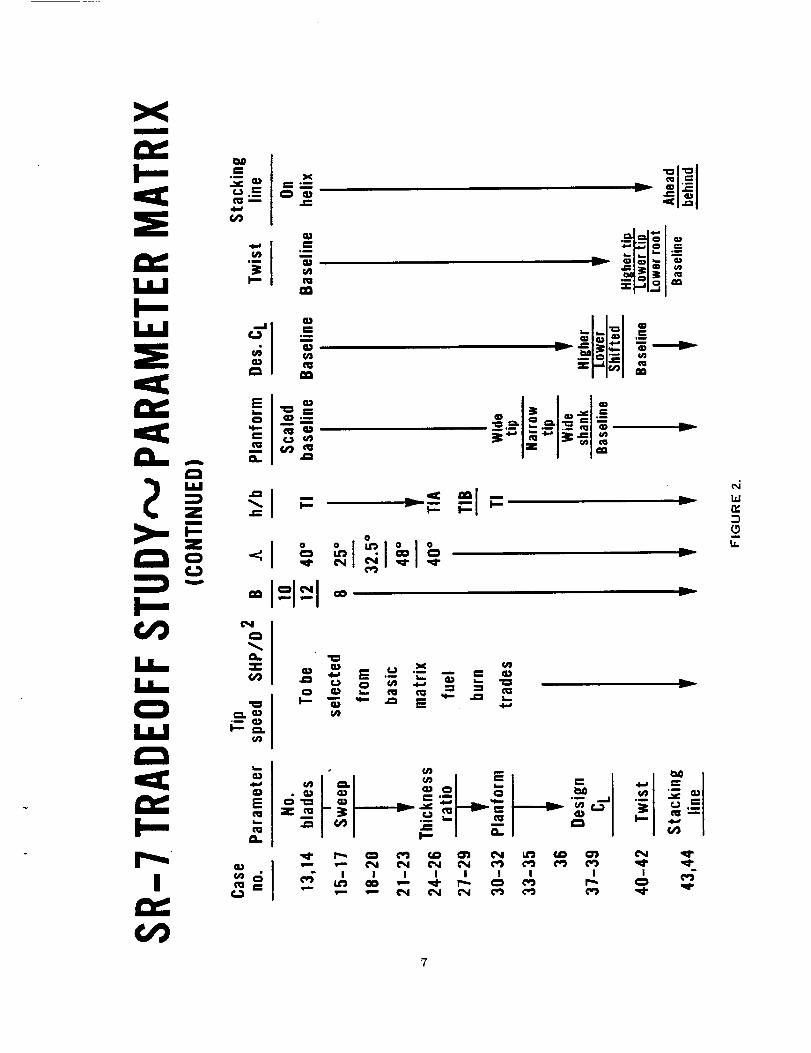
Xi
e_
L
b.- "- i-- I_ I I__zo o I _"_1 o I o
"_ "_" _1 _1 _l'l _"
%
ol ol __.__1oi _ = ol
=: _ ___ _E._ _ I
i,Ie:
0m
I.i.

GEOMETRIC PARAMETERS THAT WERE MOST IM-
PORTANT IN INFLUENCING AIRCRAFT FUEL
BURNED AND DIRECT OPERATING COST WERE
BLADE NUMBER, SWEEP ANGLE, BLADE THICK-
NESS RATIO AND BLADE PLANFORM.
(FIGURE 3.)

ORIGINAL; PAGE Ig
DE POOR QUALITY
.-e
il,j.
j
_.. u_ _ _ _ •
jJjjj'!!!J!___JJJJJJJ
E
m

FOR THE RANGE OF BLADE NUMBER STUDIED,
EIGHT TO TWELVE, TWELVE BLADES YIELDED
THE LOWEST FUEL BURNED. TIP SWEEP ANGLE
WAS VARIED BETWEEN 0 AND 48 DEGREES. THE
HIGHEST SWEEP STUDIED PERFORMED BEST.
INCREASING BLADE THICKNESS RATIO CAUSED
SEVERE INCREASES IN FUEL BURNED AND
DIRECT OPERATING COST. FOR THE BLADE
PLANFORMS STUDIED, A NARROWER TIP CHORD
PROP-FAN WAS THE BEST DESIGN.
(FIGURES 4-7.)
I0

% "o'o'av
I
I I IO0 (|SO0 JeMO'I)
LL.I II (lenl sse-I) ------
% len_-IV
Z
_=-I I
LdwDL_la=
11

%'o'o'av
=O
I I I I I I
% len_-IV
u')
12
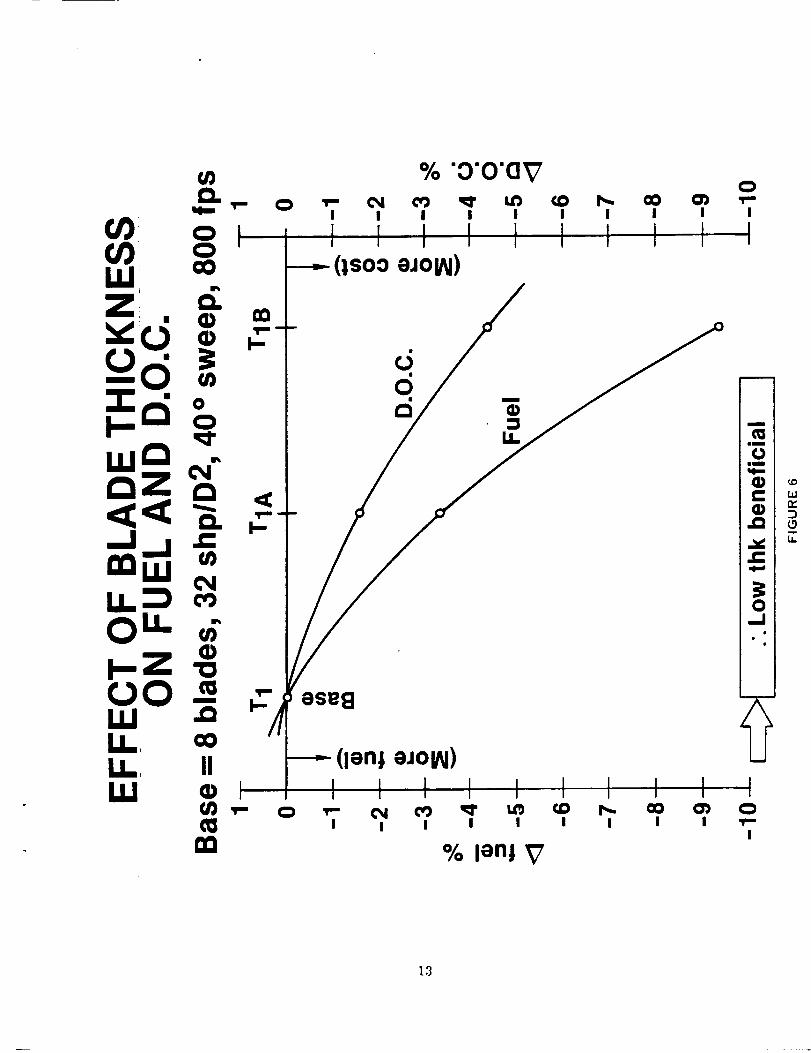
13

>-rr<1:
Or)
>-
(/)
0m
0Z00LU
m
0q..
C4)
.Q
4)"0(O
mm
EJ_ •
4)!._
O
m
Oq_
4)
._2
Q.
(i)
Im
O
m
(O
0qm
C4)
.Q
U)4)C
0.1=
0
O
m
(.1q,m
C.
._2
Im
0
(J
Q.
0ImIm
0
(J
q.,.q,,,.
m
E
E(/)
.C:
C
0
rr
e
r_W
_)
14

AERO/ACOUSTIC STUDY RESULTED IN THE IN-
DICATED TRADEOFF STUDY BLADE BASED UPON
51 ITERATIONS wITH RESPECT TO PERFORM-
ANCE. (FIGURE 8.)
THE TRADEOFF STUDY REVEALED THAT THIN-
NESS, INCREASED SWEEP, AND INCREASED
NUMBER OF BLADES WAS GOODNESS.
15

0
!',. _ 0o. _ c6 "(3) _ I_ _ 03
Xiim
i
U.U.0U.!
n,,
Q)C
iim
m
m
0 CO _-
0
Ii,
Z
.-- _ 0
m
E o .__.¢U 0
IIM
O_
"(3
,,k,I
e_/
CO
C_
"0
O.
Q)
iim
!-
Xiim
m
0
l
m
a2
l.dty
(3
I./.
16

A FULL SCALE BLADE STUDY OF AN SR-5 (10 WAY),
SR-3 (8 WAY,.A.= 39.6°), and SR-3 (i0 WAY) IN-
DICATED ALL HAD INADEQUATE FLUTTER MARGINS.
TRADEOFF STUDY RESULTS WERE TEMPERED, BASED
UPON SOME PRELIMINARY STRUCTURAL CONSIDERA-
TIONS, RESULTING IN BLADE SR-7-1. (FIGURE 9.)
TWELVE BLADES REDUCED TO EIGHT TO PROVIDE
A HIGH DEGREE OF CAPACITY FOR CARRYING IP
STRESSES
EIGHT BLADES ARE MORE STABLE THAN TEN
(BASED UPON SR-3 AND SR-5 (_A.= 48 ° )
MODEL TESTS)
WE, THEREFORE, FELT THAT THE REDUCTION IN BOTH
THE NUMBER OF BLADES FROM TWELVE TO EIGHT AND
THE SWEEP TO 36 ° WAS NECESSARY.
THE SR-7-1 WAS FURTHER MODIFIED THROUGH NUMER-
OUS ITERATIONS TO ACHIEVE BOTH STRESS AND
CLASSICAL FLUTTER MARGINS. THESE MODIFICATIONS
RESULTED IN BLADE SR-7-21. (FIGURE 9.)
17

I
I
U_
O
O'JCO
r,,.,C_l r,4
o
r_
u'_
Xim
m
O
>.
(/)Z<
I
IiX
q_i,i-.(=G.1
4,_
Ira,
u_
O
m
O
O'J
O
O'J
14,--
s._
Ewmlm
C2
QO
(n
"o
III
O
Z
(:OU'J
O
Im
IIII
.4_
,q.
O
,q.
O
.,,.I
im
u_G.1
"O
G.1
Ira,
G.1
m
r_
o
,q-
G.1
G.1
r.n
im
I--.
XimmB
mE
G.1
q.,,.O
XEm
m
G.1
O
m
G)
m
rn
L_r_
o
18

FIGURE i0 INDICATES THE SPECTRUM OF BLADE
THICKNESS RATIOS THAT WERE INVESTIGATED
IN DETERMINING AN ACCEPTABLE BLADE.
THICKNESSES TIA AND TIB ARE OFFSHOOTS OF
THICKNESS TI, WHICH IS OF THE TI, T2, T3
FAMILY OF BLADES.
19
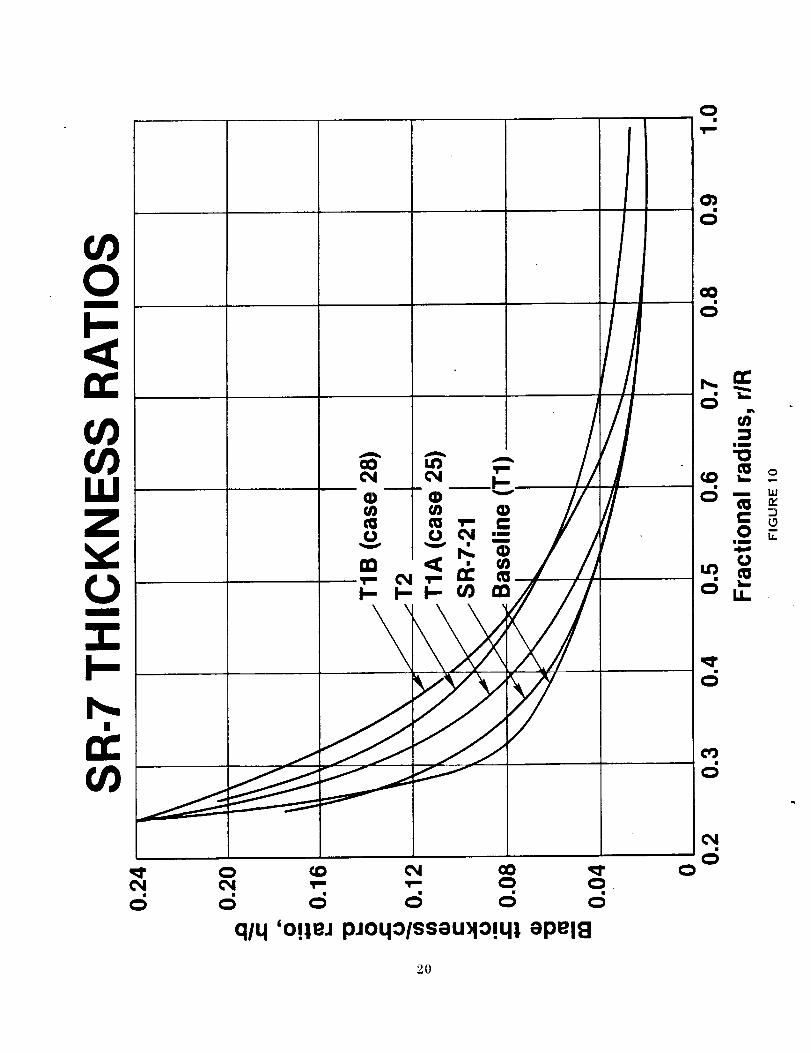
0
&
qlq 'o!leJ pJoqolsseu_lo!ql ePelE!
0
¢0
o
d
¢qc5
2O
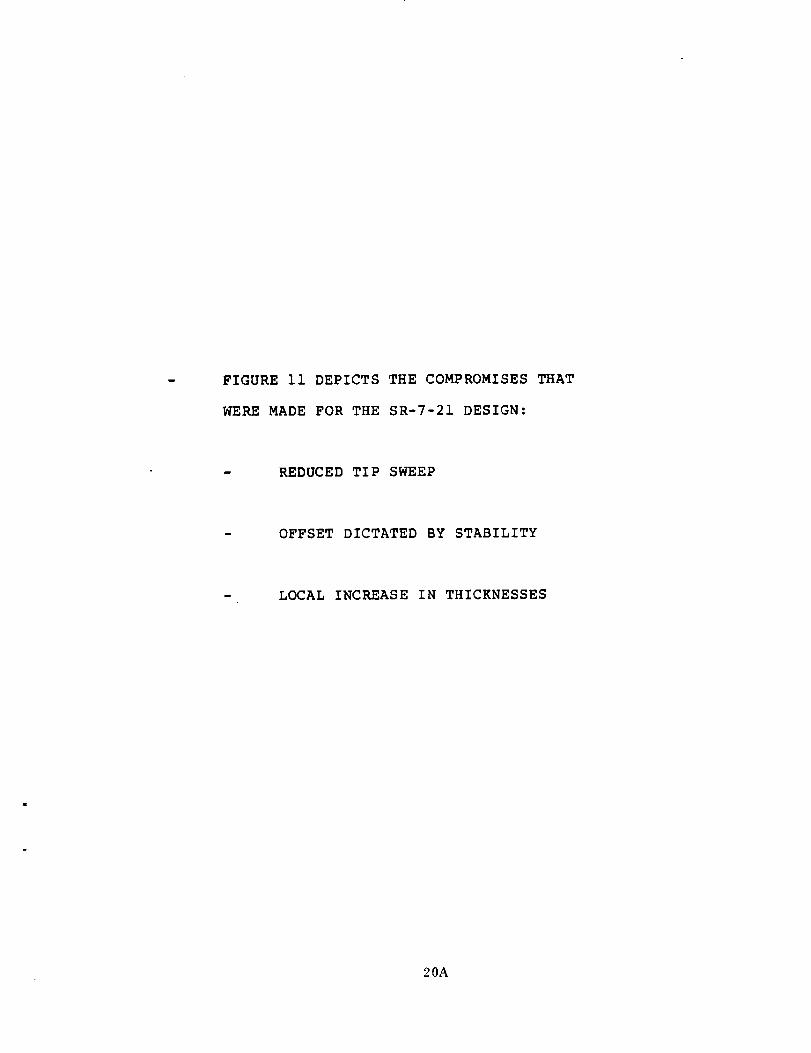
FIGURE ii DEPICTS THE COMPROMISES THAT
WERE MADE FOR THE SR-7-21 DESIGN:
REDUCED TIP SWEEP
OFFSET DICTATED BY STABILITY
LOCAL INCREASE IN THICKNESSES
20A

FIGURES 12 - 16 INDICATE THE COMPARISON
OF THE PLANFORM, OFFSET, SWEEP, BLADE
CHARACTERISTICS AND SWEEP LINE COORDIN-
ATES, RESPECTIVELY, FOR THE SR-3 AND THE
SR-7-21 BLADE CONFIGURATIONS. ALSO IN-
CLUDED FOR REFERENCE IS THE SR-7 BASELINE.
20B
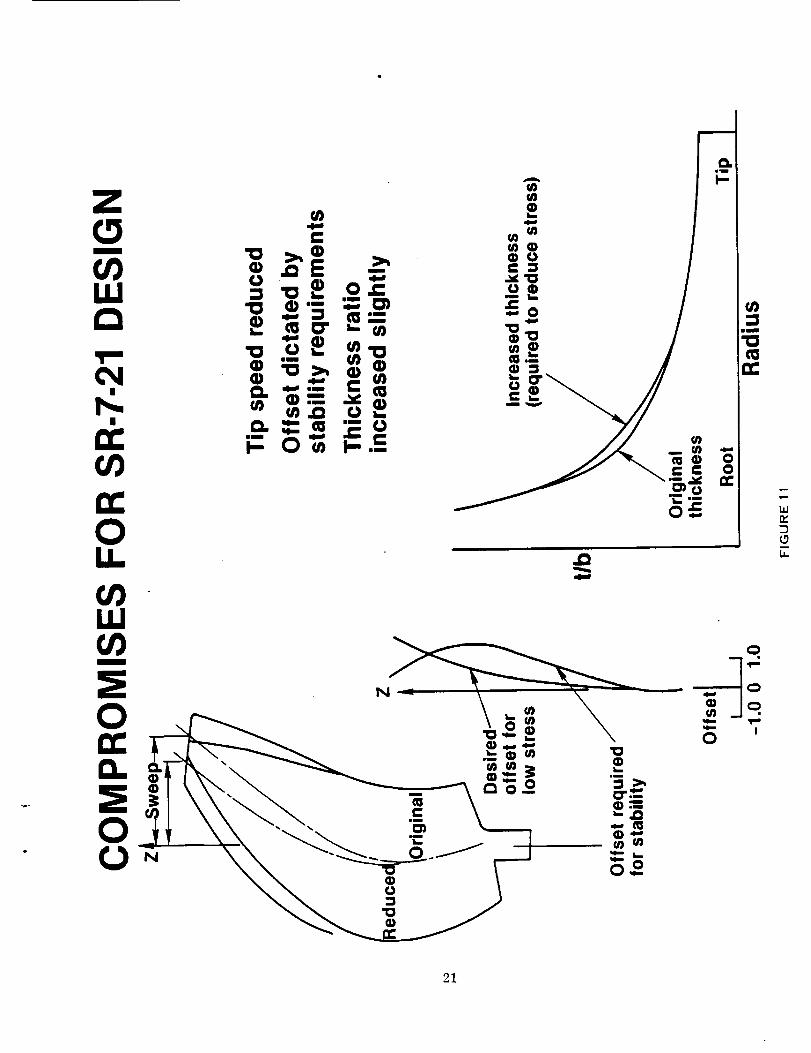
{[JL,manta
mJJ
21

A
0
U)
L._
v 22
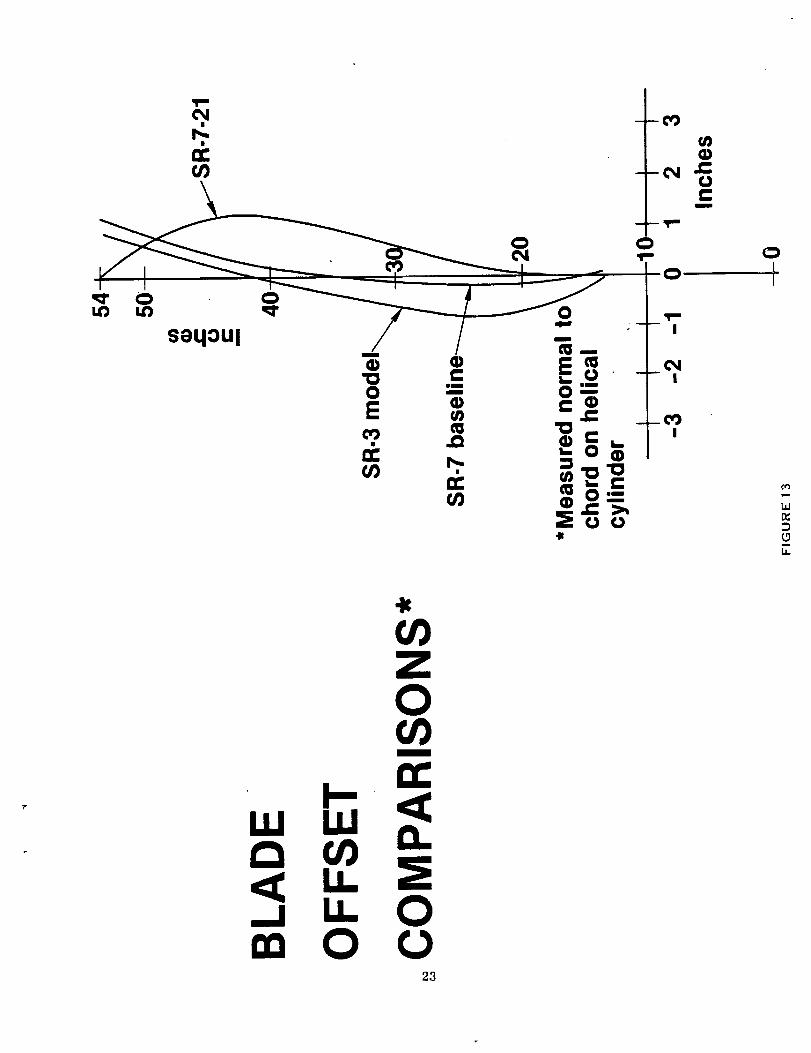
s_qoul0
. _ ._3n- h.
rr
,It
I
I
I
(gl
Cm
t
,.r
ul Iii
,< n_it_
_ 0
Z0m
<l-t
23

\
\
tsaqoul
4c
mu) o
I
24
tour)
J¢
Cm
'or
bJ
Q.0
a.
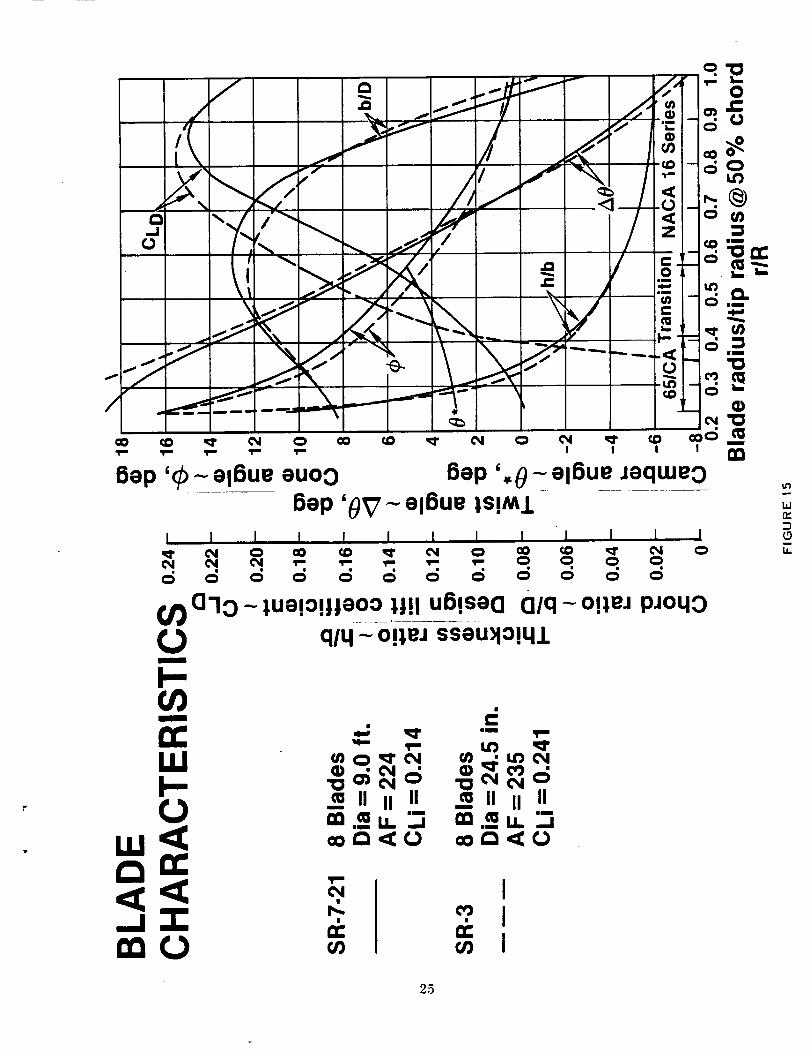
6ep '_ -- el6Ue euoo 6ep '.(7 " el6Ue JequJeo
6ep '_7-- el6ue Is!M1I I I I I I I I I I 1 I I
ci c5 o c5 ci _ ci c5 c5 o c; o
(,/,) Ci'Io-- lue!o!lleoo 11!1uS!seo
0m
oIq -- o!leJ pJoqO
qlq -- O!lm sseu)lo!qJ.
I,IiZ
(3
I,
m
II II II _ II II IIim im
¢1:1,__ u...a _ ._mu.._00 ¢1 <¢ U 00 _ <l: tO
O4|
& &U9
25

I I I
H/Z HIX1 I I I l I ,,L i I ! I
_- ¢i d _ d d o d d d
Ui×I 1 I I I l I l I I I I I I
8ep 'V" elBu=z deeMS
I.dn,,
I.L
ILlLU
"Zm
LI.I_
mo
"0 °_ ¢q "0 ¢_Ca II II II Ca II II IIm.__u. :.3 m.__u. "';
I
_)

I
T_
Ldn,'DL_
Lu
n-O
27
FIGURE 17 DEPICTS THE SR-7-21 BLADE PLAN-
FORM VIEW WITH THE SPAR LOCATION AND
MATERIAL SELECTION INDICATED.
28

AS INDICATED, THE BASELINE BLADE AND THE
SR-3 BLADE ARE AERO-ACOUSTICALLY SIMI-
LAR. (FIGURE 18.)
FOR THE 0.8 Mn DESIGN CRUISE CONDITION,
THE SR-7-21 (WHICH IS THE RESULTANT OF A
BLADE MODIFICATION TO ACHIEVE BOTH STRESS
AND CLASSICAL FLUTTER MARGINS) EXHIBITS A
DROP IN EFFICIENCY OF 1.3 POINTS, AN IN-
CREASE IN NOISE OF 1.4 dB, AND AN IN-
CREASE IN FUEL BURN AND DOC OF 2.59% AND
1.39%, RESPECTIVELY, OVER THE BASELINE
BLADE. (FIGURE 18.)
29

Imm
Ir'...
!
(n
cO
O
r.O
,d-O'J
+
u_¢,.j
q...
UU_=
u_
iim
m
q.1u'J
I
u_
r,oo'Jr....
o
r.D ,q.O'JO, )r.... r... ,
IJ.I
Z
F"IF,,
Im
|mm
q,.-t,i.-
,q.
ao
o
I.k.
Q..
"O
u'Jwm
OZ
O
mq
IJ.,
<]
O
¢.3C_
<_
m_
(nG3
I--.
L;J
3O
THE ESTIMATED BREAKDOWN FOR THE SR-7-21
PERFORMANCE LOSS AT Mn = 0.8, DUE TO IN-
CREASED THICKNESS RATIO, MODIFIED PLAN-
FORM, REDUCED SWEEP AND MOVING OF THE
BLADE LAYOUT OFF THE HELIX CAN BE
APPROXIMATED AS INDICATED IN FIGURE 19.
31

-!- '-I-
XINN
i
O
,in-
L,I,J
0
L_..._n
n
32

FOR THE 0.7 Mn DESIGN CRUISE CONDITION,
IT CAN BE SEEN THAT THE SR-7-21 BLADE
EXHIBITS A DROP IN EFFICIENCY OF 0.5
POINT, AN INCREASE IN NOISE OF 1.2 dB,
AND A NEGLIGIBLE INCREASE IN FUEL BURN
AND D.O.C. OVER THE BASELINE BLADE.
(FIGURE 20.)
33
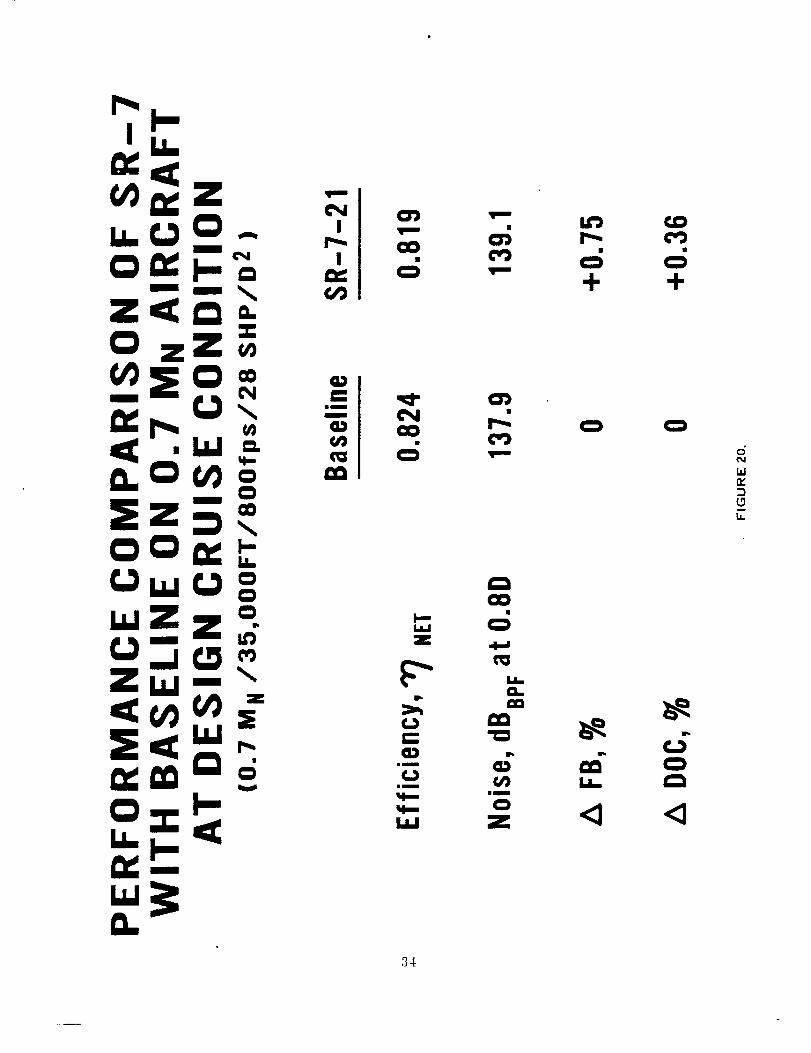
r-,
0
e_
z
e_
wm
im
.34
a,.
gm
0
Z
r_,
0
<1
0
0
<1
IM
n,.

FIGURE 21 INDICATES THE FUEL SAVINGS FOR
BOTH A 0.8 Mn AND A 0.7 Mn PROP-FAN
POWERED AIRCRAFT RELATIVE TO A TURBOFAN
POWERED AIRCRAFT, USING THE SAME CARE
TECHNOLOGY.
35
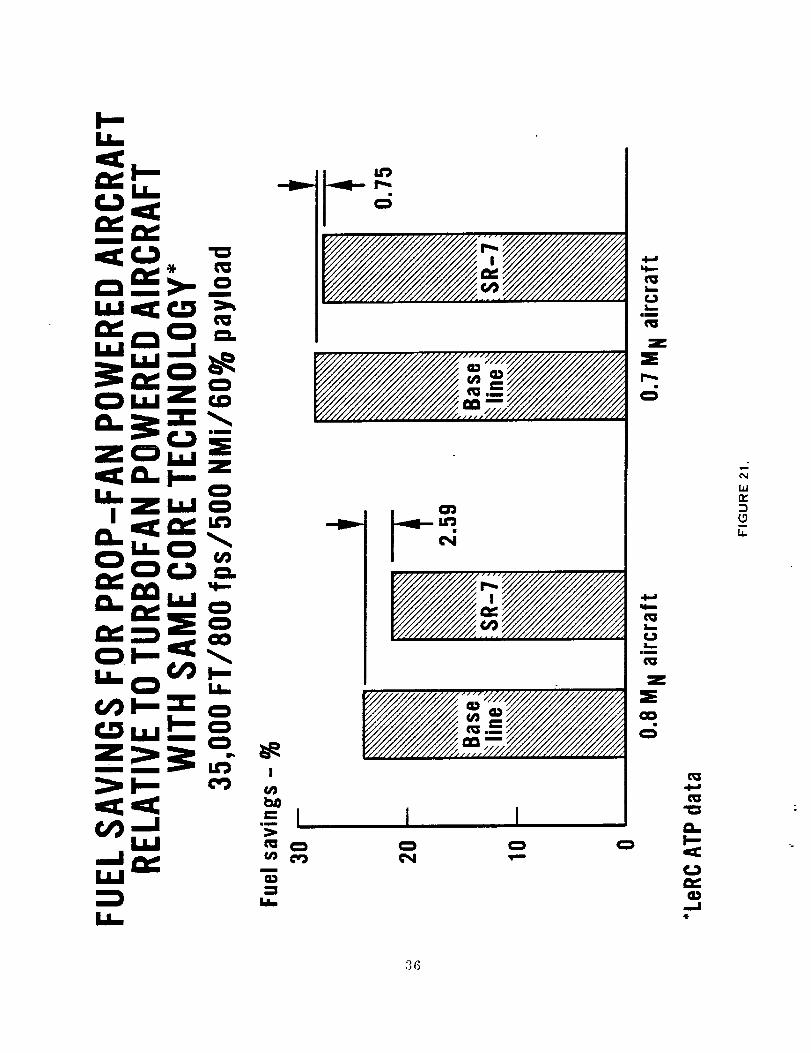
LL
LL
It_
I I0 C_
0
wm
Z
_E
_D
0
c_
Im
t_
._m411
Illa_
3_

THE DESIGN CRITERIA RESULTED IN A BLADE
EXHIBITING THE HIGHEST PERFORMANCE, AND
AT THE SAME TIME WAS CONSISTENT WITH
FREQUENCY PLACEMENT, STRESSING, FLUTTER
MARGIN AND CURRENT MANUFACTURING TECH-
NOLOGY •
THE BLADE WILL BE NEAR OPTIMUM, BASED
UPON MATERIALS AND CONSTRUCTION, AND IS
CONSISTENT WITH THE TECHNOLOGY FOR BUILD-
ING PROPELLER BLADES WITHOUT INVOLVING
H.S. IN A MATERIAL/FABRICATION DEVELOP-
MENT PROGRAM. (FIGURE 22_)
37

1
1
1
U)LIJClLU
rn
(DOdII
=E=I_
"0C
01
e_(D
ll
1
0
N_
!,_
1
I.I.
t_"00=EC
ll
ll
(/)
"(3
=I_
0 ¢3.
÷ m
(/'jC
ll
O)t_
E"0
>',0
=I_
Z01
• • • • • •
38

0
I--

LU
<
LU0
<1:>
<
(/)m
a)U)
II Ullm
0C
0mmu
(.1C
Eim
0qm,Im
a)Q.
IlU
.C:
(/)Im
a)q,,,ql,m
0e
U_
IilUB
m
0
(.1
,,imp
(/)
U_
e
40
Q.4)a)
(/)
U)
a)CC
I
(a
B_lm
(.t
C
a)"0
V_
a)a)=Ee
m
i._
0q_
m
.Q
(J0<:e
rd
ILln-
(9
b.

Z0m
CILIJLI.I_
l_..Jr,/)_LIJQ..m<r./)
_-0'7,.-
r,/)
,4_ Cg "_ (D
=m Ik_
L_ _ m
CD _ ::3I= _ o _
E "*" cm m
iim
•- O O C _
I I
e
41
010
m
0C
=I_
z....
m
I
=I_
E
0
e
14JrY
(5l.z.

a
LI.
LU
LU
e_|m
L.
t_EL.
:3/
0L.
E
0
E0
I-.
II
EI,.. ¢_
0•- r_
_ o
L.
gm
0
42
e..o E
_ 0L.L_
_ C
m
_ m
L_
0 _L "0
•=-- ,,_
I
_ Ee"
m
0
N

1. Report No. 2. Government Accession No. 3. Reciplent's Catalog No.CR 174993
4. 5. Report Date
7.
9,
12.
Title and Subtitle
Large Scale Prop-Fan Structural Design Study
Volume II - Prelimin'ary Design of SR-7
Author(s)L.C. Billman
C.J. Gruska
R.M. Ladden
D.K. Leishman
J.E. Turnberg
Performing Organization Name and AddressHamilton Standard Division
United Technologies Corporation
PO Box I000
Windsor Locks, Connecticut 06096
Sponsoring Agency Name and Address
National Aeronautics and Space Administration
Washington, DC 20546
6. Performing Organization Code73030
8. Performing Organization Report No.
HSER 11518
10. Work Unit No,
11. Contract or Grant No.
NAS3-22394
13. Type of Report and Period Covered
Contractor Report
14. Sponsoring Agency Code
15. S4Jpplementary Notes
Project Manager, David A. SagerserCleveland, Ohio 44135
Advanced Turbo Prop Project Office NASA Lewis Research Center
16. Abstract
In recent years, considerable attention has been directed toward improving aircraft fuel consumption. Studies
have shown that the inherent efficiency advantage that turboprop propulsion systems have demonstrated at lower
cruise speeds may now be extended to the higher speeds of today's turbofan and turbojet-powered aircraft. In
order to achieve this goal, new propeller designs will require features such as thin, high-speed airfoils and
aerodynamic sweep, features currently found only in wing designs for high-speed aircraft.
The purpose of the effort described in Volume I of this report was to establish structural concepts for such
advanced propeller blades, to define their structural properties to identify any new design, ,n_lysis, or
fabrication techniques which were required and to determine the structural tradeoffs involved with several
blade shapes which were selected primarily on the basis of aero/acoustic design considerations. The
feasibility of fabricating and testing dynamically scaled models of these blades for aerolastic testing was
also established. In addition, the preliminary design of a blade suitable for flight use in a testhed advanced
turboprop was conducted and is described in Volume II.
17. Key Words {Suggested by Author(s)}
Prop-FanBlade
Structural Design
19. Security Claszif. (of ",hisreporti
of this information in whole or in part. Date for general releaseAugust, 1989.
1
NASA-C-168 (Rev I0-75)

![AAA ACCESSORIES AA · LR-10P5-1PH LR-20P5-1PH #6-32x5/16in flathead screw LR-20P5 LR-21P0-1PH LR-21P0 LR-22P0-1PH 20 LR-22P0 10 LR2-10P2-1PH 18-12 10 6/40 x 5/16 flathead 104° [40°C]](https://img.pdfslide.us/doc/110x75/5fa344e276850c162d2c86d0/aaa-accessories-aa-lr-10p5-1ph-lr-20p5-1ph-6-32x516in-flathead-screw-lr-20p5-lr-21p0-1ph.jpg)