Embed Size (px)
Citation preview
South BranchRaritan River
Branch RoyceBrook
Sea level
1000
2000
3000
Sea level
1000
2000
3000
A'A Dukes Brook
no vertical exaggeration Surficial deposits not depicted
Ele
vatio
n in
feet
Ele
vatio
n in
feet
JTrpJTrp
JTrp
JTrp
JTrpJTrpg
JTrpg
JTrpg JTrpg
Hopewell FaultSystem
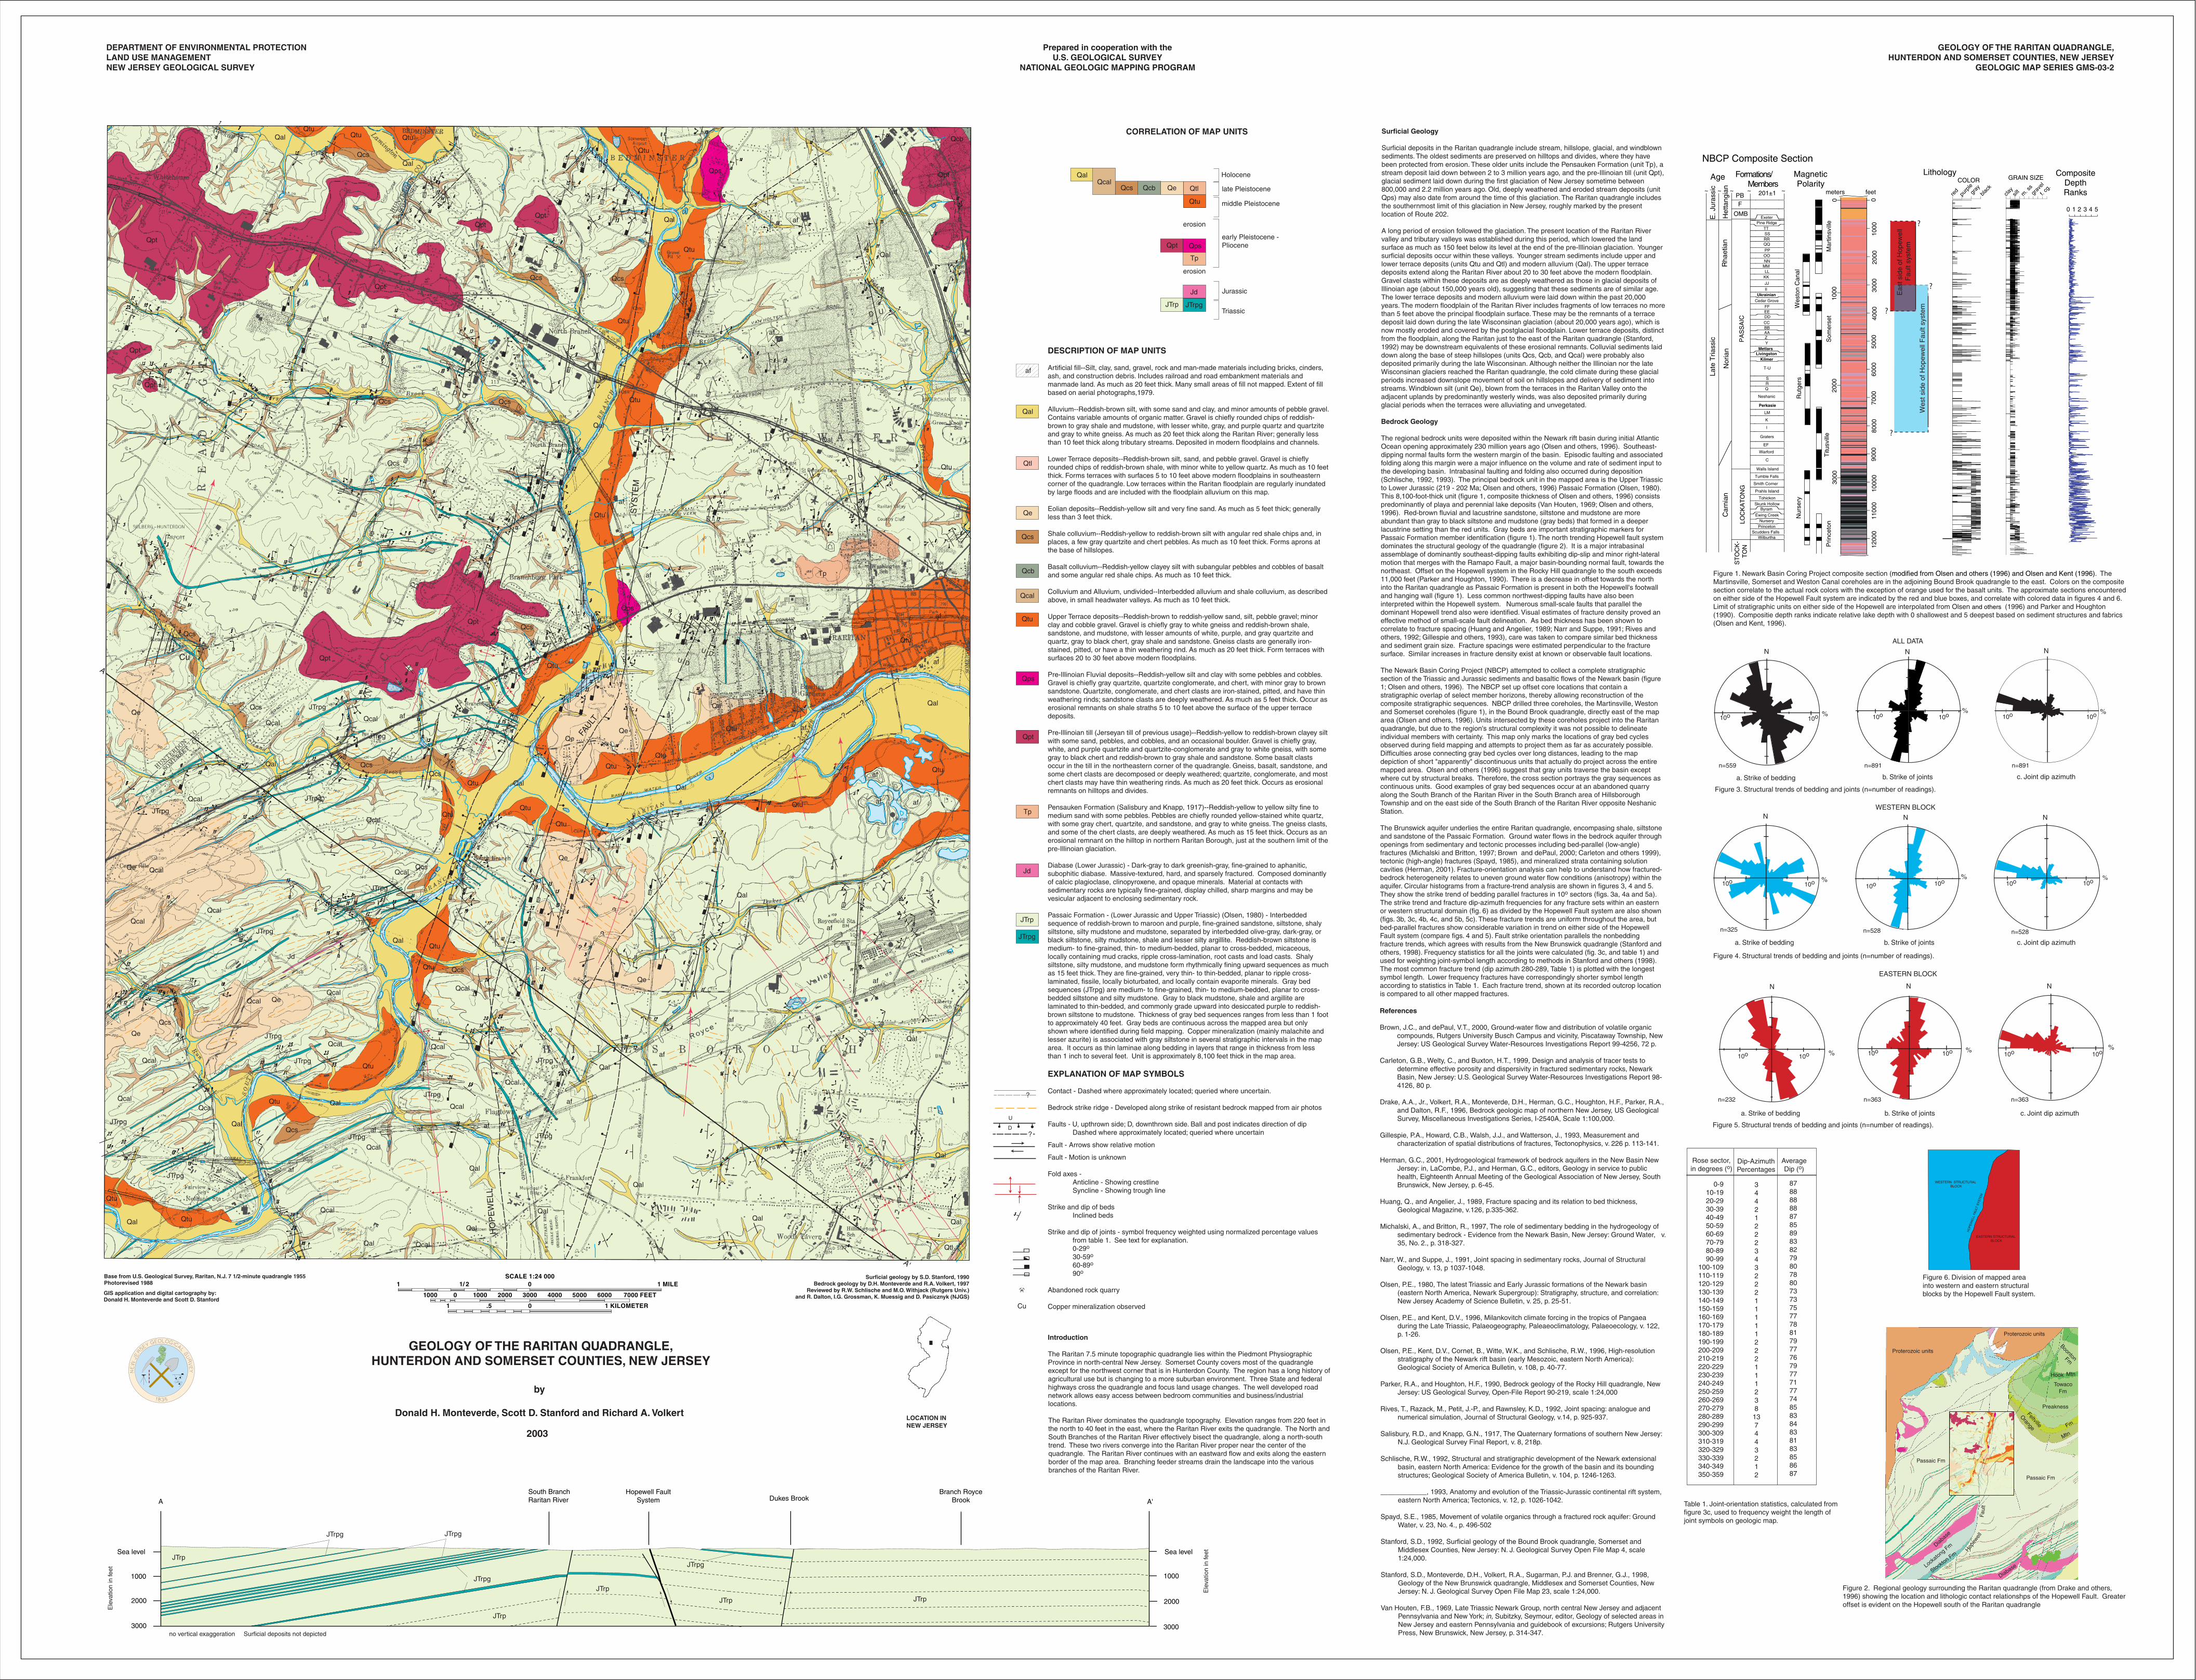
GEOLOGY OF THE RARITAN QUADRANGLE,HUNTERDON AND SOMERSET COUNTIES, NEW JERSEY
GEOLOGIC MAP SERIES GMS-03-2
DEPARTMENT OF ENVIRONMENTAL PROTECTIONLAND USE MANAGEMENTNEW JERSEY GEOLOGICAL SURVEY
Prepared in cooperation with theU.S. GEOLOGICAL SURVEY
NATIONAL GEOLOGIC MAPPING PROGRAM
GEOLOGY OF THE RARITAN QUADRANGLE,HUNTERDON AND SOMERSET COUNTIES, NEW JERSEY
Base from U.S. Geological Survey, Raritan, N.J. 7 1/2-minute quadrangle 1955Photorevised 1988
GIS application and digital cartography by:Donald H. Monteverde and Scott D. Stanford
Surficial geology by S.D. Stanford, 1990Bedrock geology by D.H. Monteverde and R.A. Volkert, 1997
Reviewed by R.W. Schlische and M.O. Withjack (Rutgers Univ.)and R. Dalton, I.G. Grossman, K. Muessig and D. Pasicznyk (NJGS)7000 FEET1000 10000 2000 3000 4000 5000 6000
.5 1 KILOMETER1 0
SCALE 1:24 0001/ 21 0 1 MILE
References
Brown, J.C., and dePaul, V.T., 2000, Ground-water flow and distribution of volatile organic compounds, Rutgers University Busch Campus and vicinity, Piscataway Township, New Jersey: US Geological Survey Water-Resources Investigations Report 99-4256, 72 p.
Carleton, G.B., Welty, C., and Buxton, H.T., 1999, Design and analysis of tracer tests to determine effective porosity and dispersivity in fractured sedimentary rocks, Newark Basin, New Jersey: U.S. Geological Survey Water-Resources Investigations Report 98-4126, 80 p.
Drake, A.A., Jr., Volkert, R.A., Monteverde, D.H., Herman, G.C., Houghton, H.F., Parker, R.A., and Dalton, R.F., 1996, Bedrock geologic map of northern New Jersey, US Geological Survey, Miscellaneous Investigations Series, I-2540A, Scale 1:100,000.
Gillespie, P.A., Howard, C.B., Walsh, J.J., and Watterson, J., 1993, Measurement and characterization of spatial distributions of fractures, Tectonophysics, v. 226 p. 113-141.
Herman, G.C., 2001, Hydrogeological framework of bedrock aquifers in the New Basin New Jersey: in, LaCombe, P.J., and Herman, G.C., editors, Geology in service to public health, Eighteenth Annual Meeting of the Geological Association of New Jersey, South Brunswick, New Jersey, p. 6-45.
Huang, Q., and Angelier, J., 1989, Fracture spacing and its relation to bed thickness, Geological Magazine, v.126, p.335-362.
Michalski, A., and Britton, R., 1997, The role of sedimentary bedding in the hydrogeology of sedimentary bedrock - Evidence from the Newark Basin, New Jersey: Ground Water, v. 35, No. 2., p. 318-327.
Narr, W., and Suppe, J., 1991, Joint spacing in sedimentary rocks, Journal of Structural Geology, v. 13, p 1037-1048.
Olsen, P.E., 1980, The latest Triassic and Early Jurassic formations of the Newark basin (eastern North America, Newark Supergroup): Stratigraphy, structure, and correlation: New Jersey Academy of Science Bulletin, v. 25, p. 25-51.
Olsen, P.E., and Kent, D.V., 1996, Milankovitch climate forcing in the tropics of Pangaea during the Late Triassic, Palaeogeography, Paleaeoclimatology, Palaeoecology, v. 122, p. 1-26.
Olsen, P.E., Kent, D.V., Cornet, B., Witte, W.K., and Schlische, R.W., 1996, High-resolution stratigraphy of the Newark rift basin (early Mesozoic, eastern North America): Geological Society of America Bulletin, v. 108, p. 40-77.
Parker, R.A., and Houghton, H.F., 1990, Bedrock geology of the Rocky Hill quadrangle, New Jersey: US Geological Survey, Open-File Report 90-219, scale 1:24,000
Rives, T., Razack, M., Petit, J.-P., and Rawnsley, K.D., 1992, Joint spacing: analogue and numerical simulation, Journal of Structural Geology, v.14, p. 925-937.
Salisbury, R.D., and Knapp, G.N., 1917, The Quaternary formations of southern New Jersey: N.J. Geological Survey Final Report, v. 8, 218p.
Schlische, R.W., 1992, Structural and stratigraphic development of the Newark extensional basin, eastern North America: Evidence for the growth of the basin and its bounding structures; Geological Society of America Bulletin, v. 104, p. 1246-1263.
____________, 1993, Anatomy and evolution of the Triassic-Jurassic continental rift system, eastern North America; Tectonics, v. 12, p. 1026-1042.
Spayd, S.E., 1985, Movement of volatile organics through a fractured rock aquifer: Ground Water, v. 23, No. 4., p. 496-502
Stanford, S.D., 1992, Surficial geology of the Bound Brook quadrangle, Somerset and Middlesex Counties, New Jersey: N. J. Geological Survey Open File Map 4, scale 1:24,000.
Stanford, S.D., Monteverde, D.H., Volkert, R.A., Sugarman, P.J. and Brenner, G.J., 1998, Geology of the New Brunswick quadrangle, Middlesex and Somerset Counties, New Jersey: N. J. Geological Survey Open File Map 23, scale 1:24,000.
Van Houten, F.B., 1969, Late Triassic Newark Group, north central New Jersey and adjacent Pennsylvania and New York; in, Subitzky, Seymour, editor, Geology of selected areas in New Jersey and eastern Pennsylvania and guidebook of excursions; Rutgers University Press, New Brunswick, New Jersey, p. 314-347.
LOCATION IN NEW JERSEY
CORRELATION OF MAP UNITS
Jd
JTrpgJTrp
QalQcal
QeQcb
Qtu
QcsQcs Qtl
Tp
QpsQpt
erosion
erosion
early Pleistocene -Pliocene
middle Pleistocene
late Pleistocene
Holocene
Jurassic
Triassic
EASTERN STRUCTURAL BLOCK
WESTERN STRUCTURAL BLOCK
HO
PE
WE
LL F
AU
LT S
YS
TEM
by
Donald H. Monteverde, Scott D. Stanford and Richard A. Volkert
2003
Surficial Geology
Surficial deposits in the Raritan quadrangle include stream, hillslope, glacial, and windblown sediments. The oldest sediments are preserved on hilltops and divides, where they have been protected from erosion. These older units include the Pensauken Formation (unit Tp), a stream deposit laid down between 2 to 3 million years ago, and the pre-Illinoian till (unit Qpt), glacial sediment laid down during the first glaciation of New Jersey sometime between 800,000 and 2.2 million years ago. Old, deeply weathered and eroded stream deposits (unit Qps) may also date from around the time of this glaciation. The Raritan quadrangle includes the southernmost limit of this glaciation in New Jersey, roughly marked by the present location of Route 202.
A long period of erosion followed the glaciation. The present location of the Raritan River valley and tributary valleys was established during this period, which lowered the land surface as much as 150 feet below its level at the end of the pre-Illinoian glaciation. Younger surficial deposits occur within these valleys. Younger stream sediments include upper and lower terrace deposits (units Qtu and Qtl) and modern alluvium (Qal). The upper terrace deposits extend along the Raritan River about 20 to 30 feet above the modern floodplain. Gravel clasts within these deposits are as deeply weathered as those in glacial deposits of Illinoian age (about 150,000 years old), suggesting that these sediments are of similar age. The lower terrace deposits and modern alluvium were laid down within the past 20,000 years. The modern floodplain of the Raritan River includes fragments of low terraces no more than 5 feet above the principal floodplain surface. These may be the remnants of a terrace deposit laid down during the late Wisconsinan glaciation (about 20,000 years ago), which is now mostly eroded and covered by the postglacial floodplain. Lower terrace deposits, distinct from the floodplain, along the Raritan just to the east of the Raritan quadrangle (Stanford, 1992) may be downstream equivalents of these erosional remnants. Colluvial sediments laid down along the base of steep hillslopes (units Qcs, Qcb, and Qcal) were probably also deposited primarily during the late Wisconsinan. Although neither the Illinoian nor the late Wisconsinan glaciers reached the Raritan quadrangle, the cold climate during these glacial periods increased downslope movement of soil on hillslopes and delivery of sediment into streams. Windblown silt (unit Qe), blown from the terraces in the Raritan Valley onto the adjacent uplands by predominantly westerly winds, was also deposited primarily during glacial periods when the terraces were alluviating and unvegetated.
Bedrock Geology
The regional bedrock units were deposited within the Newark rift basin during initial Atlantic Ocean opening approximately 230 million years ago (Olsen and others, 1996). Southeast-dipping normal faults form the western margin of the basin. Episodic faulting and associated folding along this margin were a major influence on the volume and rate of sediment input to the developing basin. Intrabasinal faulting and folding also occurred during deposition (Schlische, 1992, 1993). The principal bedrock unit in the mapped area is the Upper Triassic to Lower Jurassic (219 - 202 Ma; Olsen and others, 1996) Passaic Formation (Olsen, 1980). This 8,100-foot-thick unit (figure 1, composite thickness of Olsen and others, 1996) consists predominantly of playa and perennial lake deposits (Van Houten, 1969; Olsen and others, 1996). Red-brown fluvial and lacustrine sandstone, siltstone and mudstone are more abundant than gray to black siltstone and mudstone (gray beds) that formed in a deeper lacustrine setting than the red units. Gray beds are important stratigraphic markers for Passaic Formation member identification (figure 1). The north trending Hopewell fault system dominates the structural geology of the quadrangle (figure 2). It is a major intrabasinal assemblage of dominantly southeast-dipping faults exhibiting dip-slip and minor right-lateral motion that merges with the Ramapo Fault, a major basin-bounding normal fault, towards the northeast. Offset on the Hopewell system in the Rocky Hill quadrangle to the south exceeds 11,000 feet (Parker and Houghton, 1990). There is a decrease in offset towards the north into the Raritan quadrangle as Passaic Formation is present in both the Hopewell's footwall and hanging wall (figure 1). Less common northwest-dipping faults have also been interpreted within the Hopewell system. Numerous small-scale faults that parallel the dominant Hopewell trend also were identified. Visual estimates of fracture density proved an effective method of small-scale fault delineation. As bed thickness has been shown to correlate to fracture spacing (Huang and Angelier, 1989; Narr and Suppe, 1991; Rives and others, 1992; Gillespie and others, 1993), care was taken to compare similar bed thickness and sediment grain size. Fracture spacings were estimated perpendicular to the fracture surface. Similar increases in fracture density exist at known or observable fault locations.
The Newark Basin Coring Project (NBCP) attempted to collect a complete stratigraphic section of the Triassic and Jurassic sediments and basaltic flows of the Newark basin (figure 1; Olsen and others, 1996). The NBCP set up offset core locations that contain a stratigraphic overlap of select member horizons, thereby allowing reconstruction of the composite stratigraphic sequences. NBCP drilled three coreholes, the Martinsville, Weston and Somerset coreholes (figure 1), in the Bound Brook quadrangle, directly east of the map area (Olsen and others, 1996). Units intersected by these coreholes project into the Raritan quadrangle, but due to the region's structural complexity it was not possible to delineate individual members with certainty. This map only marks the locations of gray bed cycles observed during field mapping and attempts to project them as far as accurately possible. Difficulties arose connecting gray bed cycles over long distances, leading to the map depiction of short "apparently" discontinuous units that actually do project across the entire mapped area. Olsen and others (1996) suggest that gray units traverse the basin except where cut by structural breaks. Therefore, the cross section portrays the gray sequences as continuous units. Good examples of gray bed sequences occur at an abandoned quarry along the South Branch of the Raritan River in the South Branch area of Hillsborough Township and on the east side of the South Branch of the Raritan River opposite Neshanic Station.
The Brunswick aquifer underlies the entire Raritan quadrangle, encompasing shale, siltstone and sandstone of the Passaic Formation. Ground water flows in the bedrock aquifer through openings from sedimentary and tectonic processes including bed-parallel (low-angle) fractures (Michalski and Britton, 1997; Brown and dePaul, 2000; Carleton and others 1999), tectonic (high-angle) fractures (Spayd, 1985), and mineralized strata containing solution cavities (Herman, 2001). Fracture-orientation analysis can help to understand how fractured-bedrock heterogeneity relates to uneven ground water flow conditions (anisotropy) within the aquifer. Circular histograms from a fracture-trend analysis are shown in figures 3, 4 and 5. They show the strike trend of bedding parallel fractures in 10o sectors (figs. 3a, 4a and 5a). The strike trend and fracture dip-azimuth frequencies for any fracture sets within an eastern or western structural domain (fig. 6) as divided by the Hopewell Fault system are also shown (figs. 3b, 3c, 4b, 4c, and 5b, 5c). These fracture trends are uniform throughout the area, but bed-parallel fractures show considerable variation in trend on either side of the Hopewell Fault system (compare figs. 4 and 5). Fault strike orientation parallels the nonbedding fracture trends, which agrees with results from the New Brunswick quadrangle (Stanford and others, 1998). Frequency statistics for all the joints were calculated (fig. 3c, and table 1) and used for weighting joint-symbol length according to methods in Stanford and others (1998). The most common fracture trend (dip azimuth 280-289, Table 1) is plotted with the longest symbol length. Lower frequency fractures have correspondingly shorter symbol length according to statistics in Table 1. Each fracture trend, shown at its recorded outcrop location is compared to all other mapped fractures.
DESCRIPTION OF MAP UNITS
Artificial fill--Silt, clay, sand, gravel, rock and man-made materials including bricks, cinders, ash, and construction debris. Includes railroad and road embankment materials and manmade land. As much as 20 feet thick. Many small areas of fill not mapped. Extent of fill based on aerial photographs,1979.
Alluvium--Reddish-brown silt, with some sand and clay, and minor amounts of pebble gravel. Contains variable amounts of organic matter. Gravel is chiefly rounded chips of reddish-brown to gray shale and mudstone, with lesser white, gray, and purple quartz and quartzite and gray to white gneiss. As much as 20 feet thick along the Raritan River; generally less than 10 feet thick along tributary streams. Deposited in modern floodplains and channels.
Lower Terrace deposits--Reddish-brown silt, sand, and pebble gravel. Gravel is chiefly rounded chips of reddish-brown shale, with minor white to yellow quartz. As much as 10 feet thick. Forms terraces with surfaces 5 to 10 feet above modern floodplains in southeastern corner of the quadrangle. Low terraces within the Raritan floodplain are regularly inundated by large floods and are included with the floodplain alluvium on this map.
Eolian deposits--Reddish-yellow silt and very fine sand. As much as 5 feet thick; generally less than 3 feet thick.
Shale colluvium--Reddish-yellow to reddish-brown silt with angular red shale chips and, in places, a few gray quartzite and chert pebbles. As much as 10 feet thick. Forms aprons at the base of hillslopes.
Basalt colluvium--Reddish-yellow clayey silt with subangular pebbles and cobbles of basalt and some angular red shale chips. As much as 10 feet thick.
Colluvium and Alluvium, undivided--Interbedded alluvium and shale colluvium, as described above, in small headwater valleys. As much as 10 feet thick.
Upper Terrace deposits--Reddish-brown to reddish-yellow sand, silt, pebble gravel; minor clay and cobble gravel. Gravel is chiefly gray to white gneiss and reddish-brown shale, sandstone, and mudstone, with lesser amounts of white, purple, and gray quartzite and quartz, gray to black chert, gray shale and sandstone. Gneiss clasts are generally iron-stained, pitted, or have a thin weathering rind. As much as 20 feet thick. Form terraces with surfaces 20 to 30 feet above modern floodplains.
Pre-Illinoian Fluvial deposits--Reddish-yellow silt and clay with some pebbles and cobbles. Gravel is chiefly gray quartzite, quartzite conglomerate, and chert, with minor gray to brown sandstone. Quartzite, conglomerate, and chert clasts are iron-stained, pitted, and have thin weathering rinds; sandstone clasts are deeply weathered. As much as 5 feet thick. Occur as erosional remnants on shale straths 5 to 10 feet above the surface of the upper terrace deposits.
Pre-Illinoian till (Jerseyan till of previous usage)--Reddish-yellow to reddish-brown clayey silt with some sand, pebbles, and cobbles, and an occasional boulder. Gravel is chiefly gray, white, and purple quartzite and quartzite-conglomerate and gray to white gneiss, with some gray to black chert and reddish-brown to gray shale and sandstone. Some basalt clasts occur in the till in the northeastern corner of the quadrangle. Gneiss, basalt, sandstone, and some chert clasts are decomposed or deeply weathered; quartzite, conglomerate, and most chert clasts may have thin weathering rinds. As much as 20 feet thick. Occurs as erosional remnants on hilltops and divides.
Pensauken Formation (Salisbury and Knapp, 1917)--Reddish-yellow to yellow silty fine to medium sand with some pebbles. Pebbles are chiefly rounded yellow-stained white quartz, with some gray chert, quartzite, and sandstone, and gray to white gneiss. The gneiss clasts, and some of the chert clasts, are deeply weathered. As much as 15 feet thick. Occurs as an erosional remnant on the hilltop in northern Raritan Borough, just at the southern limit of the pre-Illinoian glaciation. Diabase (Lower Jurassic) - Dark-gray to dark greenish-gray, fine-grained to aphanitic, subophitic diabase. Massive-textured, hard, and sparsely fractured. Composed dominantly of calcic plagioclase, clinopyroxene, and opaque minerals. Material at contacts with sedimentary rocks are typically fine-grained, display chilled, sharp margins and may be vesicular adjacent to enclosing sedimentary rock.
Passaic Formation - (Lower Jurassic and Upper Triassic) (Olsen, 1980) - Interbedded sequence of reddish-brown to maroon and purple, fine-grained sandstone, siltstone, shaly siltstone, silty mudstone and mudstone, separated by interbedded olive-gray, dark-gray, or black siltstone, silty mudstone, shale and lesser silty argillite. Reddish-brown siltstone is medium- to fine-grained, thin- to medium-bedded, planar to cross-bedded, micaceous, locally containing mud cracks, ripple cross-lamination, root casts and load casts. Shaly siltstone, silty mudstone, and mudstone form rhythmically fining upward sequences as much as 15 feet thick. They are fine-grained, very thin- to thin-bedded, planar to ripple cross-laminated, fissile, locally bioturbated, and locally contain evaporite minerals. Gray bed sequences (JTrpg) are medium- to fine-grained, thin- to medium-bedded, planar to cross-bedded siltstone and silty mudstone. Gray to black mudstone, shale and argillite are laminated to thin-bedded, and commonly grade upward into desiccated purple to reddish-brown siltstone to mudstone. Thickness of gray bed sequences ranges from less than 1 foot to approximately 40 feet. Gray beds are continuous across the mapped area but only shown where identified during field mapping. Copper mineralization (mainly malachite and lesser azurite) is associated with gray siltstone in several stratigraphic intervals in the map area. It occurs as thin laminae along bedding in layers that range in thickness from less than 1 inch to several feet. Unit is approximately 8,100 feet thick in the map area.
EXPLANATION OF MAP SYMBOLS
Contact - Dashed where approximately located; queried where uncertain.
Bedrock strike ridge - Developed along strike of resistant bedrock mapped from air photos
Faults - U, upthrown side; D, downthrown side. Ball and post indicates direction of dip Dashed where approximately located; queried where uncertain
Fault - Arrows show relative motion
Fault - Motion is unknown
Fold axes - Anticline - Showing crestline Syncline - Showing trough line
Strike and dip of beds Inclined beds
Strike and dip of joints - symbol frequency weighted using normalized percentage values from table 1. See text for explanation. 0-29o 30-59o 60-89o 90o
Abandoned rock quarry
Copper mineralization observed
Jd
JTrp
JTrpg
Qps
Qcal
Qtu
Qcb
Qcs
Qe
Qtl
Qal
af
Tp
Qpt
?
U
D
?
?
?
?
?
?
?
Cu
?
0-9 10-19 20-29 30-39 40-49 50-59 60-69 70-79 80-89 90-99100-109110-119120-129130-139140-149150-159160-169170-179180-189190-199200-209210-219220-229230-239240-249250-259260-269270-279280-289290-299300-309310-319320-329330-339340-349350-359
3 4 4 2 1 2 2 2 3 4 3 2 2 2 1 1 1 1 1 2 2 2 1 1 1 2 3 813 7 4 4 3 2 1 2
878888888785898382798078807373757778817977767977717774858384838183858687
Rose sector,in degrees (o)
Dip-AzimuthPercentages
AverageDip (o)
Table 1. Joint-orientation statistics, calculated from figure 3c, used to frequency weight the length ofjoint symbols on geologic map.
Figure 6. Division of mapped areainto western and eastern structural blocks by the Hopewell Fault system.
10o10o %10o10o %
10o10o % 10o 10o%
10o %10o
c. Joint dip azimuth
b. Strike of joints
10o 10o %
10o 10o%
b. Strike of jointsa. Strike of bedding
c. Joint dip azimuth
10o 10o %
a. Strike of bedding
c. Joint dip azimutha. Strike of bedding
Figure 3. Structural trends of bedding and joints (n=number of readings).
Figure 4. Structural trends of bedding and joints (n=number of readings).
Figure 5. Structural trends of bedding and joints (n=number of readings).
10o 10o%
n=528 n=528n=325
n=363 n=363n=232
n=891 n=891n=559
b. Strike of joints
EASTERN BLOCK
WESTERN BLOCK
ALL DATA
N NN
N N N
N N N
Qcs
Qcs
Qcs
Qcs
Qcs
Qcs
Qcs
Qcs
Qcs
Qcs
Qcs
Qcs
Qcs
af
QeQe
Qe
Qe
Qe
Qe
Qe
Qe
Qe
Qal
QalQal
Qal
Qal
Qal
Qal
Qal
Qal
Qal
Qal
Qcb
Qpt
Qpt
Qpt
Qpt
Qpt
Tp
Qpt
Qpt
Qpt
QptQps
Qtu
Qtu
Qtu
Qtu
Qtu
QtuQtu
Qtu
Qtu
Qtu
Qtu
Qtu
Qtu
Qtu
Qtu
Qtu
Qtu
Qtu
Qtu
Qtu
Qtu
Qtu
Qtu
Qtu
Qtu
Qtl
Qal
Qal
Qal
af
af
A'
A
Qal
Qps
Qtu
Qal
af
af
Qal
Qal
Qal
Qal
Qal
Qal
Qal
Qal
Qal Qcal
Qcal
Qcal
Qcal
Qcal
JTrpg
JTrpg
JTrpg
Qcal
QcalQcal
Qcal
Qcal
JTrpg
JTrpg
JTrpg
JTrpg
JTrpg
JTrpg
JTrpg
Jd
QcalQcal
Qcal
Qcal
QcalQcs
Qcal
Qcal
Qcal
Qcal
QcalQcal
JTrpg
JTrpg
JTrpg
JTrpg
HO
PE
WE
LL
FAULT
SY
ST
EM
D U
D U
D U
U D
U D
af
af
afaf
af
af
af
af
Cu
af
af
af
af
afafaf
af af
af
af
af
af
af
af
af
af
Qcs
.
Nur
sery
Mar
tinsv
ille
Wes
ton
Can
al
Som
erse
t
Rut
gers
Titu
svill
eP
rince
ton
MagneticPolarity
Pine RidgeTTSSRRQQ
PPOONN
MMLL
KK
II
Cedar GroveUkrainian
JJ
EEDD
Tumble Falls
Smith Corner
Ewing Creek
Prahls Island
TohickonSkunk Hollow
Nursery
Byram
Scudders FallsWilburtha
Princeton
T-U
SRQ
Neshanic
LivingstonKilmer
Perkasie
LM
I
Walls Island
Graters
EF
Warford
K
C
FF
CCBBAAZ
MetlarsY
Exeter
201±1 ~~
Rha
etia
nC
arni
anN
oria
n
Late
Tria
ssic
E. J
uras
sic
Het
tang
ian
Age
~~
OMB
ST
OC
K-
TO
N
PBF
LOC
KA
TO
NG
PA
SS
AIC
Formations/ Members
meters~
010
0012
000
1100
020
0040
0060
0070
0080
0090
0010
000
3000
feet
010
0020
0030
00
5000
NBCP Composite SectionLithology
0 1 2 3 4 5
CompositeDepthRanksgr
avel
red
purp
legr
aybla
ckcla
ysil
tm
. ss
f. cg
.COLOR GRAIN SIZE
Introduction
The Raritan 7.5 minute topographic quadrangle lies within the Piedmont Physiographic Province in north-central New Jersey. Somerset County covers most of the quadrangle except for the northwest corner that is in Hunterdon County. The region has a long history of agricultural use but is changing to a more suburban environment. Three State and federal highways cross the quadrangle and focus land usage changes. The well developed road network allows easy access between bedroom communities and business/industrial locations.
The Raritan River dominates the quadrangle topography. Elevation ranges from 220 feet in the north to 40 feet in the east, where the Raritan River exits the quadrangle. The North and South Branches of the Raritan River effectively bisect the quadrangle, along a north-south trend. These two rivers converge into the Raritan River proper near the center of the quadrangle. The Raritan River continues with an eastward flow and exits along the eastern border of the map area. Branching feeder streams drain the landscape into the various branches of the Raritan River.
Figure 2. Regional geology surrounding the Raritan quadrangle (from Drake and others, 1996) showing the location and lithologic contact relationshps of the Hopewell Fault. Greater offset is evident on the Hopewell south of the Raritan quadrangle
Proterozoic units
Diabas
e
Lockatong Fm
Stockton Fm
Hopew
ell
Faul
t
Preakness
Orange
Mtn
Feltville
Towaco
Hook Mtn
BoontonFm
Diabase
Fm
Fm
Passaic Fm
Proterozoic units
Passaic Fm
Wes
t sid
e of
Hop
ewel
l Fau
lt sy
stem
Eas
t sid
e of
Hop
ewel
l F
ault
syst
em
?
?
?
?
Figure 1. Newark Basin Coring Project composite section (modified from Olsen and others (1996) and Olsen and Kent (1996). The Martinsville, Somerset and Weston Canal coreholes are in the adjoining Bound Brook quadrangle to the east. Colors on the composite section correlate to the actual rock colors with the exception of orange used for the basalt units. The approximate sections encountered on either side of the Hopewell Fault system are indicated by the red and blue boxes, and correlate with colored data in figures 4 and 6. Limit of stratigraphic units on either side of the Hopewell are interpolated from Olsen and others (1996) and Parker and Houghton (1990). Compositie depth ranks indicate relative lake depth with 0 shallowest and 5 deepest based on sediment structures and fabrics (Olsen and Kent, 1996).