Embed Size (px)
Citation preview
Volume Two May 2014
Appendix 18
The Chatham Rise and hoki – Role of hoki biology and distribution (O’Driscoll & Ballara 2014)
The Chatham Rise and hoki
Role in hoki biology and distribution
Prepared for Chatham Rock Phosphate
April 2014
© All rights reserved. This publication may not be reproduced or copied in any form without the permission of the copyright owner(s). Such permission is only to be given in accordance with the terms of the client’s contract with NIWA. This copyright extends to all forms of copying and any storage of material in any kind of information retrieval system.
Whilst NIWA has used all reasonable endeavours to ensure that the information contained in this document is accurate, NIWA does not give any express or implied warranty as to the completeness of the information contained herein, or that it will be suitable for any purpose(s) other than those specifically contemplated during the Project or agreed by NIWA and the Client.
Authors/Contributors: Richard L. O'Driscoll Sira L. Ballara
For any information regarding this report please contact:
Richard O'Driscoll Programme leader Fisheries Stock Assessment & Monitoring +64-4-386 0876 [email protected]
National Institute of Water & Atmospheric Research Ltd
301 Evans Bay Parade, Greta Point
Wellington 6021
Private Bag 14901, Kilbirnie
Wellington 6241
New Zealand
Phone +64-4-386 0300
Fax +64-4-386 0574
NIWA Client Report No: WLG2014-15 Report date: April 2014 NIWA Project: CRP12303
Cover photo: Hoki (Peter Marriott, NIWA)
The Chatham Rise and hoki
Contents
Executive summary .............................................................................................................. 5
1 Introduction ................................................................................................................. 6
1.1 Report objectives ................................................................................................. 7
2 Hoki biology and life history....................................................................................... 7
2.1 Hoki stock structure ............................................................................................ 13
3 Role of the Chatham Rise for NZ hoki ..................................................................... 15
3.1 Importance as a fishing ground .......................................................................... 15
3.2 Importance as a juvenile hoki area ..................................................................... 17
3.3 Importance as an adult hoki area ....................................................................... 19
4 Spatial distribution of hoki on the Chatham Rise ................................................... 20
4.1 Trawl survey data ............................................................................................... 20
4.2 Commercial catch data ....................................................................................... 24
5 Vertical distribution of hoki on the Chatham Rise .................................................. 27
6 Summary .................................................................................................................... 28
7 Acknowledgements ................................................................................................... 29
8 References ................................................................................................................. 30
Tables
Table 1: Relative abundance estimates of hoki (millions of fish) in four research trawl time-series since 1992. 18
Table 2: Mean catch rates of hoki (kg km-2) from Chatham Rise trawl surveys 1992-2013. 24
Figures
Figure 1: Annual New Zealand hoki catches (in thousands of tonnes) 1972-2013. 6
Figure 2: Location of the Chatham Rock Phosphate Ltd mining and prospecting permit and licence areas, March 2014. 7
Figure 3: Distribution of hoki from research trawls in 1961-1997. 9
Figure 4: Location of hoki spawning areas. 10
Figure 5: Distribution of juvenile hoki aged between 0 and 1 years. 11
Figure 6: Distribution of juvenile hoki aged between 1 and 2 years. 12
Figure 7: Size distribution of hoki. 13
Figure 8: Stock structure of hoki. 14
The Chatham Rise and hoki
Figure 9: Hoki catches (in tonnes) by area. 16
Figure 10: Proportion of fish aged 3 years and younger in catches of hoki by area. 16
Figure 11: Observations of spawning hoki on the Chatham Rise. 19
Figure 12: Catch rates of hoki from Chatham Rise trawl surveys 1992–2014. 21
Figure 13: Catch rates of hoki from Chatham Rise trawl surveys 1992–2014 with large catches removed. 22
Figure 14: Occurrence of hoki in Chatham Rise trawl survey tows by depth, latitude, and longitude. 23
Figure 15: Reported commercial catches of hoki on the Chatham Rise 1990–2013. 25
Figure 16: Median length of hoki in commercial catches on the Chatham Rise. 25
Figure 17: Observed commercial catches of hoki on the Chatham Rise by age class. 26
Figure 18: Acoustic echogram associated with large catch of hoki in 2005. 28
Reviewed by Approved for release by Dr Rosie Hurst Dr Julie Hall
The Chatham Rise and hoki 5
Executive summary Hoki are New Zealand’s largest finfish fishery, with a current catch limit of 150,000 t. The
species is also a key biological component of the upper slope marine ecosystem at depths
from 200–800 m. This report reviews the role of the Chatham Rise for New Zealand hoki and
summarizes available information about the distribution of hoki in this region.
The Chatham Rise is the main area of residence (adult home ground) for the eastern hoki
stock and an important juvenile area for hoki of both stocks. Estimates from research trawl
surveys suggest that in most years more than 80% of New Zealand hoki between 2 and 3
years old are found on the Chatham Rise. Juvenile hoki from 1–2 years old are mainly
caught at depths of 200–400 m on the western Chatham Rise, particularly around the
Mernoo, Veryan and Reserve Banks. Larger hoki inhabit progressively deeper water and
their spatial distribution expands. Hoki of ages 2–3 years (2+) occurred in 72% of research
bottom trawls on the Chatham Rise, with highest catches from 400–600 m depths, west of
180°. Hoki 3 years and older are widespread on the Chatham Rise, occurring in 95% of
research trawls.
The main New Zealand hoki spawning areas are off the west coast South Island, in Cook
Strait, off the east coast South Island, and on the Puysegur Bank in Southland. Spawning
(ripe and running ripe) female hoki are sometimes caught on the western Chatham Rise, but
are seldom reported from other parts of the Rise. Juveniles of less than one year old (age
0+) occur close to the coasts of the North and South Islands and in midwater. Most juvenile
hoki are thought to move to the Chatham Rise by the time they are 2 years old.
The Chatham Rise is also an important hoki fishing area. Catches on the Chatham Rise
peaked at about 75,000 t in 1997–98 and 1998–99, and have been stable at between
36,000 t and 38,000 t over the past 7 years. Hoki are caught from the Chatham Rise
throughout the year, with a decrease during the spawning season from July to September.
The Chatham Rise hoki fishery is mainly a bottom trawl fishery. Most hoki caught on the
Chatham Rise are relatively young, less than 8 years old, and in many years more than half
of the catch (by number) is made up of hoki aged 3 years and younger.
Little information exists on the vertical distribution of hoki on the Chatham Rise. Acoustic
data suggest that marks containing hoki are typically close to the seabed during the day, but
move away from the seabed at night.
6 The Chatham Rise and hoki
1 Introduction Hoki (Macruronus novaezelandiae Hector) are a member of the hake (Merluccidae) family.
Hoki also occur in Australia (where they are known as blue grenadier) and in South America.
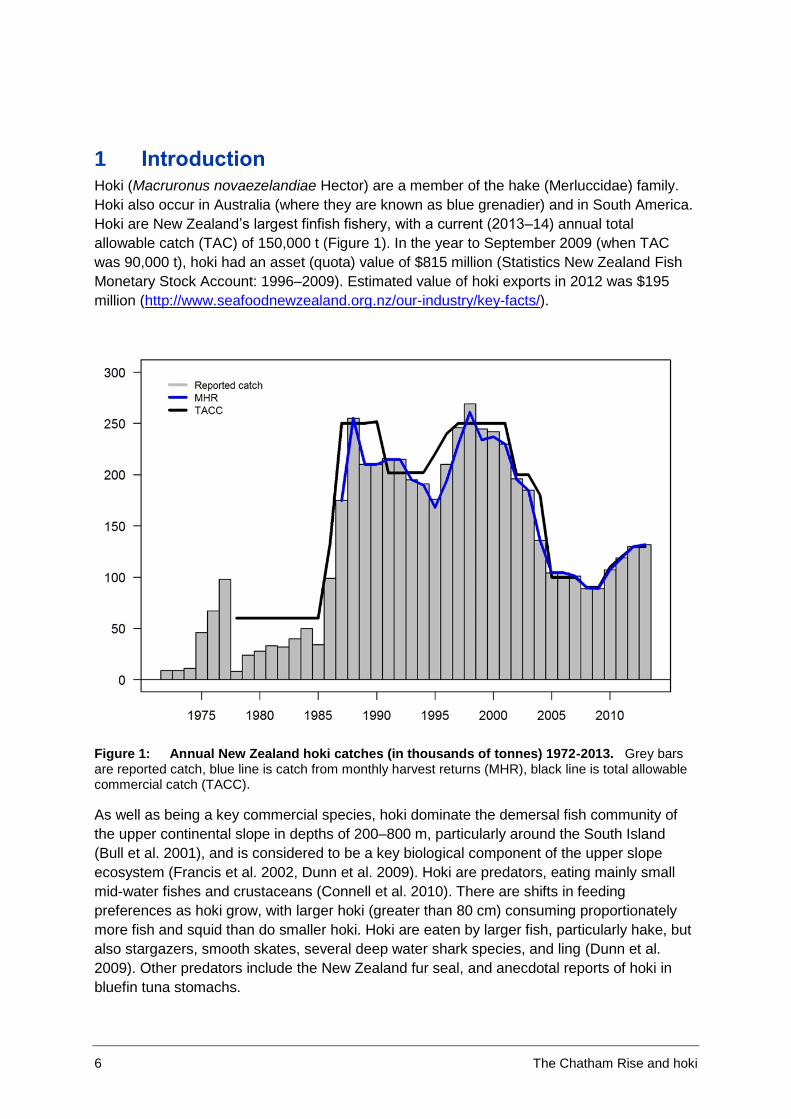
Hoki are New Zealand’s largest finfish fishery, with a current (2013–14) annual total
allowable catch (TAC) of 150,000 t (Figure 1). In the year to September 2009 (when TAC
was 90,000 t), hoki had an asset (quota) value of $815 million (Statistics New Zealand Fish
Monetary Stock Account: 1996–2009). Estimated value of hoki exports in 2012 was $195
million (http://www.seafoodnewzealand.org.nz/our-industry/key-facts/).
Figure 1: Annual New Zealand hoki catches (in thousands of tonnes) 1972-2013. Grey bars are reported catch, blue line is catch from monthly harvest returns (MHR), black line is total allowable commercial catch (TACC).
As well as being a key commercial species, hoki dominate the demersal fish community of
the upper continental slope in depths of 200–800 m, particularly around the South Island
(Bull et al. 2001), and is considered to be a key biological component of the upper slope
ecosystem (Francis et al. 2002, Dunn et al. 2009). Hoki are predators, eating mainly small
mid-water fishes and crustaceans (Connell et al. 2010). There are shifts in feeding
preferences as hoki grow, with larger hoki (greater than 80 cm) consuming proportionately
more fish and squid than do smaller hoki. Hoki are eaten by larger fish, particularly hake, but
also stargazers, smooth skates, several deep water shark species, and ling (Dunn et al.
2009). Other predators include the New Zealand fur seal, and anecdotal reports of hoki in
bluefin tuna stomachs.
The Chatham Rise and hoki 7
1.1 Report objectives
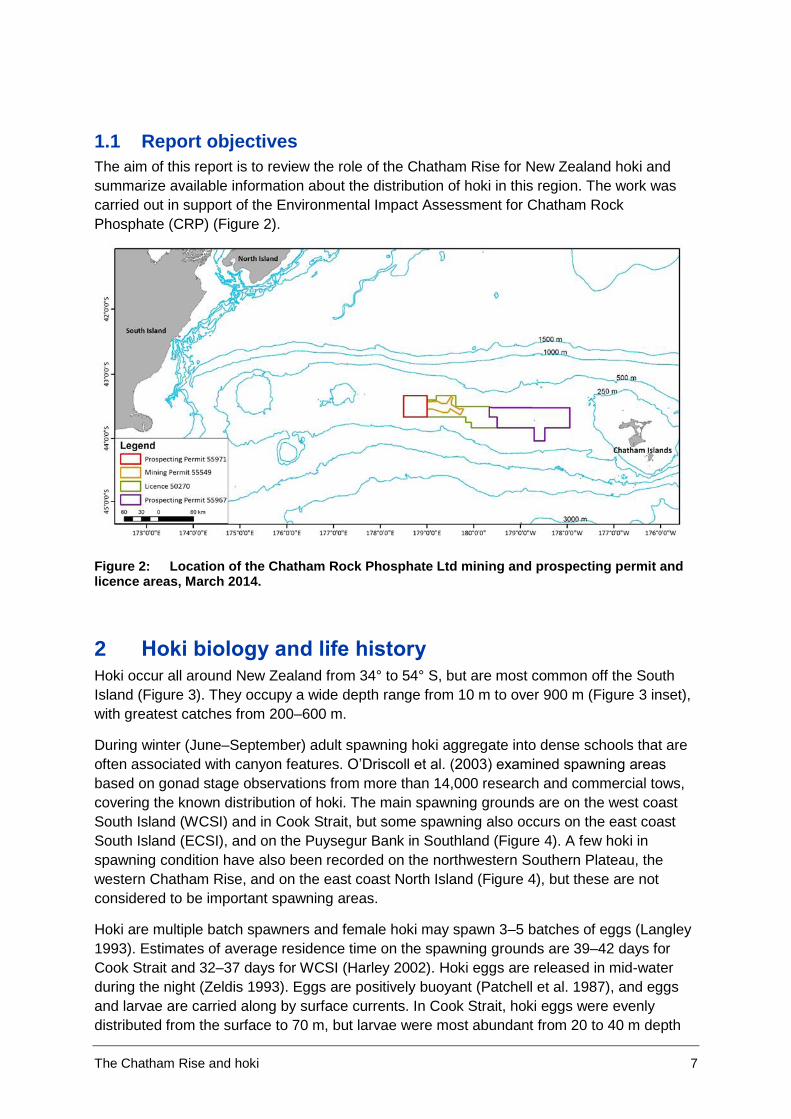
The aim of this report is to review the role of the Chatham Rise for New Zealand hoki and
summarize available information about the distribution of hoki in this region. The work was
carried out in support of the Environmental Impact Assessment for Chatham Rock
Phosphate (CRP) (Figure 2).
Figure 2: Location of the Chatham Rock Phosphate Ltd mining and prospecting permit and licence areas, March 2014.
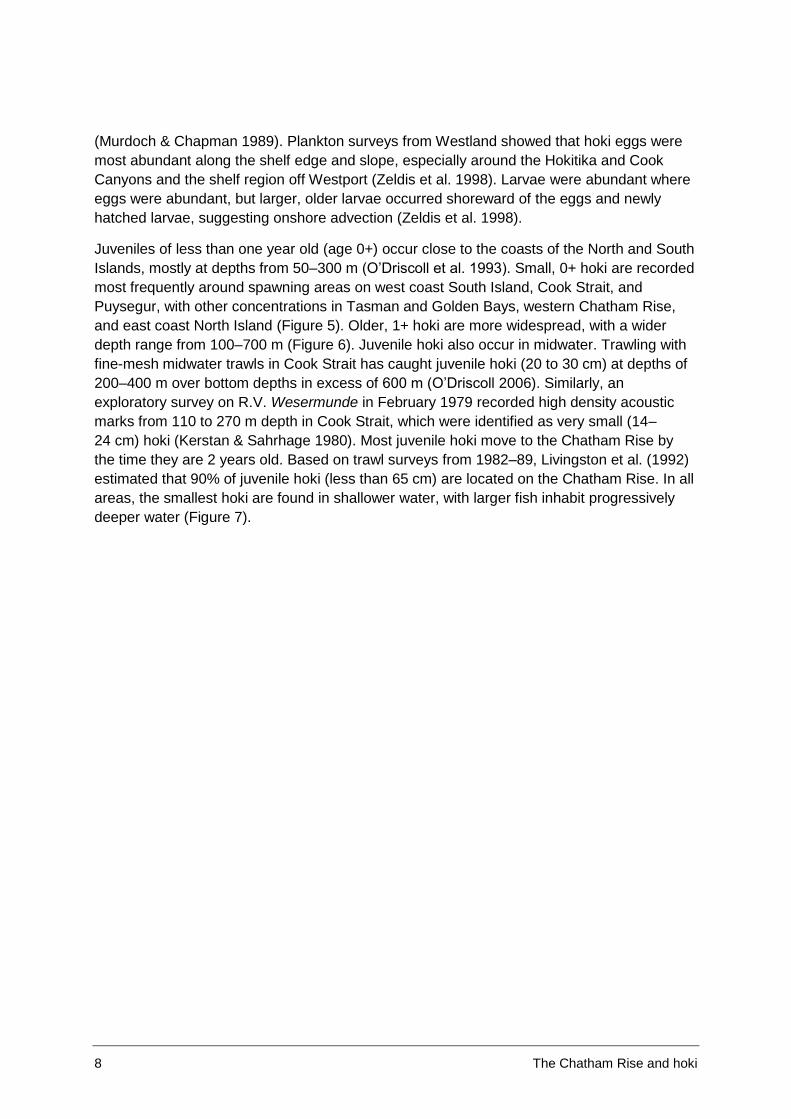
2 Hoki biology and life history Hoki occur all around New Zealand from 34° to 54° S, but are most common off the South
Island (Figure 3). They occupy a wide depth range from 10 m to over 900 m (Figure 3 inset),
with greatest catches from 200–600 m.
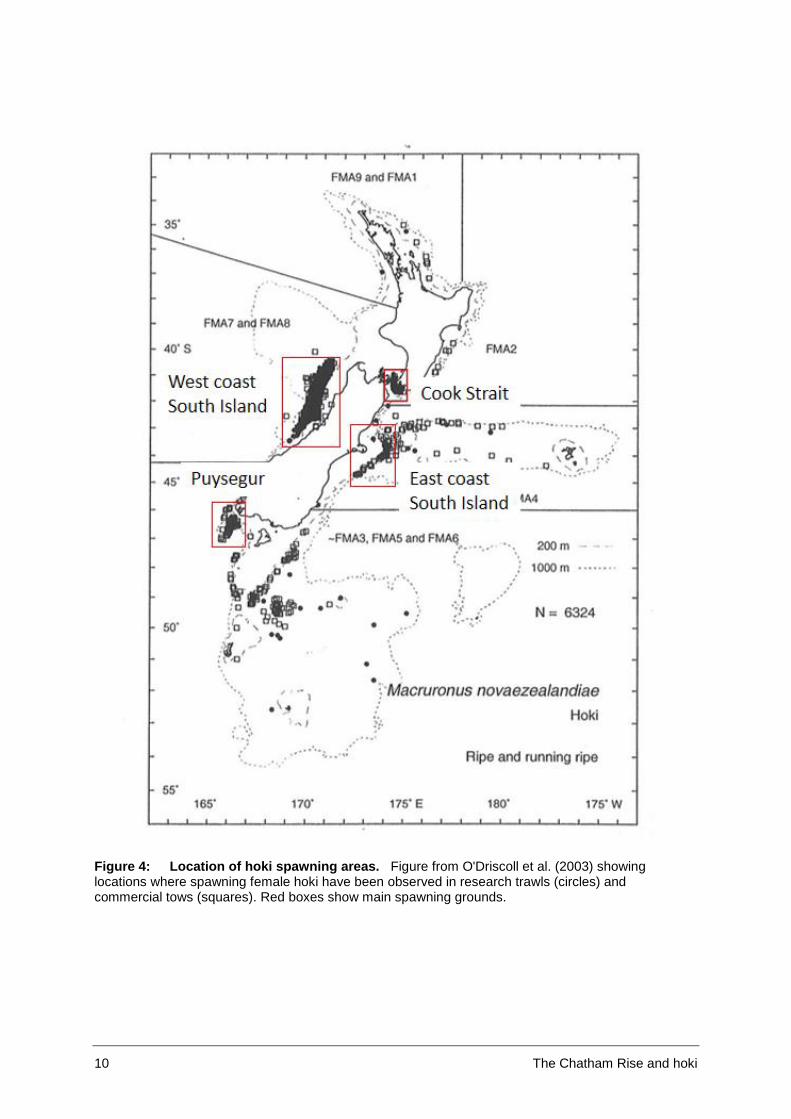
During winter (June–September) adult spawning hoki aggregate into dense schools that are
often associated with canyon features. O’Driscoll et al. (2003) examined spawning areas
based on gonad stage observations from more than 14,000 research and commercial tows,
covering the known distribution of hoki. The main spawning grounds are on the west coast
South Island (WCSI) and in Cook Strait, but some spawning also occurs on the east coast
South Island (ECSI), and on the Puysegur Bank in Southland (Figure 4). A few hoki in
spawning condition have also been recorded on the northwestern Southern Plateau, the
western Chatham Rise, and on the east coast North Island (Figure 4), but these are not
considered to be important spawning areas.
Hoki are multiple batch spawners and female hoki may spawn 3–5 batches of eggs (Langley
1993). Estimates of average residence time on the spawning grounds are 39–42 days for
Cook Strait and 32–37 days for WCSI (Harley 2002). Hoki eggs are released in mid-water
during the night (Zeldis 1993). Eggs are positively buoyant (Patchell et al. 1987), and eggs
and larvae are carried along by surface currents. In Cook Strait, hoki eggs were evenly
distributed from the surface to 70 m, but larvae were most abundant from 20 to 40 m depth
8 The Chatham Rise and hoki
(Murdoch & Chapman 1989). Plankton surveys from Westland showed that hoki eggs were
most abundant along the shelf edge and slope, especially around the Hokitika and Cook
Canyons and the shelf region off Westport (Zeldis et al. 1998). Larvae were abundant where
eggs were abundant, but larger, older larvae occurred shoreward of the eggs and newly
hatched larvae, suggesting onshore advection (Zeldis et al. 1998).
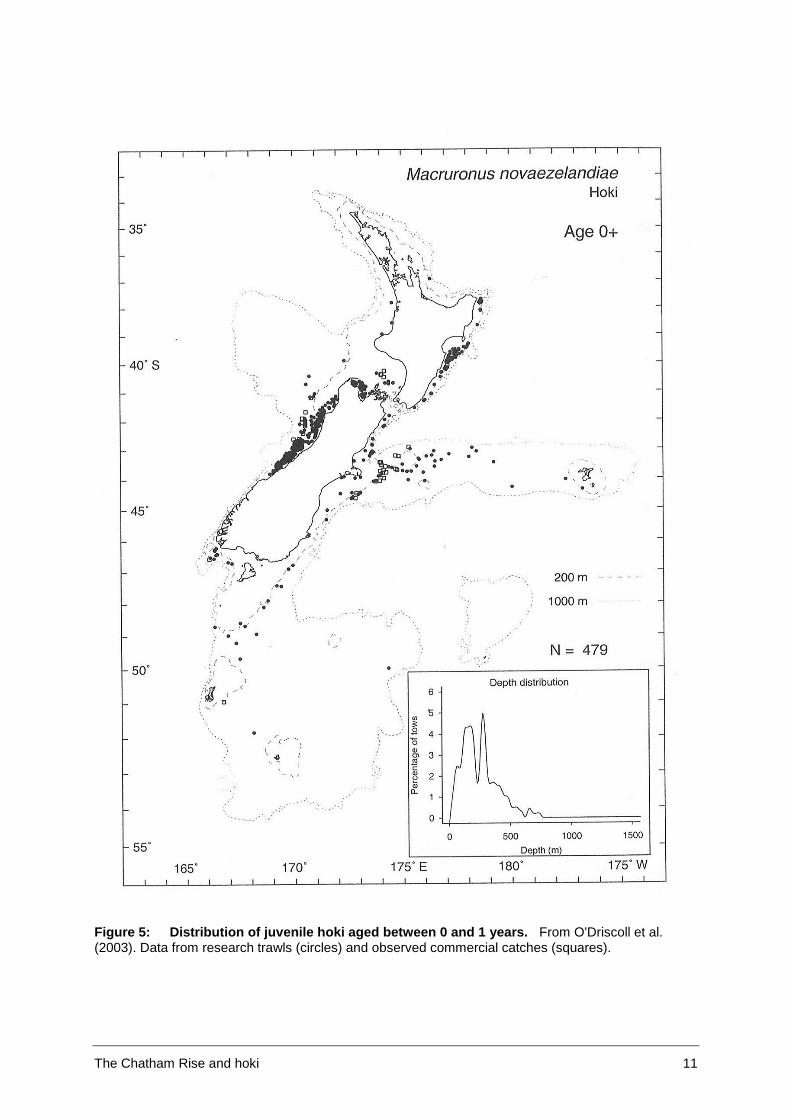
Juveniles of less than one year old (age 0+) occur close to the coasts of the North and South
Islands, mostly at depths from 50–300 m (O’Driscoll et al. 1993). Small, 0+ hoki are recorded
most frequently around spawning areas on west coast South Island, Cook Strait, and
Puysegur, with other concentrations in Tasman and Golden Bays, western Chatham Rise,
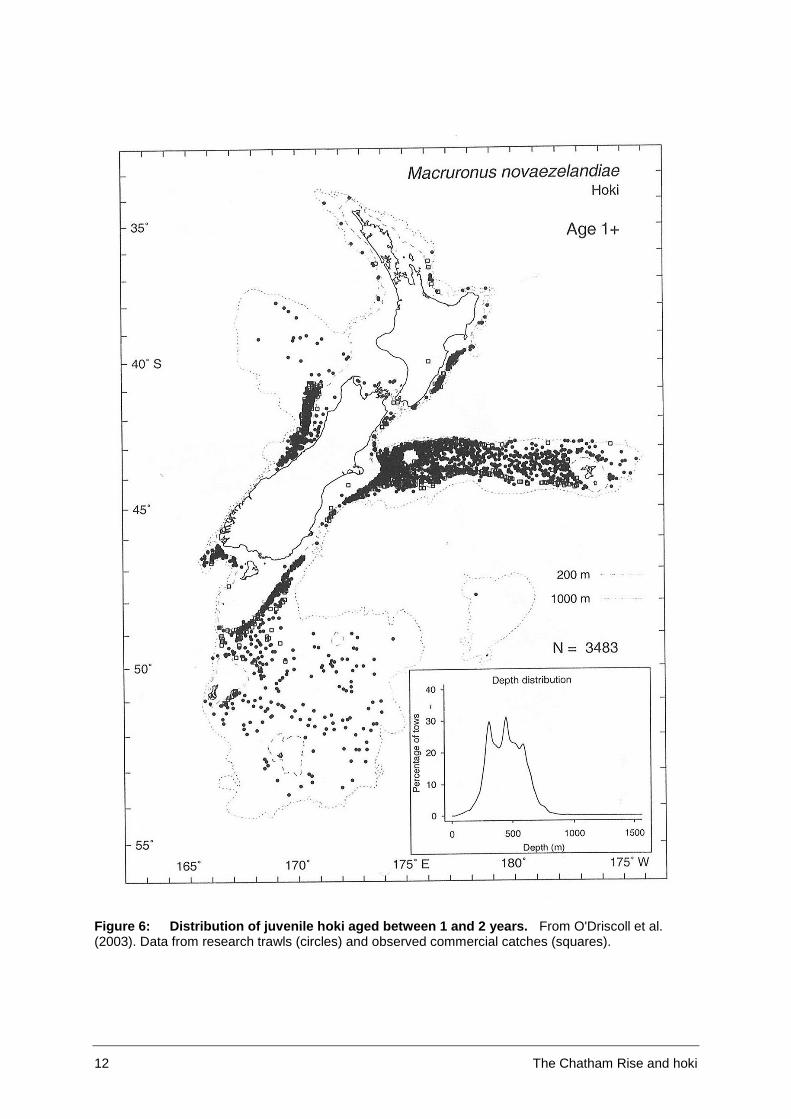
and east coast North Island (Figure 5). Older, 1+ hoki are more widespread, with a wider
depth range from 100–700 m (Figure 6). Juvenile hoki also occur in midwater. Trawling with
fine-mesh midwater trawls in Cook Strait has caught juvenile hoki (20 to 30 cm) at depths of
200–400 m over bottom depths in excess of 600 m (O’Driscoll 2006). Similarly, an
exploratory survey on R.V. Wesermunde in February 1979 recorded high density acoustic
marks from 110 to 270 m depth in Cook Strait, which were identified as very small (14–
24 cm) hoki (Kerstan & Sahrhage 1980). Most juvenile hoki move to the Chatham Rise by
the time they are 2 years old. Based on trawl surveys from 1982–89, Livingston et al. (1992)
estimated that 90% of juvenile hoki (less than 65 cm) are located on the Chatham Rise. In all
areas, the smallest hoki are found in shallower water, with larger fish inhabit progressively
deeper water (Figure 7).
The Chatham Rise and hoki 9
Figure 3: Distribution of hoki from research trawls in 1961-1997. From Anderson et al. (1998).
10 The Chatham Rise and hoki
Figure 4: Location of hoki spawning areas. Figure from O'Driscoll et al. (2003) showing locations where spawning female hoki have been observed in research trawls (circles) and commercial tows (squares). Red boxes show main spawning grounds.
The Chatham Rise and hoki 11
Figure 5: Distribution of juvenile hoki aged between 0 and 1 years. From O'Driscoll et al. (2003). Data from research trawls (circles) and observed commercial catches (squares).
12 The Chatham Rise and hoki
Figure 6: Distribution of juvenile hoki aged between 1 and 2 years. From O'Driscoll et al. (2003). Data from research trawls (circles) and observed commercial catches (squares).
The Chatham Rise and hoki 13
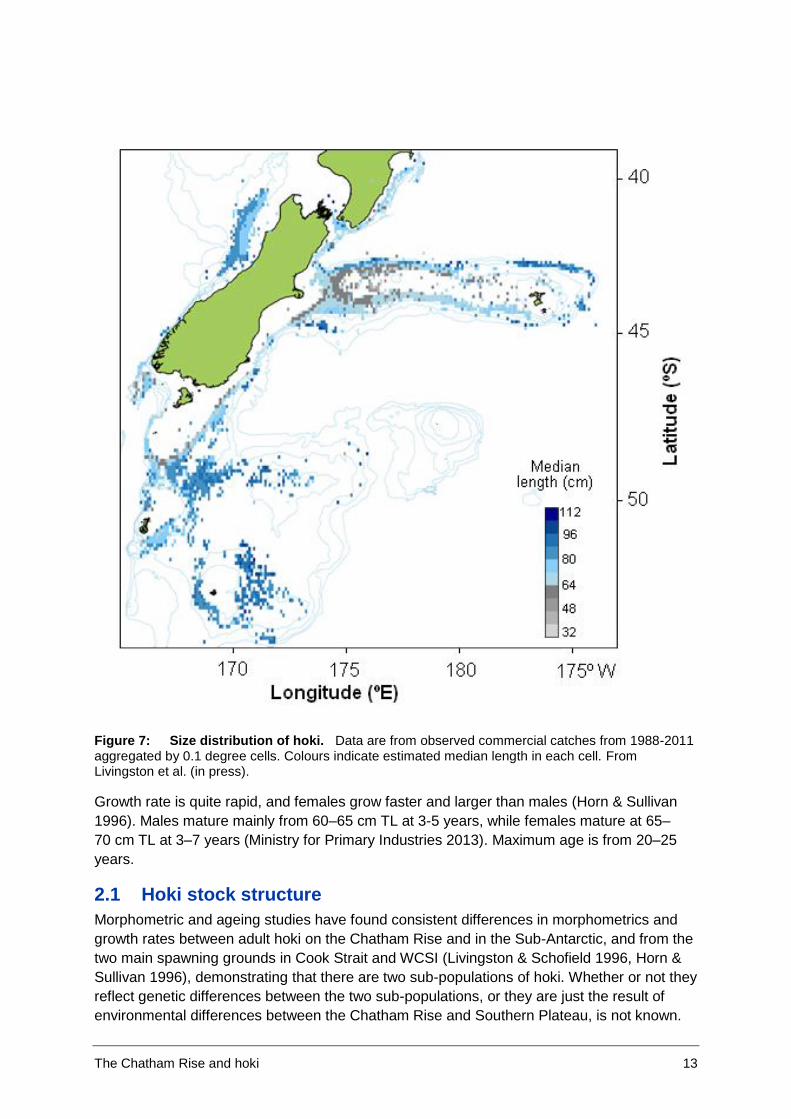
Figure 7: Size distribution of hoki. Data are from observed commercial catches from 1988-2011 aggregated by 0.1 degree cells. Colours indicate estimated median length in each cell. From Livingston et al. (in press).
Growth rate is quite rapid, and females grow faster and larger than males (Horn & Sullivan
1996). Males mature mainly from 60–65 cm TL at 3-5 years, while females mature at 65–
70 cm TL at 3–7 years (Ministry for Primary Industries 2013). Maximum age is from 20–25
years.
2.1 Hoki stock structure
Morphometric and ageing studies have found consistent differences in morphometrics and
growth rates between adult hoki on the Chatham Rise and in the Sub-Antarctic, and from the
two main spawning grounds in Cook Strait and WCSI (Livingston & Schofield 1996, Horn &
Sullivan 1996), demonstrating that there are two sub-populations of hoki. Whether or not they
reflect genetic differences between the two sub-populations, or they are just the result of
environmental differences between the Chatham Rise and Southern Plateau, is not known.
14 The Chatham Rise and hoki
No genetic differences have been detected with selectively neutral markers (Smith et al.
1981, 1996) but even a low exchange rate between stocks could reduce genetic
differentiation.
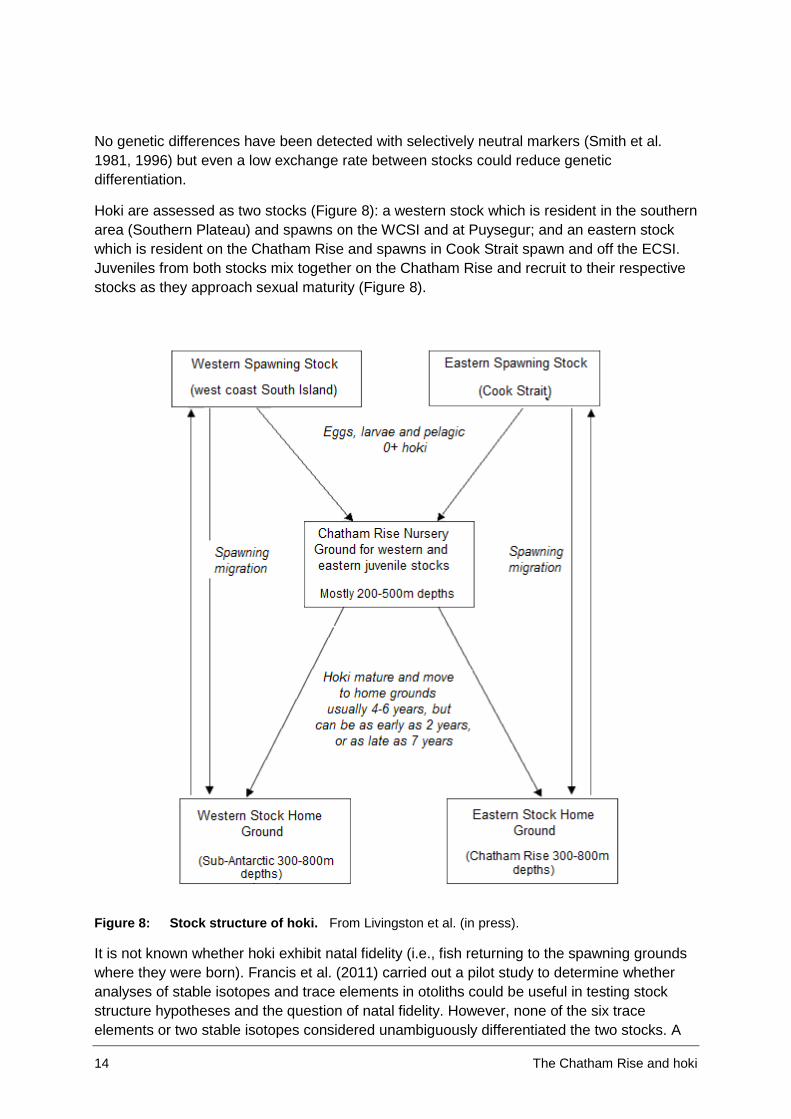
Hoki are assessed as two stocks (Figure 8): a western stock which is resident in the southern
area (Southern Plateau) and spawns on the WCSI and at Puysegur; and an eastern stock
which is resident on the Chatham Rise and spawns in Cook Strait spawn and off the ECSI.
Juveniles from both stocks mix together on the Chatham Rise and recruit to their respective
stocks as they approach sexual maturity (Figure 8).
Figure 8: Stock structure of hoki. From Livingston et al. (in press).
It is not known whether hoki exhibit natal fidelity (i.e., fish returning to the spawning grounds
where they were born). Francis et al. (2011) carried out a pilot study to determine whether
analyses of stable isotopes and trace elements in otoliths could be useful in testing stock
structure hypotheses and the question of natal fidelity. However, none of the six trace
elements or two stable isotopes considered unambiguously differentiated the two stocks. A
The Chatham Rise and hoki 15
recent review concluded that, because hoki are widely dispersed in the non-spawning
season, with multiple diffuse spawning areas, it is unlikely that hoki exhibit 100% natal fidelity
(Horn 2011).
3 Role of the Chatham Rise for NZ hoki The Chatham Rise is the main area of residence (adult home ground) for the eastern hoki
stock and an important juvenile area for hoki of both stocks (see Figure 8). It is also an
important hoki fishing area.
3.1 Importance as a fishing ground
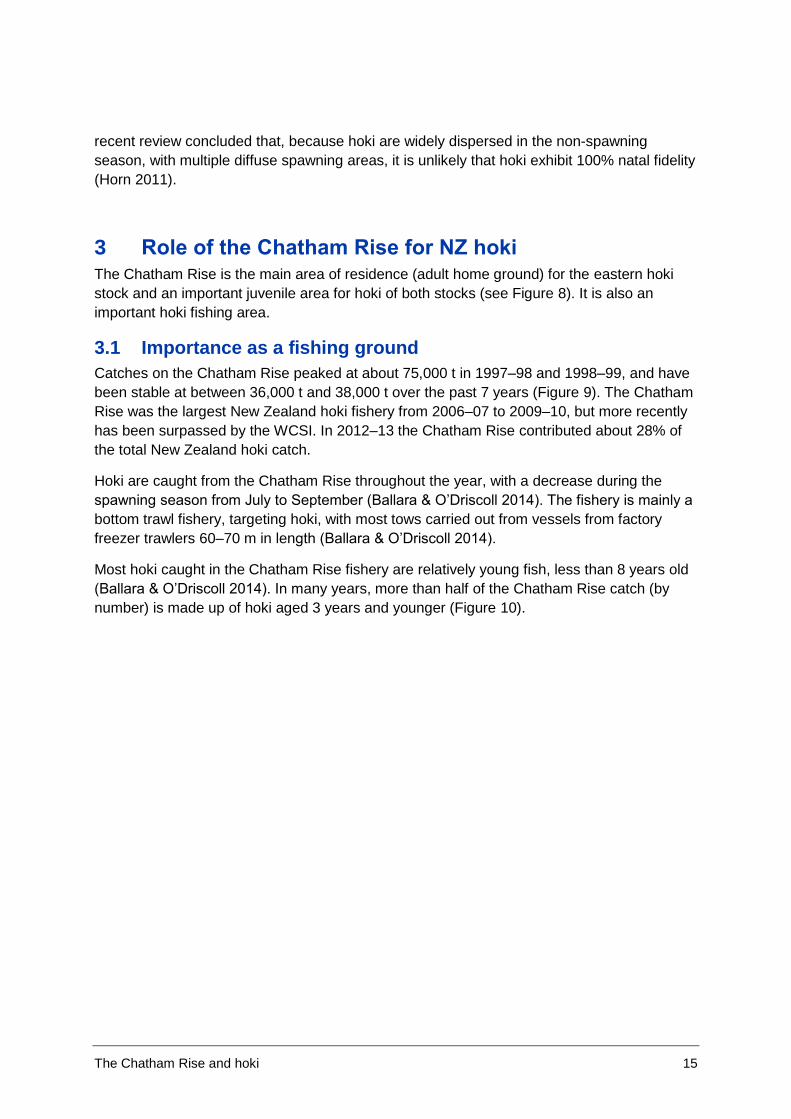
Catches on the Chatham Rise peaked at about 75,000 t in 1997–98 and 1998–99, and have
been stable at between 36,000 t and 38,000 t over the past 7 years (Figure 9). The Chatham
Rise was the largest New Zealand hoki fishery from 2006–07 to 2009–10, but more recently
has been surpassed by the WCSI. In 2012–13 the Chatham Rise contributed about 28% of
the total New Zealand hoki catch.
Hoki are caught from the Chatham Rise throughout the year, with a decrease during the
spawning season from July to September (Ballara & O’Driscoll 2014). The fishery is mainly a
bottom trawl fishery, targeting hoki, with most tows carried out from vessels from factory
freezer trawlers 60–70 m in length (Ballara & O’Driscoll 2014).
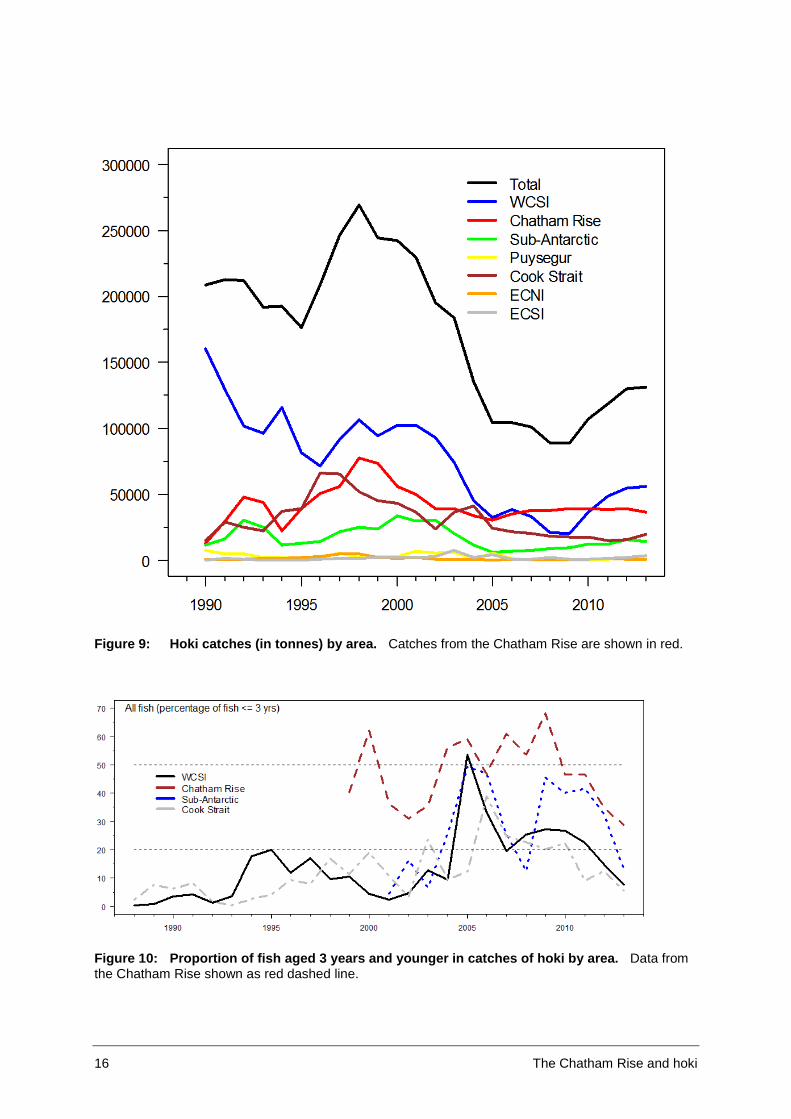
Most hoki caught in the Chatham Rise fishery are relatively young fish, less than 8 years old
(Ballara & O’Driscoll 2014). In many years, more than half of the Chatham Rise catch (by
number) is made up of hoki aged 3 years and younger (Figure 10).
16 The Chatham Rise and hoki
Figure 9: Hoki catches (in tonnes) by area. Catches from the Chatham Rise are shown in red.
Figure 10: Proportion of fish aged 3 years and younger in catches of hoki by area. Data from the Chatham Rise shown as red dashed line.
The Chatham Rise and hoki 17
3.2 Importance as a juvenile hoki area
The Chatham Rise is the major juvenile (‘nursery’) area for hoki of both stocks. As noted in
Section 2, most juvenile hoki are thought to move to the Chatham Rise by the time they are 2
years old. Because of the importance of the Chatham Rise as a juvenile hoki area, annual
research trawl surveys of the Chatham Rise have been carried out every January since 1992
(O’Driscoll et al. 2011). The main aim of these surveys has been to obtain estimates of
juvenile hoki to determine the relative year-class strength which will enter the fishery in
subsequent years.
Stock assessment models show that indices of juvenile hoki from the Chatham Rise survey
provide reliable information about year-class strengths for both stocks, which are consistent
with age composition data observed in the commercial catch and in subsequent surveys
(McKenzie 2011). The correlation between Chatham Rise survey estimates of hoki year
class strength at age 1+ (terminology denotes hoki that are 1.5 years old at the time of the
survey) and model estimates is quite strong, but correlation is even higher for survey
estimates at age 2+ (Francis 2008).
Based on trawl surveys from 1982–89, Livingston et al. (1992) estimated that 90% of juvenile
hoki (less than 65 cm) are located on the Chatham Rise. We reviewed this estimate based
on data on the numbers-at-age of hoki from research trawl surveys since 1991 (Table 1).
There have been four consistent trawl time series in this period which sample juvenile hoki
during the summer non-spawning season (November–April): the 23 annual surveys of the
Chatham Rise covering 200–800 m depths; 15 surveys of the Sub-Antarctic (Southern
Plateau and Puysegur) covering 300–800 m; 4 surveys of Southland covering 50–600 m;
and 11 surveys of the WCSI from 20–400 m. The Chatham Rise, Sub-Antarctic, and
Southland surveys used the same trawl gear from RV Tangaroa, the WCSI survey was from
RV Kaharoa.
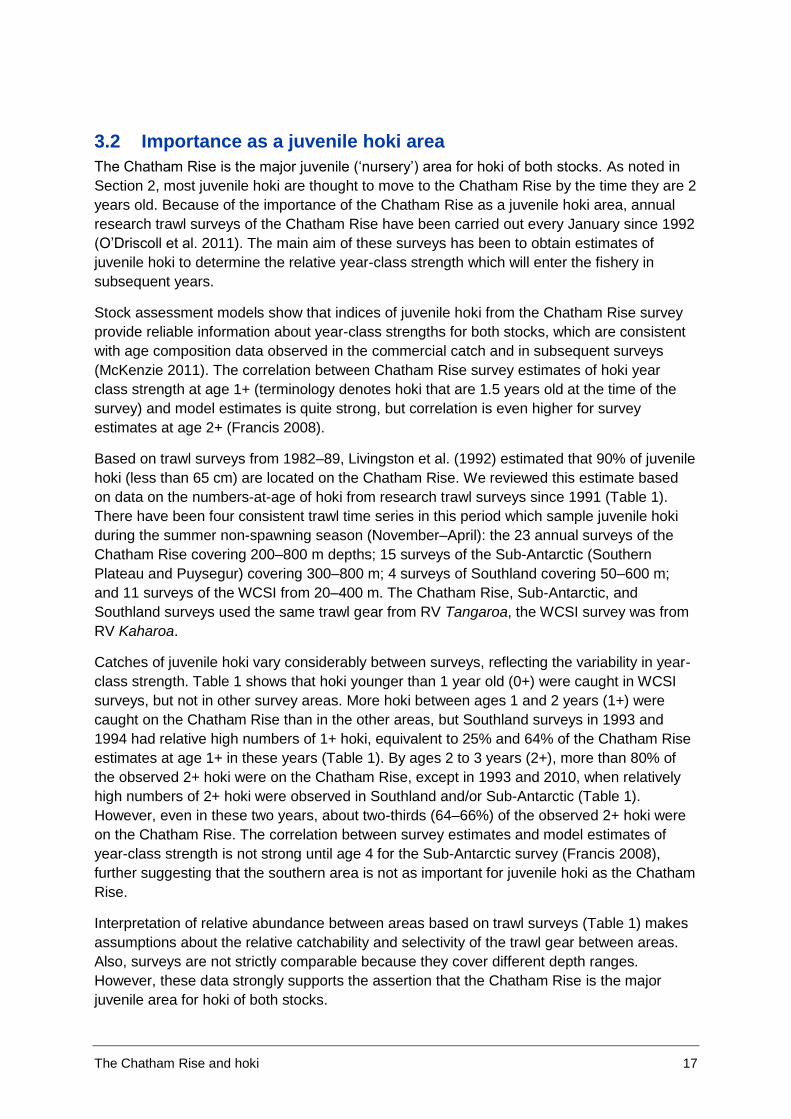
Catches of juvenile hoki vary considerably between surveys, reflecting the variability in year-
class strength. Table 1 shows that hoki younger than 1 year old (0+) were caught in WCSI
surveys, but not in other survey areas. More hoki between ages 1 and 2 years (1+) were
caught on the Chatham Rise than in the other areas, but Southland surveys in 1993 and
1994 had relative high numbers of 1+ hoki, equivalent to 25% and 64% of the Chatham Rise
estimates at age 1+ in these years (Table 1). By ages 2 to 3 years (2+), more than 80% of
the observed 2+ hoki were on the Chatham Rise, except in 1993 and 2010, when relatively
high numbers of 2+ hoki were observed in Southland and/or Sub-Antarctic (Table 1).
However, even in these two years, about two-thirds (64–66%) of the observed 2+ hoki were
on the Chatham Rise. The correlation between survey estimates and model estimates of
year-class strength is not strong until age 4 for the Sub-Antarctic survey (Francis 2008),
further suggesting that the southern area is not as important for juvenile hoki as the Chatham
Rise.
Interpretation of relative abundance between areas based on trawl surveys (Table 1) makes
assumptions about the relative catchability and selectivity of the trawl gear between areas.
Also, surveys are not strictly comparable because they cover different depth ranges.
However, these data strongly supports the assertion that the Chatham Rise is the major
juvenile area for hoki of both stocks.
18 The Chatham Rise and hoki
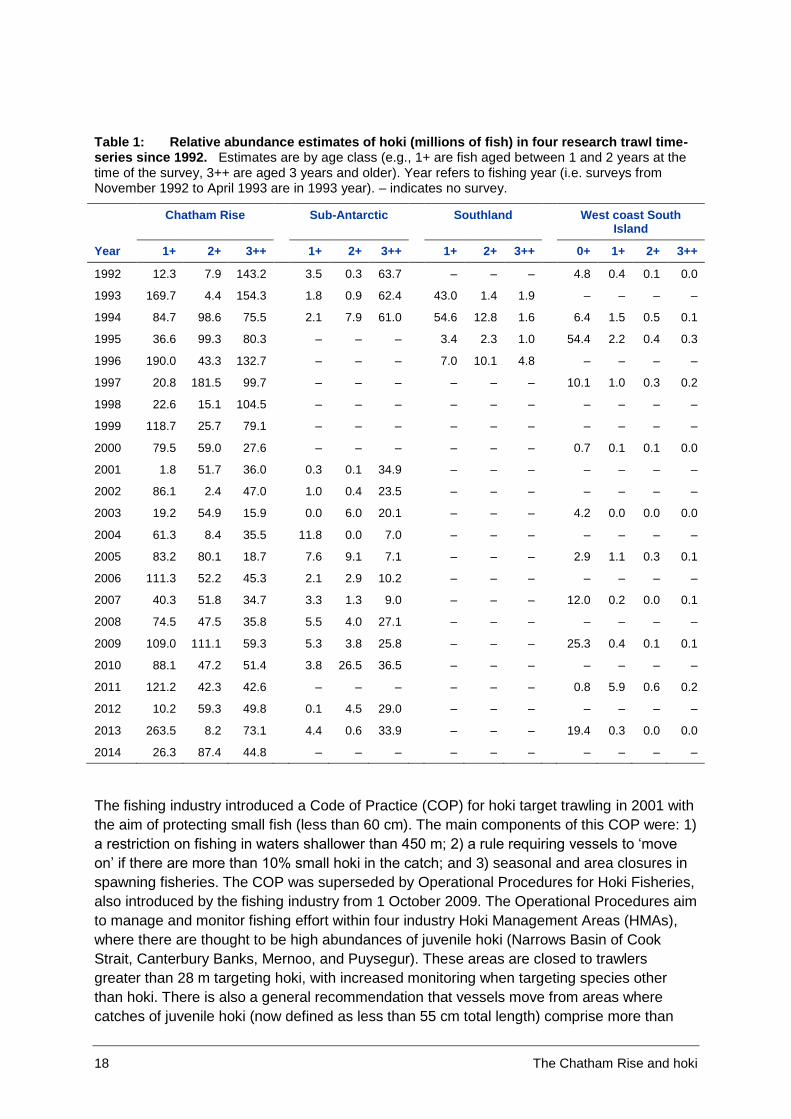
Table 1: Relative abundance estimates of hoki (millions of fish) in four research trawl time-series since 1992. Estimates are by age class (e.g., 1+ are fish aged between 1 and 2 years at the time of the survey, 3++ are aged 3 years and older). Year refers to fishing year (i.e. surveys from November 1992 to April 1993 are in 1993 year). – indicates no survey.
Chatham Rise Sub-Antarctic Southland West coast South Island
Year 1+ 2+ 3++ 1+ 2+ 3++ 1+ 2+ 3++ 0+ 1+ 2+ 3++
1992 12.3 7.9 143.2 3.5 0.3 63.7 – – – 4.8 0.4 0.1 0.0
1993 169.7 4.4 154.3 1.8 0.9 62.4 43.0 1.4 1.9 – – – –
1994 84.7 98.6 75.5 2.1 7.9 61.0 54.6 12.8 1.6 6.4 1.5 0.5 0.1
1995 36.6 99.3 80.3 – – – 3.4 2.3 1.0 54.4 2.2 0.4 0.3
1996 190.0 43.3 132.7 – – – 7.0 10.1 4.8 – – – –
1997 20.8 181.5 99.7 – – – – – – 10.1 1.0 0.3 0.2
1998 22.6 15.1 104.5 – – – – – – – – – –
1999 118.7 25.7 79.1 – – – – – – – – – –
2000 79.5 59.0 27.6 – – – – – – 0.7 0.1 0.1 0.0
2001 1.8 51.7 36.0 0.3 0.1 34.9 – – – – – – –
2002 86.1 2.4 47.0 1.0 0.4 23.5 – – – – – – –
2003 19.2 54.9 15.9 0.0 6.0 20.1 – – – 4.2 0.0 0.0 0.0
2004 61.3 8.4 35.5 11.8 0.0 7.0 – – – – – – –
2005 83.2 80.1 18.7 7.6 9.1 7.1 – – – 2.9 1.1 0.3 0.1
2006 111.3 52.2 45.3 2.1 2.9 10.2 – – – – – – –
2007 40.3 51.8 34.7 3.3 1.3 9.0 – – – 12.0 0.2 0.0 0.1
2008 74.5 47.5 35.8 5.5 4.0 27.1 – – – – – – –
2009 109.0 111.1 59.3 5.3 3.8 25.8 – – – 25.3 0.4 0.1 0.1
2010 88.1 47.2 51.4 3.8 26.5 36.5 – – – – – – –
2011 121.2 42.3 42.6 – – – – – – 0.8 5.9 0.6 0.2
2012 10.2 59.3 49.8 0.1 4.5 29.0 – – – – – – –
2013 263.5 8.2 73.1 4.4 0.6 33.9 – – – 19.4 0.3 0.0 0.0
2014 26.3 87.4 44.8 – – – – – – – – – –
The fishing industry introduced a Code of Practice (COP) for hoki target trawling in 2001 with
the aim of protecting small fish (less than 60 cm). The main components of this COP were: 1)
a restriction on fishing in waters shallower than 450 m; 2) a rule requiring vessels to ‘move
on’ if there are more than 10% small hoki in the catch; and 3) seasonal and area closures in
spawning fisheries. The COP was superseded by Operational Procedures for Hoki Fisheries,
also introduced by the fishing industry from 1 October 2009. The Operational Procedures aim
to manage and monitor fishing effort within four industry Hoki Management Areas (HMAs),
where there are thought to be high abundances of juvenile hoki (Narrows Basin of Cook
Strait, Canterbury Banks, Mernoo, and Puysegur). These areas are closed to trawlers
greater than 28 m targeting hoki, with increased monitoring when targeting species other
than hoki. There is also a general recommendation that vessels move from areas where
catches of juvenile hoki (now defined as less than 55 cm total length) comprise more than
The Chatham Rise and hoki 19
20% of the hoki catch by number. There are two Hoki Management Areas (HMAs) on the
western Chatham Rise (Mernoo Bank and Canterbury Banks).
3.3 Importance as an adult hoki area
The Chatham Rise is the main area of residence for the eastern hoki stock. The eastern hoki
stock is smaller than the western stock. The most recent hoki stock assessment (McKenzie
in press) estimates that adult (spawning) biomass in the eastern stock in 2013 was 263,000–
313,000 t, compared to 434,000–721,000 t in the western stock. Adult fish from the eastern
stock are also taken from the east coast of the North and South Islands and year round in
Cook Strait, but the volume of catches from these areas is much lower than those from the
Chatham Rise (Ballara & O’Driscoll 2014).
Since 1992, trawl survey estimates of hoki aged 3 years and older on the Chatham Rise are
general higher than those from surveys the other home ground in the Sub-Antarctic (see
Table 1). This is because western hoki also remain on the Chatham Rise until they mature
and migrate to the Sub-Antarctic. Most western hoki move off the Chatham Rise at ages 4–6
years (Livingston et al. 2002a).
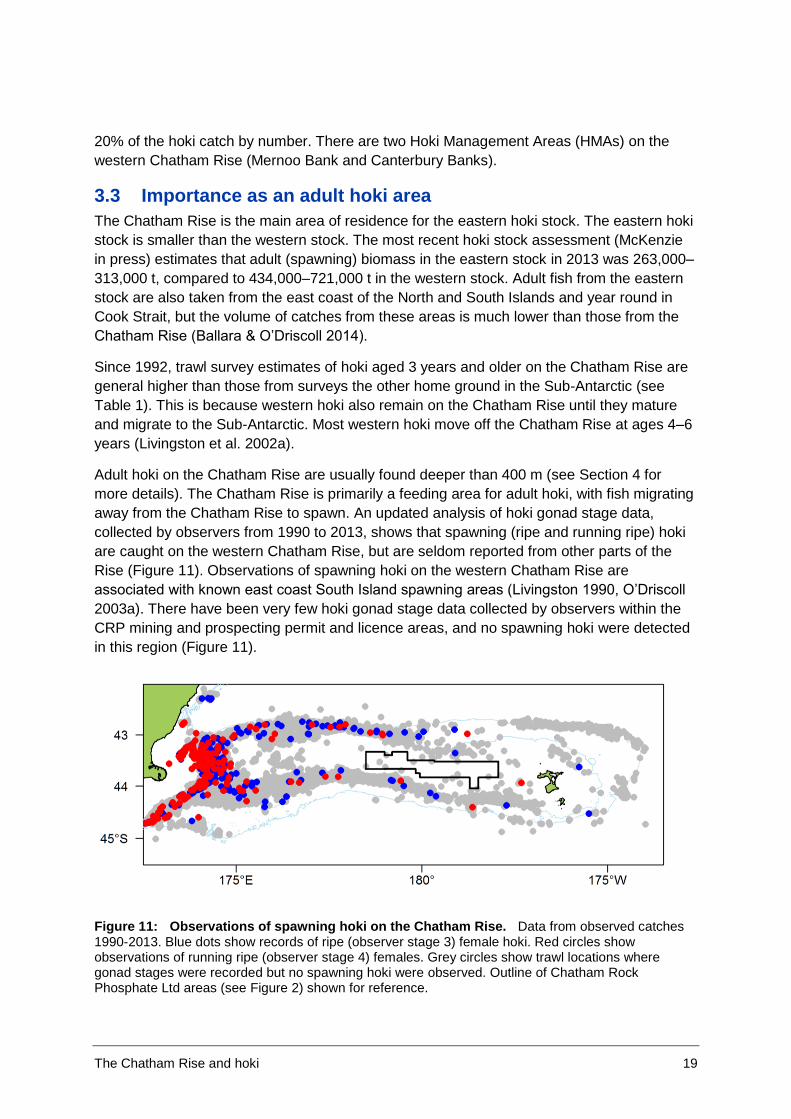
Adult hoki on the Chatham Rise are usually found deeper than 400 m (see Section 4 for
more details). The Chatham Rise is primarily a feeding area for adult hoki, with fish migrating
away from the Chatham Rise to spawn. An updated analysis of hoki gonad stage data,
collected by observers from 1990 to 2013, shows that spawning (ripe and running ripe) hoki
are caught on the western Chatham Rise, but are seldom reported from other parts of the
Rise (Figure 11). Observations of spawning hoki on the western Chatham Rise are
associated with known east coast South Island spawning areas (Livingston 1990, O’Driscoll
2003a). There have been very few hoki gonad stage data collected by observers within the
CRP mining and prospecting permit and licence areas, and no spawning hoki were detected
in this region (Figure 11).
Figure 11: Observations of spawning hoki on the Chatham Rise. Data from observed catches 1990-2013. Blue dots show records of ripe (observer stage 3) female hoki. Red circles show observations of running ripe (observer stage 4) females. Grey circles show trawl locations where gonad stages were recorded but no spawning hoki were observed. Outline of Chatham Rock Phosphate Ltd areas (see Figure 2) shown for reference.
20 The Chatham Rise and hoki
4 Spatial distribution of hoki on the Chatham Rise For this report we summarise available data on spatial distribution of hoki on the Chatham
Rise from two main sources: 1) Tangaroa bottom trawl surveys from 1992–2014; and 2)
observations from commercial catches from 1990–2013. Details of the design and methods
of the Chatham Rise trawl survey are reviewed by O’Driscoll et al. (2011). Trawl survey data
were collected using a stratified random design, which ensures spatial coverage of all
regions of the Chatham Rise from 200–800 m depths. Trawl surveys were carried out at the
same time of year (January) using standardised trawl gear and protocols. A much greater
volume of data is available from commercial catches, and data cover all months of the year.
However commercial data are restricted to areas where fishing operations took place, and
there have been changes in fishing practices and gear over time.
4.1 Trawl survey data
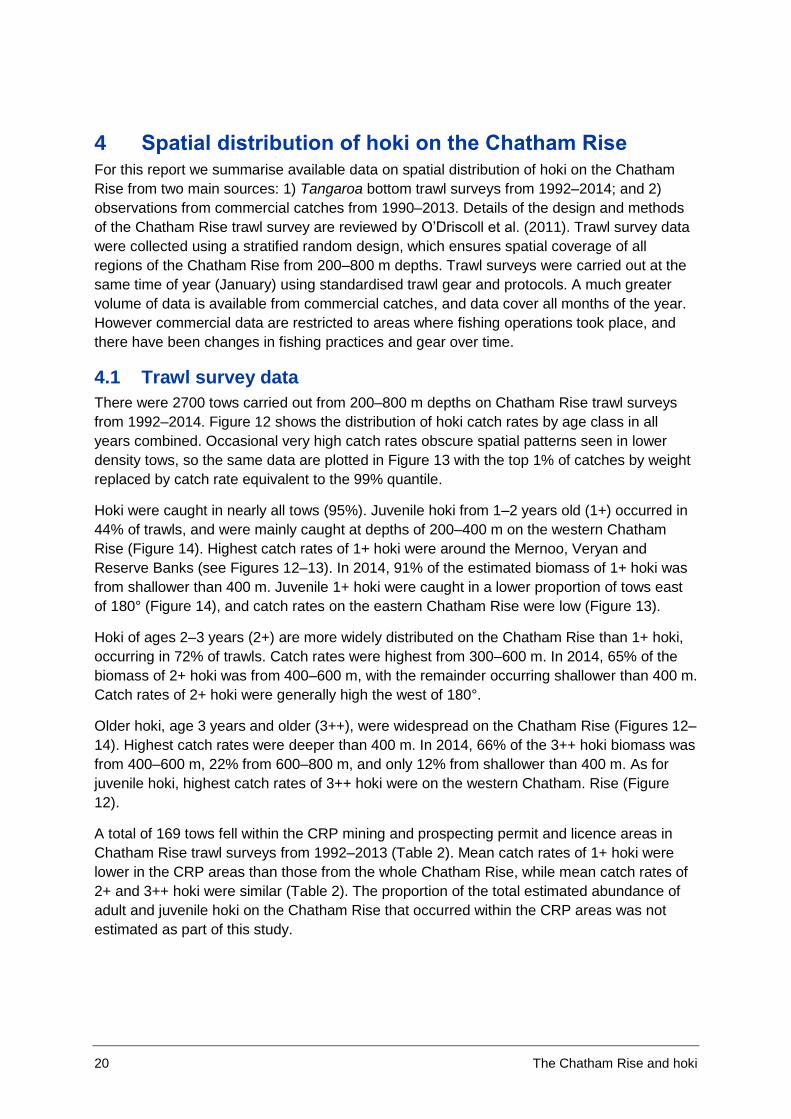
There were 2700 tows carried out from 200–800 m depths on Chatham Rise trawl surveys
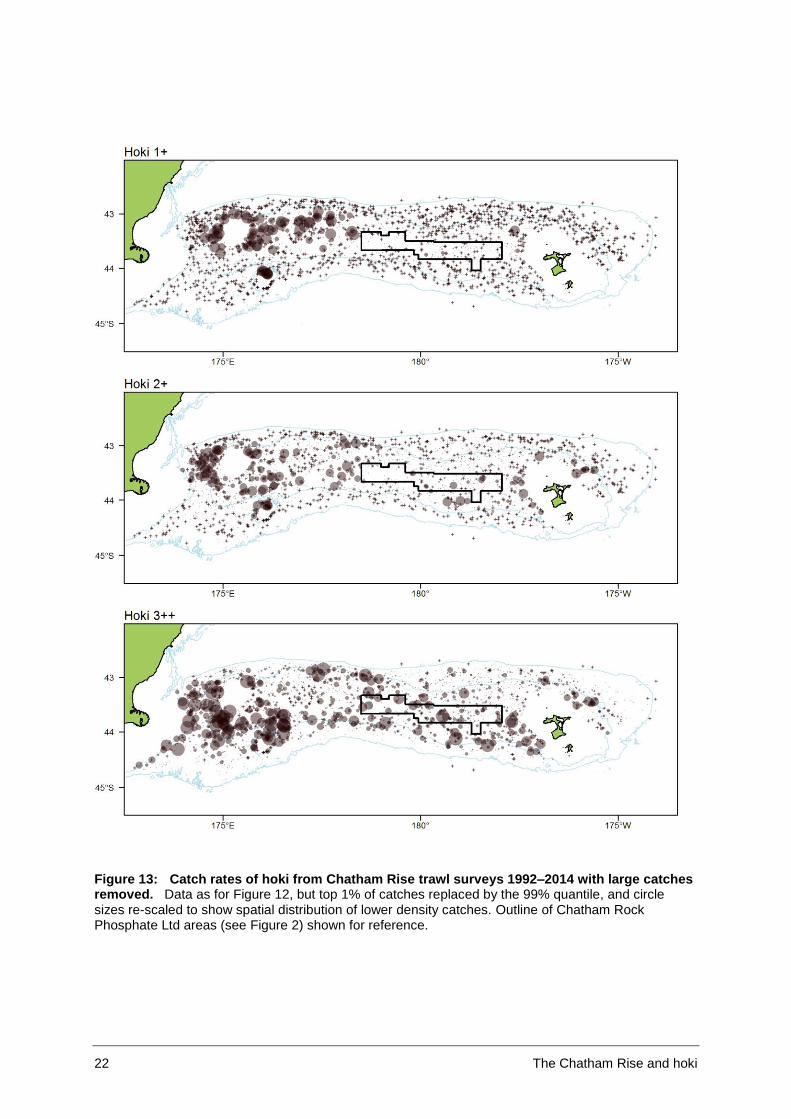
from 1992–2014. Figure 12 shows the distribution of hoki catch rates by age class in all
years combined. Occasional very high catch rates obscure spatial patterns seen in lower
density tows, so the same data are plotted in Figure 13 with the top 1% of catches by weight
replaced by catch rate equivalent to the 99% quantile.
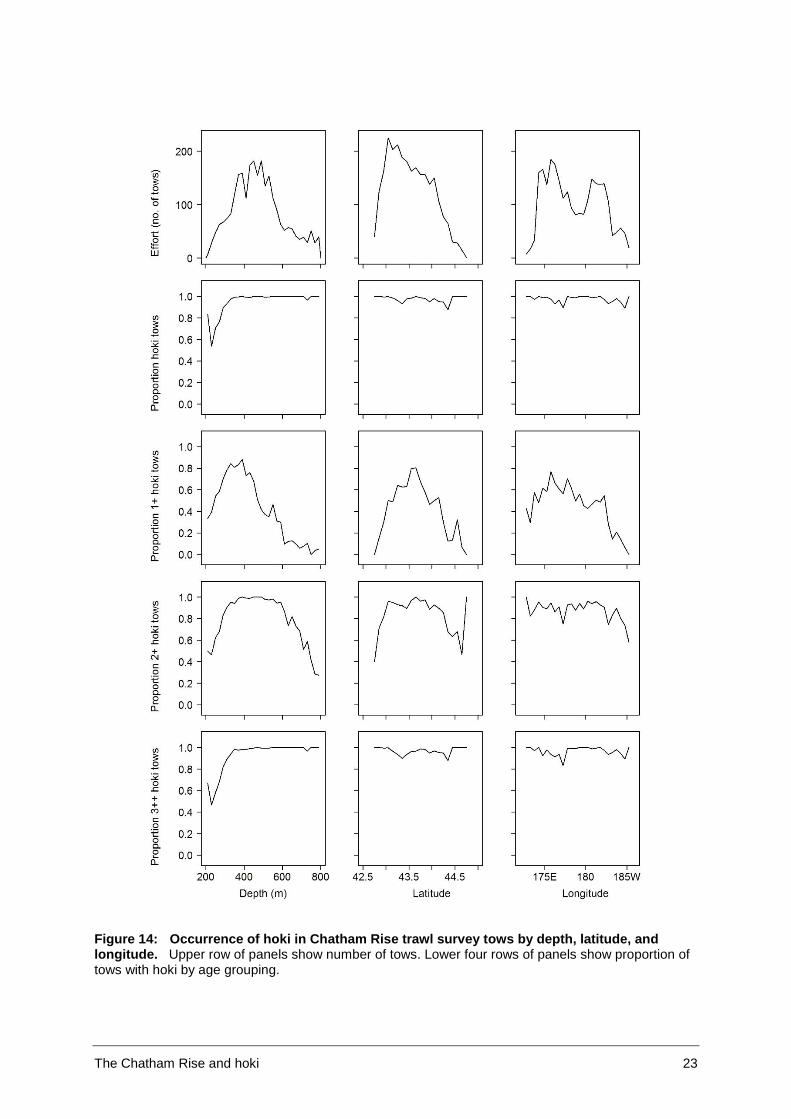
Hoki were caught in nearly all tows (95%). Juvenile hoki from 1–2 years old (1+) occurred in
44% of trawls, and were mainly caught at depths of 200–400 m on the western Chatham
Rise (Figure 14). Highest catch rates of 1+ hoki were around the Mernoo, Veryan and
Reserve Banks (see Figures 12–13). In 2014, 91% of the estimated biomass of 1+ hoki was
from shallower than 400 m. Juvenile 1+ hoki were caught in a lower proportion of tows east
of 180° (Figure 14), and catch rates on the eastern Chatham Rise were low (Figure 13).
Hoki of ages 2–3 years (2+) are more widely distributed on the Chatham Rise than 1+ hoki,
occurring in 72% of trawls. Catch rates were highest from 300–600 m. In 2014, 65% of the
biomass of 2+ hoki was from 400–600 m, with the remainder occurring shallower than 400 m.
Catch rates of 2+ hoki were generally high the west of 180°.
Older hoki, age 3 years and older (3++), were widespread on the Chatham Rise (Figures 12–
14). Highest catch rates were deeper than 400 m. In 2014, 66% of the 3++ hoki biomass was
from 400–600 m, 22% from 600–800 m, and only 12% from shallower than 400 m. As for
juvenile hoki, highest catch rates of 3++ hoki were on the western Chatham. Rise (Figure
12).
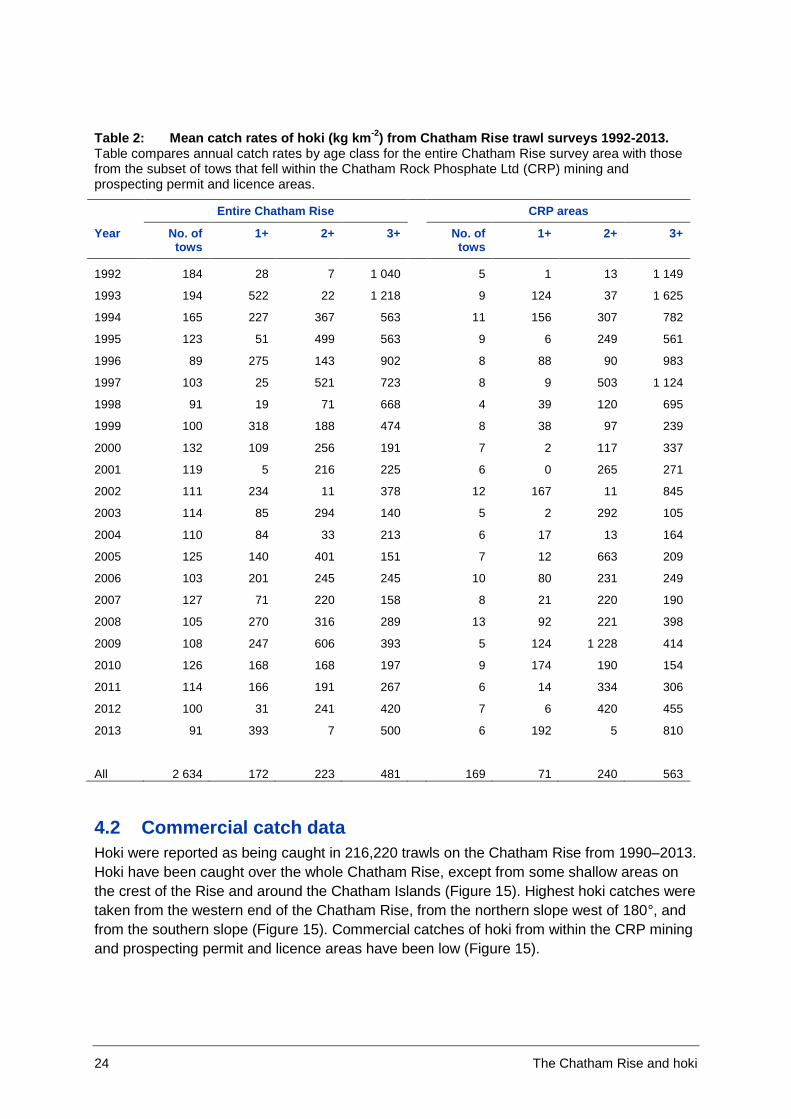
A total of 169 tows fell within the CRP mining and prospecting permit and licence areas in
Chatham Rise trawl surveys from 1992–2013 (Table 2). Mean catch rates of 1+ hoki were
lower in the CRP areas than those from the whole Chatham Rise, while mean catch rates of
2+ and 3++ hoki were similar (Table 2). The proportion of the total estimated abundance of
adult and juvenile hoki on the Chatham Rise that occurred within the CRP areas was not
estimated as part of this study.
The Chatham Rise and hoki 21
Figure 12: Catch rates of hoki from Chatham Rise trawl surveys 1992–2014. Hoki are disaggregated by age class (1+ means 1–2 years, 2+ is 2–3 years, and 3++ is 3 years and older). Circle area is proportional to catch rate with largest circle size equivalent to maximum catch rate. Crosses show tows with zero catch. Outline of Chatham Rock Phosphate Ltd areas (see Figure 2) shown for reference.
22 The Chatham Rise and hoki
Figure 13: Catch rates of hoki from Chatham Rise trawl surveys 1992–2014 with large catches removed. Data as for Figure 12, but top 1% of catches replaced by the 99% quantile, and circle sizes re-scaled to show spatial distribution of lower density catches. Outline of Chatham Rock Phosphate Ltd areas (see Figure 2) shown for reference.
The Chatham Rise and hoki 23
Figure 14: Occurrence of hoki in Chatham Rise trawl survey tows by depth, latitude, and longitude. Upper row of panels show number of tows. Lower four rows of panels show proportion of tows with hoki by age grouping.
24 The Chatham Rise and hoki
Table 2: Mean catch rates of hoki (kg km-2
) from Chatham Rise trawl surveys 1992-2013. Table compares annual catch rates by age class for the entire Chatham Rise survey area with those from the subset of tows that fell within the Chatham Rock Phosphate Ltd (CRP) mining and prospecting permit and licence areas.
Entire Chatham Rise CRP areas
Year No. of tows
1+ 2+ 3+ No. of tows
1+ 2+ 3+
1992 184 28 7 1 040 5 1 13 1 149
1993 194 522 22 1 218 9 124 37 1 625
1994 165 227 367 563 11 156 307 782
1995 123 51 499 563 9 6 249 561
1996 89 275 143 902 8 88 90 983
1997 103 25 521 723 8 9 503 1 124
1998 91 19 71 668 4 39 120 695
1999 100 318 188 474 8 38 97 239
2000 132 109 256 191 7 2 117 337
2001 119 5 216 225 6 0 265 271
2002 111 234 11 378 12 167 11 845
2003 114 85 294 140 5 2 292 105
2004 110 84 33 213 6 17 13 164
2005 125 140 401 151 7 12 663 209
2006 103 201 245 245 10 80 231 249
2007 127 71 220 158 8 21 220 190
2008 105 270 316 289 13 92 221 398
2009 108 247 606 393 5 124 1 228 414
2010 126 168 168 197 9 174 190 154
2011 114 166 191 267 6 14 334 306
2012 100 31 241 420 7 6 420 455
2013 91 393 7 500 6 192 5 810
All 2 634 172 223 481 169 71 240 563
4.2 Commercial catch data
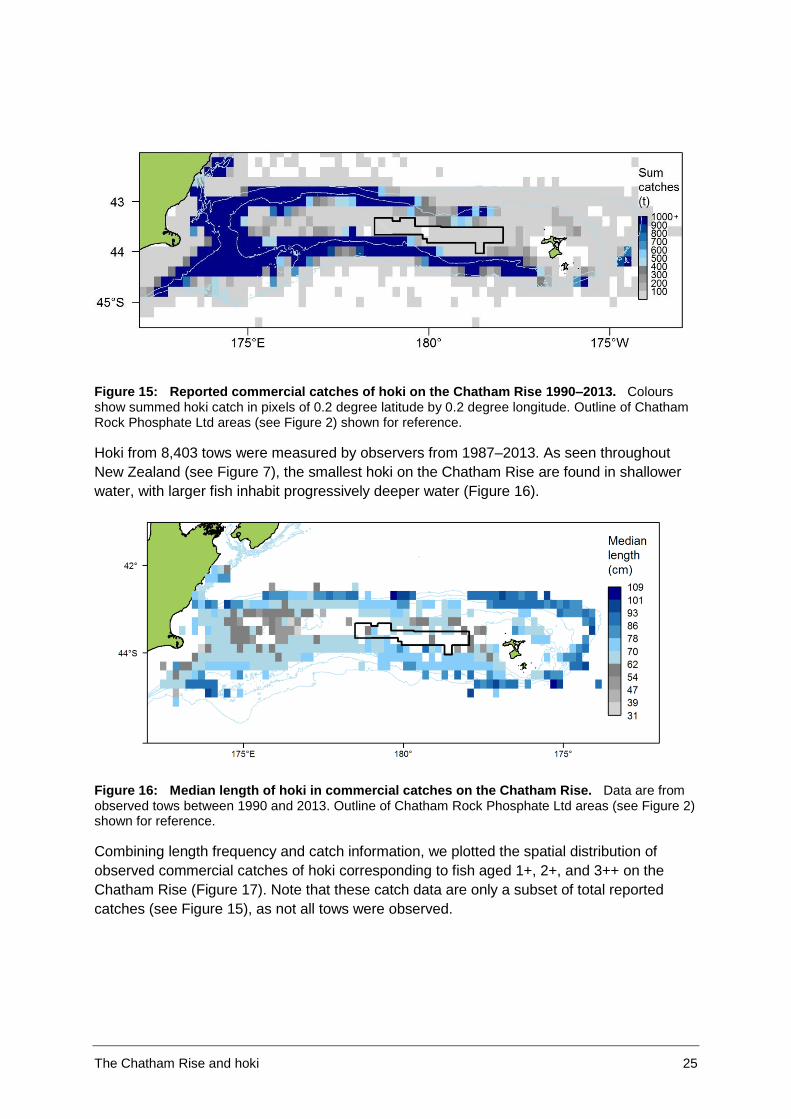
Hoki were reported as being caught in 216,220 trawls on the Chatham Rise from 1990–2013.
Hoki have been caught over the whole Chatham Rise, except from some shallow areas on
the crest of the Rise and around the Chatham Islands (Figure 15). Highest hoki catches were
taken from the western end of the Chatham Rise, from the northern slope west of 180°, and
from the southern slope (Figure 15). Commercial catches of hoki from within the CRP mining
and prospecting permit and licence areas have been low (Figure 15).
The Chatham Rise and hoki 25
Figure 15: Reported commercial catches of hoki on the Chatham Rise 1990–2013. Colours show summed hoki catch in pixels of 0.2 degree latitude by 0.2 degree longitude. Outline of Chatham Rock Phosphate Ltd areas (see Figure 2) shown for reference.
Hoki from 8,403 tows were measured by observers from 1987–2013. As seen throughout
New Zealand (see Figure 7), the smallest hoki on the Chatham Rise are found in shallower
water, with larger fish inhabit progressively deeper water (Figure 16).
Figure 16: Median length of hoki in commercial catches on the Chatham Rise. Data are from observed tows between 1990 and 2013. Outline of Chatham Rock Phosphate Ltd areas (see Figure 2) shown for reference.
Combining length frequency and catch information, we plotted the spatial distribution of
observed commercial catches of hoki corresponding to fish aged 1+, 2+, and 3++ on the
Chatham Rise (Figure 17). Note that these catch data are only a subset of total reported
catches (see Figure 15), as not all tows were observed.
26 The Chatham Rise and hoki
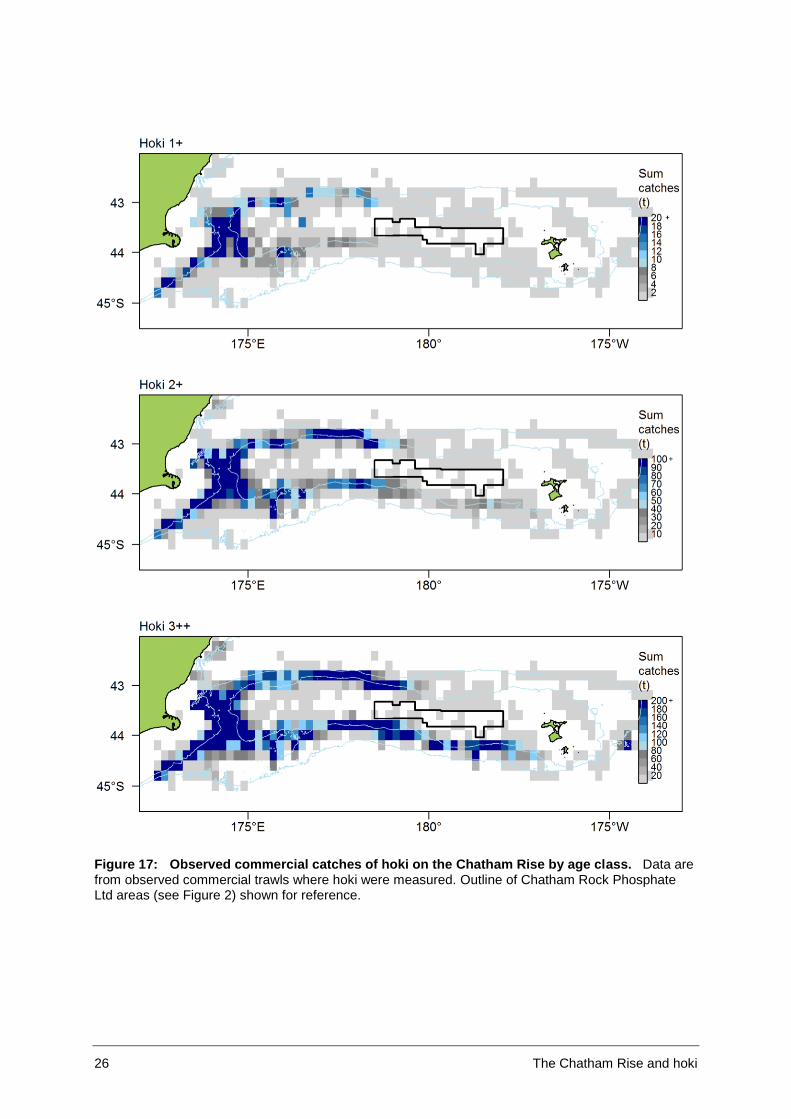
Figure 17: Observed commercial catches of hoki on the Chatham Rise by age class. Data are from observed commercial trawls where hoki were measured. Outline of Chatham Rock Phosphate Ltd areas (see Figure 2) shown for reference.
The Chatham Rise and hoki 27
The spatial distribution of hoki from commercial catches by age (Figure 17) was similar to
that observed in the Chatham Rise trawl survey (see Figures 12–13). Juvenile 1+ hoki were
restricted to the western Chatham Rise, with a wider distribution of 2+ hoki. Larger 3++ hoki
were widespread across the Chatham Rise, but highest catches were in the west and on the
northern and southern slopes (Figure 17).
Commercial data also indicate that small catches of older hoki are sometimes targeted over
hill complexes on the Chatham Rise (Dunn & Livingston 2004), particularly on the south
Chatham Rise, and on the Andes seamounts east of the Chatham Islands.
5 Vertical distribution of hoki on the Chatham Rise Little information exists on the vertical distribution of hoki on the Chatham Rise. Most
available data are from bottom trawling (see Section 4), and therefore provide little
information on distribution away from the seabed. The bottom trawl used in the research
trawl survey has a headline height (vertical opening) of about 7 m, and commercial hoki
bottom trawls also typically have headline heights of less than 10 m.
Time-of-day has been shown to have a substantial effect on the catchability of hoki in bottom
trawls (e.g., Livingston et al. 2002b). For this reason, all research trawls in the Chatham Rise
survey are carried out in daylight. Generalized linear modelling of (daytime) trawl catch rates
on them Chatham Rise suggested that hoki catchability was about 1.6 times higher at noon
than during the 2 hours following sunrise (Livingston et al. 2002b). Similarly, analysis of
commercial catch-per-unit-effort (CPUE) data on the Chatham Rise have found catch rates
of hoki are highest from 0900 h to 1200 h NZST (NIWA, unpublished data). This diurnal
pattern in catchability is most likely due to vertical migration of hoki away from the seabed at
night.
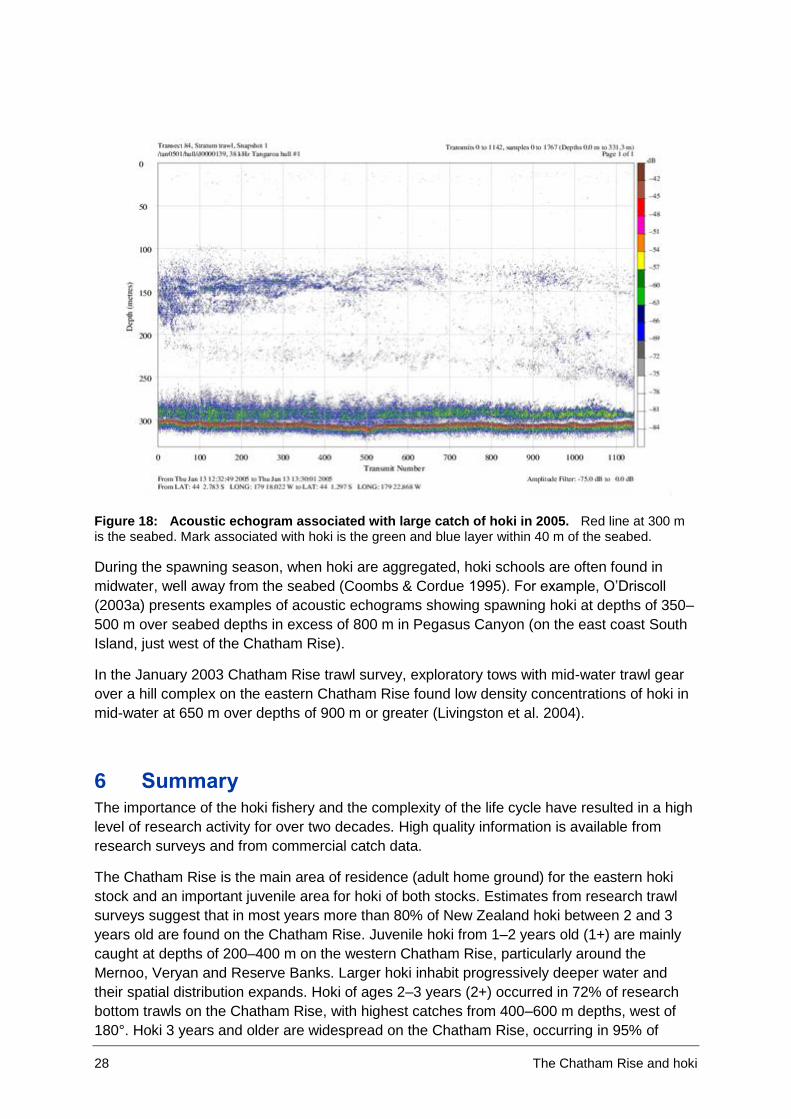
Bull (2000) studied the vertical distribution of juvenile and adult hoki on the Chatham Rise
using acoustic methods. The study was based on scientific echosounder data collected
during the Chatham Rise trawl survey in January 1999. Acoustic data showed that marks
containing hoki were typically close to the seabed and 40–100 m high during the day (e.g.,
Figure 18), and started to rise off the seabed from 1830 h NZST. The analysis of Bull (2000)
was confounded by the difficulty in distinguishing acoustic signal from hoki from that
scattered by other associated species. Subsequent studies by O’Driscoll (2003b) and
O’Driscoll et al. (2009) found that acoustic scattering on the Chatham Rise is dominated by
small mesopelagic fish, which typically occur at 100–400 m depth during the day and migrate
above 200 m depth at night. During the day, these mesopelagic fish are mixed with, and
difficult to distinguish from, hoki marks (O’Driscoll 2003b).
Comparison of paired day and night acoustic recordings from the same location indicates
that, on average, 35–50% of the backscatter observed close to the seabed during the day
migrates more than 50 m away from the bottom at night (O’Driscoll et al. 2009). However, the
difficulty in distinguishing hoki marks from mesopelagic fish, and the diverse composition of
demersal species present, means that acoustic data do not provide good information on
vertical distribution of hoki on the Chatham Rise.
28 The Chatham Rise and hoki
Figure 18: Acoustic echogram associated with large catch of hoki in 2005. Red line at 300 m is the seabed. Mark associated with hoki is the green and blue layer within 40 m of the seabed.
During the spawning season, when hoki are aggregated, hoki schools are often found in
midwater, well away from the seabed (Coombs & Cordue 1995). For example, O’Driscoll
(2003a) presents examples of acoustic echograms showing spawning hoki at depths of 350–
500 m over seabed depths in excess of 800 m in Pegasus Canyon (on the east coast South
Island, just west of the Chatham Rise).
In the January 2003 Chatham Rise trawl survey, exploratory tows with mid-water trawl gear
over a hill complex on the eastern Chatham Rise found low density concentrations of hoki in
mid-water at 650 m over depths of 900 m or greater (Livingston et al. 2004).
6 Summary The importance of the hoki fishery and the complexity of the life cycle have resulted in a high
level of research activity for over two decades. High quality information is available from
research surveys and from commercial catch data.
The Chatham Rise is the main area of residence (adult home ground) for the eastern hoki
stock and an important juvenile area for hoki of both stocks. Estimates from research trawl
surveys suggest that in most years more than 80% of New Zealand hoki between 2 and 3
years old are found on the Chatham Rise. Juvenile hoki from 1–2 years old (1+) are mainly
caught at depths of 200–400 m on the western Chatham Rise, particularly around the
Mernoo, Veryan and Reserve Banks. Larger hoki inhabit progressively deeper water and
their spatial distribution expands. Hoki of ages 2–3 years (2+) occurred in 72% of research
bottom trawls on the Chatham Rise, with highest catches from 400–600 m depths, west of
180°. Hoki 3 years and older are widespread on the Chatham Rise, occurring in 95% of
The Chatham Rise and hoki 29
research trawls. Mean catch rates of 1+ hoki from trawl survey tows within the CRP mining
and prospecting permit and licence areas were lower than those from the whole Chatham
Rise, while mean catch rates of 2+ and 3++ hoki were similar.
Catches from commercial fisheries show a similar spatial pattern. Hoki have been caught
over the whole Chatham Rise, except for from shallow areas on the crest of the Rise and
around the Chatham Islands. Highest hoki catches have been taken from the western end of
the Chatham Rise, from the northern slope west of 180°, and from the southern slope. Hoki
catches on the Chatham Rise peaked at about 75,000 t in 1997–98 and 1998–99, and have
been between 36,000 t and 38,000 t over the past 7 years. Most hoki caught on the Chatham
Rise fishery are relatively young fish, less than 8 years old, and in many years, more than
half of the catch (by number) is made up of hoki aged 3 years and younger.
Spawning (ripe and running ripe) female hoki are caught on the western Chatham Rise, but
are seldom reported from other parts of the Rise. The main New Zealand hoki spawning
areas are off the west coast South Island, in Cook Strait, off the east coast South Island, and
on the Puysegur Bank in Southland. Juveniles of less than one year old (age 0+) occur close
to the coasts of the North and South Islands, and in midwater. Most juvenile hoki are thought
to move to the Chatham Rise by the time they are 2 years old.
Little information exists on the vertical distribution of hoki on the Chatham Rise. Acoustic
data suggest that marks containing hoki are typically close to the seabed during the day, but
move away from the seabed at night.
7 Acknowledgements Thanks to Neil Bagley and Dan MacGibbon for summarising trawl survey data and to Suze
Baird for Figure 2. Research trawl and commercial catch and observer data were used with
permission from Ministry for Primary Industries.
The Chatham Rise and hoki 30
8 References Anderson, O.F.; Bagley, N.W.; Hurst, R.J.; Francis, M.P.; Clark, M.R.; McMillan, P.J.
(1998). Atlas of New Zealand fish and squid distributions from research bottom
trawls. NIWA Technical Report 42. 303 p.
Ballara, S.L.; O’Driscoll, R.L. (2014). Catches, size, and age structure of the 2011–
12 hoki fishery, and a summary of input data used for the 2013 stock
assessment. New Zealand Fisheries Assessment Report 2014/05. 117 p.
Bull, B. (2000). An acoustic study of the vertical distribution of hoki on the Chatham
Rise. New Zealand Fisheries Assessment Report 2000/5. 59 p.
Bull, B.; Livingston, M.E.; Hurst, R.; Bagley, N. (2001). Upper-slope communities on
the Chatham Rise, New Zealand, 1992–99. New Zealand Journal of Marine and
Freshwater Research 35: 791–815.
Connell, A.M.; Dunn, M.R.; Forman, J. (2010). Diet and dietary variation of New
Zealand hoki Macruronus novaezelandiae. New Zealand Journal of Marine and
Freshwater Research 44: 289–308.
Coombs, R.F.; Cordue, P.L. (1995). Evolution of a stock assessment tool: acoustic
surveys of spawning hoki (Macruronus novaezelandiae) off the west coast of
South Island, New Zealand, 1985–91. New Zealand Journal of Marine and
Freshwater Research 29: 175–194.
Dunn, A.; Livingston, M.E. (2004). Updated catch-per-unit-effort indices and
descriptive analyses for hoki (Macruronus novaezelandiae) fisheries on the west
coast South Island, Cook Strait, Chatham Rise, and Sub-Antarctic, 1990 to 2002.
New Zealand Fisheries Assessment Report 2004/35. 55 p.
Dunn M.; Connell A.; Forman, J.; Griggs, L.; Horn, P.L.; Notman, P.; Pinkerton, M.;
Stevens, D.; Wood, B. (2009). Ecosystem-scale trophic relationships: diet
composition and guild structure of middle-depth fish on the Chatham Rise. Final
Research Report for Ministry of Fisheries Research Project ZBD2004-02
Objectives 1–5. (Unpublished report held by Ministry for Primary Industries,
Wellington.)
Francis M.P.; Hurst R.J.; McArdle B.; Bagley N.W.; Anderson O.F. (2002). New
Zealand demersal fish assemblages. Environmental Biology of Fishes 62: 215-
234.
Francis, R.I.C.C. (2008). Assessment of hoki (Macruronus novaezelandiae) in 2007.
New Zealand Fisheries Assessment Report 2008/4. 109 p.
Francis R.I.C.C.; Neil H.L.; Horn P.L.; Gillanders B.; Marriott P.; Vorster J. (2011). A
pilot study to evaluate the utility of otolith microchemistry for determining natal
fidelity in New Zealand hoki. Final Research Report for Ministry of Fisheries
Research Project HOK2006/05 Objective 1. 24 p. (Unpublished report held by
Ministry for Primary Industries, Wellington.)
The Chatham Rise and hoki 31
Harley, S.J. (2002). Estimation of residence time for hoki on the Cook Strait and
west coast South Island spawning grounds. New Zealand Fisheries Assessment
Report 2002/1. 55 p.
Horn P.L. (2011). Natal fidelity: a literature review in relation to the management of
the New Zealand hoki (Macruronus novaezelandiae) stocks. New Zealand
Fisheries Assessment Report 2011/34. 18 p.
Horn, P.L.; Sullivan, K.J. (1996). Validated ageing methodology using otoliths, and
growth parameters for hoki (Macruronus novaezelandiae) in New Zealand
waters. New Zealand Journal of Marine and Freshwater Research 30: 161–174.
Kerstan, M.; Sahrhage, D. (1980). Biological investigations on fish stocks in the
waters off New Zealand. Mitteilungen aus dem Institut für Seefischerei der
Bundesforschungsanstalt für Fisscherei, Hamburg. No. 29.
Langley, A.D. (1993). Spawning dynamics of hoki in the Hokitika Canyon. New
Zealand Fisheries Technical Report 34. 29 p.
Livingston, M.E. (1990). Spawning hoki (Macruronus novaezelandiae Hector)
concentrations in Cook Strait and off the east coast of the South Island, New
Zealand, August-September 1987. New Zealand Journal of Marine and
Freshwater Research 24: 503–517.
Livingston M.E.; Bull B.; Stevens D.W. (2002a). Migration patterns during the life-
cycle of hoki (Macruronus novaezelandiae): an analysis of trawl survey data in
New Zealand waters 1991-2002. Final Research Report for Ministry of Fisheries
Research Project HOK2000/01 Objective 6. (Unpublished report held by Ministry
for Primary Industries, Wellington.)
Livingston, M.E.; Bull, B.; Stevens, D.W.; Bagley, N.W. (2002b). A review of hoki
and middle depth trawls surveys of the Chatham Rise, January 1992–2001.
NIWA Technical Report No. 113. 146 p.
Livingston, M.E.; Hurst, R.J.; O’Driscoll, R.L.; McKenzie, A.; Ballara, S.L.; Horn, P.L.
(in press). Biology and fisheries of New Zealand hoki (Macruronus
novaezelandiae). Chapter in book on ‘Hakes’, Oxford University Press.
Livingston, M.E.; Schofield, K.A. (1996). Stock discrimination of hoki (Macruronus
novaezelandiae, Merluccidae) in New Zealand waters using morphometrics. New
Zealand Journal of Marine and Freshwater Research 30: 197–208.
Livingston, M.E.; Schofield, K.A.; Sullivan, K.J. (1992). The discrimination of hoki
(Macruronus novaezelandiae) groups in New Zealand using morphometrics and
age-growth parameters. New Zealand Fisheries Assessment Research
Document 92/18. 29 p. (Unpublished report held in NIWA library, Wellington.)
Livingston, M.E.; Stevens, D.W.; O’Driscoll, R.L.; Francis, R.I.C.C. (2004). Trawl
survey of hoki and middle depth species on the Chatham Rise, January 2003
(TAN0301). New Zealand Fisheries Assessment Report 2004/16. 71 p.
32 The Chatham Rise and hoki
McKenzie, A. (2011). Assessment of hoki (Macruronus novaezelandiae) in 2010.
New Zealand Fisheries Assessment Report 2011/06. 44 p.
McKenzie, A. (in press). Assessment of hoki (Macruronus novaezelandiae) in
2013.New Zealand Fisheries Assessment Report 2014/XX.
Ministry for Primary Industries (2013). Fisheries Assessment Plenary, May 2013:
stock assessments and yield estimates. Compiled by the Fisheries Science
Group, Ministry for Primary Industries, Wellington, New Zealand. 1357 p.
Murdoch, R.C.; Chapman, B.E. (1989). Occurrence of hoki (Macruronus
novaezelandiae) eggs and larvae in eastern Cook Strait. New Zealand Journal of
Marine and Freshwater Research 23: 61–67.
O’Driscoll, R.L. (2003a). Acoustic survey of spawning hoki off the east coast South
Island in September 2002. New Zealand Fisheries Assessment Report 2003/28.
26 p.
O’Driscoll, R.L. (2003b). Determining species composition in mixed species marks:
an example from the New Zealand hoki (Macruronus novaezelandiae) fishery.
ICES Journal of Marine Science 60: 609–616.
O’Driscoll, R.L. (2006). Acoustic survey of spawning hoki in Cook Strait during
winter 2005, and revision of hoki acoustic abundance indices for Cook Strait
and the west coast South Island. New Zealand Fisheries Assessment Report
2006/44. 46 p.
O’Driscoll, R.L.; Booth, J.D.; Bagley, N.W.; Anderson, O.F.; Griggs, L.H.; Stevenson,
M.L.; Francis, M.P. (2003). Areas of importance for spawning, pupping or egg-
laying, and juveniles of New Zealand deepwater fish, pelagic fish, and
invertebrates. NIWA Technical Report 119. 377 p.
O’Driscoll, R.L.; Gauthier, S.; Devine, J.A. (2009). Acoustic estimates of
mesopelagic fish: as clear as day and night? ICES Journal of Marine Science 66:
1310–1317.
O’Driscoll, R.L.; MacGibbon, D.; Fu, D.; Lyon, W.; Stevens, D.W. (2011). A review of
hoki and middle depth trawl surveys of the Chatham Rise, January 1992–2010.
New Zealand Fisheries Assessment Report 2011/47. 814 p.
Patchell, G.J.; Allen, M.S.; Dreadon, D.J. (1987). Egg and larval development of the
New Zealand hoki Macruronus novaezelandiae. New Zealand Journal of Marine
and Freshwater Research 21: 301–313.
Smith, P.J.; McVeagh, S.M.; Ede, A. (1996). Genetically isolated stocks of orange
roughy (Hoplostethus atlanticus), but not of hoki (Macruronus novaezelandiae), in
the Tasman Sea and southwest Pacific Ocean around New Zealand. Marine
Biology 125: 783–793.
Smith, P.J.; Patchell, G.; Benson, P.G. (1981). Genetic tags in the New Zealand
hoki Macruronus novaezelandiae. Animal Blood Groups and Biochemical
Genetics 12: 37–45.
The Chatham Rise and hoki 33
Zeldis, J.R. (1993). Applicability of egg surveys for spawning-stock biomass
estimation of snapper, orange roughy, and hoki in New Zealand. Bulletin of
Marine Science 53: 864–890.
Zeldis, J.R.; Murdoch, R.C.; Cordue, P.L.; Page, M.J. (1998). Distribution of hoki
(Macruronus novaezelandiae) eggs, larvae, and adults off Westland, New
Zealand, and the design of an egg production survey to estimate hoki biomass.
Canadian Journal of Fisheries and Aquatic Sciences 55: 1682–1694.