Embed Size (px)
Citation preview
Paper No. 004079An ASAE Meeting Presentation
NITROUS OXIDE EMISSION FROM LAND APPLICATION, COMPOSTING ANDSTORAGE OF MANURE
byN.K. Patni1 T. Kannangaral S. Bittman1
Research Scientist Research Associate Research Scientist
J. Paul2 S. Yu1
Research Scientist Research Assistant
1Pacific Agri-Food Research Centre, 2Transform Compost Systems, PO Box 1000, Agassiz, BC, Canada VOM 1A0 34642 Mierau St., Abbotsford, BC Canada V2S 4W8
Written for presentation at the2000 ASAE Annual International Meeting
Sponsored by ASAE
Midwest Express CenterMilwaukee, Wisconsin
July 9-12, 2000
Abstract:
Emissions of nitrous oxide were determined following three to four annual applicationsof fertilizer, dairy cattle liquid manure and liquid hog manure on grassland; duringcomposting of dairy cattle feedlot manure in turned windrows and in passively aeratedstatic windrows; during vermicomposting of a 1:1 mixture of separated solids from dairycattle and swine manure in bins; and from hog manure slurry stored in concrete tanks.Most emissions occurred during the 3-4 week period immediately following landapplication of manure, assembly of windrows and filling of slurry in storage tanks.Emission rate increased with rate of N application on grassland and during warm weatherconditions. Total annual emissions from grassland ranged from about 0.2 to 4.5 kg N20-Nper ha. Peak emission rates from manured grassland, turned windrows, static windrows,vermicompost bins and stored swine manure slurry were about 600, 180, 270, 2200 and 2ng N20-N m-2 s, respectively.
Keywords: nitrous oxide, greenhouse gas, manure slurry, grassland, composting
The author(s) is solely responsible for the content of this technical presentation. The technical presentationdoes not necessarily reflect the official position of ASAE, and its printing and distribution does not constituteand endorsement of views which may be expressed. Technical presentations are not subject to the formalpeer review process by ASAE editorial committees; therefore, they are not to be presented as refereedpublications. Quotation from this work should state that it is from a presentation made by (name of author)at the (listed) ASAE meeting.
EXAMPLE-From Author's Last Name, Initials. "Title of Presentation." Presented at the Date and Title ofmeeting. Paper No. X. ASAE, 2950 Niles Rd., St. Joseph, MI 49085-9659 USA. For information aboutsecuring permission to reprint or reproduce a technical presentation, please address inquiries to ASAE.
ASAE, 2950 Niles Rd., St. Joseph, MI 49085-9659 USAVoice: 616.429.0300 FAX: 616.429.3852 E-Mail:<[email protected]>
NITROUS OXIDE EMISSION FROM LAND APPLICATION, COMPOSTING ANDSTORAGE OF MANURE
N. K. Patni1, T. Kannangara1, S. Bittman', J. Paul2, S. Yu1
ABSTRACT
Emissions of nitrous oxide were determined: following three to four annual applicationsof fertilizer, dairy cattle liquid manure and liquid hog manure on grassland; duringcomposting of dairy cattle feedlot manure in turned windrows and in passively aeratedstatic windrows; during vermicomposting of a 1:1 mixture of separated solids from dairycattle and swine manure in bins; and from hog manure slurry stored in concrete tanks.Most emissions occurred during the 3-4 week period immediately following landapplication of manure, assembly of windrows and filling of slurry in storage tanks.Emission rate increased with rate of N application on grassland and during warm weatherconditions. Total annual emissions from grassland ranged from about 0.2 to 4.5 kg N20-Nper ha. Peak emission rates from manured grassland, turned windrows, static windrows,vermicompost bins and stored swine manure slurry were about 600, 180, 270, 2200 and2 ng N20-N m-2 s, respectively.
1 Pacific Agri-Food Research Centre, PO. Box 1000, 6947 Highway #7, Agassiz, BCV0M 1A0 Canada
2 Transform Compost Systems, 34642 Mierau Street, Abbotsford, BC V2S 4W8 Canada
INTRODUCTION
Nitrous oxide (N20) is one of the three major agriculture related greenhouse gases (GHGs),carbon dioxide (C02) and methane (CH4) being the other two. Anthropogenic activities areestimated to account for 24% of the global total emissions of N20, and 92% of these comefrom agricultural sources (Duxbury et al., 1993). The Global Warming Potential (GWP) ofN20 in terms of C02 equivalents is 321 compared to 21 for CH4, over a 100-year timehorizon. Although most of the anthropogenic N20 emission is from agricultural activities,the factors which control N20 emissions are poorly understood (Robertson, 1993). ForCanada, it is estimated that agriculture contributes 10% of the total GHG emission, andabout 60% of this total is N20 emission (Janzen et al., 1999). However, of the three mainGHGs, the uncertainty in emission estimates is greatest for N20. The study reported herewas conducted in response to a need to quantify and better understand agriculturalemissions of N20, particularly under the relatively cool humid climatic conditions of southcoastal British Columbia. The objectives of our study were:1. Determine N20 emission rates from:
a) land-applied dairy cattle liquid manure (DCLM) and liquid hog manure (LHM)b) during composting of dairy cattle feedlot manure (DCFM) in turned windrows and
in passively aerated static windrowsc) during vermicomposting of a 1:1 mixture of separated solids from DCLM and LHM
in indoor binsd) LHM stored in partially below grade, open-top concrete manure storage tanks in a
roofed shed.2) Estimate the total N20 emissions from land-applied manure slurry.
STUDY PROCEDURE
The study was conducted at the Pacific Agri-Food Research Centre of Agriculture andAgri-Food Canada in Agassiz, which is located about 100 km east of Vancouver, BritishColumbia. The region is characterized by mild winters and about 1650 mm of averageannual precipitation, about two-thirds of which occurs in the winter. Daily weather data arerecorded at a weather station on site.
Nitrous oxide emission was determined in 1997, 1998 and 1999 in tall fescue (Festucaarundinacea Schreb.) fields to which DCLM was applied. Emissions from tall fescue fieldsreceiving LHM, from windrow composting, vermicomposting and from LHM in concretestorage tanks were determined in 1999, only.
Air sample collection and analysis
The method of air sample collection for N20 determination was common for all systemsstudied. A 10 mL sample of air was collected during a 30 minute period at 0, 15 and 30minutes, using pre-evacuated "vaccutainer" tubes using a two-way needle valve. Sampleswere analysed for N20 concentration using a Varian Gas Chromatograph equipped witha 63 Ni electron capture detector. The emission rate was determined from the slopecalculated from the increase in concentration of N20.
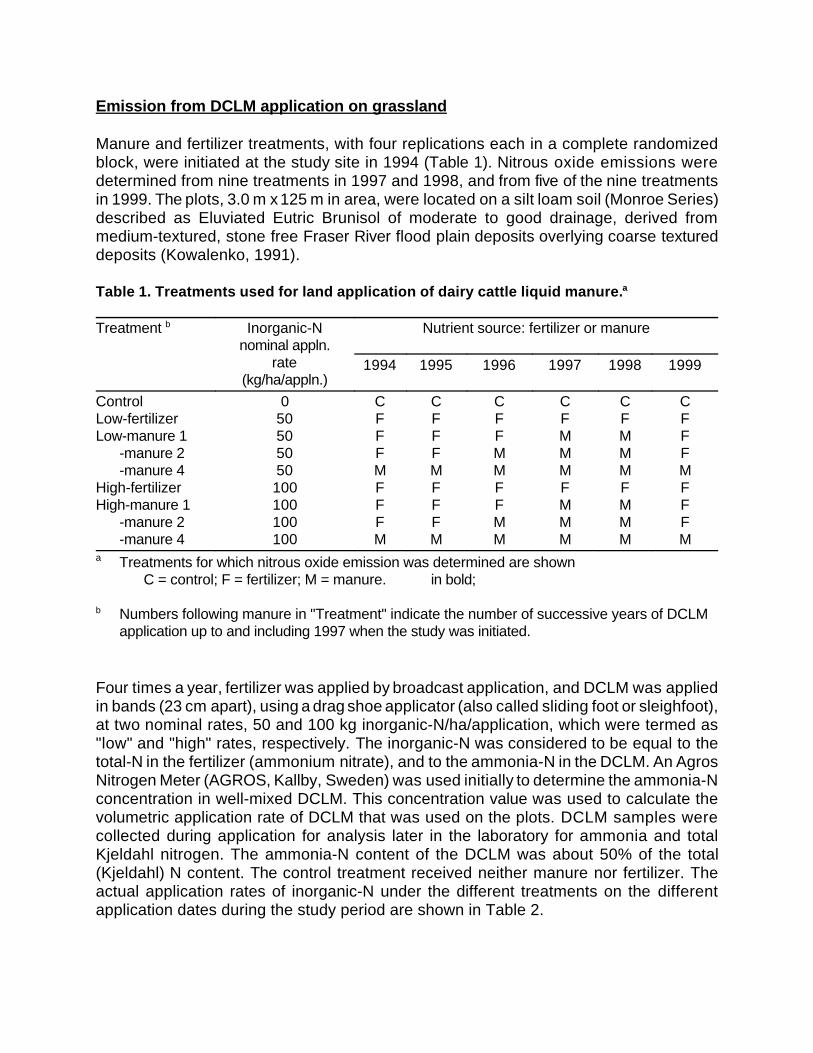
Emission from DCLM application on grassland
Manure and fertilizer treatments, with four replications each in a complete randomizedblock, were initiated at the study site in 1994 (Table 1). Nitrous oxide emissions weredetermined from nine treatments in 1997 and 1998, and from five of the nine treatmentsin 1999. The plots, 3.0 m x 125 m in area, were located on a silt loam soil (Monroe Series)described as Eluviated Eutric Brunisol of moderate to good drainage, derived frommedium-textured, stone free Fraser River flood plain deposits overlying coarse textureddeposits (Kowalenko, 1991).
Table 1. Treatments used for land application of dairy cattle liquid manure.a
Treatment b Inorganic-Nnominal appln.
rate(kg/ha/appln.)
Nutrient source: fertilizer or manure
1994 1995 1996 1997 1998 1999
ControlLow-fertilizerLow-manure 1
-manure 2-manure 4
High-fertilizerHigh-manure 1
-manure 2-manure 4
050505050100100100100
CFFFMFFFM
CFFFMFFFM
CFFMMFFMM
CFMMMFMMM
CFMMMFMMM
CFFFMFFFM
a Treatments for which nitrous oxide emission was determined are shownC = control; F = fertilizer; M = manure. in bold;
b Numbers following manure in "Treatment" indicate the number of successive years of DCLMapplication up to and including 1997 when the study was initiated.
Four times a year, fertilizer was applied by broadcast application, and DCLM was appliedin bands (23 cm apart), using a drag shoe applicator (also called sliding foot or sleighfoot),at two nominal rates, 50 and 100 kg inorganic-N/ha/application, which were termed as"low" and "high" rates, respectively. The inorganic-N was considered to be equal to thetotal-N in the fertilizer (ammonium nitrate), and to the ammonia-N in the DCLM. An AgrosNitrogen Meter (AGROS, Kallby, Sweden) was used initially to determine the ammonia-Nconcentration in well-mixed DCLM. This concentration value was used to calculate thevolumetric application rate of DCLM that was used on the plots. DCLM samples werecollected during application for analysis later in the laboratory for ammonia and totalKjeldahl nitrogen. The ammonia-N content of the DCLM was about 50% of the total(Kjeldahl) N content. The control treatment received neither manure nor fertilizer. Theactual application rates of inorganic-N under the different treatments on the differentapplication dates during the study period are shown in Table 2.

Table 2. Inorganic-N application rates for the dairy cattle liquid manure study.
Year and day ofapplication
Application rate under different treatments (kg inorganic-N ha-1) a
Control Lowfed
Lowmanure
1& 2
Lowmanure
4
Highfed
Highmanure
1& 2
Highmanure
4
1997Mar. 11 0 60 58 59 120 113 115
May 30 0 50 36 36 100 74 74
Jul 14 0 55 50 52 110 106 109
Aug 13 0 52 50 49 104 99 97
Total 0 217 194 196 434 392 395
1998Mar 10 0 50 54 56 100 101 103
May 20 0 50 50 50 100 103 100
Jul 02 0 50 43 43 100 78 75
Aug 24 0 60 34 33 120 65 67
Total 0 210 181 182 420 347 345
1999b
Apr 06 0 60 - 71 120 - 117
May 31 0 58 - 62 116 - 131
Jul 13 0 54 - 54 108 - 109
Sep 07 0 58 - 56 116 - 104
Total 0 230 - 243 460 - 461a Inorganic-N = total-N for fertilizer or NHx-N for manure; NHx-N = (NH3 + NH4
+)-N. See text andTable 1 for explanation of treatments.
b Fertilizer instead of manure was used in 1999 on manure 1 and manure 2 treatments for both lowand high rate plots.
A closed chamber system was used for N20 emission rate determination. On the day afterthe application of treatments, 0.7 m x 0.7 m x 0.15 m deep stainless steel collars wereinserted into each plot. Air-tight vented covers were placed on the collars for 30 minutesand air samples were collected from the chambers at 0, 15 and 30 minutes. In 1997 and1998, air samples were collected twice per week for four weeks, and weekly for theadditional five weeks. It was observed that most emission of N20 occurred only in the initial3-4 weeks after application of manure and fertilizer. In 1999, the sampling frequency wasdecreased to twice per week for the initial three weeks and weekly for an additional fourweeks.
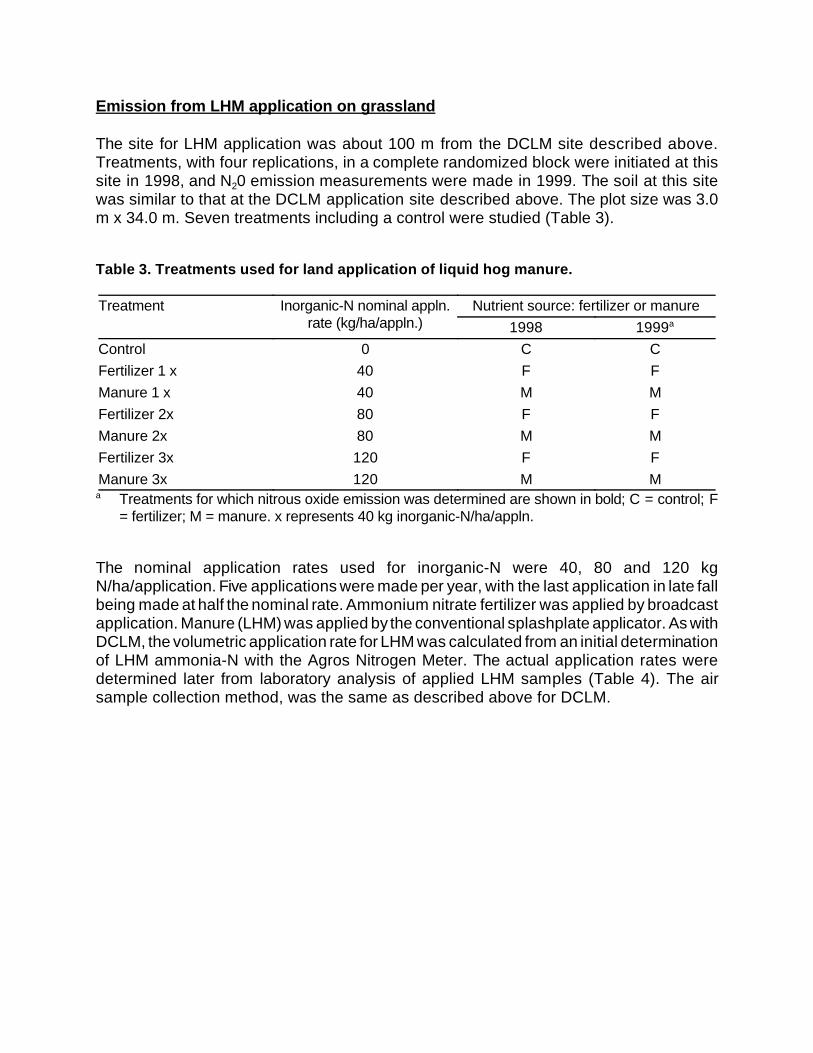
Emission from LHM application on grassland
The site for LHM application was about 100 m from the DCLM site described above.Treatments, with four replications, in a complete randomized block were initiated at thissite in 1998, and N20 emission measurements were made in 1999. The soil at this sitewas similar to that at the DCLM application site described above. The plot size was 3.0m x 34.0 m. Seven treatments including a control were studied (Table 3).
Table 3. Treatments used for land application of liquid hog manure.
Treatment Inorganic-N nominal appln.rate (kg/ha/appln.)
Nutrient source: fertilizer or manure
1998 1999a
Control 0 C C
Fertilizer 1 x 40 F F
Manure 1 x 40 M M
Fertilizer 2x 80 F F
Manure 2x 80 M M
Fertilizer 3x 120 F F
Manure 3x 120 M Ma Treatments for which nitrous oxide emission was determined are shown in bold; C = control; F
= fertilizer; M = manure. x represents 40 kg inorganic-N/ha/appln.
The nominal application rates used for inorganic-N were 40, 80 and 120 kgN/ha/application. Five applications were made per year, with the last application in late fallbeing made at half the nominal rate. Ammonium nitrate fertilizer was applied by broadcastapplication. Manure (LHM) was applied by the conventional splashplate applicator. As withDCLM, the volumetric application rate for LHM was calculated from an initial determinationof LHM ammonia-N with the Agros Nitrogen Meter. The actual application rates weredetermined later from laboratory analysis of applied LHM samples (Table 4). The airsample collection method, was the same as described above for DCLM.

Table 4. Inorganic-N application rate for the liquid hog manure study.
Year andday of
application
Application rate under different treatments (kg inorganic-N ha-1)a
Control FERT1 x MAN1 x FERT2x MAN2x FERT3x MAN3x
1998Feb 24 0 42 3 7 84 75 126 112
May 17 0 40 37 80 75 120 112
Jul 01 0 40 42 80 83 120 125
Aug 19 0 60 38 120 68 180 103
Oct 27 0 27 21 54 42 81 64
Total 0 209 175 418 343 627 516
1999Mar 31 0 50 40 100 80 150 119
Jun 02 0 50 40 100 81 150 121
Jul 15 0 40 42 80 84 120 125
Sep 04 0 43 40 86 80 129 120
Oct 28 0 21 26 42 53 63 79
Total 0 204 188 408 378 612 564a Inorganic-N = total-N for fertilizer or NHx-N for manure; NHx-N = (NH3 + NH4
+)-N. See text andTable 3 for explanation of treatments.
Emission from compost windrows and vermicompostinq bins
Four 9.1 m long, 2.7 m wide (at base) and 1.2 m high trapezoidal-shaped windrows wereset up in a roofed shed using dairy cattle feedlot manure which had an initial moisturecontent of 75 %. Two windrows were laid on open-ended perforated pipes (3.0 m long, 10cm diameter), at right angles to the windrow length, for passive aeration of the staticcompost biomass. A 5 cm thick layer of wood shavings was used for insulation at thebase and on the surface of the static windrows. Aeration of the other two windrows wasby turning once a week using a Sittler turner which has a rotary drum with flails. Thewindrows were assembled on October 14, 1999, and N20 emission was monitored on 20days during the following three months, approximately every three days for the initial sixweeks and weekly thereafter. Four replicate air samples, two from each long side of thewindrows, were collected at 0, 15 and 30 minutes from 16 cm diameter, 7 cm high, ventedPVC pipe caps placed on the surface of the composting biomass. The samples werecollected in vaccutainer tubes as described earlier.
The vermicomposting system consisted of a 9 m x 4 m x 0.76 m deep wooden bin filledwith a 1:1 mixture of separated solids from DCLM and LHM. Earthworms, Eisenia fetidawere used for vermicomposting. Air samples from the surface of the vermicompost were
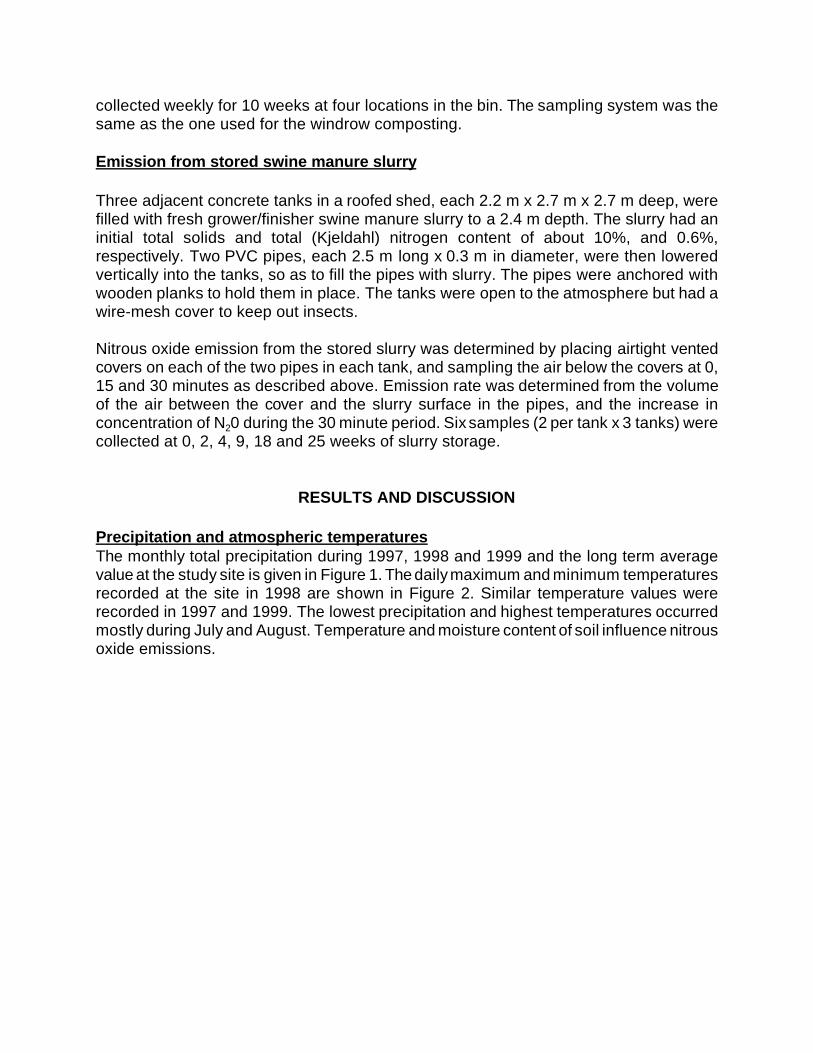
collected weekly for 10 weeks at four locations in the bin. The sampling system was thesame as the one used for the windrow composting.
Emission from stored swine manure slurry
Three adjacent concrete tanks in a roofed shed, each 2.2 m x 2.7 m x 2.7 m deep, werefilled with fresh grower/finisher swine manure slurry to a 2.4 m depth. The slurry had aninitial total solids and total (Kjeldahl) nitrogen content of about 10%, and 0.6%,respectively. Two PVC pipes, each 2.5 m long x 0.3 m in diameter, were then loweredvertically into the tanks, so as to fill the pipes with slurry. The pipes were anchored withwooden planks to hold them in place. The tanks were open to the atmosphere but had awire-mesh cover to keep out insects.
Nitrous oxide emission from the stored slurry was determined by placing airtight ventedcovers on each of the two pipes in each tank, and sampling the air below the covers at 0,15 and 30 minutes as described above. Emission rate was determined from the volumeof the air between the cover and the slurry surface in the pipes, and the increase inconcentration of N20 during the 30 minute period. Six samples (2 per tank x 3 tanks) werecollected at 0, 2, 4, 9, 18 and 25 weeks of slurry storage.
RESULTS AND DISCUSSION
Precipitation and atmospheric temperaturesThe monthly total precipitation during 1997, 1998 and 1999 and the long term averagevalue at the study site is given in Figure 1. The daily maximum and minimum temperaturesrecorded at the site in 1998 are shown in Figure 2. Similar temperature values wererecorded in 1997 and 1999. The lowest precipitation and highest temperatures occurredmostly during July and August. Temperature and moisture content of soil influence nitrousoxide emissions.
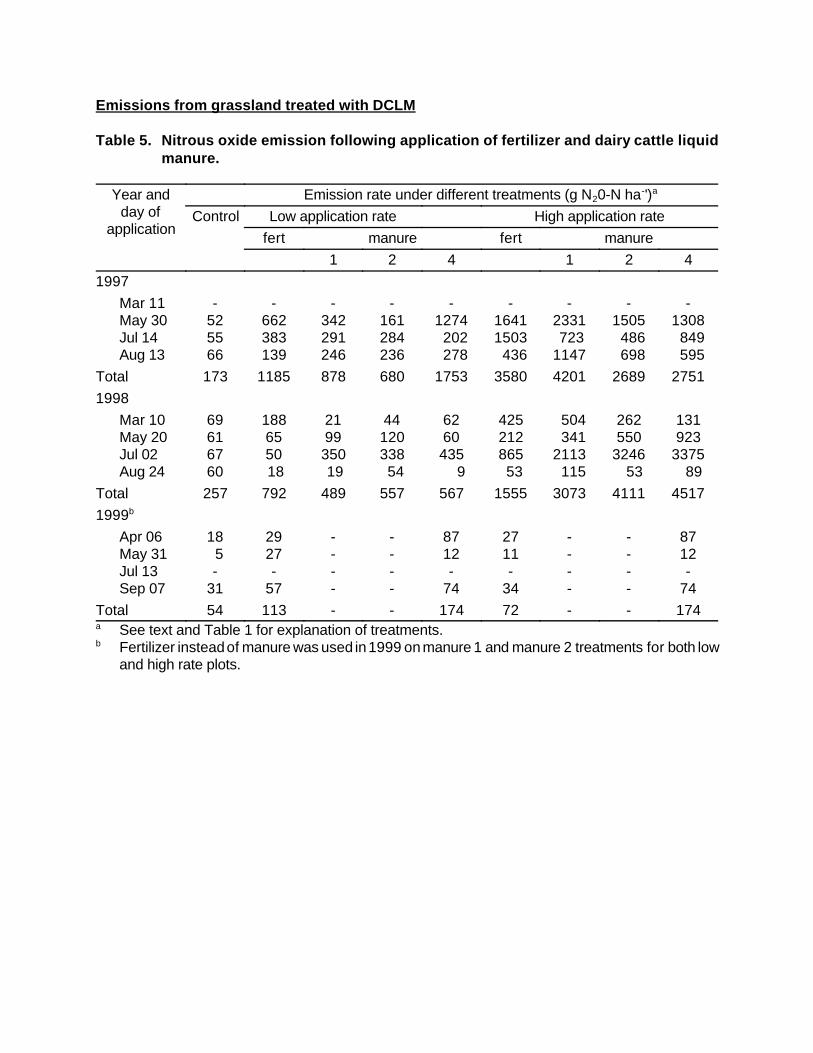
Emissions from grassland treated with DCLM
Table 5. Nitrous oxide emission following application of fertilizer and dairy cattle liquidmanure.
Year andday of
application
Emission rate under different treatments (g N20-N ha-')a
Control Low application rate High application rate
fert manure fert manure
1 2 4 1 2 4
1997
Mar 11May 30Jul 14Aug 13
-525566
-662383139
-342291246
-161284236
-1274 202 278
-16411503 436
-2331 7231147
-1505 486 698
-1308 849 595
Total 173 1185 878 680 1753 3580 4201 2689 2751
1998
Mar 10May 20Jul 02Aug 24
69616760
1886550 18
2199350 19
44120338 54
6260435 9
425212865 53
504 3412113 115
262550
3246 53
131923
3375 89
Total 257 792 489 557 567 1555 3073 4111 4517
1999b
Apr 06May 31Jul 13Sep 07
18 5-
31
2927-
57
----
----
8712-
74
2711-
34
----
----
8712-
74
Total 54 113 - - 174 72 - - 174a See text and Table 1 for explanation of treatments.b Fertilizer instead of manure was used in 1999 on manure 1 and manure 2 treatments for both low
and high rate plots.
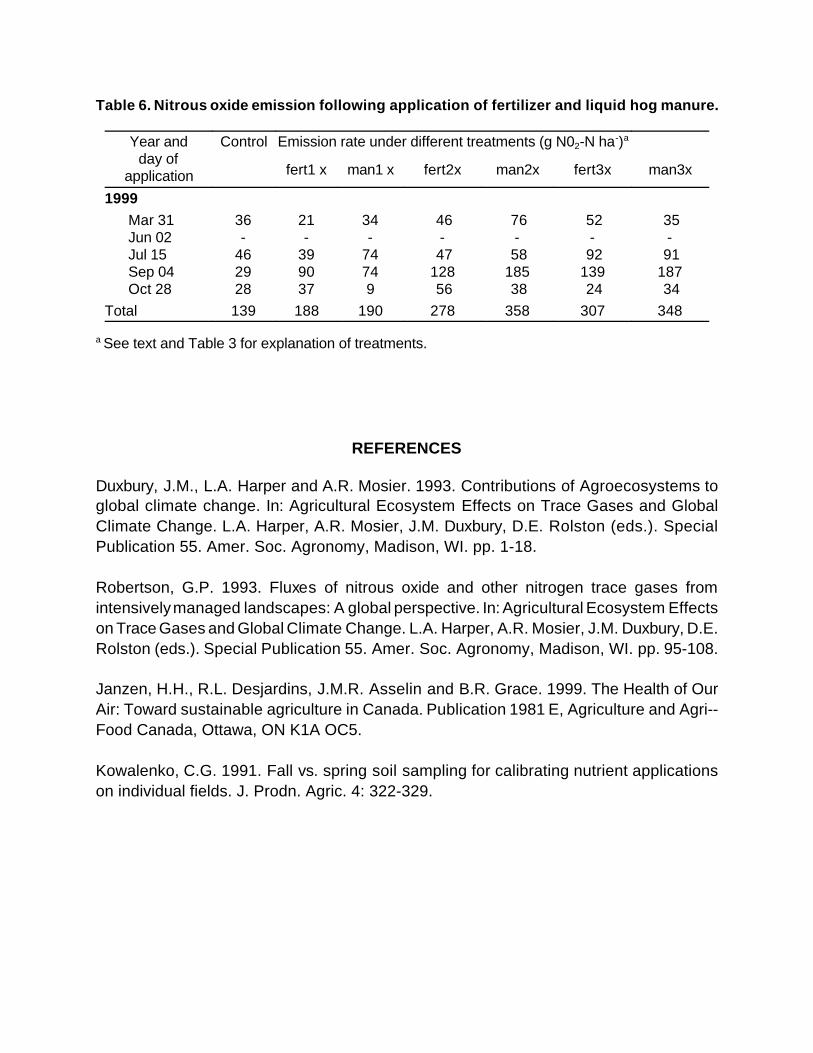
Table 6. Nitrous oxide emission following application of fertilizer and liquid hog manure.
Year andday of
application
Control Emission rate under different treatments (g N02-N ha-)a
fert1 x man1 x fert2x man2x fert3x man3x
1999Mar 31Jun 02Jul 15Sep 04Oct 28
36-
462928
21-
399037
34-
74749
46-
47128 56
76-
58185 38
52-
92139 24
35-
91187 34
Total 139 188 190 278 358 307 348
a See text and Table 3 for explanation of treatments.
REFERENCES
Duxbury, J.M., L.A. Harper and A.R. Mosier. 1993. Contributions of Agroecosystems toglobal climate change. In: Agricultural Ecosystem Effects on Trace Gases and GlobalClimate Change. L.A. Harper, A.R. Mosier, J.M. Duxbury, D.E. Rolston (eds.). SpecialPublication 55. Amer. Soc. Agronomy, Madison, WI. pp. 1-18.
Robertson, G.P. 1993. Fluxes of nitrous oxide and other nitrogen trace gases fromintensively managed landscapes: A global perspective. In: Agricultural Ecosystem Effectson Trace Gases and Global Climate Change. L.A. Harper, A.R. Mosier, J.M. Duxbury, D.E.Rolston (eds.). Special Publication 55. Amer. Soc. Agronomy, Madison, WI. pp. 95-108.
Janzen, H.H., R.L. Desjardins, J.M.R. Asselin and B.R. Grace. 1999. The Health of OurAir: Toward sustainable agriculture in Canada. Publication 1981 E, Agriculture and Agri--Food Canada, Ottawa, ON K1A OC5.
Kowalenko, C.G. 1991. Fall vs. spring soil sampling for calibrating nutrient applicationson individual fields. J. Prodn. Agric. 4: 322-329.
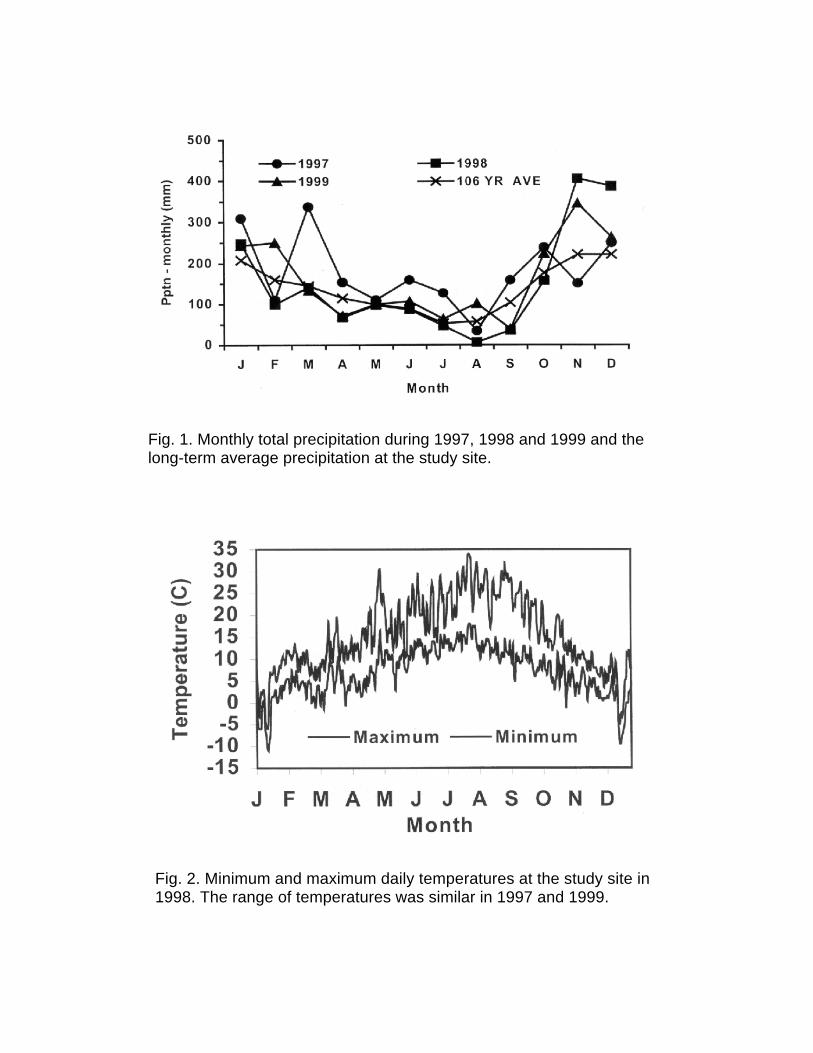
Fig. 1. Monthly total precipitation during 1997, 1998 and 1999 and thelong-term average precipitation at the study site.
Fig. 2. Minimum and maximum daily temperatures at the study site in1998. The range of temperatures was similar in 1997 and 1999.
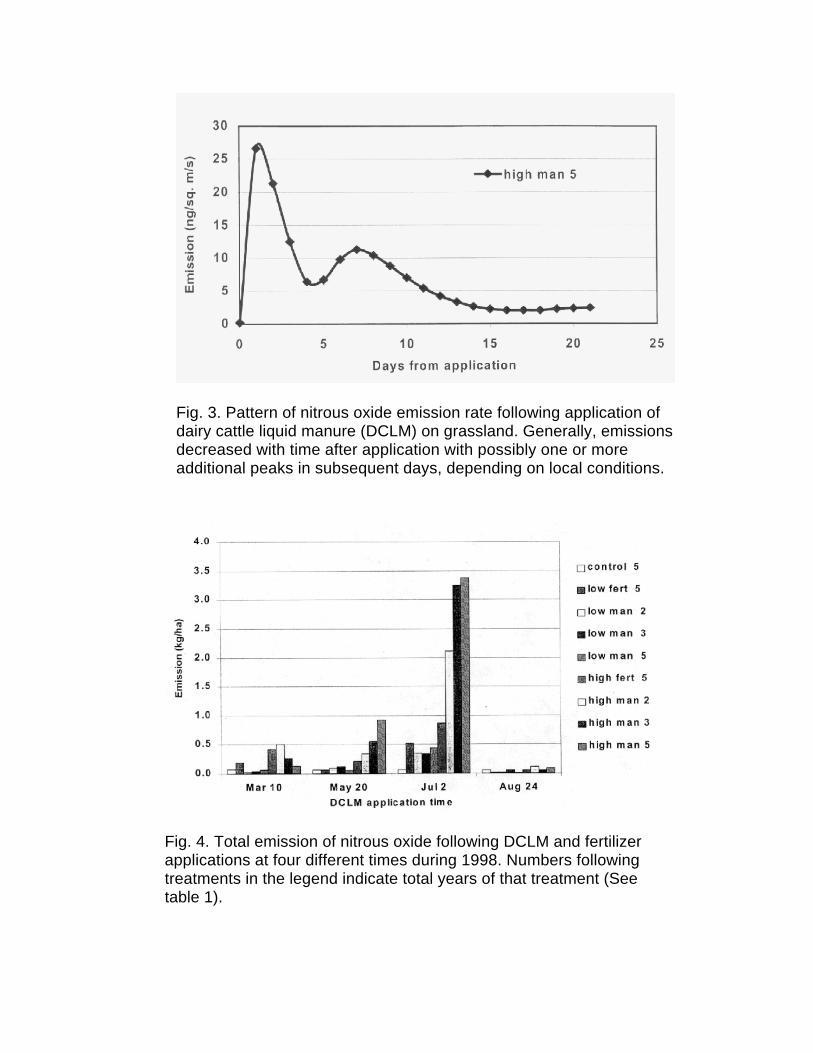
Fig. 3. Pattern of nitrous oxide emission rate following application ofdairy cattle liquid manure (DCLM) on grassland. Generally, emissionsdecreased with time after application with possibly one or moreadditional peaks in subsequent days, depending on local conditions.
Fig. 4. Total emission of nitrous oxide following DCLM and fertilizerapplications at four different times during 1998. Numbers followingtreatments in the legend indicate total years of that treatment (Seetable 1).
Fig. 5. Average of 1997 and 1998 emission of nitrous oxide under differenttreatments following July application of DCLM and fertilizer.
Fig. 6. Total annual emission of nitrous oxide under different treatmentsfollowing DCLM and fertilizer application in 1998.
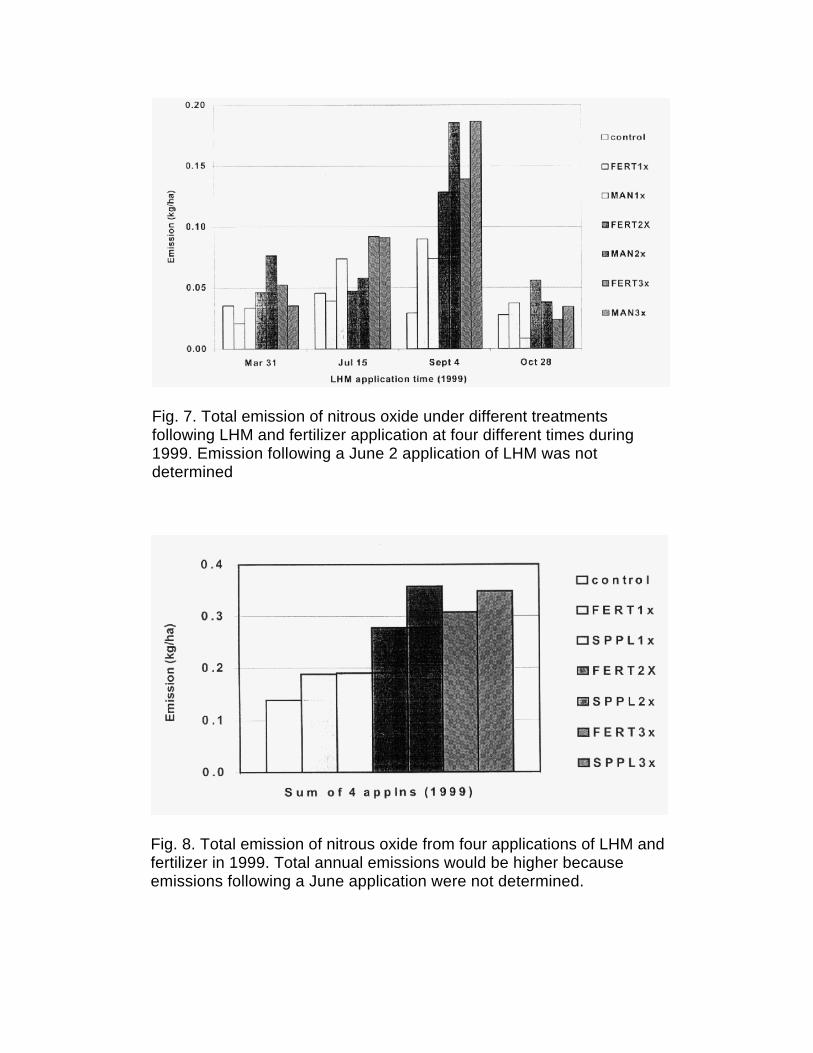
Fig. 7. Total emission of nitrous oxide under different treatmentsfollowing LHM and fertilizer application at four different times during1999. Emission following a June 2 application of LHM was notdetermined
Fig. 8. Total emission of nitrous oxide from four applications of LHM andfertilizer in 1999. Total annual emissions would be higher becauseemissions following a June application were not determined.
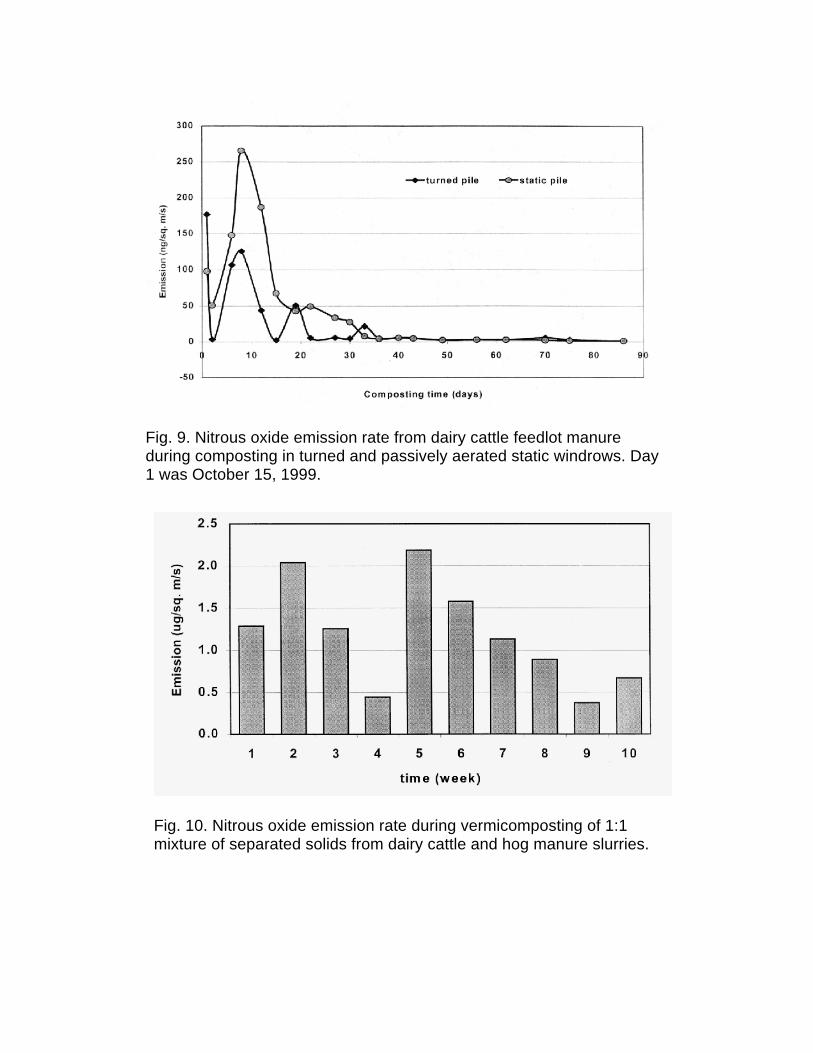
Fig. 9. Nitrous oxide emission rate from dairy cattle feedlot manureduring composting in turned and passively aerated static windrows. Day1 was October 15, 1999.
Fig. 10. Nitrous oxide emission rate during vermicomposting of 1:1mixture of separated solids from dairy cattle and hog manure slurries.
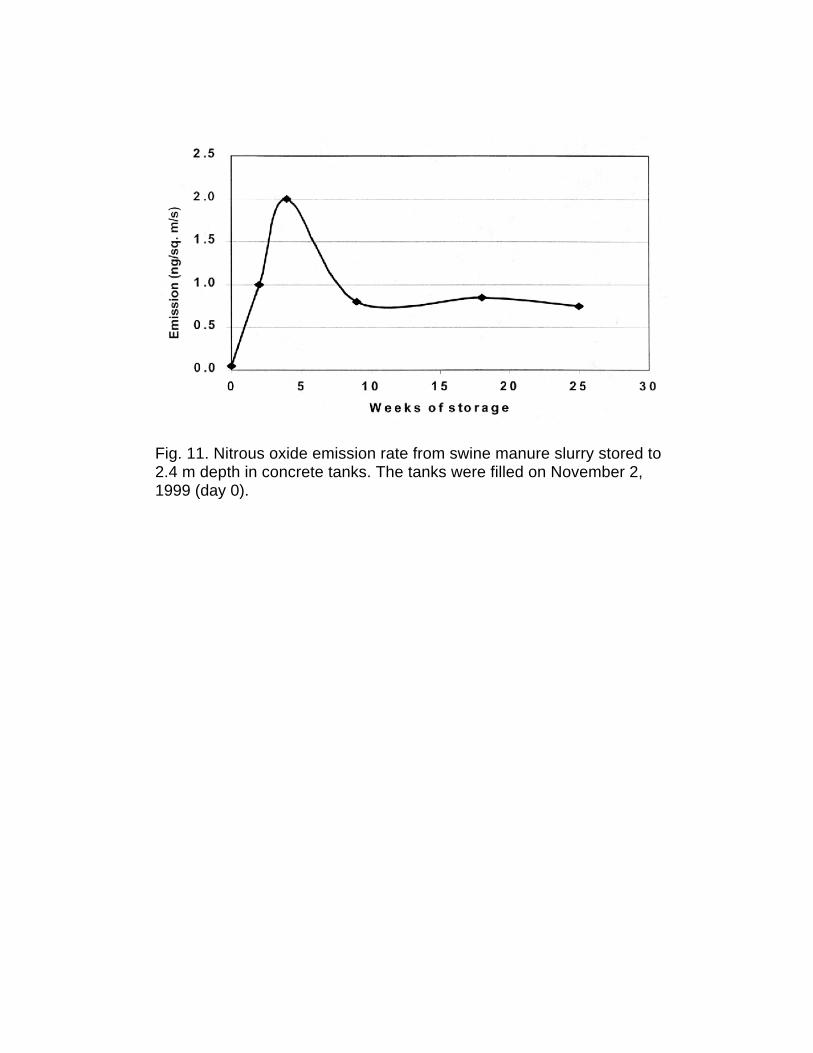
Fig. 11. Nitrous oxide emission rate from swine manure slurry stored to2.4 m depth in concrete tanks. The tanks were filled on November 2,1999 (day 0).