Embed Size (px)
Citation preview

Nitrogen for winter wheat– management guidelines
Autumn 2009

THE
NMANAGEMENT
CYCLE
2 Nitrogen for winter wheat – management guidelines
Contents
Management of nitrogen (N) gets everharder. Regulations have become morestringent while fertiliser and wheat pricesbecome more volatile. Growers mustknow how to maximise profit from N,but minimise environmental impact ineach field.
While England, Wales, Scotland andNorthern Ireland each has its ownregulations, they are sufficiently similarfor these guidelines to cover the UK.
Errors in N management, unlike those inpest and disease control, remain largelyunseen. Over- or under-fertilised crops looksimilar unless errors are extreme. Errorscan often accumulate year-on-year,particularly on heavy soils. Hence good Nmanagement requires year round attention.
These guidelinesWhile other documents deal with allnutrients for all crops, these HGCAguidelines provide more detail on N – themost important nutrient – on the mostextensive UK crop, wheat. The aim is togive UK wheat growers comprehensiveguidance on using N, whether asfertiliser or organic manure.
After outlining how wheat responds toN and factors affecting N managementwith the underlying uncertainties, theseguidelines follow the annual decision-making cycle for autumn-sown wheatcrops. The approach to decision-makingfollows that used in The FertiliserManual, due to be published shortly.
Further explanation and guidance isgiven. In particular, the guidelines explainexplicitly how crop demand for N,mineralisation and atmospheric depositionof N affect recommendations. The valueof regular checks on the N status of soils,crops and grain is also highlighted.
A worked example calculating Crop Nrequirement is given in Table 12. A blanktemplate is available on the HGCA website.
Many factors interact to influence cropresponses to applied N, especially soilconditions and nutrient availability. Theseguidelines assume that all manageableconstraints on N responsiveness,eg acidity, soil compaction, and lowpotassium, phosphorus or sulphur,have been identified and remedied.
For further resources on N management,including fertiliser recommendations andNitrate Vulnerable Zone booklets foreach country, see page 17.
IntroductionPage
Introduction 2
Nitrogen management 3
How wheat responds to nitrogen 4
Judge Crop N Demand 6
Target markets and plan cropping for new seasonReview recent N managementJudge expected Crop N DemandBalance grain and fertiliser prices
Assess N supply 8
Estimate expected SNS for each fieldPlan any SMN measurementsAssess crop conditionPredict SNS from soil analysisMake final SNS predictions
Calculate N requirement 11
Estimate fertiliser N recoveryEstimate Crop N RequirementCheck against average UK recommendations
Assess and apply manure N 12Assess manure N availability and plan manure useCheck storage capacity and structuresApply organic manures – autumnApply organic manures – spring
Select and apply fertiliser N 14
Determine preferred fertiliser type(s)Schedule fertiliser applicationsApply manufactured fertilisers with careMake early N fertiliser applicationsMake main N applicationsConsider extra late N to boost grain protein forbreadmaking
Monitor outcome 16
Review the success of N managementafter harvest
Resources for N management 17
Calculating excess rainfall 18
Further information 19
W
V
U
T
S
R
Q
P
O
N
M
L
K
J
I
H
G
F
E
D
C
B
A�

�
�
Leaching:
losses to riversand ground water
Nitrogen for winter wheat – management guidelines 3
Nitrogen management
Meeting Crop N RequirementThe aim of N management is torespond effectively to the key issuesthat affect a crop’s requirement forapplied N – the Crop N Requirement.
This is the Crop N Demand lessthe Soil N Supply, adjusted for theinefficiencies of applied materials,whether manufactured fertilisersor organic manures.
Thus the crop’s requirement for appliedN (Crop N Requirement) exceeds theshortfall between Crop N Demand andSoil N Supply.
Theuncertainty ofNmanagementResearch shows that N managementof wheat in the UK is both uncertainand often imprecise.
Many factors affect N management,eg soils, varieties, rotations, weather.Often, the processes affected andtheir interactions cannot be assessedeasily or predicted accurately.
There is general consensus thatthe key determinants of Crop NRequirement in the UK are Soil NSupply and Crop N Demand. Thisapproach is taken in the new FertiliserManual and in these guidelines.However, other approaches to Nmanagement could produce similarresults.
Small, seasonal errors in N usehave little effect on profit or pollution,but larger errors – or those repeatedeach year – can compromise farmperformance. Hence, it is important tomonitor and correct significant errors.
Atmosphericdeposition:
dry deposition asammonia ontoleaves and soil;
deposition in rain
Mineralisation:from soil organic matter,available as ammonium
and nitrate for plant growth
Immobilisation:into soil organic matter,
unavailable for plantgrowth
��
�
�
Gaseouslosses
of ammoniaand nitrousoxide
�
�
FERTILISERS
MANURES
CROPNDEMANDNingrain, straw,chaff and stubble
SOILNSUPPLY
�
CROPNREQUIREMENT
(appliedN)
�
Expectedyield
�
Intendedgrain protein
CropNRequirement =CropNDemand –SoilNSupply
FertiliserN recovery
�
�

4 Nitrogen for winter wheat – management guidelines
Grain yieldN fertiliser costs more than anyother input but, where soil N suppliesare small, yield responses are large.Profitable wheat production dependson assessing the optimum Nrequirement based on likely cropperformance and intended market.
Most wheat crops respond similarlyto all sources of N (as shown),provided other nutrients are sufficientand lodging, serious weeds anddiseases are controlled.
N supply (kg/ha)-100 0-200 +100 +200
Grain yield(t/ha)
10
5
(t/h
a@15
%m
ois
ture
)
Grain yield (t/ha)
100kg/ha more than optimumN may gain 0.2-0.3t/ha extra grain, but the cost of extra N equates to an extra 0.5t/ha of grain
Margin over N cost expressedas equivalent yield, (t/ha)
100kg/ha less than optimumN reduces yield by about 1t/ha (10%)
200kg/ha less than optimum Napproximately halves grain yield
OptimumN
Targetzone
fromsoil10
5
0
Howwheat responds tonitrogen
N errorsUnder-fertilising causes lostprofit due to unrealised yield.Over-fertilising causes lost profitdue to excess use of N.
Recent trials on 50 fieldscompared the N requirementpre-sowing, (based on FertiliserRecommendations, 7th Edition ofRB209 and soil analysis) againstthe ‘optimum’ N identified post-harvest. This showed that thepredicted N requirements werewithin 50kg/ha of the optimumon just 25 fields.
The main cause was incorrectSoil Nitrogen Supply (SNS)estimation. Economic losses weresmall where N requirementswere within 50kg/ha of theoptimum. Larger errors weremuch more serious. Under-fertilising (or inadequate Nsupply) and over-fertilisingcaused similar losses.
OptimumN
0
£20/ha
£40/ha
£60/ha
£80/ha-200 -100 0 +100 +200
Under supplyof N
Over supplyof N
Lost profitLow yield
Lost profitExcess use of N
Little economic loss
Net
loss
fro
mo
pti
mu
mp
rofit
*
Difference in N supply from optimum (kg/ha)
Targetzone
*based on wheat = £100/t; ammonium nitrate = £173/t
The ‘grain yield’ graph and thoseon the opposite page representgeneralised responses.

Nitrogen for winter wheat – management guidelines 5
Grain protein% dry matter
9%
Grain protein(%)
OptimumN
Targetzone
N supply (kg/ha)
-100 0-200 +100 +200
fromsoil
8%
Grain protein is particularly helpful in indicating whether crops arereceiving optimal N management.As the optimum N supply changes(due to prices), or as applied Ndiffers from the optimum, grainprotein changes – by about 1% for every 50kg/ha N.
11%
12%
10%
GrainproteinGrain protein with optimum N foryield in feed varieties is consistentlyabout 11% (1.9%N).
Breadmaking varieties optimise foryield at around 12% protein and oftenneed extra N to achieve a marketspecification of over 13%.
Low grain protein – less than 10% forfeed varieties – indicates sub-optimalN use.
Low grain protein indicates highstarch content, hence potentially highbioethanol yield per tonne.
N uptakekg/ha200
OptimumN
Targetzone
N supply (kg/ha)
-100 0-200 +100 +200
fromsoil
50
Crop N(kg/ha)
Soil N SupplyThe total N amount taken up by anunfertilised crop constitutes its 'Soil N Supply'. This varies with previous croppingand fertiliser use, mineralisation of soil organic matter and atmospheric deposition.
Crop N DemandCrop N content optimisedaccording to prices of grainand fertliser N.
Crop N RequirementThe amount of applied N neededto meet the shortfall betweenCrop N Demand and Soil N Supply.
CropNDemandNdemand can bemet fromsoil N,organicmanures andmanufacturedfertilisers.
OptimumN from fertiliser and organicmanures depends on:
– CropNDemand (adjusted forfertiliser and grain prices)
– available soil N
– efficiency of chosen fertilisersandmanures.
All of the above amounts can bepredicted, but not precisely.

6 Nitrogen for winter wheat – management guidelines
Judge expected Crop N Demand
CropNDemand relates to expectedgrain yield andN content, usuallyexpressed as protein%.
CropNDemand is a ‘strategicjudgement’. Adjustments should bemade gradually over seasons usingevidence from farmexperience. Table2 gives general guidance on yield levelsandCropNDemands, in keepingwithThe Fertiliser Manual.
Field-by-field adjustment of CropNDemandestimates is not appropriateas grain yields cannot be predictedprecisely. Errors in settingCropNDemandwill not restrict individual cropyields. For example, a potential yield of12t/hawill still be achievedwhereNuse anticipated only 10t/ha; themaineffectwill be reduced protein%.Hence, grain protein of previous cropsis themost useful indicator ofwhethertomodify local judgements of CropNDemand.
C
Target markets and plan cropping for new season
Intended markets and rotations affect N management. Wheat responds well toN so often performs best after crops that leave high soil N, eg oilseeds andpulses. Wheat grown after cereals tends to have higher protein contents thanafter break crops; so breadmaking varieties may be best sown after a cereal.
Breadmaking varieties – nabimGroups 1&2 normally require additional N abovetheoptimumforyield toachieve the13%proteinnormally specified forbreadmaking.
Evaluating potential returnsThe extra cost of N to achieve a breadmaking specification must be justifiedaccording to likely yield as well as grain price (including premium) and fertiliserprice (expressed as N:grain ratio) (Tables 1 and 3). These premiums assumea factor of 2 to compensate roughly for normal rejections and deductions.
A
Judge Crop N Demand
N:grain price ratio
Grain yield (t/ha) 3 5 10
6 £16.80/t £19.40/t £31.00/t
8 £12.40/t £14.40/t £23.00/t
10 £9.80/t £11.40/t £18.20/t
12 £8.20/t £9.40/t £15.00/t
Table 1. Averagepremiumrequired to justify growingbreadmakingwheat
63% 35% 55%
73%
40%
Specificweight
(over 76kg/hl)
Hagberg
Protein(over 13%)
Average2000–08
48%
(over 250)
27%
Assessing likelihood of rejectionsand premium deductionsThe likelihood of achieving a fullpremium can be assessed from pastfarm achievements.
National average success in achievinga given set of quality specifications canbe estimated using the HGCA QualityCalculator – http://data.hgca.com/calculator/default.asp
This calculator takes account of year,region, variety group, and marketquality parameters and presentsresults as shown in Figure 1.
The numbers indicate averagesuccess in achieving key qualityparameters: protein, specific weightand Hagberg; as well as combinationsof each for a given situation.
Varieties for other marketsFeed markets rarely require a particular grain specification so aim to fertilisefeed wheats with amounts of N that optimise grain yield.
Growers targeting distilling markets may need to use sub-optimal N for grainyield, and earlier applications to enhance alcohol yields. Net greenhouse gas(GHG) balance may also be best with sub-optimal N. When biofuel productionis linked to GHG savings, using sub-optimal N may become more worthwhile.
Review recent N management
Records from recent crops areessential for planning futureNmanagement. Table 16 lists factors tomonitor. Note that grain protein contentis a better indicator than grain yield ofwhetherN supplies of recent cropsmatchedCropNRequirements.NB. grainN%=grain protein%÷5.7,both on a dry basis.
Where grain protein from recent cropsof feed varieties exceeds 12%or is lessthan 10%,N supplieswere probablyexcessive or inadequate, respectively.FutureN supplies should be adjustedaccordingly.
Grain protein of breadmaking varietiesis less useful asN is applied late atlevels above optimal N.Where grainyield, for a feed variety, is below10t/haand grain protein exceeds 11%,another factormay have limited yield.
Consider the effects of other factors,eg lowsoil P or K Indices on cropperformance. Pale stunted growth,over-lush crop canopies, lodging,or highweed populationsmay indicateNuse has been imprecise.
B
Each year is different. The overall success rate for all three parameters from2000-2008 was 27%; in 2003 it was high at 52% but in 2008 just 6%.
Figure 1.HGCAQualityCalculator results

Nitrogen for winter wheat – management guidelines 7
Rotations andvarietiesWhen fertiliser is used at theeconomic optimum, protein contentis relatively consistent within varietytypes, and rotational positions.
In judging Crop N Demand, grain yielddifferences after cereals and breakcrops can be discounted. After breakcrops lower protein %, with optimumN use, compensates for increasedgrain yields.
With optimum N use breadmakingvarieties have greater protein % thanfeed varieties. While yields are slightlyless, Crop N Demand is 15-20kg/hagreater than for feed varieties (Table 2).
Fertiliser product price (£/t)�N content (% x10; or kg/t)Budgeted grain price (£/t)
Ammonium nitrate (AN) 34.5% £138 £207 £276 £345 £414 £483
Calcium ammoniumnitrate (CAN) 27.0% £108 £162 £216 £270 £324 £378
Urea 46.0% £184 £276 £368 £460 £552 £644
Urea ammoniumnitrate (UAN) (liquid) 28.0% £112 £168 £224 £280 £336 £392
Cost of fertiliser N (£/kg N) £0.40 £0.60 £0.80 £1.00 £1.20 £1.40
N:grain price ratio
Wheat price £60/t 7 10 13 17 20 23
£120/t 3 5 7 8 10 12
£180/t 2 3 4 6 7 8
£240/t 2 3 3 4 5 6
Table 3. Look-up forN:grain price ratio or break-even ratio (BER)
Product* Ncontent Cost of fertiliserN
w/w (£/tonne product)
x1000
Table 2. CropNDemand canbeestimated according to soil type andvariety
Soil type Guideline yield Guideline Crop N Demand
(grain and straw)t/ha kg/tonne kg/ha
nabim group 1 & 2Light sandy 7.9 25 200Other 9.6 25 245
nabim group 3 & 4Light sandy 8.1 23 185Other 9.8 23 225
*Fertiliser product comparisons do NOT take account of any differences in fertiliser recovery(see Step Q).
Balance grain and fertiliser prices
Optimum crop N contents dependon fertiliser and grain prices (Table 3).The N:grain price ratio (sometimescalled the ‘break-even ratio’) can becalculated using the formula beneathTable 3.
Despite volatile grain and fertiliserprices, adjusting for price ratiochanges between 3 and 8 (dark cellsin Table 3) has little effect on returns(under £3/ha). Adjust Crop N Demandif price changes are outside thisrange as indicated in Table 4.
Throughout this publication aN:grain price ratio of 5 is assumed.
D
Table 4. How to respond to theN:grain price ratios
N:grain price ratio 1 2 3 4 5 6 7 8 9 10 15 20 25
Adjustment to Crop 35 25 15 5 0 -5 -10 -15 -20 -25 -45 -60 -70N Demand (kg/ha)
Adjustment to 60 40 25 10 0 -10 -20 -30 -35 -45 -75 -100 -115fertiliser N (kg/ha)
adjustment not worthwhile
Break-even ratio (N:grain ratio) =

8 Nitrogen for winter wheat – management guidelines
3-5 year leys, high N, grazed
Retention of N residue over winter
Previous crop
High N vegetables1
3-5 year leys, low N, 1 or more cuts
1-2 year leys, high N, grazed
3-5 year leys, low N, grazed
3-5 year leys, high N, 1 cut then grazed
Bare land
Medium N vegetables2
Potatoes
Oilseed rape
Beans, peas or lupins
Grazed fodder
All leys with 2 or more cutsannually receiving little N
1-2 year leys, Low N
1-2 year leys, 1 or more cuts
Uncropped land with green cover
Wheat or feed barley
Malting barley, oats or triticale
Fodder or forage (cut)
Low N vegetables3
Sugar beet
1 High N vegetableseg calabrese, Brussels sprouts andsome cauliflower crops with lotsof crop debris returned to the soil.
2 Medium N vegetableseg lettuce, leeks and longseason brassicas such asDutch white cabbage.
3 Low N vegetableseg carrots, onions, radish,swedes or turnips.
100% 20%
Deep
clays
Deep
silty
soils
Med
ium
soils
Shallow
soils
not over
sandst
one
Shallow
soils
over
sandst
one
Sandy lo
ams
Sands
40%
10%80%
100% Dry (under 150mm)
Moderate (150 – 250mm)
Wet (over 250mm)
Excess rainfallover winter
80%
60%
40%
60%
40%
20%
Nre
sid
ue
fro
mp
revi
ou
scr
op
High SNS likely– worth checking with SMN analysis
Medium SNS likely– use SMN analysis on a few barometer fields
>200kg/ha
50kg/ha
Low SNS likely– SMN analysis seldom worthwhile
Estimate expected SNS for each fieldE
The Fertiliser Manual and SACTechnical Note TN625 both define aSoil N Supply Index in terms of kg/haN available to crops from soil (Table 5).This includes an estimate of Nreleased from soil organic matter bymineralisation during summer, butexcludes a small amount of N fromatmospheric deposition during cropgrowth – 20-30kg/ha.
Initial crude SNS estimation (asabove) indicates whether a field-specific SNS prediction from samplingsoil is likely to be worthwhile.
Table 5. SNSprediction from look-up tables
SNS Index FM 0 1 2 3 4 5 6
SAC 1 2 3 4 5 6 6
SNS range (kg/ha N) under 60 61-80 81-100 101-120 121-160 161-240 over 241
Approx.SNS (kg/ha N) 50 70 90 110 140 200 260
FM = The Fertiliser ManualSAC = SAC Technical Note TN625
A crude Soil Nitrogen Supply (SNS)prediction can be made using thediagram below or other look-up tables inThe Fertiliser Manual or SAC TechnicalNote TN625 taking account of previouscrop, soil type and overwinter rainfall.
Assess Soil N Supply

Nitrogen for winter wheat – management guidelines 9
Plan any SMN measurements
Soil N Supply may always be considered low on fields that have growncombinable crops for decades without organic manures. Occasional soilanalysis can confirm this. More frequent soil mineral N (SMN) analysis couldaid N management on many other farms, especially mixed enterprises. A setof fields should be analysed so that results are:
– representative of the cropped area
– available for any fields with large or uncertain SNS.
Give priority for sampling fields: with known high soil organic matter (but notpeats); previously in grass; or receiving significant organic manure. Includefields where effects, eg lodging or unexpectedly high grain protein, haveoccurred. Consider annual soil sampling of particular ‘indicator’ fields to assessyear-on-year SNS variation.
When to sampleSchedule sampling before any N applications or at least six weeks afterapplying any organic manure. Allow time for analysis and interpretation beforeapplications. The best time to sample depends on soil type and averageexcess winter rainfall.
Leaching over winter is usually balanced by mineralisation so SNS changeslittle between winter and spring. Where samples are taken in autumn onshallow soils and the following winter is wet (over 200mm excess rainfall),results may need adjusting for leaching (see Step I and page 18).
Sample with appropriate equipment or employ a sampling contractor.
Sampling depth varies with season:
– Until January, sample to 60cm
– From February on, sample to 90cm.
Sample in layers, typically 0-30cm, 30-60cm and 60-90cm.Sample at least 15 points in each field, 20 or more in variable fields.Bulk soil from each layer but keep layers separate.
Keep samples cool and ensure analysis within 48 hours for nitrate andammonium N. Arrange topsoil analysis for total N (%) or organic matter (%),if not already known.
F
Table 6.Best periods for samplingSoil type Average excess overwinter rainfall
Low to moderate High(<200mm) (>200mm)
Light sandy soils Jan to Feb Jan to Feb
Shallow soils Nov to Feb Jan to Feb
Medium soils Nov to Dec Jan to Feb
Deep clayey and silty soils Nov to Dec Dec to Feb
Peat soils1 Not worthwhile Not worthwhile
1 Large seasonal effects mask variations in spring SMN on peats.
Assess crop condition
For good N management it isimportant to record sowing dates andmonitor crop condition at regularintervals. Note plants/m2, growthstage and tillering stage. Estimateshoot numbers by multiplyingplants/m2 by the average number ofshoots per plant. N estimates mayalso be adjusted using crop colour.
G
Table 7. Estimate crop N fromshoot numbers and GAI
Shoots/m2 GAI Crop N
500 0.5 15kg/ha
1,000 1.0 30kg/ha
1,500 1.5 45kg/ha

10 Nitrogen for winter wheat – management guidelines
Predict SNS from soil analysisH
All soil samples are analysed for soil mineral N (SMN), which is reported asnitrate and ammonium N. Some laboratories also provide direct estimates ofmineralisable N – the available N that will be released during summer.Mineralisable N can also be estimated from soil organic N (which changesslowly so only needs to be analysed every 4-5 years).
Calculate expected Soil N Supplies from laboratory N results for soil mineral N,soil organic N and crop N.
1 In an average mineral soil, 1mg mineral N/kg dry soil in 30cm depth equates to 4kg/ha available N.Where impermeable rock or stones exceed 5% of soil volume, an adjustment is required.
2Where 60-90cm depth has not been analysed, assume half the 30-60cm depth.
Increase soil N supplies to allow for mineralisation, according to Table 9.
Table 9. Estimate additionalmineralisableNonorganic soilsTopsoil Topsoil Additional SNSorganic total N England Scotlandmatter & Wales & N Ireland
<6% under 0.35% Insignificant Insignificant
6-10% 0.35 to 0.6% + 40kg/ha N Insignificant
11-15% 0.6 to 0.9% + 100kg/ha N + 20kg/ha N
16-20% 1.0 to 1.2% + 150kg/ha N + 60kg/ha N
>20% over 1.2% +>150kg/ha N +>100kg/ha N
Finally, calculate total SNS.
Make final SNS predictions
Gains and losses in available soil Noccur over winter due to mineralisationand leaching. Total Soil N Supplies,in autumn and spring on mediumor more retentive soils with excessoverwinter rainfall below 200mm,are generally similar. Thus, suchestimates do not require adjustmentfor overwinter losses. However, whereexcess winter rainfall is over 200mm,an adjustment maybe required.
Deep sandy soils should be sampledfor SMN analysis from January toFebruary, after most leaching hasoccurred and before any manureor fertiliser N is applied.
On shallow soils (less than 90cm)halve the SMN in SNS estimatesfrom autumn sampling if subsequentexcess rainfall is over 200mm.
Excess rainfall can be estimated fromlocal rainfall data using the methodgiven on page 18, or from nationalmaps published each spring.
I
Additional N is likely to be released by mineralisation during the season whereorganic matter content of topsoil exceeds:
– 5% in England and Wales;– 10% in Scotland and Northern Ireland.
Thus, the organic matter content of all topsoils (even if not formally definedas ‘organic’, ‘humose’ or ‘peaty’) should be known especially where organicmanures have been applied.
While these estimates of mineralisable N are not quoted in The Fertiliser Manual or SAC TechnicalNote 625, they are derived from these N recommendations.
Improving SNS estimation
SNS estimation is better thanlook-up tables, but still lacksprecision. Therefore HGCA isfunding research – project 3425(see page 19) – to improvemethods for soil sampling, soilanalysis and SNS interpretation.
Table 8. Calculate SMN – exampleSample Laboratory results Total Conversion1 SMNdepth NO3-N NH4-N SMN
0-30cm 8.5mg/kg 1.5mg/kg 10.0mg/kg x 4 40kg/ha30-60cm 4.0mg/kg 1.0mg/kg 5.0mg/kg x 4 20kg/ha60-90cm2 2.02mg/kg 0.52mg/kg 2.5mg/kg x 4 10kg/ha
TOTAL 70kg/ha
Table 10. Add cropN,SMNandmineralisableN togive total SNS
N source (example) SNS
Crop N (from Table 7) 700 shoots/m2 20kg/haSMN (Table 8) 70kg/haMineralisable N (Table 9) If <5% organic matter 0kg/haTotal Soil N Supply (SNS) 90kg/ha

Estimate Crop N Requirement
Field-specific Crop N Requirementcan now be estimated from:
– Crop N Demand
– Soil N Supply
– fertiliser N recovery
as in the worked example (Table 12).
Good records allow a prediction tobe made, recognising the main factorsknown to govern Crop N Requirement.
If the estimated Crop N Requirementis small, apply a minimum of 40kg/haN. Only omit applying N altogether ifthe estimated Crop N Requirement ismarkedly negative (below -40kg/ha).
Nitrogen for winter wheat – management guidelines 11
Estimate fertiliser N recovery
Recovery of fertiliser N is theincrease in crop N content (kg/ha)expressed as a percentage of the Napplied (kg/ha). Recovery of fertiliserN is very variable and cannot beassessed directly on-farm.
N from all fertilisers and crop-availableN from manures are taken to performsimilarly to the N from ammoniumnitrate fertilisers – see Steps M and Q.
Initially, it is best to use averagerecoveries, derived from fieldexperiments:
– 60% on most soils
– 70% on sandy and silty soils
– 55% on shallow soils over chalk.
Over several seasons, local Nrecovery may be deduced indirectlyafter estimating previous N supplies,grain yields and grain N contents.Note that high-yielding crops oftenshow good N recovery, and vice versa.
J
K
L
Based on: The Fertiliser Manual (FM) and SAC Technical Note TN625 (SAC).Note: Recommendations for Scotland here differ slightly from those in SAC Technical Note TN625.
Calculate N requirement
SNS Index (FM) 0 1 2 3 4 5 6
SNS Index (SAC) 1 2 3 4 5
Light sandy soils 160 130 100 70 40 0-40 0-40in England
Shallow soils and 280 240 210 180 140 80 0-40sands in NW UK
Medium soils 250 220 190 160 120 60 0-40
Deep clayey soils 250 220 190 160 120 60 0-40
Deep silty soils 220 190 160 130 100 40 0-40
Organic soils 120 80 40-80 0-40
Peat soils 0-6 0-6
* increase SNS results by 20kg/ha N to allow for N from atmospheric deposition.Such deposition is factored into The Fertiliser Manual and SAC TN625.
Check against average UK recommendations
Note any differences between local field-specific estimates of Crop NRequirements and average UK recommendations (Table 11). The nationalaverages can be explained using the process given in Table 12 so the basis ofany local differences should be revealed by this comparison. As experienceand field records accumulate, local adjustments may be justified and actedupon with increasing confidence.
6
Table 11. Crop N Requirements for average UK conditions (kg/ha)
Table 12. Field-specific worked calculation of Crop N RequirementPrediction Calculation Example
Guideline crop yield a 9.8t/ha
Crop N content b 23kg/t
Price effect on Crop N Demand c -10kg/ha
Crop N demand d = (a x b) + c 215kg/ha
Crop N when soil sampled e 20kg/ha
SMN f 70kg/ha
Mineralisable N g 0kg/ha
Expected Soil N Supply h = e + f + g 90kg/ha
Crop N shortfall j = d – h – 20* 105kg/ha
Fertiliser N recovery k 60%
Crop requirement for applied N l = j x 100/k 175kg/haA version of Table 12 can bedownloaded from the HGCAwebsite www.hgca.com
12 Nitrogen for winter wheat – management guidelines
Where organic manures are available:
– Ensure application equipment iswell maintained, calibrated andsuitable for applying the manure.
– Calculate the crop-availablenutrients (equivalent to fertiliser)and identify fields that willbenefit most – taking account ofaccessibility, likely soil conditionsand application equipment.
– Target crops with a high N demandand fields at low soil P or K Indices.
– Plan application rates for eachfield to ensure compliance withall NVZ regulations. (see NVZbooklets).
– Plan application rates that supplyno more than 50-60% of Crop NRequirement. This restrictsvariations in manure N supply thatmay reduce crop yields and quality.
– Apply manures in late winter andspring to make best use of Ncontent (after closed spreadingperiods specified in NVZs). Modernband spreaders can top-dress slurryaccurately across full tramlinewidths, without crop damage.
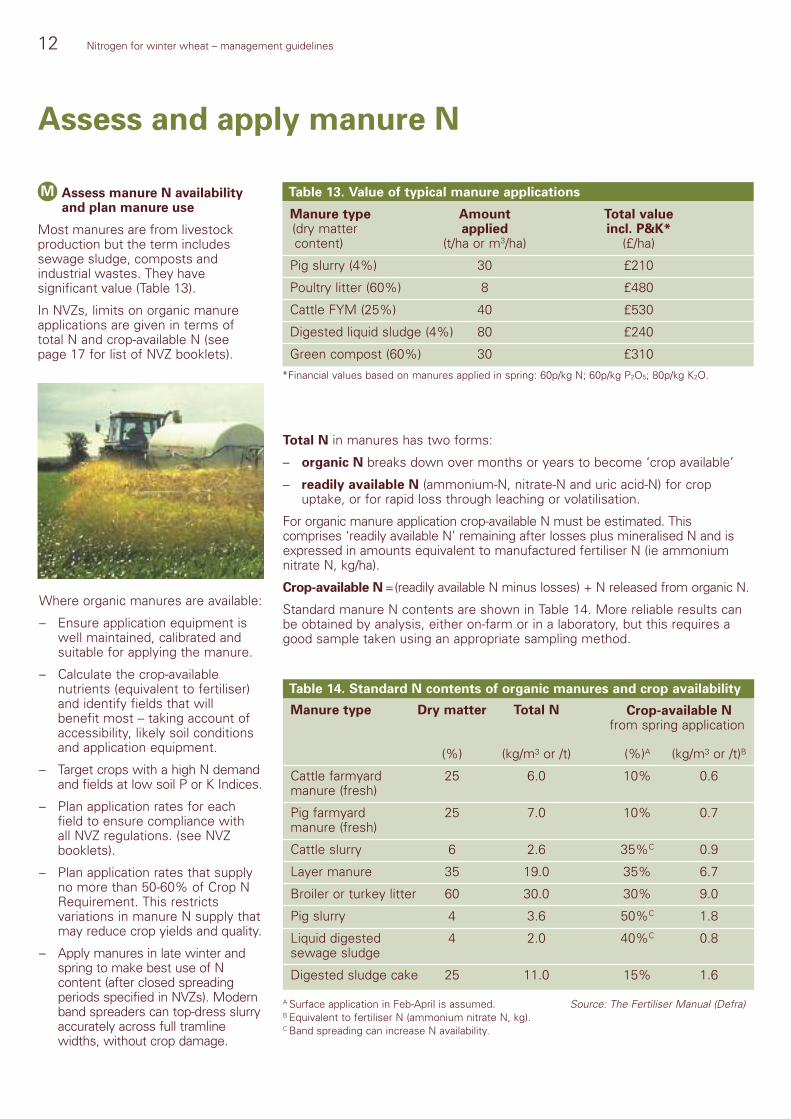
Table 14. Standard N contents of organic manures and crop availability
A Surface application in Feb-April is assumed. Source: The Fertiliser Manual (Defra)B Equivalent to fertiliser N (ammonium nitrate N, kg).C Band spreading can increase N availability.
Manure type Amount Total value(dry matter applied incl. P&K*content) (t/ha or m3/ha) (£/ha)
Pig slurry (4%) 30 £210
Poultry litter (60%) 8 £480
Cattle FYM (25%) 40 £530
Digested liquid sludge (4%) 80 £240
Green compost (60%) 30 £310
*Financial values based on manures applied in spring: 60p/kg N; 60p/kg P2O5; 80p/kg K2O.
Table 13. Value of typical manure applications
Manure type Dry matter Total N
(%) (kg/m3 or /t) (%)A (kg/m3 or /t)B
Cattle farmyard 25 6.0 10% 0.6manure (fresh)
Pig farmyard 25 7.0 10% 0.7manure (fresh)
Cattle slurry 6 2.6 35%C 0.9
Layer manure 35 19.0 35% 6.7
Broiler or turkey litter 60 30.0 30% 9.0
Pig slurry 4 3.6 50%C 1.8
Liquid digested 4 2.0 40%C 0.8sewage sludge
Digested sludge cake 25 11.0 15% 1.6
Total N in manures has two forms:
– organic N breaks down over months or years to become ‘crop available’
– readily available N (ammonium-N, nitrate-N and uric acid-N) for cropuptake, or for rapid loss through leaching or volatilisation.
For organic manure application crop-available N must be estimated. Thiscomprises ‘readily available N’ remaining after losses plus mineralised N and isexpressed in amounts equivalent to manufactured fertiliser N (ie ammoniumnitrate N, kg/ha).
Crop-available N=(readily available N minus losses) + N released from organic N.
Standard manure N contents are shown in Table 14. More reliable results canbe obtained by analysis, either on-farm or in a laboratory, but this requires agood sample taken using an appropriate sampling method.
Assess and apply manure N
Assess manure N availabilityand plan manure use
Most manures are from livestockproduction but the term includessewage sludge, composts andindustrial wastes. They havesignificant value (Table 13).
In NVZs, limits on organic manureapplications are given in terms oftotal N and crop-available N (seepage 17 for list of NVZ booklets).
M
Crop-available Nfrom spring application

Nitrogen for winter wheat – management guidelines 13
Check storage capacityand structures
Ensure storage capacity for organicmanures is adequate for closedperiods. Also ensure structures aresound to prevent risk of accidentalleakage and pollution.
Apply organic manures– autumn
N applications to wheat in autumnor winter are rarely required. Soil Nis almost always sufficient for cropgrowth.
Only organic manures low in readilyavailable N (eg farmyard manures)should be applied to crops in autumnor early winter. This is a requirementin NVZs (see page 17 for list of NVZbooklets).
Any applications before sowingshould be incorporated into the soilwithin 24 hours (unless slurry isinjected or applied by band spreader).
Apply organic manures – spring
Early spring manure applications aremost effective but care is needed:
– Do not apply organic manures,if soil is water-logged, flooded,snow-covered or frozen for over12 of the preceding 24 hours. Thisis an NVZ requirement.
– Do not apply more than 50m3/haof slurry or 8t/ha of poultry manureat any one time in January orFebruary and allow at least threeweeks between applications.
– Do not apply organic manures ifthere is a high risk of run-off, takingaccount of slopes, land drains,ground cover, proximity to surfacewater, weather conditions and soiltype. Again, an NVZ requirementand a sensible precaution toprevent nutrient waste.
– Do not apply organic manureswithin 10m of surface water, orwithin 50m of a borehole, wellor spring.
Usemanure analysis results,Table 14, or decision support systems(egMANNER, PLANET) to calculatecrop-availableN supplied fromeachapplication to each field.
Calculate phosphate, potash, sulphurandmagnesiumapplied using tablesin The Fertiliser Manual orSACTechnical Note TN622.
Deduct crop-availableN supplied bymanures fromCropNRequirement tocalculate the balance needed fromfertiliser N.
N P
O

14 Nitrogen for winter wheat – management guidelines
Select and apply fertiliser N
Determine preferred fertilisertype(s)
Solid ammonium nitrate granules(about 34% N), or ‘AN’, is the mainform of straight N used on UKwheat. Alternative forms of soil-applied fertiliser N are:
– urea, as granules or prills (46% N)
– ‘UAN’: a combined solution ofammonium nitrate and urea (usually37kg N per 100 litres)
– ‘CAN’: calcium ammonium nitrate(27% N)
– compound (NPK) fertilisers
– ammonium sulphate (21% N;60% SO3) provides sulphur aswell as N.
Urea can also be used in solution asa foliar spray. It is supplied at 20kgN per 100 litres and may be dilutedbefore application.
Factors governing fertiliser choicerelate to price, quality (spreadingease and efficiency), and efficiencyof crop recovery. Choice of liquidUAN also has major strategic effectson fertiliser purchase, storage andapplication equipment.
On average 24% of urea-N canbe volatilised as ammonia afterapplication compared to only 5%from ammonium nitrate. Ammonialosses from UAN are intermediate.
Inefficiencies from urea N may bereduced by applying in cool, moistconditions to crops on soil withoutfree lime or chalk and with well-developed canopies.
Where fertiliser is to be appliedas urea or liquid UAN, rather thanammonium nitrate, be aware thatN recovery is often reduced.
Schedule fertiliser applications
Adjust Crop N Requirements in springwhen estimates of Soil N Supply arerevised; or if large changes in fertiliserprice or grain futures occur.
N applications are best timed andtailored to match crop demands.Typically, a wheat crop takes up 30%of final N demand by the start of stemextension and 90% by flowering.However, if early uptake is curtailed,compensating uptake can occur afterflowering.
Manage N supplies for adequatetillering in early spring and then rapiduptake during stem extension.
Spring-applied N is rarely leachedbeyond the reach of roots, except afterhigh rainfall on very light soils.
Spring-applied N normally remains inthe topsoil throughout summer.Availability of fertiliser N is reduced indry topsoils, but N uptake resumesafter light rain.
Apply manufactured fertiliserswith care
Do not apply manufactured N fertiliserwithin 2m (1.5m – N. Ireland) ofsurface water (NVZ requirement)or within 2m of a ditch or the centreof a hedgerow (cross-compliancerequirement) in England and Wales.
Do not apply fertiliser N if there isa high risk of run-off, taking accountof slopes, land drains, ground cover,proximity to surface water, weatherconditions and soil type. Again, anNVZ requirement and a sensibleprecaution to prevent nutrient waste.
S
R
Q

Nitrogen for winter wheat – management guidelines 15
Make early N fertiliserapplications
Crops with total N requirementsexceeding 120kg/ha are likely to need40kg/ha N, or occasionally up to80kg/ha N, in late February or March.Thus most UK wheat crops will benefitfrom early N, but particularly those:
– following a cereal crop,where take-all risk is high
– with large Crop N Requirements
– intended to be processedfor bioethanol.
Shoot numbers or canopydevelopment should guide the needfor early N applications. Both can beassessed visually. Canopy developmentcan also be assessed remotely.
Wheat crops that respond adverselyto early N tend to have:
– moderate, or high, lodging risk,eg are early sown, with lushcanopies and shoot numbers over1,200/m2 by spring
– high Soil N Supplies, eg due torecent organic manure applications.
Sulphur, if needed, should be appliedearly, possibly as part of the early Ndressing, eg as ammonium sulphate.In NVZs, dates and amounts of any Napplications should be recorded foreach field (or each crop in NorthernIreland).
Make main N applications
Apply most of the remaining Nrequirement between early April andearly May, ie just before or duringearly stem extension.
Up to 120kg/ha N can be applied inone application. If remaining Nrequirements exceed 200kg/haconsider up to three applications: twoof 80-100kg/ha N before early May,and a third 40-80kg/ha N later in Mayto reduce lodging risk.
Overall, aim to apply some fertiliserN to the whole wheat area by:
– mid-April in England and Wales
– end-April in Scotland or N. Ireland.
By early May,most of the remaining Nshould be applied. Reduce or omit later‘splits’ if crop canopy becomes verylush, eg a GAI of four in late April or earlyMay. The wheat growth guide, HGCA(2008), gives benchmarks for canopysize at each growth stage (Table 15).
In late May, ie until flag leafemergence (GS39), N applicationsincrease grain protein concentrationsas well as grain yield.
Consider extra late N to boostgrain protein for breadmaking
There is usually a 13% grain proteinspecification for breadmaking –about 1% more than in an optimallyfertilised crop. Assess the need foradditional N based on past success inachieving a specification and availablepremiums (Table 3).
Extra N may be applied in two ways,with different effects:
– At end of May around flag leafemergence as fertiliser granules.
Up to 40kg/ha N will boost grainprotein (by 0.5-0.7%) and slightlyincrease yield (0.1-0.2t/ha).
– In July around milky ripe stage(GS75) as a foliar spray of a ureasolution.
Spraying 40kg/ha urea N generallyincreases protein by 0.75-1.0%.
Grain protein continues to respondto urea sprays up to 120kg/ha N.However, larger amounts areslightly less effective and mayreduce yield. Applying over60kg/ha N is rarely justified.
There is a risk that sprays willscorch upper yield-forming leaves.Scorch risk is reduced by sprayingin still, cool conditions, such asin the evening. Diluting theconcentration of urea doesnot reduce this risk.
Effects of extra N in May and July areadditive; thus applying at both timesmay achieve a large protein boost.In NVZs, check that extra N doesnot cause Nmax to be exceeded.
V
U
T
Table 15. Canopybenchmarks
Growth GreenAreastage Index (GAI)
23 3 tillers 0.7
30 ear at 1cm 1.6
31 first node 2.0
39 flag leaf emerged 6.1
59 ears emerged 6.3
61 flowering 6.3
71 watery ripe 5.7
87 hard dough 1.3

16 Nitrogen for winter wheat – management guidelines
Monitor outcome
Review the success of Nmanagement after harvest
Table 16 provides a checklist to helpminimise N management errors by:
– referring to past crop performanceand records of yields and proteins
– analysing soil, and organicmanures where appropriate
– inspecting crops for signs of poorperformance, eg take-all, weedcompetition or high lodging risk
– correcting decisions and improvingstrategy as new informationbecomes available.
However, N decision-making is alwaysimprecise because:
– Crop N Demand depends on yield,and yield predictions are poor.
– Soil N Supply can only bepredicted within about 50kg/ha,even using SMN analysis.Predictions based on previouscropping are even more uncertain.
– N requirements depend onpredicting crop recovery offertiliser N, which may vary from40% to 80%. (Crop N Demandcorrelates with fertiliser Nrecovery so uncertainties are notcompounded). N requirements mayonly be estimated within 70kg/ha.
– crop-available N from large organicmanure applications can only beestimated within 30kg/ha.
Some discrepancies will cancel out.Nevertheless, applied N will commonlydiffer from optimum N by more than50kg/ha (see page 4). Although errorsin N use cannot be corrected afterharvest, they can be recognised andaccounted for next year.
Crop inspection and post-harvestgrain analysis can pinpoint largediscrepancies. Detecting errors onretentive soils is important, evenif only after harvest. Undetectederrors will carry over to the next cropmaking further errors more likely.
Grain protein (or N) content providesthe best indicator of optimal N
management. Grain sampling – afarmer’s guide, (HGCA 2003) andGrain sampling guidelines (HGCA2009) show how to sample grain.Optimum grain protein contents arearound 11% (1.9% N) for feed wheatsand 12% (2.1% N) for breadmakingwheats. Optimum grain N in barleyis also 1.9% (see box on page 19).However, grain protein of breadmakingwheats (or grain N in malting barleys)is less helpful because these cropsoften receive non-optimal(for the yield) N applications.
Grain analysis ‘standards’ above prove70-80% successful in identifyingcrops that had been over- or under-fertilised with N, so grain analysisresults should be averaged overseveral fields or years beforeconclusions are drawn. Patterns ofresults that are either low or highcompared to optimum levels meanthat N levels were low or highrespectively. This should be factoredinto next season’s plans (see Step A).
W
Table 16. Checklist for an example field
��
��
���
���
��
�Check Result
Did you use more or less N than intended? less same more
How did N use compare with Table 12? less same more
How do grain prices compare to those budgeted? more same less
How did N prices compare to those budgeted? less same more
Colour of crop in late May? pale normal dark
Estimated weed infestation in May? little lots
Crop height and lodging, ignoring overlaps? short none some
Was grain yield more, or less, than expected?+ more same less
Was grain protein of feed varieties? under 10% 11% over 12%
What about other grain analyses? low normal high
Summary position of ticks
Likely difference from optimum N use too little on target too much
�
+Give greater emphasis (two ticks) to grain protein.

Nitrogen for winter wheat – management guidelines 17
Resources for N management
NVZandnitrate regulationsDifferent rules apply in England andWales, Scotland, and NorthernIreland to implement the EC NitratesDirective. On arable farms the mainrequirements are to:
– Keep records field-by-fieldof advice, pre-sowing estimatesof SNS, Crop N Requirements andNmax amounts, sowing dates,dates and amounts of all Napplications (organic manures andfertilisers) and grain yields.
In Scotland, recording advice is notrequired. In N. Ireland records arerequired for the total area of each crop.
– Comply with prescribed limits(Nmax) for manufacturedfertilisers and manures. NOTE
– Only spread N in suitableconditions: Comply with closedspreading periods for both organicmanures and manufacturedN fertilisers. Comply withno-spreading areas. Prepare aspreading risk map, if applyingorganic manures. Do not spreadany N on waterlogged, snow-covered or frozen ground.
Good records of N plans and Nuse, field-by-field and application-by-application, are essential toprovide evidence of compliancewith regulations, includingNmax limits.
Nitrates andNVZguidancedocumentsEnglandNVZ Guidance Leaflets 1-9www.defra.gov.uk/environment/quality/water/waterquality/diffuse/nitrate/help-for-farmers.htm
Northern Irelandwww.dardni.gov.uk/publications_environment-nitrates-guidancedoc
Scotlandwww.scotland.gov.uk/Publications/2008/12/12134339/1
WalesContact the WelshAssembly Governmenthttp:/wales.gov.uk
Other sources ofinformation/guidance
Available from www.defra.gov.ukThe Fertiliser Manual (RB209),8th edition of RB209 (TSO 2009),Defra (NB. Publication expected 2010)
Fertiliser Recommendations forAgricultural and Horticultural Crops,7th edition of RB209, MAFF (2000)(NB. This is the old version)
Managing Livestock Manures –series of four booklets from Defra:
Booklet 1: Making better use oflivestock manures on arable land
Booklet 2: Making better use oflivestockmanures on grassland
Booklet 3: Spreading systemsfor slurries and solid manures
Booklet 4: Managingmanureon organic farms
MANNER-NPK (MANure NitrogenEvaluation Routine)
Food Security Assessment(August 2009) Defra
British Survey for Fertiliser Practice(annual) Defra
Protecting our Water, Soil andAir: A Code of Good AgriculturalPractice for farmers, growers andland managers(annual) Defra
Soil Strategy for England(September 2009) Defra
Low Carbon Transition Plan(July 2009) Defra
Available from www.sac.ac.uk/publications/technicalnotesOptimising the application ofbulky organic manures and slurries,SAC Technical Note TN622
Nitrogen recommendations forcereals, oilseed rape and potatoes,SAC Technical Note TN625
Available from www.ruralni.gov.ukRural NI: Farm Nutrient ManagementCalculators, including: Crop NutrientRecommendation Calculator.
This program will help growers complywith nutrient limit requirements in N.Ireland and draw up a nutrientmanagement plan for their farm.
Available fromwww.nutrientmanagement.org/Tried & Tested NutrientManagement Plan (2009),AIC, CLA, FWAG, LEAF, NFU
Available fromwww.planet4farmers.co.ukPLANETPLANET Version 2 (2008)
The computer-based version ofthe Fertiliser Manual ‘PLANET’enables growers to prepare NutrientManagement Plans according to therecommendations.
PLANET version 3 is currently beingdeveloped. This new version willgenerate nutrient recommendations thatmimic the new Fertiliser Manual. Theserecommendations will apply in England,Wales and possibly Northern Ireland(not Scotland).
PLANET version 3 will also producereports which help show compliancewith NVZ rules, including the livestockmanure N farm limit, organic manuresstorage, planning N use, Nmax andrecord keeping.
PLANET Scotland is also beingdeveloped to generate nutrientrecommendations and reflect the NVZrules and compliance requirementsthat apply.

18 Nitrogen for winter wheat – management guidelines
Average ET Rainfall Excess Cumulative Cumulativerainfall excess SMD
rainfall
After summer -50
Autumn (Sept-Nov) 72 166 44 44 0
Winter (Dec-Feb) 41 197 156 200 -2
Spring (Mar-May) 154 `52 0 200 -2
Summer (Jun-Aug) 184 175 0 200 -11
edcba
Normal excess rainfall amounts
Table 17. An example moisture account (millimetres)
Then regularly calculate themoisture balance:
rainfall in current period
minusSMDafter last period
minusET in current period
Thus, in autumn, this is calculated as:
166 minus 50 minus 72 = 44
– A positive moisture balance indicates drainage and should be added to lastperiod cumulative excess rainfall (d).
– A negative moisture balance indicates a moisture deficit and should beadded to last period SMD (e).
To amend planned N use, in light of excess rainfall, see Step I.
a
e
b
Monitor rainfallWhen rainfall (less any capacity for soil water storage) exceedsevapotranspiration (ET), this ‘excess rainfall’ can lead to N loss throughdrainage. Small variations in leaching should not affect N decisions, butadjustment for large differences may be worthwhile.
If Soil Moisture Deficit (SMD) exceeds half the soil’s Available Water Capacity(AWC), drought is likely to affect crop growth. Estimates of Crop N Demandshould be reduced where drought commonly occurs.
To measure seasonal variation in drainage or drought:
– Assume initial SMD at the end of August is about 50mm, unless you havemore precise information.
– Use an accurate rain gauge or local rainfall data updated regularly.
– Use average evapotranspiration levels for the UK (Table 7, column a).They do not vary much regionally or between seasons.
Calculating excess rainfall

Nitrogen for winter wheat – management guidelines 19
Further information
HGCA publications and details of HGCAfunded projects are all available on theHGCA website – www.hgca.com andthe Crop Oracle CD.
Guides and TopicSheets
Grain sampling – a farmer’s guide,HGCA (2003)G17
Avoiding lodging inwinterwheat,HGCA (2005)G25
Grain samplingguidelines,HGCA (2009)GS92009
Thewheat growthguide,– 2nd edition, HGCA (2008)G40
TopicSheet 64 (2002),Usingmanures and biosolidson cereal crops
Project Report 458 (HGCA, 2009) examines the indicative value of grainanalysis. Both grain protein in feed wheats and grain N in feed barleysproved useful indicators, however not in oilseed rape, breadmaking wheator malting barley. Optimum wheat protein is slightly greater than the 11%quoted in The Fertiliser Manual and used in these guidelines. Key resultsare as follows:
Optimum Error indicated
Winter feed wheat 11.5% protein (2.0%N) 30kg/ha N per 0.5%protein difference
Winter feed barley 1.9% N 25kg/ha N per 0.1%N difference
Spring feed barley 1.9% N 30kg/ha N per 0.1%N difference
This evidence will be used to improve future fertiliser recommendations.At present the greater value for wheat should not be used to justify CropN Requirements above those specified in Step C (Table 2), Step W and inThe Fertiliser Manual.
Project ReportsProject Report 280 (2002).Nitrogen management in secondwheats following strobilurinfungicide programmes
Project Report 303 (2003).Integrating manures, slurries andbiosolids as nutrient sources in arablecrop rotations
Project Report 359 (2005).Managing roots, N and fungicides toimprove yield and quality of wheat
Project Report 400 (2006).Managing nitrogen applications tonew Group 1 and 2 wheat varieties
Project Report 417 (2007).Optimising nitrogen applications forwheat grown for the biofuels market
Project Report 427 (2007).Detecting soil nitrogen supplies bycanopy sensing
Project Report 438 (2008).Optimising fertiliser nitrogen formodern wheat and barley crops
Project Report 458 (2009).Using grain N% as a signaturefor Good N Use
Ongoing projectsProject RD-2007-3425.Establishing best practice forpredicting Soil N Supply
Project RD-2007-3375.Soil and grain nitrogen analysis toprovide up-to-date Scottish data toaid revision of N fertiliser guidelines
Project RD-2005-3211.Predicting grain protein in orderto assure breadmaking quality andminimise diffuse pollution fromwheat production
Project RD-2006-3287. Betterestimation of the efficiencyof use of soil nitrogen

Acknowledgments
This guide, funded by HGCA as a knowledge transferproject, was written by Professor Roger Sylvester-Bradley,ADAS in association with a steering group comprising:Dr Peter Dampney and Dr Daniel Kindred, ADAS; Dr IanRichards, ECOPT; Dr Alex Sinclair, SAC; Dr Ethel White,AFBINI; Professor Keith Goulding and Professor AndyWhitmore, Rothamsted Research; and Huw Phillips,Scottish Agronomy.
HGCA is grateful to many people who have commented ondraft versions of this guide including: Professor Brian Chambers,James Clarke and Ken Smith, ADAS; Peter Taylor,AICC; Steve Cook, Crop Advisors; Dewi Jones, Defra;Jamie Letts, Environment Agency; Bob Mills, FrontierAgriculture; Allison Grundy, GrowHow; Dr Susannah Bolton,Dr James Holmes and Dr Clare Kelly, HGCA; David Langton,Masstock; Guy Gagen, NFU; Chris Dawson, PDA; MartinJohnston, Rural Payments and Inspections Directorate;Dr Steve Hoad, SAC; Neil Henderson, SGRPID; StuartKnight, TAG; and Andrew Cragg and Julian Hasler, farmers.
Edited by Dr Clive Edwards, HGCA and Geoff Dodgson,Chamberlain.
Design by Chamberlain.
Photographs courtesy of SULKY, GrowHow UK and ADAS.
HGCA Stoneleigh ParkWarwickshire, CV8 2TL
www.hgca.comT0247 [email protected]
HGCA is a division of the Agriculture and Horticulture Development Board (AHDB).© Agriculture and Horticulture Development Board 2009.All rights reserved.
400052
DisclaimerHGCAseeks to ensure that the informationcontainedwithin this document is accurate at thetimeof printing.However, subject to theoperationoflawHGCAaccepts no liability for loss, damageorinjury howsoever causedor suffereddirectly orindirectly in relation to information andopinionscontained inor omitted from this document.
HGCA Guide 48 (G48)


![Finale 2005a - [Untitled1]h).pdf · 2014-02-18 · 4 4 4 4 4 4 4 4 4 4 4 4 4 4 4 4 4 4 4 4 4 4 4 4 4 4 4 4 4 4 4 4 4 4 4 4 4 4 4 4 4 4 4 4 4 4 4 4 4 4 Picc. Flutes Oboe Bassoon Bb](https://img.pdfslide.us/doc/110x75/5b737b707f8b9a95348e2e6f/finale-2005a-untitled1-hpdf-2014-02-18-4-4-4-4-4-4-4-4-4-4-4-4-4-4.jpg)


![Oh Pretty Woman4sc].pdfã ### ### ### ### ### ### ### ### 4 4 4 4 4 4 4 4 4 4 4 4 4 4 4 4 4 4 4 2 4 2 4 2 4 2 4 2 4 2 4 2 4 2 4 2 4 4 4 4 4 4 4 4 4 4 4 4 4 4 4 4](https://img.pdfslide.us/doc/110x75/60cfb349cd0cbb00d32b6774/oh-pretty-woman-4scpdf-4-4-4-4-4-4-4-4-4-4.jpg)


![Welcome [s3.eu-central-1.amazonaws.com]...bb bb bb bb bb # # # # # b b bb bb bb bb bb bb bb bb 4 4 4 4 4 4 4 4 4 4 4 4 4 4 4 4 4 4 4 4 4 4 4 4 4 4 4 4 4 4 4 4 4 4 4 4 4 4 4 4 44 4](https://img.pdfslide.us/doc/110x75/5e9f761d9d1aa23b1a09f03e/welcome-s3eu-central-1-bb-bb-bb-bb-bb-b-b-bb-bb-bb-bb-bb-bb-bb.jpg)