Embed Size (px)
Citation preview

Module 3Transparency 1
Long Island Sound Nitrogen Removal Training Program
Module 3Optimization of Activated Sludge
Performance for Nitrogen Removal
• Case Studies• Overall Plant Evaluation Procedure• Operating and Troubleshooting
Biological Nitrogen Removal Facilities

Module 3Transparency 2
Long Island Sound Nitrogen Removal Training ProgramModule 3
Overall Plant Evaluation Procedure

Module 3Transparency 3
Optimization of Plant Performance for Nitrogen Removal
Goals and Objectives:1. Increase MCRT to provide conditions necessary for
the growth of biological microorganisms responsible for nitrogen removal.
2. Avoid potential adverse impacts on plant effluent quality which may result from changes in sludge settling characteristics.
3. Assess impacts of nitrogen removal on plant capacity for future growth.
Module 3Transparency 4
Optimization of Plant Performance for Nitrogen Removal
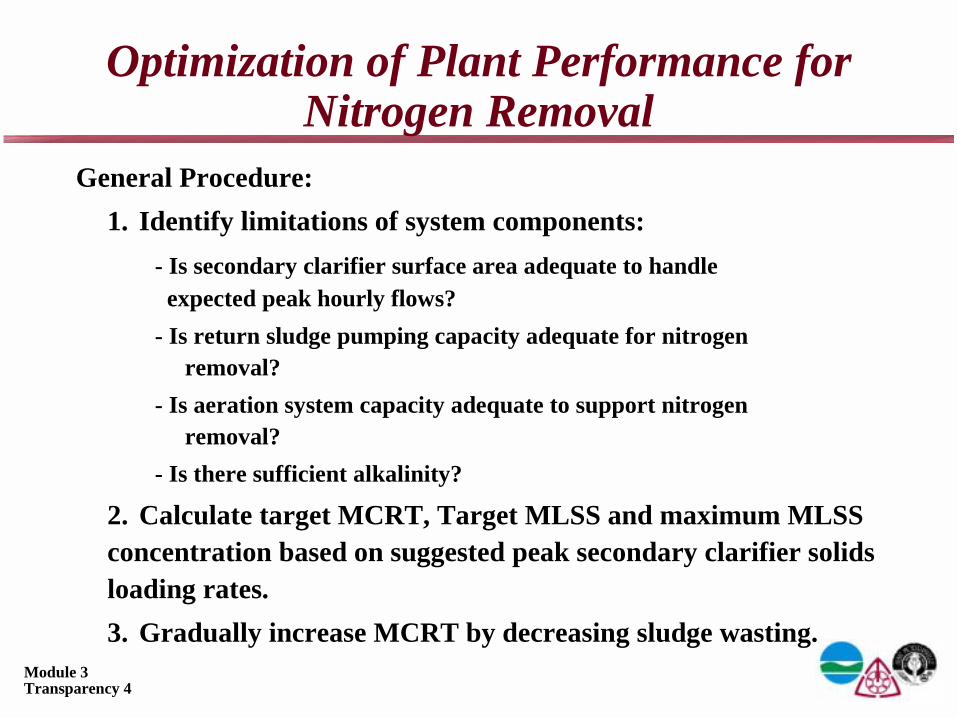
General Procedure:1. Identify limitations of system components:
- Is secondary clarifier surface area adequate to handle expected peak hourly flows?
- Is return sludge pumping capacity adequate for nitrogen removal?
- Is aeration system capacity adequate to support nitrogen removal?
- Is there sufficient alkalinity?
2. Calculate target MCRT, Target MLSS and maximum MLSS concentration based on suggested peak secondary clarifier solidsloading rates.3. Gradually increase MCRT by decreasing sludge wasting.

Module 3Transparency 5
Optimization of Plant Performance for Nitrogen Removal
4. Monitor changes to MLSS concentration, aeration tank dissolved oxygen concentrations and sludge settling characteristics.
5. Make adjustments to return sludge pumping rates and aeration rate.
6. If capacity for ammonia removal is demonstrated, evaluate process modifications for creation of anoxic zones required for denitrification.
7. Create Anoxic zone

Module 3Transparency 6
Impact on Clarifier Hydraulic CapacityMaximum Clarifier Overflow Rates (peak hourly flow conditions)• BOD Removal Only = 1,200 gal/sq ft/day• Nitrification/Denitrification = 1,000 gal/sq ft/day
Example Calculations• Consider 6 clarifiers (width = 40 ft., length = 125 ft.)• Clarifier Surface Area = 6 (40 ft.) (125 ft.) = 30,000 sq. ft.• Peak Hourly Flow Capacity:
BOD Removal Only = (30,000 sq. ft.) (1,200 gal/sq. ft./day)106 gal/Mgal
Nitrification/Denitrification = (30,000 sq. ft.) (1,000 gal/sq. ft./day)106 gal/Mgal
= 36 mgd
= 30 mgd
Operation for nitrification/denitrification reduces peak hourly flow capacity of secondary clarifiers by approximately 17 percent.

Module 3Transparency 7
Return Sludge Pumping Capacity Requirements
Return Sludge Rates• BOD Removal Only =25% to 100% of design average daily flow• Nitrification/Denitrification =50% to 150% of design average daily flow
Example• Consider average daily flow = 10 mgd• Use mid-point of typical RAS flow ranges (60% for BOD removal, 100% for
nitrification/denitrification)• Return Sludge Pumping Capacity Required
BOD5 Removal Only = 0.6 (10 mgd) = 6 mgdNitrification/Denitrification = 1.0 (10 mgd) = 10 mgd
Operation for nitrogen removal may require a significant increase in return sludge pumping capacity.

Module 3Transparency 8
Typical Design/Operating Values
Clarifier Overflow Rate
Peak Solids Loading Rate *
Clarifier Weir Loading RateLess than or equal to 1 MGDGreater than 1 MGD
Return Sludge Rate
BOD RemovalOnly
1,200
50
20,00030,000
25-100%
Nitrification
1,000
35
20,00030,000
50-150%
Nitrification-Denitrification
800
35
20,00030,000
50-150%
* Calculated based on design maximum day flow plus maximum return.

Module 3Transparency 9
Calculate Oxygen Required
Oxygen Requirements:
For BOD5 Removal only = 1.1 (BOD5)
For Nitrification = 1.5 (BOD5) + 4.6 (NH4+ -N oxidized)
With Pre-Denitrification = 1.5 (BOD5) + 4.6 (NH4+ -N oxidized)
- 2.9 (NOx -N Reduced)

Module 3Transparency 10
Oxygen Transfer Capacity (Mechanical Aeration Including Brush Rotor Aerators)
Oxygen Transfer Capacities:Standard Conditions: 2 - 4 lb/hp/hrField Conditions: 1.2 - 2.1 lb/hp/hr
Calculate Aerator HP Required:
Surface Aerator HP required =
oxygen required (lb / day)oxygen transfer (lb/hp/hr) x 24 hr/day

Module 3Transparency 11
Typical Oxygen Transfer Efficiencies to Dirty Water With Diffused Aeration Systems
0.02.04.06.08.0
10.012.014.016.018.020.022.024.026.0
6 8 10 12 14 16 18 20 22 24 26 28 30 32Depth (Feet)
Actu
al O
xyge
n Tr
ansf
er E
ffici
ency
to
Was
tew
ater
(Per
cent
)
Coarse BubbleDual Spiral RollCoarse BubbleDual Spiral Roll
Fine BubbleFull Floor Coverage
Fine BubbleFull Floor Coverage

Module 3Transparency 12
Oxygenation Capacity (Coarse Bubble Diffused Aeration)
} Dual Spiral Roll
Water depth above diffuser = 12 feetCalculate SCFM required
Specific weight of air = 0.075 lb/cf
Oxygen in air = 20% by weight
= (0.20) x (0.075 lb/cf)
= 0.015 lb/cf
Standard OTE = 9.5%Actual OTE = 6%

Module 3Transparency 13
Oxygenation Capacity (Coarse Bubble Diffused Aeration)
• Oxygen transferred = (0.06) (0.015 lb O2/cf air)= 9 x 10⁻⁴ lb O2/cf air
• Air required (scfm) =
• Approximate blower HP =
Oxygen required lb/day(Oxygen transferred, lb O2/cf air) (1440 min/day)
Air required (scfm)20 scfm / HP at 12’ depth *
* Some blowers are more efficient, some are less.

Module 3Transparency 14
Oxygenation Capacity (Full Floor Coverage Fine Bubble Diffused Aeration)
• Standard OTE = 24%• Actual OTE = 11%
• Oxygen = (0.11) (0.015) lb O2/cf air Transferred
= 1.6 x 10⁻³ lb O2/cf air
• Air Required (SCFM) =
• Approximate Blower HP =
Oxygen Required (lb/day)Oxygen Transferred (lb/cf air) (1440 min/day)
Air Required (SCFM)20 scfm/hp at 12’ depth

Module 3Transparency 15
Potential Aeration Power Savings Due to Denitrification
$0
$100,000
$200,000
$300,000
$400,000
$500,000
$600,000
$700,000
Fine Bubble Diffusers
Coarse Bubble Diffuser
Mechanical Aerators
Annu
al P
ower
Cos
ts
With Denitrification Without Denitrification
Activated Sludge Plant with Primary ClarifiersPlant Influent Flow = 10 mgdPlant Influent TKN = 35 mg/lPlant Influent BOD5 = 180 mg/lPower Costs = $0.10 per kW-hr.
Assumptions
$90,000
$155,000
$115,000

Module 3Transparency 16
Clarifier Solids Loading RateSecondary Clarifier
QR
Q+QRQ
Aeration Tank
MLSS
(Q + QR) (8.34) (MLSS)
A
Where; Q = primary effluent flow, mgdQR = return sludge flow, mgdMLSS = mixed liquid suspended solids concentration in clarifier feed, mg/lA = clarifier surface area, sq. ft.8.34 = conversion factor
Clarifier Solids Loading Rate = (lb/sq. ft./day)

Module 3Transparency 17
Suggested Peak Clarifier Solids Loading Rates
• BOD Removal Only = 50 lb/ sq. ft/ day *• Nitrification/ Denitrification = 35 lb / sq. ft / day *• Peak Solids Loading Rates based on
– Maximum 24-hour primary effluent flow, mgd– Anticipated return sludge pumping rate, mgd– Design MLSS concentration, mg/l
• Recommended minimum depth for new clarifiers in nitrifying facilities is 13’
* Average daily values should not be more than 1/2 of peak values

Module 3Transparency 18
Calculate Maximum MLSS Concentration Based on Clarifier Solids Loading Rate
• Clarifier surface area = 30,000 sq. ft.• Average primary effluent flow = 10 mgd• Peak 24-hour primary effluent flow = 27.5 mgd• Typical return sludge pumping rate
BOD removal only = 6 mgd (60% design average daily flow)Nitrific / Denitrific = 10 mgd (100% design average daily flow)
• Calculate Maximum MLSS ConcentrationBOD Removal = (30,000 sq. ft) (50 lb/sq. ft/day)
(27.5 mgd + 6 mgd) (8.34)= 5370 mg/l
Nit./Denit. = (30,000 sq. ft) (35 lb/sq. ft/day)(27.5 mgd + 10 mgd) (8.34)
= 3360 mg/l
Module 3Transparency 19
Long Island Sound Nitrogen Removal Training ProgramModule 3
Expected Performance for Various Configurations

Module 3Transparency 20
Modified Ludzack-Ettinger (MLE) Configuration
Nitrate Recycle
RAS
WAS
NOx-N=6.0 mg/L
AnoxicZone Aerobic Zone
Primary Effluent

Module 3Transparency 21
MLE Configuration with Secondary Anoxic Zone
MethanolNOx-N = 6.0 mg/L
RAS
WAS
NOx-N=1.0 mg/L
AnoxicZone
AnoxicZone
Nitrate RecyclePrimary Effluent
AerobicZone
AerobicZone

Module 3Transparency 22
MLE Configuration with Denitrifying Filter
RAS
WAS
NOx-N=1.0 mg/L
Denitrifying Filter
Primary Effluent
AnoxicZone
Nitrate Recycle
MethanolAddition
AerobicZone
Module 3Transparency 23
AEROBIC
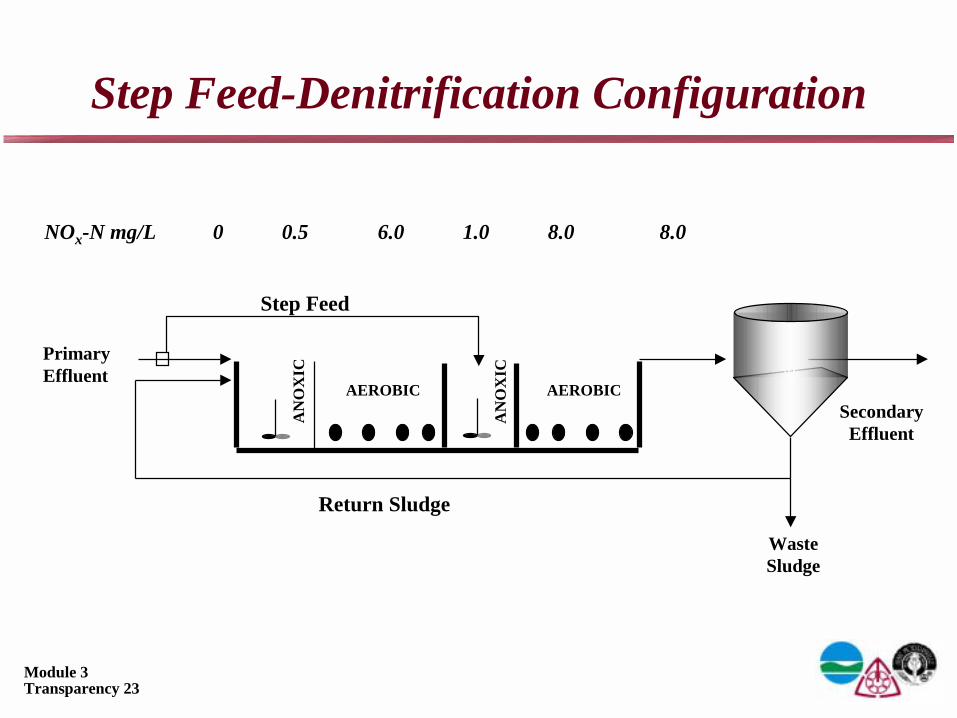
Step Feed-Denitrification Configuration
AN
OX
IC
NOx-N mg/L 0 0.5 6.0 1.0 8.0 8.0
AEROBIC
AN
OX
IC
PrimaryEffluent
Step Feed
Return Sludge
WasteSludge
SecondaryEffluent
Module 3Transparency 24
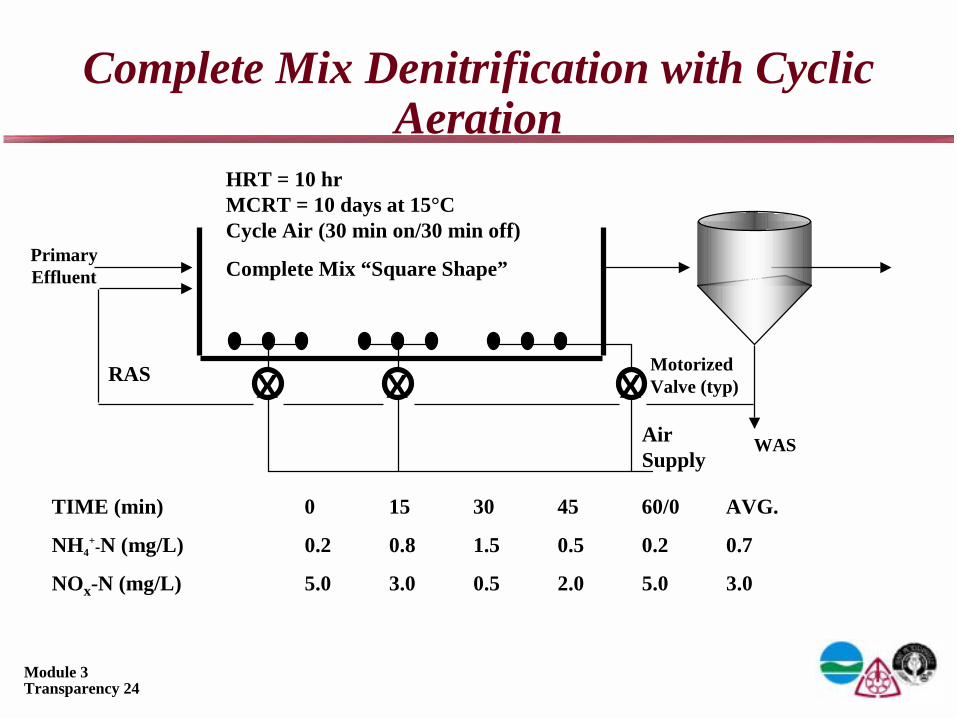
Complete Mix Denitrification with Cyclic Aeration
HRT = 10 hrMCRT = 10 days at 15°CCycle Air (30 min on/30 min off)
Complete Mix “Square Shape”
Air Supply
TIME (min) 0 15 30 45 60/0 AVG.
NH4+-N (mg/L) 0.2 0.8 1.5 0.5 0.2 0.7
NOx-N (mg/L) 5.0 3.0 0.5 2.0 5.0 3.0
PrimaryEffluent
RAS
WAS
Motorized Valve (typ)XXX

Module 3Transparency 25
Step Feed Denitrification with Cyclic Aeration
RAS
NH4+-N mg/L 15 6 4 2 0.5 0.2
NOx-N mg/L 0.5 2 3 4 5.5 6.0
PrimaryEffluent
MX MX MX Motorized Valve (typ)X
Step Feed
WAS
Air Supply
SecondaryEffluent

Module 3Transparency 26
Long Island Sound Nitrogen Removal Training ProgramModule 3
Operating and Troubleshooting Biological Nitrogen Removal
Facilities

Module 3Transparency 27
Sampling and Test Recommendations for Activated Sludge BNR Plants
Recommended minimum sampling requirements for a 5 MGD plant (Values shown are recommended samples per week)Raw Plant Primary Anaerobic Anoxic Aerobic Aerobic Secondary Final RAS/ Thick- Dewat- Non
Influent Recycle Effluent Zone Zone Zone Zone Effluent Effluent WAS ener ering PotableMiddle End Water
Flow 7 7 7 7 7SBOD5 1 (1) 1 (1)BOD5 (3) permit 1 1 permitSCOD (3) 2 1 1COD 1 1 0.5 permitVSS permit 5 2 permitTSS permit 1 5 2 permit 5 1 1Settlometer 530min SVI 5Microbial exam 1Alkalinity 1 1 1pH permit 1 1 permitDO 2 (1) 2 5 2 permitTemperature 5NH4N 1 1SKN 0.5 0.5TKN 1 0.5 permitNO2N 1NO3N or NOxN 1 1 permitOP 1 (1) 1 (1) 1 (2)TSP 1 (1) 0.5 (2)TP 1 (2) 1 (1) permit
Notes (1) with Biological Excess Phosphorus Only(2) with Biological or Chemical P removal(3) the number of BOD samples should be increased if COD is not analyzed at this frequency

Module 3Transparency 28
Test Methods
• Sample Filtration– Use same filter paper as used for TSS analysis
• DO Analysis– Measure in-tank; allow DO to stabilize for few
minutes in anoxic tank
• Temperature of Mixed Liquor– Use DO probe temperature setting, measure in-
tank

Module 3Transparency 29
Test MethodsAnalysis for soluble forms:Filter using same filter paper as for suspended solids analysis (glass fiber) unless specified otherwise.
Analysis for DO in anaerobic and anoxic zones:Use portable probe. Submerge probe in mixed liquor. Determine time taken for reading to stabilize. This may be two to five minutes.
Analysis of temperature of mixed liquor:Use DO probe to measure temperature at mid-point of aerobic zone.
Analysis of ammonium-N for process control purposes: (not for permit compliance)Filter sample. Use Hach DR700, DR2000 or higher; or use ammonia gas sensing electrode.
Analysis of NO2Nand NOXN for process control purposes: (not for permit compliance)Filter sample. Use DR700, DR2000 or higher.
Samples for process control tests can be stored for 48 hours in refrigerator (at less than 4 C) after filtration.
Analysis of Soluble Kjeldahl Nitrogen (SKN) and Total Kjeldahl Nitrogen (TKN)Use micro-digestion procedures as outlined in Standard Methods. Consider using an outside laboratory for SKN and TKN if lab time and equipment are constraints.
Analysis of Soluble and Total CODUse micro-digestion procedures as outlined in Standard Methods.

Module 3Transparency 30
Test Methods for Process Control• Ammonium-N
– Filter sample, use Hach DR700, 2000 or higher; or
– Filter sample, use gas sensing electrode• Nitrite-N and Nitrate-N
– Filter sample, use Hach DR 2000 or higher• SKN and TKN
– Use digestion followed by distillation• Filtered (soluble) and Total COD
– Micro-digestion

Module 3Transparency 31
Sampling Locations
Raw Influent Primary Effluent
1 2 34
SecEffluent
FinalEffluent
WAS
RASPrimarySludge
PlantRecycle
1. Anaerobic Zone (Biological Excess Phosphorus Removal Process Only)2. Anoxic Zone3. Mid point of Aerobic Zone4. End of Aerobic Zone

Module 3Transparency 32
Troubleshooting Common Problems
1. Foam on Tanks - white or gray?2. Final Effluent Ammonium-N high3. Final Effluent Ammonium-N fluctuates
widely4. Fluctuations in chlorine demand5. Fluctuations in Activated Sludge Basin DO

Module 3Transparency 33
Troubleshooting Other Problems6. Fluctuations in effluent NOxN above or below
acceptable range7. High NOxN in last section of primary anoxic zone8. DO levels above 0.5 mg/L in primary anoxic zone9. Gradual increase in Sec Clarifier blanket above
acceptable levels10. High blankets during I&I, Low basin MLSS11. SVI increase after I&I12. Increase in effluent soluble org-N, effluent TKN13. Clumps of sludge floating to top of clarifier
Module 3Transparency 34
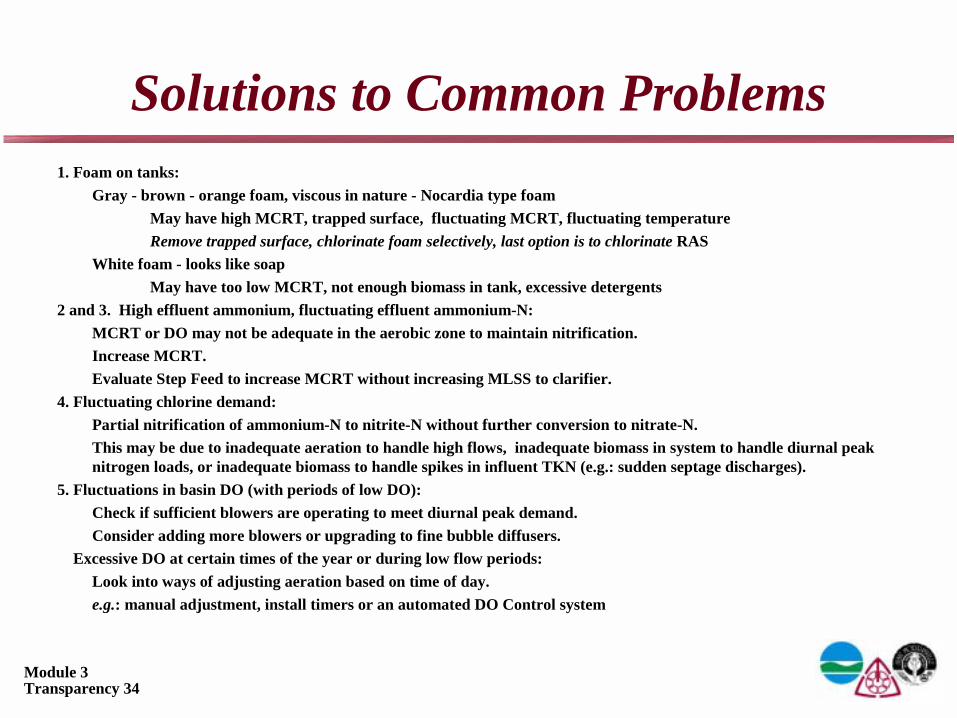
Solutions to Common Problems1. Foam on tanks:
Gray - brown - orange foam, viscous in nature - Nocardia type foamMay have high MCRT, trapped surface, fluctuating MCRT, fluctuating temperatureRemove trapped surface, chlorinate foam selectively, last option is to chlorinate RAS
White foam - looks like soapMay have too low MCRT, not enough biomass in tank, excessive detergents
2 and 3. High effluent ammonium, fluctuating effluent ammonium-N:MCRT or DO may not be adequate in the aerobic zone to maintain nitrification.Increase MCRT.Evaluate Step Feed to increase MCRT without increasing MLSS to clarifier.
4. Fluctuating chlorine demand:Partial nitrification of ammonium-N to nitrite-N without further conversion to nitrate-N.This may be due to inadequate aeration to handle high flows, inadequate biomass in system to handle diurnal peak nitrogen loads, or inadequate biomass to handle spikes in influent TKN (e.g.: sudden septage discharges).
5. Fluctuations in basin DO (with periods of low DO):Check if sufficient blowers are operating to meet diurnal peak demand.Consider adding more blowers or upgrading to fine bubble diffusers.
Excessive DO at certain times of the year or during low flow periods:Look into ways of adjusting aeration based on time of day.e.g.: manual adjustment, install timers or an automated DO Control system

Module 3Transparency 35
Solutions to Other Problems6. Fluctuation in NOxN - NOxN below expected range:
Possibly under-aerating. Check effluent ammonium-N. If satisfactory, then system is O.K.6, 7 and 8. NOxN above expected range:
Check if nitrate recycle rate is satisfactory (do calculation as shown in example problems).Check anoxic effluent NOxN. If it exceeds 1 mg/L, check DO in anoxic zone. If DO is above 0.3 mg/L, take steps to reduce DO in anoxic zone. Reduce aerobic zone DO if possible. If further adjustments necessary, evaluate primary effluent DO level and determine if that can be reduced. Third option is to reduce nitrate recycle rate.
9. Gradual increase in secondary clarifier sludge blanket:Evaluate the trend in SVI. Is SVI too high for the clarifier solids loading? What is the blanket level?If SVI is high because of filaments, are they low DO filaments? Where are these filaments growing? Is the anoxic zone behaving as a low DO zone? Is the aerobic zone suffering from low DOs. Can it be corrected?Initiate RAS chlorination to reduce SVI.Increase sludge wasting if MCRT can be reduced.
10. Excessive sludge blanket during high flows, low MLSS in basins:Initiate step feed during high flows to dilute the mixed liquor going to the clarifiers.
11. SVI increases during and immediately after periods of high flows:Does infiltration increase anoxic zone DO? Infiltration may also bring in filamentous bacteria.Plan on a maintenance dose of RAS chlorination. Use step feed to reduce the impact of primary effluent DO on anoxic zone.

Module 3Transparency 36
Solutions to Other Problems12.a Increase in effluent soluble organic-N - possible causes:
Reduction in MCRT below that required for nitrification.Sudden increase in influent TKN - septage dose, etc.Sudden addition of inhibitor - industrial chemical, pesticide, preservative, etc.
12.b Increase in effluent TKN with increase in ammonium-N:Same as 12a.Increase in effluent TKN with increase in effluent SS.Check clarifier.
13. Large clumps of sludge floating to top of secondary clarifier:Denitrification in clarifier - Increase RAS flow rate to reduce time sludge spends in clarifier, increase activated sludge tank effluent DO.Is blanket too high? Reduce MLSS.Check sludge scraper for proper operation.

Module 3Transparency 37
Q&A Regarding Filamentous Growth Control
What is the problem?Is the SVI too high?Is there too much foam - if so, what is the color - chocolate brown or white? Does the plant have a problem with both high SVI and foaming?
Make a generic identification of the type of filament.Is the filament a low DO filament?Is the filament a foam causing filament?
Observe filaments under the microscope.Have you been doing the weekly analysis?Do you see a change in the population of filamentous bacteria?Does it correspond to a change in SVI?Is it a long spaghetti-like filament or is it a short stubby filament which looks like broken glass?Have you done a slide of the foam to see if the foam has a particular type of filament in large numbers?
Microscopic ExaminationConduct examination at 400x and 1000x magnification.Try phase contrast, changing the light, and if you wish to, try staining.Low DO filament such as Sphaerotilus is relatively long (See reference book on identifying filaments)Foam causing filament such as Nocardia is short and is like shattered glass.

Module 3Transparency 38
Flow Sheet on SVI and Filamentous Bacteria Control
Measure SVI
YesYes
No
Yes
IsSVI
High?
IsBlanketHigh?
No
Look Under Microscope
AreFilamentsLong and
Numerous?
This is a plantspecific answer
Number of filaments are lowThey are not long (less than 20% of dia of slide
viewer at 1000x). Reduce MLSS
Check Anoxic and Aerobic DOsReduce MLSS
Chlorinate RAS

Module 3Transparency 39
Flow Sheet on Foam ControlObserve foam on tanks & clarifiers
Yes
Yes
Isthere anunusual
quantity?
IsSVI
High?
No
Doesit look likeshattered
glass?
Check undermicroscope at 400x
Isfoam whiteor brown?
White
May bebuildup of grease
No
Nocardia foam.Reduce trapped surfaces.Spray chlorine on foam.
Yes
Check under microscope. Could be Microthrix -
chlorinate
Not enough biomassor too much surfactant
load.
No
Yes Noaction
required
Brown

Module 3Transparency 40
Filamentous Growth ControlOptions to control filaments
If the filament is long, it has high surface area for its body mass. RAS chlorination is effective.It is recommended that the biomass get two or more exposures per day to the chlorine.Add chlorine at the point where the MLSS is the highest - in the RAS, there is minimal dilution of chlorine with water.If the filament is short, RAS chlorination will not be as effective except at high doses which can also kill some nitrifiers.Direct chlorination of the foam with water containing 15 ppm or more of chlorine is recommended.
Alternatives to chlorination for controlling long filaments (low DO and low F/M type) Some plants have tried other oxidants such as peroxide and permanganate.Others have tried adding the growth limiting nutrient (whose scarcity in low F/M systems can cause bacteria to mutate to filamentous form) - need to identify the nutrient(s) which is in short supply.Still others have tried adding vitamin B complex (folic acid) which can help grow predators of filaments.
Alternatives to chlorination for controlling foam causing filamentsSome plants have added steam to kill filaments.Some plants have used polymer to coagulate the foam.
Physical and Biochemical Changes to control filamentsReduce MCRT if possible - waste more sludge.Eliminate trapped surfaces where foam accumulates.Prevent backmixing of aerated liquid into anoxic zone at the front end of the tank.
Create selector zonesReference book: Manual on the Causes of and Control of Activated Sludge Bulking and Foaming. Jenkins, Richards and Daigger. Lewis Publishers
Module 3Transparency 41
Chlorine Dosing
• Chlorine Dosing will be proportional to SVI• SVI at which chlorination initiated is plant specific
– Depends on clarifier sludge blanket levels
• Dose to terminate chlorination is plant specific– Depends on clarifier sludge blanket levels, turbidity of effluent
and flocculating properties of the sludge
• Some plants will require a minimal maintenance dose of chlorine to control SVIs

Module 3Transparency 42
Filamentous Growth ControlChlorine DosingSet up a RAS chlorine dosing chart based on operating SVI. This is specific to your plant only!The chart will show an SVI where chlorination would be initiated; how the chlorine dose should be decreased with drop in SVI;
the SVI at which chlorination should be stopped.
Some plants may require a maintenance dose at certain times of the year (e.g.: plants which get seeded with filaments from I/I events)
Dose varies from a maintenance dose of 0.05 to 0.5 lbs/day/1000 lbs VSS in the system to a maximum short term dose of 5 lbs/day/1000 lbs VSS in the system.
Above 5 lbs/day/1000 lbs VSS, there will be a significant impact on nitrifiers.
SVI
Terminate chlorination when SVI drops below this level
Chlorinedose
lbs/1000 lbs VSS/day
Initiate chlorination at this SVI
Recommended approach to changing dose5 or less