Embed Size (px)
Citation preview
Nitrogen fixation by Trichodesmium spp.: An important source of new
nitrogen to the tropical and subtropical North Atlantic Ocean
Douglas G. Capone,1 James A. Burns,1,2 Joseph P. Montoya,3 Ajit Subramaniam,4
Claire Mahaffey,1,5 Troy Gunderson,1 Anthony F. Michaels,1
and Edward J. Carpenter6
Received 6 July 2004; revised 19 January 2005; accepted 9 March 2005; published 8 June 2005.
[1] The broad distribution and often high densities of the cyanobacterium Trichodesmiumspp. in oligotrophic waters imply a substantial role for this one taxon in the oceanicN cycle of the marine tropics and subtropics. New results from 154 stations on sixresearch cruises in the North Atlantic Ocean show depth-integrated N2 fixation byTrichodesmium spp. at many stations that equalled or exceeded the estimated vertical fluxof NO3
� into the euphotic zone by diapycnal mixing. Areal rates are consistent withthose derived from several indirect geochemical analyses. Direct measurements of N2
fixation rates by Trichodesmium are also congruent with upper water column N budgetsderived from parallel determinations of stable isotope distributions, clearly showingthat N2 fixation by Trichodesmium is a major source of new nitrogen in the tropical NorthAtlantic. We project a conservative estimate of the annual input of new N into the tropicalNorth Atlantic of at least 1.6 � 1012 mol N by Trichodesmium N2 fixation alone.This input can account for a substantial fraction of the N2 fixation in the North Atlanticinferred by several of the geochemical approaches.
Citation: Capone, D. G., J. A. Burns, J. P. Montoya, A. Subramaniam, C. Mahaffey, T. Gunderson, A. F. Michaels, and
E. J. Carpenter (2005), Nitrogen fixation by Trichodesmium spp.: An important source of new nitrogen to the tropical and subtropical
North Atlantic Ocean, Global Biogeochem. Cycles, 19, GB2024, doi:10.1029/2004GB002331.
1. Introduction
[2] Most of the world’s oceans are depleted in inorganicnitrogen at the surface. In these extensive areas, it has beentraditionally thought that the level of net biological activityis sustained by the mixing of nitrate from below. This fluxof ‘‘new’’ nitrogen in the sense of Dugdale and Goering[1967] into the euphotic zone supporting primary produc-tion is balanced by concomitant losses through sinkingparticles, vertical migration, and mixing of organic nitrogenout of the upper ocean [Eppley and Peterson, 1979; Lewis etal., 1986; Platt et al., 1992]. Although N2 fixation wasexplicitly identified as a component of N input in theoriginal formulation of the new production paradigm
[Dugdale and Goering, 1967; Eppley and Peterson,1979], it has rarely been considered in the subsequentapplication of this approach, perhaps owing to a paucity ofquantitative information on N2 fixation rates and diazo-troph abundance.[3] Estimates of the nitrogen demand of new production,
however, have often exceeded the nitrate flux into theeuphotic zone [Jenkins, 1988; Lewis et al., 1986], and suchestimates have prompted speculation about unknown orpoorly quantified N inputs [Karl et al., 2002; Legendreand Gosselin, 1989]. In the near-surface waters of theoligotrophic Bermuda Atlantic Time Series (BATS) station,total dissolved inorganic carbon concentrations (DIC) oftendecline through the summer despite the lack of combinednitrogen in the upper water column, implying the existenceof either N2 fixation, atmospheric inputs of nitrogen, sig-nificant deviations from Redfield stoichiometry, or somecombination of these three mechanisms [Michaels et al.,1994]. Large deficits exist in N budgets of the NorthAtlantic [Michaels et al., 1996]. Analysis of oceanicnutrient fields using a parameter termed N* (or alterna-tively, DINxs per [Hansell et al., 2004]), which quantifydeviations in regeneration stoichiometry of N and P,relative to canonical Redfield values (N:P of 16:1), findslarge areas of the tropical and subtropical North Atlanticwith nitrate:phosphate ratios in subeuphotic zone watersexceeding the Redfield value [Michaels et al., 1996; Gruberand Sarmiento, 1997]. Similarly, studies of the distribution
GLOBAL BIOGEOCHEMICAL CYCLES, VOL. 19, GB2024, doi:10.1029/2004GB002331, 2005
1Wrigley Institute for Environmental Studies and Department ofBiological Sciences, University of Southern California, Los Angeles,California, USA.
2Now at Quileute Natural Resources, LaPush, Washington, USA.3School of Biology, Georgia Institute of Technology, Atlanta, Georgia,
USA.4Lamont Doherty Earth Observatory of Columbia University, Palisades,
New York, USA.5Now at Department of Oceanography, School of Ocean and Earth
Science and Technology, University of Hawaii, Honolulu, Hawaii, USA.6Romberg Tiburon Center, San Francisco State University, Tiburon,
California, USA.
Copyright 2005 by the American Geophysical Union.0886-6236/05/2004GB002331$12.00
GB2024 1 of 17

of the stable isotopes of nitrogen in particulate matter[Altabet, 1988;Montoya et al., 2002;Mahaffey et al., 2003],zooplankton [Montoya et al., 2002;McClelland et al., 2003],and nitrate pools [Montoya et al., 2002; Brandes et al., 1998]in surface and near-surface waters of the oligotrophic tropicsindicate significant inputs of 15N-deplete N pool, presum-ably derived from N2 fixation. The role of N2 fixation in themarine nitrogen cycle has been undergoing increasingscrutiny and re-evaluation over the last decade [Karl etal., 2002; Zehr and Ward, 2002], leading to increasedestimates of its role in supporting oceanic new production.[4] Trichodesmium, a filamentous, non-heterocystous
cyanobacterium that is found throughout warm oligotrophicoceans [Capone et al., 1997], is the most conspicuousmarine N2 fixing organism. In the North Atlantic, themost common species is T. thiebautii, which occurs asmacroscopic aggregates containing from 100 to over200 trichomes (filaments) or, less frequently, as freetrichomes. Densities range from about 10 to over10,000 trichomes per liter [Carpenter et al., 2004;Tyrrell et al., 2003] and most trichomes are found inthe upper 50 m of the water column [Carpenter et al.,2004; Carpenter and Price, 1977]. While an early analysisof N2 fixation by Trichodesmium concluded that it wasof relatively minor significance in the marine N cycle[Carpenter, 1983a], that analysis relied upon historical
records of Trichodesmium that likely underestimatedpopulation densities [Capone and Carpenter, 1999].[5] During the period 1994–2003, we made direct mea-
surements of N2 fixation by Trichodesmium during a series ofsix research cruises in various seasons largely in the westerntropical North Atlantic Ocean from the equator to 30�N(Figure 1). This is an area of the Atlantic for which there isa relative paucity of data for biological processes in generaland N2 fixation in particular [Lipschultz and Owens, 1996].We occupied a total of 154 stations. The purpose of thispaper is to assess the relative importance of N2 fixation byTrichodesmium in the N cycle of the upper water columnusing the data collected on those cruises and to relate thisinput to other sources of combined nitrogen to the surfacemixed layer.
2. Materials and Methods
[6] Research cruises to various regions of the tropicalNorth Atlantic occurred in May–June 1994 on R.V. Gyre,March–April and October–November 1996, January–February 2001, and April–May 2003 on R.V. SewardJohnson, and in July–August 2001 on R.V. Knorr(Table 1, Figure 1). Trichodesmium spp. colonies weregently collected by very slowly (�1 knot) towing a 202-mmmesh 1-m-diameter net generally from 5 to 15 m depth
Figure 1. Cruise tracks and spatial and temporal distribution of depth-integrated nitrogen fixation byTrichodesmium in the tropical North Atlantic basin for the six Atlantic cruises. (a) Winter cruise aboardR.V. Seward Johnson in January and February 2001. (b) Spring cruises in April 1996 and April and May2003 aboard R.V. Seward Johnson. (c) Summer cruises May–June 1994 aboard R.V. Gyre and July andAugust 2001 aboard R.V. Knorr. (d) Fall cruise aboard R.V. Seward Johnson in October 1996. The N2
fixation rates for all the cruises are found in Supplemental Table 1. Circle area is proportional to the N2
fixation rates as shown in the figure legend. Stations with no data are not shown.
GB2024 CAPONE ET AL.: NITROGEN FIXATION IN THE NORTH ATLANTIC
2 of 17
GB2024

where the highest densities of colonies were typically found[Carpenter et al., 2004].[7] Colonies were removed from the cod end of the net,
diluted in surface seawater and isolated using a plasticbacteriological transfer loop, and carried through a filteredseawater rinse. For C2H2 reduction experiments, 10 colonieswere then placed in each of a series of 14-mL acid-washedserum vials containing 10 mL GF/F filtered surface seawater[Capone, 1993]. The vials were crimp-sealed using siliconerubber closures and injected with 1 mL of instrument-gradeacetylene that had been sparged through deionized water toremove trace acetone. In most assays, EDTAwas added to afinal concentration of 20 mM to prolong activity (J. Burns etal., Effect of EDTA additions on natural Trichodesmium spp.populations, submitted to Journal of Phycology, 2005).EDTA does not affect the initial rate of reaction, which wasused to estimate nitrogenase activity. Triplicate sets of vialswere prepared for assay at a range of light intensitiesrepresenting 100%, 55%, 28%, 10%, and 1% of surfaceirradiance. Incubations were carried out on deck in anincubator filled with flowing surface seawater, typicallybetween 26� and 28�C, and screened using neutral densityfilters to achieve the stated irradiances relative to the surface.Samples of the headspace were periodically removed with agas-tight syringe and analyzed by flame ionization gaschromatography for the production of C2H4 from C2H2
[Capone, 1993]. For assays initiated during daylight, C2H4
production was generally linear for periods of 3 to 7 hours.The average variability in nitrogenase activity, given here asthe standard error, was typically about 15 to 20% of the mean.[8] We also collected Trichodesmium colonies from dis-
crete depth intervals using two types of open-closing nets, aTucker Trawl, and a Bongo Net, each of which is capable ofbeing opened and closed at a specific depth. Samplesretrieved from these depths were compared to thosecollected at our standard 5–15 m depth by incubation inparallel at the irradiance appropriate to the depth ofcollection with the opening-closing net.[9] Direct comparisons were also made between the C2H2
reduction method and direct 15N2 assimilation [Montoya etal., 1996] by Trichodesmium colonies. Twenty to 100
colonies were placed in 310-mL glass bottles with screwcap seals with rubber septa. One hundred mL of 99 atom%15N-N2 gas (Cambridge Isotopes) were injected to initiatethe assay. Samples were incubated from 2 to 12 hours in on-deck incubators under specific level of irradiance relative tosurface irradiance. Incubations were terminated by filteringsamples onto pre-combusted GF/C filters that were thendried and stored until isotope ratio analysis in the laboratory.[10] We used a CTD-rosette system to obtain water
samples through the upper water column. Suspended par-ticles were collected by gentle vacuum filtration (200 mmHg vacuum) of 4 to 8 L of seawater through pre-combusted(450�C for 2 hours) 45 mm GF/F filters that were dried at60�C and stored over desiccant for analysis ashore. Forisotopic analysis, filters containing particle samples weretrimmed, then cut into quadrants or halves that werepelletized in tin capsules. All isotopic measurements weremade by continuous-flow isotope ratio mass spectrometryusing a Carlo Erba elemental analyzer interfaced to aMicromass Optima mass spectrometer.[11] Nitrate (NO3
�) concentrations were determined bystandard colorimetric techniques [Parsons et al., 1984] usinga Technicon or Lachat autoanalyzer. The vertical transport ofNO3
�was estimated as the product of the NO3� gradient at the
nitracline and the diapycnal eddy (turbulent) diffusivity (Kz).Nitrate gradients used to calculate this term do not varywidely among studies within the Atlantic basin. However,there is considerable divergence, and debate, concerningappropriate values of the diapycnal eddy diffusivity (seesection 3). We therefore used two values for Kz.[12] N* was derived (according to Gruber and Sarmiento
[1997]) using objectively analyzed 1� nutrient fields fromthe World Ocean Atlas 2001 (http://www.nodc.noaa.gov/OC5/WOA01/) from the North Atlantic and Ocean DataView [Schlitzer, 2004] as a visualization tool.
3. Results and Discussion
3.1. Nutrient Distributions
[13] Upper water column nitrate concentrations weregenerally below the limit of detection (<100 nM) at
Table 1. Average Areal Rate of N2 Fixation by Trichodesmium spp. From Tropical Locations
Location Dates Vessel
N2 Fixationa NO3 Gradient
EstimatedDiffusive NO3 Flux,mmol N/m2 � d
mmol N/m2 � d se n mmol N/m4 se n Kz = 0.11b Kz = 0.37
SWR tropical NorthAtlantic
24 May to18 June 1994
R.V. Gyre 898 ±234 18 0.053 ±0.009 19 46 169
Tropical NorthAtlantic
29 March to25 April 1996
R.V. Seward Johnson 163 ±58 29 0.196 ±0.014 30 167 627
SWR tropical NorthAtlantic
12 Oct. to4 Nov. 1996
R.V. Seward Johnson 300 ±71 27 0.145 ±0.016 25 126 402
SWR tropical NorthAtlantic
9 Jan. to20 Feb. 2001
R.V. Seward Johnson 161 ±46 24 0.230 ±0.015 24 228 736
SWR tropical NorthAtlantic
27 June to15 Aug. 2001
R.V. Knorr 59 ±21 29 0.158 ±0.010 28 136 504
SWR tropical NorthAtlantic
19 April to20 May 2003
R.V. Seward Johnson 85 ±23 28 0.116 ±0.007 16 101 373
Grand average (weighted) 239 ±38 154 0.147 ±0.007 142 131 471
aSee Supplemental Table 1 for complete data sets. Number of stations is denoted by n. Standard error is denoted by se.bUnits are cm2/s.
GB2024 CAPONE ET AL.: NITROGEN FIXATION IN THE NORTH ATLANTIC
3 of 17
GB2024

oceanic stations, but measurable at some of the Amazonplume waters during the October 1996 and April–May2003 cruises (A. Subramaniam et al., Influence of riverineand dust inputs on diazotrophy in the western tropical
North Atlantic, submitted to Nature, 2005) (hereinafterreferred to as Subramaniam et al., submitted manuscript,2005).[14] The southwestern tropical Atlantic Ocean is an area
of strong positive N* (or DINxs) anomaly (Figure 2).Both Gruber and Sarmiento [1997] and Hansell et al.[2004] observed a general DIN excess throughout theregion. The high N* values are most evident on the26.5 st surface (representing the 18� water between100 and 400 m) in the western basin and the 27.1 stsurface (subpolar mode water 250 to 700 m) in theeastern basin (Figure 2). Clearly defined N* maximaappear on both sides of the basin on these surfaces, withminima in the center of the gyre. There is an apparentgradient of N* between 0� and 20�N showing a generalincrease in the anomaly from south to north [Gruber andSarmiento, 1997; Hansell et al., 2004] (Figure 2). Theseobservations imply a net source of excess N that isgenerally attributed to N2 fixation throughout the south-west tropical Atlantic.[15] Similarly, Montoya et al. [2002] reported minima in
the d15N stable isotopic signatures in surface particulatematter and zooplankton in the southwest Sargasso Sea andsouthwestern tropical Atlantic. The nutrient and stableisotope data through the region will be more fully presentedin a separate publication (C. Mahaffey et al., manuscript inpreparation, 2005).
3.2. Rates of Trichodesmium N2 Fixation
[16] Colonies of Trichodesmium retrieved from discretedepths in the upper 40 m yielded rates of N2 fixationdirectly comparable to colonies retrieved from 10 to 20 mand incubated at a series of irradiances associated with thosedepths (Table 2). However, deeper samples yielded ratesgenerally lower than those observed for colonies from the10–20 m interval and incubated at the 10% surface irradi-ance level.[17] Direct comparisons of the C2H2 reduction method
with direct 15N2 fixation showed a substantial variabilityamong experiments (Table 3). However, while there is arelatively broad spread among experiments, the mean ratioof C2H2 reduced to N2 fixed for 191 experiments was about3.5, very close to the theoretical ratio of 3 to 4 (depending
Figure 2. Distribution of N* [Gruber and Sarmiento,1997] in the tropical and subtropical North Atlantic. N* wasderived according to Gruber and Sarmiento [1997] usingobjectively analyzed 1� nutrient fields from the WorldOcean Atlas 2001 [Schlitzer, 2004] (http://www.nodc.noaa.gov/OC5/WOA01/) for the North Atlantic. (top) N* on theisopycnal surface SigmaT (st) = 26.5 representing theSubtropical Mode (18�) Water. (bottom) N* distribution onthe isopycnal surface st = 27.1, representing the SubpolarMode water. Figure was prepared using Ocean Data View[Schlitzer, 2004].
Table 2. Comparison of Nitrogenase Activity in Freshly Collected Colonies of Trichodesmium Collected From a Standard Depth, or
From Discrete Depths With Opening/Closing Nets
DateNetType
Depth,m
IrradianceLevel,
% of Surface
Discrete Depth Net From 10–20 m
RatioSurface/Depth
StandardError Number Standard Error Number
14 Oct. Ta 0–20 55% 0.31 ± 0.04 3 0.30 ± 0.07 6 0.9515 Oct. Bb 20–40 28% 0.59 ± 0.06 6 0.54 ± 0.08 6 0.9116 Oct. B 20–40 28% 0.33 ± 0.05 6 0.46 ± 0.07 6 1.3917 Oct. B 20–40 28% 0.31 ± 0.06 6 0.32 ± 0.05 6 1.0319 Oct. B 20–40 28% 0.56 ± 0.08 3 0.63 ± 0.05 3 1.1228 Oct. B 20–40 28% 0.22 ± 0.04 3 0.23 ± 0.05 3 1.0516 Oct. B 40–60 10% 0.12 ± 0.05 3 0.14 ± 0.013 6 1.2419 Oct. B 40–60 10% 0.05 ± 0.02 3 0.28 ± 0.06 3 6.1014 Oct. T 40–60 10% 0.09 ± 0.02 3 0.34 ± 0.11 6 3.6915 Oct. T 40–60 10% 0.15 ± 0.02 6 0.36 ± 0.05 6 2.37
aTucker trawl.bBongo net.
GB2024 CAPONE ET AL.: NITROGEN FIXATION IN THE NORTH ATLANTIC
4 of 17
GB2024
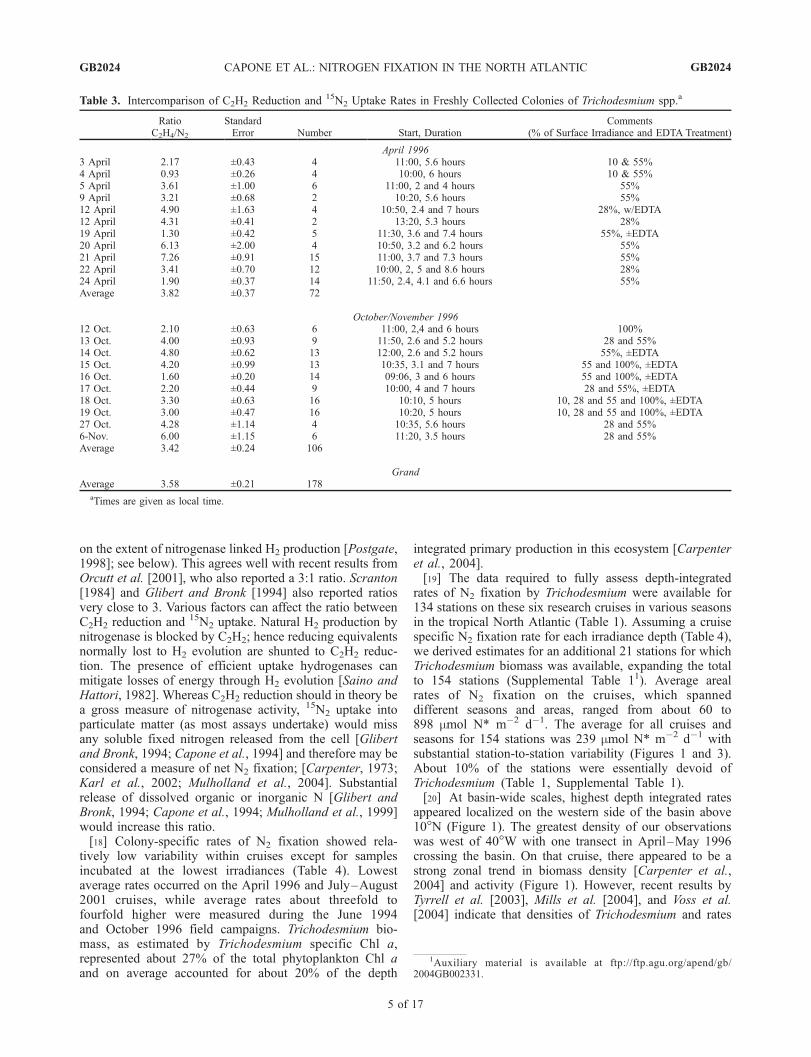
on the extent of nitrogenase linked H2 production [Postgate,1998]; see below). This agrees well with recent results fromOrcutt et al. [2001], who also reported a 3:1 ratio. Scranton[1984] and Glibert and Bronk [1994] also reported ratiosvery close to 3. Various factors can affect the ratio betweenC2H2 reduction and 15N2 uptake. Natural H2 production bynitrogenase is blocked by C2H2; hence reducing equivalentsnormally lost to H2 evolution are shunted to C2H2 reduc-tion. The presence of efficient uptake hydrogenases canmitigate losses of energy through H2 evolution [Saino andHattori, 1982]. Whereas C2H2 reduction should in theory bea gross measure of nitrogenase activity, 15N2 uptake intoparticulate matter (as most assays undertake) would missany soluble fixed nitrogen released from the cell [Glibertand Bronk, 1994; Capone et al., 1994] and therefore may beconsidered a measure of net N2 fixation; [Carpenter, 1973;Karl et al., 2002; Mulholland et al., 2004]. Substantialrelease of dissolved organic or inorganic N [Glibert andBronk, 1994; Capone et al., 1994; Mulholland et al., 1999]would increase this ratio.[18] Colony-specific rates of N2 fixation showed rela-
tively low variability within cruises except for samplesincubated at the lowest irradiances (Table 4). Lowestaverage rates occurred on the April 1996 and July–August2001 cruises, while average rates about threefold tofourfold higher were measured during the June 1994and October 1996 field campaigns. Trichodesmium bio-mass, as estimated by Trichodesmium specific Chl a,represented about 27% of the total phytoplankton Chl aand on average accounted for about 20% of the depth
integrated primary production in this ecosystem [Carpenteret al., 2004].[19] The data required to fully assess depth-integrated
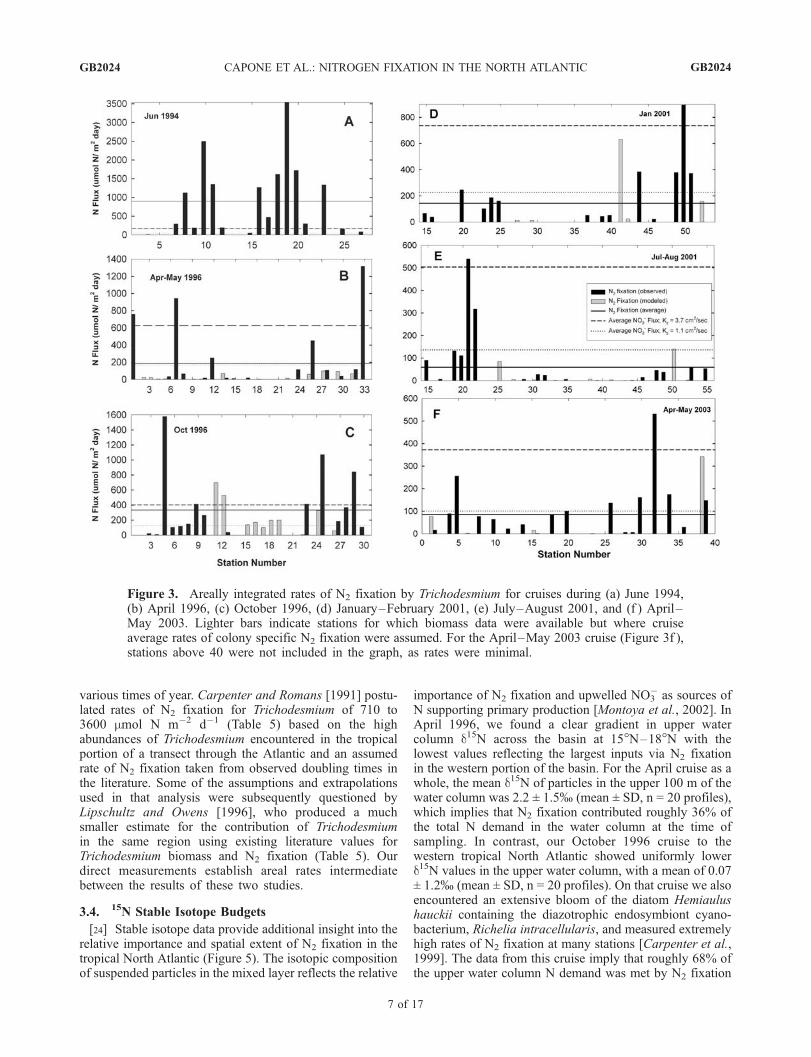
rates of N2 fixation by Trichodesmium were available for134 stations on these six research cruises in various seasonsin the tropical North Atlantic (Table 1). Assuming a cruisespecific N2 fixation rate for each irradiance depth (Table 4),we derived estimates for an additional 21 stations for whichTrichodesmium biomass was available, expanding the totalto 154 stations (Supplemental Table 11). Average arealrates of N2 fixation on the cruises, which spanneddifferent seasons and areas, ranged from about 60 to898 mmol N* m�2 d�1. The average for all cruises andseasons for 154 stations was 239 mmol N* m�2 d�1 withsubstantial station-to-station variability (Figures 1 and 3).About 10% of the stations were essentially devoid ofTrichodesmium (Table 1, Supplemental Table 1).[20] At basin-wide scales, highest depth integrated rates
appeared localized on the western side of the basin above10�N (Figure 1). The greatest density of our observationswas west of 40�W with one transect in April–May 1996crossing the basin. On that cruise, there appeared to be astrong zonal trend in biomass density [Carpenter et al.,2004] and activity (Figure 1). However, recent results byTyrrell et al. [2003], Mills et al. [2004], and Voss et al.[2004] indicate that densities of Trichodesmium and rates
1Auxiliary material is available at ftp://ftp.agu.org/apend/gb/2004GB002331.
Table 3. Intercomparison of C2H2 Reduction and 15N2 Uptake Rates in Freshly Collected Colonies of Trichodesmium spp.a
RatioC2H4/N2
StandardError Number Start, Duration
Comments(% of Surface Irradiance and EDTA Treatment)
April 19963 April 2.17 ±0.43 4 11:00, 5.6 hours 10 & 55%4 April 0.93 ±0.26 4 10:00, 6 hours 10 & 55%5 April 3.61 ±1.00 6 11:00, 2 and 4 hours 55%9 April 3.21 ±0.68 2 10:20, 5.6 hours 55%12 April 4.90 ±1.63 4 10:50, 2.4 and 7 hours 28%, w/EDTA12 April 4.31 ±0.41 2 13:20, 5.3 hours 28%19 April 1.30 ±0.42 5 11:30, 3.6 and 7.4 hours 55%, ±EDTA20 April 6.13 ±2.00 4 10:50, 3.2 and 6.2 hours 55%21 April 7.26 ±0.91 15 11:00, 3.7 and 7.3 hours 55%22 April 3.41 ±0.70 12 10:00, 2, 5 and 8.6 hours 28%24 April 1.90 ±0.37 14 11:50, 2.4, 4.1 and 6.6 hours 55%Average 3.82 ±0.37 72
October/November 199612 Oct. 2.10 ±0.63 6 11:00, 2,4 and 6 hours 100%13 Oct. 4.00 ±0.93 9 11:50, 2.6 and 5.2 hours 28 and 55%14 Oct. 4.80 ±0.62 13 12:00, 2.6 and 5.2 hours 55%, ±EDTA15 Oct. 4.20 ±0.99 13 10:35, 3.1 and 7 hours 55 and 100%, ±EDTA16 Oct. 1.60 ±0.20 14 09:06, 3 and 6 hours 55 and 100%, ±EDTA17 Oct. 2.20 ±0.44 9 10:00, 4 and 7 hours 28 and 55%, ±EDTA18 Oct. 3.30 ±0.63 16 10:10, 5 hours 10, 28 and 55 and 100%, ±EDTA19 Oct. 3.00 ±0.47 16 10:20, 5 hours 10, 28 and 55 and 100%, ±EDTA27 Oct. 4.28 ±1.14 4 10:35, 5.6 hours 28 and 55%6-Nov. 6.00 ±1.15 6 11:20, 3.5 hours 28 and 55%Average 3.42 ±0.24 106
GrandAverage 3.58 ±0.21 178
aTimes are given as local time.
GB2024 CAPONE ET AL.: NITROGEN FIXATION IN THE NORTH ATLANTIC
5 of 17
GB2024

of N2 fixation, respectively, can also be high on the easternside of the basin. In the area above 10�N and west of40�W, there is also evidence for some seasonality in theobserved rates with lowest rates in January, increasing inthe spring with maximal rates during the late summerthrough early fall, the period of highest upper watercolumn stability in this region [Coles et al., 2004a; Hoodet al., 2004].[21] The most extreme variability in N2 fixation rates
by Trichodesmium was seen in the region around 12�N,55�W in the Amazon River plume which can extendthousands of kilometers from the coast of South Americafor over 6 months of the year (Subramaniam et al.,submitted manuscript, 2005). Highest rates occurred inthe winter and early spring when the Amazon Riverdischarge is minimal and the plume is restricted to thecoast of South America. The lowest rates occurred in thesummer when the Amazon River plume covered thisregion with a turbid freshwater lens (Figure 1). Otherdiazotrophs such as diatoms with endosymbiotic cyano-bacteria can be found in the silicon-rich, lower salinity
waters at these times [Carpenter et al., 1999; Subrama-niam et al., submitted manuscript, 2005].
3.3. Comparisons With Earlier Studies
[22] Previous studies attempting to quantify directlydepth-integrated rates of N2 fixation in the North Atlantichave been limited in coverage, largely focusing on mar-ginal seas or in the subtropics [see Lipschultz and Owens,1996]. Rates of N2 fixation by Trichodesmium in thesubtropical North Atlantic are generally much lower(<10 mmol N m�2 d�1) than in tropical regions (Figure 4),typically because the abundances of Trichodesmium arelower [Carpenter et al., 2004]. Trichome specific rates offixation tend to vary much less than areal rates (Figure 4).[23] With regard to related studies, Goering et al. [1966]
reported volume specific rates of N2 fixation from twocruises off the northeast coast of South America in theearly 1960s, but did not provide areal estimates. Carpenterand Price [1977] found a mean rate of N2 fixation of161 mmol N m�2 d�1 (recalculated using a 3:1 conversionratio of ethylene to N2) for stations in the Caribbean basin at
Table 4. Average Colony Specific Rates of Nitrogenase Activity for Each Cruise
Percentof
Surface Irradiance Depth, mStandardError
Nitrogenase Activity,nmol C2H4 Colony h se
se as% ofMean Min Max
Number ofStations
n
May–June 1994100 1 0.41 0.057 14% 0.04 0.92 2155 17 1.0 0.44 0.069 16% 0.05 1.42 2128 34 1.9 0.36 0.049 14% 0.04 0.76 2110 64 4 0.36 0.052 14% 0.01 0.90 201 121 6.3 0.20 0.025 13% 0.00 0.49 20
April 1996100 1 0.18 0.042 23% 0.04 0.30 555 14 2.2 0.14 0.027 20% 0.01 0.34 1428 27 2.9 0.14 0.029 21% 0.01 0.40 1510 49 2.9 0.09 0.024 27% 0.00 0.29 141 80 3.4 0.05 0.019 39% 0.00 0.20 10
Oct. 1996100 1 0.44 0.055 12% 0.15 0.84 1455 19 1.2 0.39 0.048 12% 0.15 0.93 1628 36 2.6 0.38 0.043 11% 0.08 0.64 1610 53 3.1 0.24 0.031 13% 0.10 0.50 131 82 2.6 0.07 0.017 24% 0.01 0.21 11
Feb. 2001100 1 0.21 0.026 12% 0.02 0.44 1455 15 0.9 0.24 0.026 11% 0.02 0.41 1428 31 1.7 0.21 0.034 16% 0.01 0.50 1410 52 1.6 0.07 0.025 35% 0.00 0.18 91 80 2.9 0.06 0.030 51% 0.00 0.22 8
July–Aug. 2001100 1 0.17 0.027 16% 0.01 0.33 1655 14 1.3 0.15 0.025 16% 0.01 0.37 1828 31 2.2 0.16 0.024 15% 0.01 0.37 1810 51 2.7 0.05 0.013 29% 0.00 0.14 141.0 70 5.0 0.07 0.023 35% 0.01 0.19 8
April –May 2003100 1 0.2 0.12 0.03 21% 0.04 0.31 855 8 0.6 0.14 0.02 15% 0.04 0.30 928 17 1.8 0.13 0.01 9% 0.06 0.21 910 28 3.5 0.09 0.01 14% 0.05 0.22 81.0 52 5.9 0.06 0.01 17% 0.02 0.13 6
GB2024 CAPONE ET AL.: NITROGEN FIXATION IN THE NORTH ATLANTIC
6 of 17
GB2024
various times of year. Carpenter and Romans [1991] postu-lated rates of N2 fixation for Trichodesmium of 710 to3600 mmol N m�2 d�1 (Table 5) based on the highabundances of Trichodesmium encountered in the tropicalportion of a transect through the Atlantic and an assumedrate of N2 fixation taken from observed doubling times inthe literature. Some of the assumptions and extrapolationsused in that analysis were subsequently questioned byLipschultz and Owens [1996], who produced a muchsmaller estimate for the contribution of Trichodesmiumin the same region using existing literature values forTrichodesmium biomass and N2 fixation (Table 5). Ourdirect measurements establish areal rates intermediatebetween the results of these two studies.
3.4. 15N Stable Isotope Budgets
[24] Stable isotope data provide additional insight into therelative importance and spatial extent of N2 fixation in thetropical North Atlantic (Figure 5). The isotopic compositionof suspended particles in the mixed layer reflects the relative
importance of N2 fixation and upwelled NO3� as sources of
N supporting primary production [Montoya et al., 2002]. InApril 1996, we found a clear gradient in upper watercolumn d15N across the basin at 15�N–18�N with thelowest values reflecting the largest inputs via N2 fixationin the western portion of the basin. For the April cruise as awhole, the mean d15N of particles in the upper 100 m of thewater column was 2.2 ± 1.5% (mean ± SD, n = 20 profiles),which implies that N2 fixation contributed roughly 36% ofthe total N demand in the water column at the time ofsampling. In contrast, our October 1996 cruise to thewestern tropical North Atlantic showed uniformly lowerd15N values in the upper water column, with a mean of 0.07± 1.2% (mean ± SD, n = 20 profiles). On that cruise we alsoencountered an extensive bloom of the diatom Hemiaulushauckii containing the diazotrophic endosymbiont cyano-bacterium, Richelia intracellularis, and measured extremelyhigh rates of N2 fixation at many stations [Carpenter et al.,1999]. The data from this cruise imply that roughly 68% ofthe upper water column N demand was met by N2 fixation
Figure 3. Areally integrated rates of N2 fixation by Trichodesmium for cruises during (a) June 1994,(b) April 1996, (c) October 1996, (d) January–February 2001, (e) July–August 2001, and (f ) April–May 2003. Lighter bars indicate stations for which biomass data were available but where cruiseaverage rates of colony specific N2 fixation were assumed. For the April–May 2003 cruise (Figure 3f ),stations above 40 were not included in the graph, as rates were minimal.
GB2024 CAPONE ET AL.: NITROGEN FIXATION IN THE NORTH ATLANTIC
7 of 17
GB2024

in these waters. The isotope data thus corroborate theconclusions from the direct measurements and confirm amajor role for N2 fixation in supporting primary productionin the North Atlantic. It is important to note that isotope-derived estimates of the contribution of N2 fixation to the Nsupply to the surface ocean represent an upper bound ormaximum potential based upon the choice of end-membersource 15N/14N values [Mahaffey et al., 2005].
3.5. Comparison With Vertical Nitrate Flux
[25] The vertical flux of nitrate from below the thermo-cline through eddy diffusion and turbulent mixing hasgenerally been considered the main source of new nitrogenin highly stable non-upwelling open-ocean regions. Eddydiffusivities for open ocean systems have been estimated byvarious approaches and typically fall in the range from 0.1to 0.5 cm2 s�1 [Michaels et al., 1996; McCarthy andCarpenter, 1983] [cf. Jenkins, 1988]. Some experimentalevidence over the last several decades has suggested that theeffective Kzs in highly oligotrophic may be at the lower endof this range in the perennially stratified tropics [McCarthyand Carpenter, 1983]. Ledwell et al. [1993, 1998] derived
Kz values of 0.11 ± 0.2 cm2 s�1 at a site 1200 km west ofthe Canary Islands during an extended (several months) SF6tracer experiment. A recent study by Zhang et al. [2001] at46�N 20.5�W using SF6 injected just below a relativelyshallow (20 m) mixed layer reported an eddy diffusioncoefficient of about 1.0 ± 0.3 cm2 s�1, while a similarstudy by Law et al. [2001] at 59.10�N 20.15�W reported avalue of 1.95 cm2 s�1 (Table 6).[26] In order to provide a context for evaluating the
impact of N2 fixation, we estimated vertical NO3� flux at
each station using both a widely employed value for verticaleddy diffusivity (Kz) in oligotrophic waters [Lewis et al.,1986; Michaels et al., 1996; Karl et al., 1992] and a lowervalue of Kz recommended by Oschlies [2002b, 2002a] forthese waters (see Table 6 and section 2). This resulted in anaverage nitrate flux for each cruise of from 169 to 736 mmolN m�2 d�1 and 46 to 228 mmol N m�2 d�1, respectively(Tables 1 and 6, Figures 1 and 2).[27] Our values largely fall within the range of values
reported in the literature for the tropical Atlantic (Table 6).As might be expected, studies in temperate locations withshallow thermoclines and strong NO3
� gradients report
Figure 4. Histograms of rates of N2 fixation by Trichodesmium on a (a, b) trichome specific and (c, d)areal basis for the North Atlantic tropics (Figures 4b and 4d) and subtropics (Figures 4a and 4c). Dataused are presented in Supplemental Tables 2 and 3.
GB2024 CAPONE ET AL.: NITROGEN FIXATION IN THE NORTH ATLANTIC
8 of 17
GB2024

Table
5.DirectandIndirectEstim
ates
ofPelagic
N2Fixationin
theAtlanticOcean
Location/Domain
Comment
Areal
Estim
ates
Average
mmolN/m
2�
dse
Number
of
Stations
or
Observations
Domain
Area,
km
2�
106
Areally
Integrated
Annual
N2
Fixation,
molN
�1012
Reference
Direct
Trichodesmium/tropical
regions
Caribbean,12�N
–22�N
AR,3:1
a161
±20
12
na
na
CarpenterandPrice
[1977]
NorthAtlantic
AR,3:1
239
±38
154
17.8–28.0
1.6–2.4
thisstudy
Richelia/Hem
iaulus
SW
NorthAtlantic,
7�N
–27�N
AR,3:1
3110
±1315
14
unknown
unknown
Carpenteret
al.[1999]
Extrapolation
NorthAtlantic
extrap
na
na
unknown(19)
unknown0.09
Carpenter[1983a]
NorthAtlantic
extrap
710–3600
na
7–19
2–25
CarpenterandRomans[1991]
NorthAtlantic
extrap
160–430
na
7–19
1.1
LipschultzandOwens[1996]
Geochem
ical
NorthAtlantic
N*,residence
time
500–2500
na
7–19
3.7–6.4
Michaelset
al.[1996]
NorthAtlantic,
10�N
–50�N
,10�W
–90�W
IntegratedN*,N:P
197(315)b
na
28
2(3.2)b
Gruber
andSarm
iento
[1997]
Atlantic40�N
–40�S
Ctinventory
111
na
49
2.0c
Lee
etal.[2002]
Atlantic40�N
–0�
Ctinventory,assumeallNorthAtlantic
180–270
na
20–30
2.0
Lee
etal.[2002]
NorthAtlantic,
15�N
–25�N
,25�W
–75�W
Excess
nitrate
70–208(105–312)b
na
6.1
0.15–0.46(0.23–0.69)b
Hansellet
al.[2004]
NorthAtlantic
15N
isotopemassbalance
d850
na
17.8–28.0
5.5–8.7
thisstudy
aAcetylenereductionmethodforN2fixationusingaconversionratioof3:1.
bAssumingan
N:P
ratioof45fordiazotrophsrather
than
125as
originally
computedbyGruber
andSarm
iento
[1997].
cAssumingaC:N
ratioof7:1
forbiomass.
dAssumingan
averageCfixationrate
of17mmolCm
�2d�1,aC:N
ratioof7:1
andan
inputbyN2fixationaccountingfor38%
oftotalN
dem
andas
notedonourApril1996cruise.
GB2024 CAPONE ET AL.: NITROGEN FIXATION IN THE NORTH ATLANTIC
9 of 17
GB2024

considerable diapycnal fluxes of nitrate [Zhang et al., 2001;Law et al., 2001]. Interestingly, both of these studies were inanticyclonic warm core rings. Jenkins [1988] and Jenkinsand Doney [2003] also estimated a very high flux (up to2301 ± 712 mmol N m�2 d�1 in the latter study) of nitrate inthe Sargasso Sea near Bermuda based on the 3H excessesin the upper mixed layer and a ‘‘flux gauge technique’’describing a nutrient spiral in the North Atlantic.
[28] In the more permanently stratified oligotrophictropics, estimates of diapycnal flux are considerably lower(Table 6). For instance, Lewis et al. [1986] reported amean flux of 139 mmol N m�2 d�1 for a stationsomewhat south (28.5�N) but much farther east (23�W)of the Jenkins [1988] study. A recent model by Oschlies[2002b] explains some of the apparent discrepanciesbetween the nitrate flux estimates of Lewis et al. [1986]
Figure 5. Nitrogen isotopic index to the contribution of diazotrophs to particulate nitrogen (PN) in theupper 100 m of the water column. (a) Mean d15N of suspended particles in the upper 100 m of the watercolumn from cruises SJ9603 in April 1996 (dark bars) and SJ9612 in October 1996 (light bars). Meansare weighted by PN concentration and depth interval represented by vertically stratified bottle samples.Note reversed horizontal (d15N) axis. (b) Contribution of diazotroph N to PN in the upper 100 m of thewater column from cruises SJ9603 in April 1996 (dark bars) and SJ9612 in October 1996 (light bars).Diazotroph contribution estimated using an isotopic mixing model [Montoya et al., 2002]. Each barrepresents the number of stations with a diazotroph contribution greater than or equal to the minimum andless than the maximum boundary for that interval. Hence the rightmost bar represents one station forwhich 100% of the nitrogen input could be accounted for by N2 fixation. (c) Spatial distribution ofestimated diazotroph contribution to upper water column PN. Area of circles is proportional to thediazotroph contribution. Stations without PN profiles marked with small diamonds. Chart was preparedwith GMT [Wessel and Smith, 1998].
GB2024 CAPONE ET AL.: NITROGEN FIXATION IN THE NORTH ATLANTIC
10 of 17
GB2024

and Jenkins [1988]. The site of the Jenkins [1988]measurements was at the southern edge of the region ofhigher nitrate flux, while Lewis et al.’s [1986] site was ina region of lower nitrate flux, thus showing that bothmeasurements are valid for their respective regions[Oschlies, 2002b].[29] The average rate of N2 fixation ranges from 50% to
180% of our contemporaneous estimates of the concurrentdiapycnal flux of nitrate. The lower value of Kz used forthese waters (see Table 6) diminishes the estimate ofvertical input of NO3
� and, correspondingly, increases therelative importance of N2 fixation. The regions where wefind our highest N2 fixation rates by Trichodesmium spp.(898 mmol N m�2 d�1 noted during the early summer of1994 in the southwestern region of the subtropical gyre)are where the Oschlies [2002b] model predicts the verylowest nitrate fluxes (0–27 mmol N* m�2 d�1). Thisrelationship is also apparent in the modeling results ofHood et al. [2004] and Coles et al. [2004a, 2004b].[30] Consistent with Oschlies [2002b], the observed
vertical NO3� gradients were on average also weaker on
the June 1994 cruise than on subsequent cruises (Table 4).The resultant estimates of diapycnal nitrate flux of 46 to169 mmol N* m�2 d�1 are thus lowest on this cruise. Onthe June 1994 cruise, the rate of N2 fixation was typically5–20 times higher than the estimated flux of nitrate intothe euphotic zone. Over all the cruises, the rates of N2
fixation we observed for Trichodesmium overlap substan-tially with current estimates of diffusive and turbulentvertical nitrate flux in these systems, implying that N2
fixation in the North Atlantic is of roughly equal impor-tance to nitrate as a source of new production.[31] More recently, model and climatological evidence
suggests that mesoscale eddies may be responsible for anadditional, stochastic injection of nitrate from the deep tothe surface ocean. Estimates of eddy-induced nitrate supply
derived in the Sargasso Sea near Bermuda range from0.19 ± 0.1 to 0.35 ± 0.1 mol N m�2 yr�1 [McGillicuddyand Robinson, 1997; McGillicuddy et al., 1999; Siegel etal., 1999], which equates to a potential daily supply of520 to 958 mmol N m�2 d�1. However, mesoscale eddyevents are both spatially and temporally diverse, and theinstantaneous nitrate supply may be much higher than1000 mmol N m�2 d�1 during an event. The biogeo-chemical role of eddies in fuelling export production oforganic matter, or potentially altering plankton communitystructure remains debated [McGillicuddy et al., 2003;Sweeney et al., 2003; Oschlies, 2002a]. Major anticyclonicrings routinely transit the western tropical Atlantic [Johns etal., 1990; Fratantoni and Glickson, 2002].
3.6. Comparison With Geochemical Estimates
[32] Geochemists have historically argued that phospho-rus rather than nitrogen availability is the key factorcontrolling marine productivity on long timescales [Tyrrell,1999] such that N2 fixation is only important in ameliorat-ing short-term deficits of combined nitrogen. This view-point assumes that the Redfield ratio is a fixed constraint onthe production of oceanic biomass and that the dynamics ofthe N and P cycles are such that the biota will always adjustoceanic N inventories to match P inventories through acombination of N2-fixation and denitrification. However,new approaches indicate substantial variability in the N:Pratios of biomass and that the rates of N2 fixation couldbe much higher than required to maintain steady stateRedfield stoichiometry [Michaels et al., 2001]. Our dataspeak directly to the controversy between the historicalviewpoint and the emerging contention that rates ofdiazotrophy are large and cannot be ignored on a basinor global scale.[33] Our mean rate of Trichodesmium based N2 fixa-
tion, 239 mmol N* m�2 d�1 (Table 1) derives from
Table 6. Some Estimates of Vertical NO3� Flux Into the Euphotic Zone of the Tropical Atlantic Ocean
Location
NO3�
Gradient,mmol/m4
Kz,cm2/s se
N Flux,mmol N/m2 � d Error n Comment Reference
>30�NSargasso Sea 32�10 N, 64�30 W 0.02–0.03 [7.6]a 1644 548 (sd) 3He excess Jenkins [1988]Sargasso Sea 31�50 N, 64�10 W 0.03 0.4 100- Fickian Michaels et al. [1996]Subtropical North Atlantic
45�N–50�N, 15�W–20�Wn/a n/a 274 Convective model Williams et al. [2000]
Subtropical North Atlantic46�N, 20.5�W
0.48 1.0 4150 SF6 tracer Zhang et al. [2001]
North Atlantic 59.10�N, 20.15�W 0.107 1.95 1250 SF6 tracer Law et al. [2001]
<30�NOligotrophic east Atlantic 28.5�N, 23�W 0.045 0.37
(0.006–2.3)139
(2.7–1035)2–890
(95% CI)tked/bfmb Lewis et al. [1986]
Oligotrophic east Atlantic 26�N 28�W 0.03 0.11 27- SF6 tracer Ledwell et al. [1993]Central Atlantic 34�S to 27�N 0.092 0.29 ±1.2 380 ±180 (se) 14 tked/bfmb Planas et al. [1999]Central Atlantic 3�N to 27�N 0.152 0.58 ±2.9 838 ±344 (se) 6 tked/bfmb Planas et al. [1999]Tropical/subtropical North Atlantic
25�N–30�N, 70�W–75�Wn/a n/a 137 convective model Williams et al. [2000]
Tropical/subtropical North Atlantic n/a n/a 137 er/cecmc Oschlies [2002b]Tropical Atlantic 0.05–0.023 0.11 46–228 Fickian this reportTropical Atlantic 0.37 169–736 Fickian this report
aApparent Kz back-calculated from Jenkins [1988] assuming a NO3 gradient of 0.25 mmol m�4.bTurbulent kinetic energy diffusion/buoyancy frequency model.cEddy-resolving coupled ecosystem circulation model.
GB2024 CAPONE ET AL.: NITROGEN FIXATION IN THE NORTH ATLANTIC
11 of 17
GB2024

observations from 154 stations over all seasons, a rela-tively robust sampling compared to earlier efforts. Oursampling area (defined by the polygon that includes all ofour stations with N2 fixation determinations) encompasseda region of about 9 � 106 km2. Applying our spatiallyand seasonally averaged rate to this area yields an inputof 0.8 � 1012 mol N* yr�1. As noted above, the greatestdensity of our stations was in the western portion of thebasin, but recent results from the eastern flank alsoindicate high densities of Trichodesmium [Tyrrell et al.,2003] and comparable rates of N2 fixation [Voss et al.,2004]. The N* distributions across the basin (Figure 2)would also suggest that N2 fixation is generally importantacross a relatively wide area of the tropical and subtrop-ical North Atlantic.[34] In order to compare our results with recent geochem-
ical estimates, we have scaled our rates over appropriateportions of the North Atlantic basin. We used seasonallyaveraged sea surface temperatures (SST) greater than orequal to 25�C or 20�C (17.8 and 28 � 106 km2, respec-tively) of the North Atlantic and Caribbean as a proxy forwarm oligotrophic waters likely to be inhabited by substan-tial populations of Trichodesmium [Carpenter, 1983b]. Theareas derived from these limits are about 2 and 3 times thatof the area in which we undertook cruises and made ourobservations. Scaling to these areas yields annual estimatedrates of N2 fixation of from 1.6 to 2.4 � 1012 mol N* yr�1
(Table 5).[35] There are several published estimates of N2 fixation
in the North Atlantic basin based on different geochemicalapproaches. Michaels et al. [1996] undertook a comprehen-sive analysis of nutrient pools and fluxes in the NorthAtlantic using the GEOSECS, TTO, and BATS data sets,including introduction of the N* parameter. They examinedgradients in N* along isopycnal surfaces and the residencetimes of these water masses and derived a basin-scaleestimate of 3.7–6.4 � 1012 mol N* yr�1. This translatesto rates of from 500 to 2500 mmol N* m�2 d�1 over theirdomain. N* based estimates represent the net balancebetween N sources and sinks and would reflect sources ofN2 fixation other than Trichodesmium as well as reflectingany reductions in the nitrate pool which would result fromdenitrification (thought to be minor in the North Atlanticwater column).[36] Subsequently, Gruber and Sarmiento [1997]
derived an N* estimate for the North Atlantic of2.0 � 1012 mol N yr�1 using a more extensive data setand a more refined method (Table 5). The Gruber andSarmiento [1997] N* analysis produced an areal rate of197 mmol N* m�2 d�1. In order to derive their N* basedestimate of N2 fixation, Gruber and Sarmiento [1997]assumed an N:P ratio for diazotrophs much greater thanthe canonical Redfield ratio of 16:1 to account for thepositive N* anomalies. They chose a value of 125:1gleaned from a report of the N:P ratio of bloom materialfrom Station ALOHA in the Pacific [Karl et al., 1992].However, at least for Trichodesmium, the reported N:Pvalues are typically closer to 40 to 50 [Carpenter, 1983b;Letelier and Karl, 1996]. As discussed by Gruber andSarmiento [1997], their high estimate of the diazotroph
N:P ratio provides a conservative estimate for the rate ofN2 fixation. Recalculating their N2 fixation rates in theNorth Atlantic assuming an N:P ratio of 45 yields a rate ofabout 300 mmol N* m�2 d�1 and an annual input of 3.2 �1012 mol N yr�1 [Gruber and Sarmiento, 1997, Figure 18].[37] Our isotopic measurements provide yet another ave-
nue for estimating the rate of N2 fixation in the NorthAtlantic. For our isotopic budget calculation, our goal wassimply to assess the relative contributions of deep waternitrate and N2 fixation in supporting the production ofparticulate organic matter in the mixed layer. The d15N ofdeep water nitrate (about 4.5 to 4.8 % in the Atlantic)provides a strong isotopic contrast with the N (�1 to �2%)fixed by Trichodesmium [Montoya et al., 2002]. We usedconservative values for these end-members (�2% fordiazotroph N and 4.5% for deepwater nitrate) and theisotope budget approach of Montoya et al. [2002] toestimate the contribution of N2 fixation to the upper oceanN budget.[38] The rate of primary production in the tropical and
subtropical North Atlantic is not well constrained in theliterature, with estimates ranging between about 17 and83 mmol C* m�2 d�1 [Carpenter et al., 2004]. Even thelower end of this range implies a total nitrogen demand ofabout 2.4 mmol N* m�2 d�1, assuming a Redfield C:Nratio of 7:1 in the organic matter formed. Our isotopicmass balance calculations show that during our April 1996cruise through the central tropical Atlantic, about 36% ofthe standing stock PN in the upper water column wasderived from diazotrophic activity. This in turn suggests alower limit for total N2 fixation in this region of about850 mmol N* m�2 d�1 based on the total N demand forthese waters. These rates reflect processes occurring on thetimescale of turnover of mixed layer PN, and are somewhathigher than the estimates based on N* distributions in theNorth Atlantic, which likely integrate on a longer timescale.On the basis of a similar approach using isotopic budgets aswell as other data (including limited direct determinations),Karl et al. [1997] have similarly concluded that N2 fixationaccounts for about one half the new nitrogen input at theHawaiian Ocean Time series (HOT) Station ALOHA in thePacific. Scaling our isotopic mass balance based estimatesto the same areas used for the Trichodesmium exerciseyields values of 5.5 to 8.7 � 1012 mol N yr�1, at the highend of the geochemical estimates (Table 5). As for N*, thistemporally and spatially integrative estimate would includethe contribution from all diazotrophs.[39] Lee et al. [2002] have recently analyzed and integrated
the annual decrease in inorganic C (Ct inventory) in nitrate-depleted waters and concluded that 0.2 � 1015 Pg C yr�1
of the new production in the Atlantic from 40�N to 40�Swas supported by nitrogen sources other than subeu-photic zone supplies of NO3
� (Table 5). This amountsto 2.0 � 1012 mol N* yr�1 assuming a C:N ratio inbiomass of 7, and implies an areal rate of N2 fixation of111 mmol N* m�2 d�1. The most intense negative dis-solved inorganic carbon anomalies occurred in the NorthAtlantic. If we assume that the full amount of the integralcalculated by Lee et al. [2002] for the Atlantic Oceanlargely occurred over the 20–30 � 106 km2 of the tropical
GB2024 CAPONE ET AL.: NITROGEN FIXATION IN THE NORTH ATLANTIC
12 of 17
GB2024

North Atlantic, this would amount to daily areal rates in therange of 180 to 270 mmol N* m�2 d�1, in very reasonableagreement with our observations for Trichodesmiumalone.[40] Lee et al. [2002] noted that at the BATS station,
their inferred rates of N2 fixation are much greater thanthose reported for BATS by Orcutt et al. [2001]. How-ever, as noted above, N2 fixation at BATS is limited to avery brief season, and the excess N detected at thatstation is likely formed to the south. Furthermore, theCt method, as with N* and N isotope budgets, provides aspatially and temporally integrated estimate of N cycledynamics, compared to direct biological estimates such asthose provided here. Lee et al. [2002] also noted that themore recent data based on direct measurements from themarine tropics [Capone et al., 1997] were concordantwith their analysis.[41] In contrast to these four studies, a recent examination
of the excess nitrate in the subtropical and tropical NorthAtlantic has come to a more modest conclusion about thebasin-scale significance of N2 fixation. Taking an approachsimilar to the Gruber and Sarmiento [1997] N* analysis,Hansell et al. [2004] used a portion of the data set from theWOCE program in the 1990s and estimated the rate of N2
fixation using the same high value for the N:P ratio oforganic matter produced by diazotrophs as did Gruber andSarmiento [1997]. They found the region of excess nitratecreation in the North Atlantic (and therefore where N2
fixation was putatively occurring) to be only about 6.1 �106 km2 or about one fifth the area reported by Gruber andSarmiento [1997]. This yielded a basin wide value of only0.15 to 0.5 � 1012 mol N* yr�1 (Table 5). Interestingly, theareal rates of N2 fixation over their domain are onlysomewhat lower than our mean (Table 5).[42] The Hansell et al. [2004] estimate for the area of the
basin with active nitrate creation (6.1 � 106 km2) is lessthan the area of our operations (9 � 106 km2). Using a morerealistic N:P value and extrapolating their areal rate to thearea where seawater temperatures are 25�C or above wouldgives a basin estimate of about 2 � 1012 mol N yr�1, morein line with the other geochemical studies.[43] One other component of the dichotomy between
the Hansell et al. [2004] study and the earlier N* studiesmay be the different data sets and interannual variabilityforced by the North Atlantic Oscillation (NAO). Hood etal. [2001] first suggested that the interannual variabilityin N2 fixation noted at BATS may derive from climaticvariation forced by the NAO. Bates and Hansell’s [2004]recently proposed that N2 fixation intensity may vary up tosixfold over the NAO cycle. However, the N* approachshould smooth out some of the interannual variability forthe parts of the signal in waters with multiannual residencetimes. The key open question seems to be the areal extentof N2 fixation.[44] Thus four discrete geochemically based estimates of
N2 fixation using three distinct approaches (N*, Ct inven-tories, and N isotope budgets) in the North Atlantic rangefrom 2 to 9 � 1012 mol N yr�1. In contrast, Hansell et al.[2004] suggest values at least tenfold smaller. Our directmeasurements, derived by methods fully independent of
these geochemical measurements, support the higher values.Trichodesmium N2 fixation alone can account for a sub-stantial fraction of the activity inferred in three of thesestudies and our own stable isotope mass balance.
3.7. Modeling N2 Fixation in the Atlantic
[45] It is only relatively recently that N2 fixation has beenexplicitly represented in ecosystem and biogeochemicalmodels, and several recent efforts have focused specificallyon the North Atlantic basin. Hood et al. [2001] exploited theBATS data set, including observations of Trichodesmiumabundance [Orcutt et al., 2001] in a one-dimensional model.Hood et al. [2004] and Coles et al. [2004a] built further ontheir work at BATS (above), and developed a climatologi-cally forced coupled, 3-dimensional, biological-physicalmodel for the tropical North Atlantic basin, including adynamic representation of Trichodesmium. The model cap-tures and predicts the seasonal and spatial distribution ofTrichodesmium in the basin. While there was a good corre-lation between the model derived distribution and seasonalityand direct observations of Trichodesmium [see Hood et al.,2004, Table 1], the model output also revealed persistentlyhigh Trichodesmium biomass and rates of N2 fixation in theGulf of Guinea off of Africa, a region where there are fewdirect observations of diazotrophs [Dandonneau, 1971].Thus, while benefiting greatly from direct field observa-tions, these complex biological-physical models can alsogenerate testable predictions which can be used to validatethe model and to guide future field campaigns to investigatenew and unexplored regions of N2 fixation.[46] While it has been assumed that the basin scale spatial
extent of Trichodesmium is largely controlled by tempera-ture (>22–25�C [Carpenter et al., 1992], model output alsosuggested that the depth and duration of winter mixing havea stronger control [Hood et al., 2004]. Going one stepfurther, Hood et al. [2004] were able to capture thesuccession of phytoplankton species linked to the physicalsupply of nitrate. Model output describing a temporalprogression from diatoms, to Trichodesmium in responseto the drawdown of nitrate by diatoms, to Trichodesmiumsupported flagellate growth, exemplifies the impact of N2
fixation on the plankton community.[47] The intensity of N2 fixation predicted by the basin
model using observed densities [Coles et al., 2004a] iscomparable to recent direct estimates for Trichodesmium(for which it is tuned), but about 25% of geochemicalestimates which would include the contribution of otherdiazotrophs [Gruber and Sarmiento, 1997]. In order toapproach geochemical derived estimates of N2 fixation(Table 1), Coles et al. [2004a] found that Trichodesmiumbiomass must be increased beyond that observed.[48] Ecosystem models have also been used to investigate
factors that limit N2 fixation in the world’s oceans. Employ-ing a global marine ecosystem mixed-layer model, Mooreet al. [2002b, 2002a] explored a wide variety of marineecosystems, including N, P, and Fe-limited systems, inwhich diazotrophs, as well as other phytoplankton, wererepresented. Direct field data regarding the temperatureconstraints, growth rates, grazing and non-grazing mortal-ity, photo-physiology, Fe requirements, and elemental
GB2024 CAPONE ET AL.: NITROGEN FIXATION IN THE NORTH ATLANTIC
13 of 17
GB2024

stoichiometry of diazotrophs, as well as atmospheric dustdeposition model studies, were used to parameterize thesecomplex models. Moore et al. [2002a] found that thesemodels were able to reproduce the seasonality and biomassof diazotrophs at BATS and, largely in agreement withdirect observations [Wu et al., 2001] and other projections[Berman-Frank et al., 2001; Sanudo-Wilhelmy et al.,2001] described P limitation at BATS and in parts ofthe southwest North Atlantic.[49] Most recently, using monthly climatological satellite
data of sea surface chlorophyll concentrations (from Sea-WiFS) and sea surface height (from TOPEX/Poseidonaltimeter), Coles et al. [2004b] reported an anomaloussummertime maximum in phytoplankton biomass in aregion of highly stratified, nutrient-deprived water in thesouthwest tropical North Atlantic. Employing a climatolog-ical forced biological-physical model with a dynamic rep-resentation of Trichodesmium, Coles et al. [2004b] wereable to simulate this chlorophyll maximum in the westerntropical Atlantic, which was absent when Trichodesmiumwere omitted from the model. The authors concluded thatN2 fixation (Trichodesmium specifically in their model) wasresponsible for this summertime phytoplankton bloom in anotherwise nutrient-starved region. Model and satellite de-rived estimates of N2 fixation were 192 mmol N m�2 d�1
and 220 mmol N m�2 d�1 [Coles et al., 2004a], comparableto both direct and geochemical observations (Table 5).
3.8. Remaining Unknowns
[50] As mentioned above, our direct estimates should stillbe viewed as conservative as they do not capture thecontribution by Trichodesmium blooms, which can resultat times in greatly amplified input of nitrogen to the upperwater column [Capone et al., 1998] or any contribution fromother diazotrophs such as coccoid cyanobacteria, heterotro-phic bacterioplankton, or cyanobacterial endosymbionts.The diazotrophic cyanobacterium, Richelia intracellularis,has long been known to occur as an endosymbiont of thediatoms Hemiaulus hauckii, H. membranaceus, and someRhizosolenia spp. [Zehr et al., 2000]. On our October1996 cruise, we encountered a bloom of this organism offthe northeast coast of South America that was spatiallyextensive, covering about 2500 km along a linear cruisetrack [Carpenter et al., 1999]. The rates of N2 fixationwere among the highest noted in any marine ecosystem(Table 5; we recorded rates of 19,000 mmol N* m�2 d�1
at one station) and our N isotope balance for that cruisesuggests that more than half of the local N demand wasmet by N2 fixation (see above). We again found extensivepopulations on the cruises in July/August of 2001 and inApril/May 2003 in this same region. These symbioses arelikely an important contributor to the total N fixed in thisregion. However, the spatial and temporal extent of theseblooms is poorly constrained, and it is difficult to incor-porate their input into basin scale budgets at present.[51] Coccoid cyanobacteria and bacterioplankton also
contribute to marine N2 fixation. Zehr et al. [2001] haveamplified nifH sequences from coccoid cyanobacteria and aand g proteobacteria in samples from oligotrophic surfacewaters of the North Atlantic and North Pacific [Zehr et al.,
1998] and more recently found expression of nitrogenase inpopulations of coccoid cyanobacteria and eubacteria in theupper water column of Station ALOHA north of Hawaii.Quantifying the magnitude of their input is a currentchallenge, and the magnitude of the contribution of thisdiazotrophic component remains to be rigorously andbroadly evaluated. Several recent studies of 15N2 uptakehave reported a wide range of rates of N2 fixation bysmall cells (<10–20 mm). At Station ALOHA near Hawaii,N2 fixation rates by small cells are measurable but lowrelative to rates reported here for Trichodesmium [Karl etal., 1997; Dore et al., 2002; Montoya et al., 2004]. At othersites in the North Pacific and near Australia, rates of N2
fixation by small cells often exceed the rates reported forTrichodesmium [Montoya et al., 2004]. Preliminary obser-vations in the tropical North Atlantic have found lowerrates ranging from trace to about 100 mmol N* m�2 d�1
(D. G. Capone et al., manuscript in preparation, 2005).Thus we may soon be able to close some of the gap betweenthe geochemical measurements and directly determined ratesof N2 fixation by these other components of the diazotrophiccommunity. In addition to N2 fixation, other N inputs, suchas atmospheric deposition of DON, have also been poorlyquantified in the past [Duce, 1986; Cornell et al., 1995], andmore accurate assessment of their contribution to the oceanicN cycle will help further rectify current discrepancies inbasin scale and oceanic N budgets [Galloway et al., 2004].[52] The controls on oceanic N2 fixation remain to be
fully determined. Clearly, for an organism such as Tricho-desmium, there are important prerequisites for N2 fixationwith respect to the physical environment. Upper watercolumn stability and a relatively shallow mixed layer arecrucial for organisms that have a high compensation pointand require minimal turbulence [Carpenter and Price,1976] and relatively high light conditions [Carpenter,1983b; Carpenter et al., 1993; Hood et al., 2004].[53] With respect to chemical constraints, the extensive
areas of positive N* anomalies in the North Atlantic roughlycorrespond to regions which receive substantial dust inputfrom aeolian deposition [Michaels et al., 1996; Gruber andSarmiento, 1997; Gao et al., 2001]. The recognition thatphotosynthetic diazotrophs have a higher cell quota for iron[Berman-Frank et al., 2001; Kustka et al., 2003] has led tothe general hypothesis that iron enrichment resulting fromdust deposition in the tropical North Atlantic is responsiblefor enhanced levels of diazotrophy in the upper watercolumn of this system [Karl et al., 2002; Capone, 2001].Phosphorus is also present at extremely low concentrationsin the tropical North Atlantic [Wu et al., 2000] and can be alimiting factor [Sanudo-Wilhelmy et al., 2001, 2004]. Thefrequent occurrence of dense populations of these organ-isms in areas of uniform, widespread phosphate depletion[Carpenter, 1983a; Carpenter et al., 2004] indicates that thelocal controls on this process are still not well understood[Karl et al., 2002].
3.9. The Shifting Paradigm
[54] Our results demonstrate directly the importance ofoceanic N2 fixation and should promote the ongoing para-digm shift in how the community conceptualizes the nitro-
GB2024 CAPONE ET AL.: NITROGEN FIXATION IN THE NORTH ATLANTIC
14 of 17
GB2024

gen cycle of the tropical Atlantic Ocean. Although effortsare currently underway to incorporate N2 fixation as anexplicit term in ocean biogeochemical models in order toassess its importance in global carbon dynamics [e.g.,Tyrrell, 1999; Hood et al., 2000, 2004; Coles et al.,2004a], many N-based ecosystem models for the tropicalNorth Atlantic continue to overlook this important process,focusing solely on nitrate flux from deep waters as a sourceof new nitrogen to the euphotic zone [Oschlies and Koeve,2000; Christian and Murtugudde, 2003]. Oschlies [2002b]found that although his model can reproduce nitrate fluxesextremely well, it underpredicts primary production in thesouthern subtropical gyre. One process he notes that he hadnot taken into account in his model is N2 fixation.[55] Accurate determination of oceanic N2 fixation may
also be critical for estimating biological removal of inor-ganic C from the upper layers of the ocean. New productiondependent upon N2 fixation can effect a net removal of DICfrom the euphotic zone, in contrast to production dependentupon NO3
� from depth, which co-diffuses with inorganiccarbon in Redfield proportions [Eppley and Peterson, 1979;Karl et al., 2002; Michaels et al., 2001]. The assumptionthat vertical NO3
� flux is the sole, or even predominantsource of new N in tropical oligotrophic systems should bediscarded, and models that are based on this assumptionshould be used with great caution: If they obtain goodmatches with the data, it may be for the wrong reason.Tropical ocean nitrogen and carbon cycles can only beunderstood if N2 fixation is included as a major source ofnew nitrogen to the upper water column.
[56] Acknowledgments. The authors gratefully acknowledge thesustained support of the Biological Oceanography Program of the OceanSciences Division, U.S. National Science Foundation. The latter threecruises were undertaken as part of the NSF Biocomplexity in the Environ-ment Program. We also extend our thanks to the Captains and crews of theR.V. Gyre, Seward Johnson, and Knorr and to the numerous students,postdoctoral associates, and support staff who contributed to this effort. Weparticularly thank Janet Barnes, Pilar Heredia, Genevieve Aldridge,Michael Neumann, Chris Payne and Dennis Guffey. This is LDEOcontribution LDEO 6747.
ReferencesAltabet, M. A. (1988), Variations in nitrogen isotopic composition betweensinking and suspended particles: Implications for nitrogen cycling andparticle transformation in the open ocean, Deep Sea Res., 35, 535–554.
Bates, N., and D. Hansell (2004), Temporal variability of excess nitrogen inthe subtropical mode water of the North Atlantic Ocean, Mar. Chem., 84,225–241.
Berman-Frank, I., J. Cullen, Y. Hareli, R. Sherrell, and P. G. Falkowski(2001), Iron availability, cellular iron quotas, and nitrogen fixation inTrichodesmium, Limnol. Oceanogr., 46, 1249–1277.
Brandes, J., A. Devol, T. Yoshinari, D. Jayakumar, and S. Naqvi (1998),Isotopic composition of nitrate in the central Arabian Sea and easterntropical North Pacific: A tracer for mixing and nitrogen cycles, Limnol.Oceanogr., 43, 1680–1689.
Capone, D. G. (1993), Determination of nitrogenase activity in aquaticsamples using the acetylene reduction procedure, in Handbook of Meth-ods in Aquatic Microbial Ecology, edited by P. F. Kemp et al., pp. 621–631, Lewis, Boca Raton, Fla.
Capone, D. G. (2001), Marine nitrogen fixation: What’s the fuss?, Curr.Opinions Microbiol., 4, 341–348.
Capone, D. G., and E. J. Carpenter (1999), Nitrogen fixation by marinecyanobacteria: Historical and global perspectives, Bull. Inst. Oceanogr.Monaco, 19, 235–256.
Capone, D. G., M. D. Ferrier, and E. J. Carpenter (1994), Cycling andrelease of glutamate and glutamine in colonies of the marine planktonic
cyanobacterium, Trichodesmium thiebautii, Appl. Environ. Microbiol.,60, 3989–3995.
Capone, D. G., J. Zehr, H. Paerl, B. Bergman, and E. J. Carpenter (1997),Trichodesmium: A globally significant marine cyanobacterium, Science,276, 1221–1229.
Capone, D. G., A. Subramaniam, J. Montoya, M. Voss, C. Humborg,A. Johansen, R. Siefert, and E. J. Carpenter (1998), An extensivebloom of the N2-fixing cyanobacterium, Trichodesmium erythraeum,in the central Arabian Sea, Mar. Ecol. Prog. Ser., 172, 281–292.
Carpenter, E. J. (1973), Nitrogen fixation by Oscillatoria (Trichodesmium)thiebautii in the southwestern Sargasso Sea, Deep Sea Res., 20, 285–288.
Carpenter, E. J. (1983a), Nitrogen fixation by marine Oscillatoria (Tricho-desmium) in the world’s oceans, in Nitrogen in the Marine Environment,edited by E. J. Carpenter and D. G. Capone, pp. 65–103, Elsevier, NewYork.
Carpenter, E. J. (1983b), Physiology and ecology of marine Oscillatoria(Trichodesmium), Mar. Biol. Lett., 4, 69–85.
Carpenter, E. J., and C. C. Price (1976), Marine Oscillatoria (Trichodes-mium): Explanation for aerobic nitrogen fixation without heterocysts,Science, 191, 1278–1280.
Carpenter, E. J., and C. C. Price (1977), Nitrogen fixation, distribution, andproduction of Oscillatoria (Trichodesmium) in the northwestern AtlanticOcean and Caribbean Sea, Limnol. Oceanogr., 22, 60–72.
Carpenter, E. J., and K. Romans (1991), Major role of the cyanobacteriumTrichodesmium in nutrient cycling in the north Atlantic Ocean, Science,254, 1356–1358.
Carpenter, E. J., D. G. Capone, and J. G. Rueter (1992), Marine PelagicCyanobacteria: Trichodesmium and Other Diazotrophs, 357 pp.,Springer, New York.
Carpenter, E. J., J. M. O’Neil, R. Dawson, D. G. Capone, P. J. A. Siddiqui,T. Roenneberg, and B. Bergman (1993), The tropical diazotrophicphytoplankton Trichodesmium: Biological characteristics of two commonspecies, Mar. Ecol. Prog. Ser., 95, 295–304.
Carpenter, E. J., J. P. Montoya, J. Burns, M. Mulholland, A. Subramaniam,and D. G. Capone (1999), Extensive bloom of a N2 fixing symbioticassociation in the tropical Atlantic Ocean, Mar. Ecol. Prog. Ser., 188,273–283.
Carpenter, E. J., A. Subramaniam, and D. G. Capone (2004), Biomass andprimary productivity of the cyanobacterium, Trichodesmium spp., in thesouthwestern tropical N. Atlantic Ocean, Deep Sea Res., Part I, 51, 173–203.
Christian, J. R., and R. Murtugudde (2003), Tropical Atlantic variability ina coupled physical-biogeochemical ocean model, Deep Sea Res., Part II,50, 2947–2969.
Coles, V. J., R. R. Hood, M. Pascual, and D. G. Capone (2004a), Modelingthe impact of Trichodesmium and nitrogen fixation in the Atlantic Ocean,J. Geophys. Res., 109, C06007, doi:10.1029/2002JC001754.
Coles, V. J., C. Wilson, and R. R. Hood (2004b), Remote sensing of newproduction fuelled by nitrogen fixation, Geophys. Res. Lett., 31, L06301,doi:10.1029/2003GL019018.
Cornell, S., A. Rendell, and T. Jickells (1995), Atmospheric input of dis-solved organic nitrogen in the oceans, Nature, 376, 243–246.
Dandonneau, Y. (1971), Etude du phytoplancton sur le plateau de Coted’Ivoire: I. Groupes d’especes associees, Cah. O.R.S.T.O.M., Ser. Ocean-ogr., IX, 247–265.
Dore, J. E., J. R. Brum, L. M. Tupas, and D. M. Karl (2002), Seasonal andinterannual variability in sources of nitrogen supporting export in theoligotrophic subtropical North Pacific Ocean, Limnol. Oceanogr., 47,1595–1607.
Duce, R. A. (1986), The impact of atmospheric nitrogen, phosphorus andiron species on marine biological productivity, in The Role of Air-SeaExchange in Geochemical Cycling, edited by P. Buat-Menard, pp. 487–529, Springer, New York.
Dugdale, R. C., and J. J. Goering (1967), Uptake of new and regeneratedforms of nitrogen in primary productivity, Limnol. Oceanogr., 12, 196–206.
Eppley, R. W., and B. J. Peterson (1979), Particulate organic matter fluxand planktonic new production in the deep ocean, Nature, 282, 677–680.
Fratantoni, D., and D. Glickson (2002), North Brazil current ring generationand evolution observed with SeaWiFS, J. Phys. Oceanogr., 32, 1058–1074.
Galloway, J., et al. (2004), Nitrogen cycles: Past, present and future, Bio-geochemistry, 70, 153–226.
Gao, Y., J. Kaufman, D. Tanre, D. Kolber, and P. G. Falkowski (2001),Seasonal distribution of aeolian iron fluxes to the global ocean, Geophys.Res. Lett., 28, 29–32.
GB2024 CAPONE ET AL.: NITROGEN FIXATION IN THE NORTH ATLANTIC
15 of 17
GB2024

Glibert, P. M., and D. A. Bronk (1994), Release of dissolved organicnitrogen by marine diazotrophic cyanobacteria, Trichodesmium spp.,Appl. Environ. Microbiol., 60, 3996–4000.
Goering, J. J., R. C. Dugdale, and D. Menzel (1966), Estimates of in siturates of nitrogen uptake by Trichodesmium sp. in the tropical AtlanticOcean, Limnol. Oceanogr., 11, 614–620.
Gruber, N., and J. Sarmiento (1997), Global patterns of marine nitrogenfixation and denitrification, Global Biogeochem. Cycles, 11, 235–266.
Hansell, D., N. Bates, and D. Olson (2004), Excess nitrate and nitrogenfixation in the North Atlantic Ocean, Mar. Chem., 84, 243–265.
Hood, R. R., A. M. Michaels, and D. G. Capone (2000), Answers sought tothe enigma of marine nitrogen fixation, Eos Trans. AGU, 81, 133, 138–139.
Hood, R. R., N. R. Bates, D. G. Capone, and D. B. Olson (2001), Modelingthe effects of N2-fixation on carbon and nitrogen fluxes at BATS, DeepSea Res., Part II, 48, 1609–1648.
Hood, R. R., V. J. Coles, and D. G. Capone (2004), Modeling thedistribution of Trichodesmium and nitrogen fixation in the AtlanticOcean, J. Geophys. Res., 109, C06006, doi:10.1029/2002JC001753.
Jenkins, W. J. (1988), Nitrate flux into the euphotic zone near Bermuda,Nature, 331, 521–523.
Jenkins, W. J., and S. C. Doney (2003), The subtropical nutrient spiral,Global Biogeochem. Cycles, 17(4), 1110, doi:10.1029/2003GB002085.
Johns, W. E., T. N. Lee, F. A. Schott, R. J. Zantopp, and R. H. Evans(1990), The North Brazil current retroflection: Seasonal structure andeddy variability, J. Geophys. Res., 95(C12), 22,103–22,120.
Karl, D. M., R. Letelier, D. V. Hebel, D. F. Bird, and C. D. Winn (1992),Trichodesmium blooms and new nitrogen in the north Pacific gyre, inMarine Pelagic Cyanobacteria: Trichodesmium and other Diazotrophs.,edited by E. J. Carpenter, D. G. Capone, and J. G. Rueter, pp. 219–237,Springer, New York.
Karl, D., R. Letelier, L. Tupas, J. Dore, J. Christian, and D. Hebel (1997),The role of nitrogen fixation in biogeochemical cycling in the subtropicalNorth Pacific Ocean, Nature, 386, 533–538.
Karl, D. M., A. Michaels, B. Bergman, D. G. Capone, E. J. Carpenter,R. Letelier, F. Lipschultz, H. Paerl, D. Sigman, and L. Stal (2002),Dinitrogen fixation in the world’s oceans, Biogeochemistry, 57, 47–98.
Kustka, A., S. Sanudo-Wilhelmy, E. J. Carpenter, D. G. Capone, and J. A.Raven (2003), A revised estimate of the Fe use efficiency of nitrogenfixation, with special reference to the marine N2 fixing cyanobacterium,Trichodesmium spp. (Cyanophyta), J. Phycol., 39, 12–25.
Law, C. S., A. P. Martin, M. I. Liddicoat, A. J. Watson, K. J. Richards, andE. M. S. Woodward (2001), A Lagrangian SF6 tracer study of an antic-yclonic eddy in the North Atlantic: Patch evolution, vertical mixing andnutrient supply to the mixed layer, Deep Sea Res., Part II, 48, 705–724.
Ledwell, J. R., A. J. Watson, and C. S. Law (1993), Evidence for slowmixing across the pycnocline from an open-ocean tracer-release experi-ment, Nature, 364, 701–703.
Ledwell, J. R., A. J. Watson, and C. S. Law (1998), Mixing of a tracer in thepycnocline, J. Geophys. Res., 103(C10), 21,499–21,529.
Lee, K., D. Karl, R. Wanninkhof, and J.-Z. Zhang (2002), Global estimateof net carbon production in the nitrate-depleted tropical and sub-tropicalocean, Geophys. Res. Lett., 29(19), 1907, doi:10.1029/2001GL014198.
Legendre, L., and M. Gosselin (1989), New production and export oforganic matter to the deep ocean: Consequences of some recent discov-eries, Limnol. Oceanogr., 34, 1374–1380.
Letelier, R. M., and D. M. Karl (1996), Role of Trichodesmium spp. in theproductivity of the subtropical North Pacific Ocean, Mar. Ecol. Prog.Ser., 133, 263–273.
Lewis, M. R., W. G. Harrison, N. S. Oakey, D. Herbert, and T. Platt (1986),Vertical nitrate fluxes in the oligotrophic ocean, Science, 234, 870–873.
Lipschultz, F., and N. J. P. Owens (1996), An assessment of nitrogenfixation as a source of nitrogen to the North Atlantic Ocean, Biogeochem-istry, 35, 261–274.
Mahaffey, C., R. G. Williams, G. A. Wolff, N. Mahowald, W. Anderson,and M. Woodward (2003), Biogeochemical signatures of nitrogen fixa-tion in the eastern North Atlantic, Geophys. Res. Lett., 30(6), 1300,doi:10.1029/2002GL016542.
Mahaffey, C., A. F. Michaels, and D. G. Capone (2005), The conundrum ofmarine nitrogen fixation, Am. J. Sci., in press.
McCarthy, J. J., and E. J. Carpenter (1983), Nitrogen cycling in near-surface waters of the open ocean, in Nitrogen in the Marine Environ-ment, edited by E. J. Carpenter and D. G. Capone, pp. 487–512,Elsevier, New York.
McClelland, J. W., C. M. Holl, and J. P. Montoya (2003), Nitrogen sourcesto zooplankton in the tropical North Atlantic: Stable isotope ratios ofamino acids identify strong coupling to N2-fixation, Deep Sea Res.,Part I, 50, 849–861.
McGillicuddy, D. J., and A. R. Robinson (1997), Eddy-induced nutrientsupply and new production in the Sargasso Sea, Deep Sea Res., Part I,44, 1427–1450.
McGillicuddy, D. J., R. Johnson, D. A. Siegel, A. F. Michaels, N. R. Bates,and A. H. Knap (1999), Mesoscale variations of biogeochemical proper-ties in the Sargasso Sea, J. Geophys. Res., 104(C6), 13,381–13,394.
McGillicuddy, D. J., L. A. Anderson, S. C. Doney, and M. E. Maltrud(2003), Eddy-driven sources and sinks of nutrients in the upper ocean:Results from a 0.1� resolution model of the North Atlantic, Global Bio-geochem. Cycles, 17(2), 1035, doi:10.1029/2002GB001987.
Michaels, A. F., N. R. Bates, K. O. Buesseler, C. A. Carlson, and A. H.Knap (1994), Carbon-cycle imbalances in the Sargasso sea, Nature, 372,537–540.
Michaels, A. F., D. Olson, J. L. Sarmiento, J. W. Ammerman, K. Fanning,R. Jahnke, A. H. Knap, F. Lipschultz, and J. M. Prospero (1996), Inputs,losses and transformations of nitrogen and phosphorus in the pelagicNorth Atlantic Ocean, Biogeochemistry, 35, 181–226.
Michaels, A., D. Karl, and D. Capone (2001), Element stoichiometry, newproduction and nitrogen fixation, Oceanography, 14, 68–77.
Mills, M. M., C. Ridame, M. Davey, J. LaRoche, and R. J. Geider (2004),Iron and phosphorus co-limit nitrogen fixation in the eastern tropicalNorth Atlantic, Nature, 429, 292–294.
Montoya, J. P., M. Voss, P. Kaehler, and D. G. Capone (1996), A simple,high precision tracer assay for dinitrogen fixation, Appl. Environ. Micro-biol., 62, 986–993.
Montoya, J., E. Carpenter, and D. Capone (2002), Nitrogen fixation andnitrogen isotope abundance in zooplankton of the oligotrophic NorthAtlantic, Limnol. Oceanogr., 47, 1617–1628.
Montoya, J. P., C. M. Holl, J. P. Zehr, A. Hansen, T. Villareal, and D. G.Capone (2004), High rates of N2-fixation by unicellular diazotrophs inthe oligotrophic Pacific, Nature, 430, 1027–1031.
Moore, J. K., S. C. Doney, D. M. Glover, and I. Y. Fung (2002a), Ironcycling and nutrient-limitation patterns in surface waters of the worldocean, Deep Sea Res., Part II, 49, 463–507.
Moore, J. K., S. C. Doney, J. A. Kleypas, D. M. Glover, and I. Y. Fung(2002b), An intermediate complexity marine ecosystem model for theglobal domain, Deep Sea Res., Part II, 49, 403–462.
Mulholland, M., K. Ohki, and D. G. Capone (1999), Nitrogen utilizationand metabolism relative to patterns of N2 fixation in cultures of Tricho-desmium NIBB 1067, J. Phycol., 35, 977–988.
Mulholland, M. R., D. A. Bronk, and D. G. Capone (2004), Dinitrogenfixation and release of ammonium and dissolved organic nitrogen byTrichodesmium IMS101, Aquat. Microb. Ecol., 37, 85–94.
Orcutt, K. M., F. Lipschultz, K. Gundersen, R. Arimoto, A. F. Michaels,A. H. Knap, and J. R. Gallon (2001), A seasonal study of the signifi-cance of N2 fixation by Trichodesmium spp. at the Bermuda AtlanticTime-series Study (BATS) site, Deep Sea Res., Part II, 48, 1583–1608.
Oschlies, A. (2002a), Can eddies make ocean deserts bloom?, Global Bio-geochem. Cycles, 16(4), 1106, doi:10.1029/2001GB001830.
Oschlies, A. (2002b), Nutrient supply to the surface waters of theNorth Atlantic, J. Geophys. Res., 107(C5), 3046, doi:10.1029/2000JC000275.
Oschlies, A., and W. Koeve (2000), An eddy-permitting coupled physical-biological model of the North Atlantic: Ecosystem dynamics and com-parison with satellite and JGOFS local study data, Global Biogeochem.Cycles, 14, 499–523.
Parsons, T. R., Y. Maita, and C. M. Lalli (1984), A Manual of Chemical andBiological Methods for Seawater Analysis, 173 pp., Elsevier, New York.
Planas, D., S. Agusti, C. Duarte, T. Granata, and M. Merino (1999), Nitrateuptake and diffusive nitrate supply in the central Atlantic, Limnol. Ocean-ogr., 44, 116–126.
Platt, T., P. Jauhari, and S. Sathyendranath (1992), The importance andmeasurement of new production, in Primary Productivity and Biogeo-chemical Cycles in the Sea, edited by P. G. Falkowski and A. D.Woodhead, pp. 273–284, Springer, New York.
Postgate, J. R. (1998), The Fundamentals of Nitrogen Fixation, CambridgeUniv. Press, New York.
Saino, T., and A. Hattori (1982), Aerobic nitrogen fixation by the marinenon-heterocystous cyanobacterium Trichodesmium (Oscillatoria) spp.: Itsprotective mechanism against oxygen, Mar. Biol., 70, 251–254.
Sanudo-Wilhelmy, S. A., A. B. Kustka, C. J. Gobler, D. A. Hutchins,M. Yang, K. Lwiza, J. Burns, D. G. Capone, J. A. Raven, and E. J.Carpenter (2001), Phosphorus limitation of nitrogen fixation by Tricho-desmium in the central Atlantic Ocean, Nature, 411, 66–69.
Sanudo-Wilhelmy, S. A., A. Tovar-Sanchez, F.-X. Fu, D. G. Capone, E. J.Carpenter, and D. A. Hutchins (2004), The impact of surface-adsorbedphosphorus on phytoplankton Redfield stoichiometry, Nature, 432, 897–901.
GB2024 CAPONE ET AL.: NITROGEN FIXATION IN THE NORTH ATLANTIC
16 of 17
GB2024

Schlitzer, R. (2004), Ocean data view, report, Alfred Wegener Inst., Bre-merhaven, Germany. (Available at http://www.awi-bremerhaven.de/GEO/ODV)
Scranton, M. I. (1984), Hydrogen cycling in the waters near Bermuda: Therole of the nitrogen fixer, Oscillatoria thiebautii, Deep Sea Res., 31,133–143.
Siegel, D. A., D. J. McGillicuddy Jr., and E. A. Fields (1999), Mesoscaleeddies, satellite altimetry, and new production in the Sargasso Sea,J. Geophys. Res., 104(C6), 13,359–13,379.
Sweeney, E. N., D. J. McGillicuddy Jr., and K. O. Buesseler (2003), Bio-geochemical impacts due to mesoscale eddy activity in the Sargasso Seaas measured at the Bermuda Atlantic Time-series Study (BATS), DeepSea Res., Part II, 50, 3017–3039.
Tyrrell, T. (1999), The relative influences of nitrogen and phosphorus onoceanic primary production, Nature, 400, 525–531.
Tyrrell, T., E. Maranon, A. J. Poulton, A. R. Bowie, D. S. Harbour, andE. M. S. Woodward (2003), Large-scale latitudinal distribution ofTrichodesmium spp. in the Atlantic Ocean, J. Plankton Res., 25,405–416.
Voss, M., P. Croot, K. Lochte, M. Mills, and I. Peeken (2004), Patterns ofnitrogen fixation along 10�N in the tropical Atlantic, Geophys. Res. Lett.,31, L23S09, doi:10.1029/2004GL020127.
Wessel, P., and W. H. F. Smith (1998), New, improved version of GenericMapping Tools released, Eos Trans. AGU, 79, 579.
Williams, R., A. McLaren, and M. Follows (2000), Estimating the convec-tive supply of nitrate and implied variability in export production over theNorth Atlantic, Global Biogeochem. Cycles, 14, 1299–1313.
Wu, J., W. Sunda, E. A. Boyle, and D. M. Karl (2000), Phosphate depletionin the western North Atlantic Ocean, Science, 289, 759–762.
Wu, J., E. Boyle, W. Sunda, and L. Wen (2001), Soluble and colloidaliron in the oligotrophic North Atlantic and North Pacific, Science, 293,847–849.
Zehr, J. P., and B. B. Ward (2002), Nvsitrogen cycling in the ocean: Newperspectives on processes and paradigms, Appl. Environ. Microbiol., 68,1015–1024.
Zehr, J. P., M. T. Mellon, and S. Zani (1998), New nitrogen-fixing micro-organisms detected in oligotrophic oceans by the amplification of nitro-genase (nifH) genes, Appl. Environ. Microbiol., 64, 3444–3450.
Zehr, J. P., E. J. Carpenter, and T. A. Villareal (2000), New perspectives onnitrogen-fixing microorganisms in subtropical and tropical open oceans,Trends Microbiol., 8, 68–73.
Zehr, J., J. Waterbury, P. Turner, J. Montoya, E. Omoregie, G. Steward,A. Hansen, and D. Karl (2001), Unicellular cyanobacteria fix N2 in thesubtropical North Pacific Ocean, Nature, 412, 635–638.
Zhang, J. Z., R. Wanninkhof, and K. Lee (2001), Enhanced new productionobserved from the diurnal cycle of nitrate in an oligotrophic anticycloniceddy, Geophys. Res. Lett., 28, 1579–1582.
�������������������������J. A. Burns, Quileute Natural Resources, P. O. Box 187, 401 Main
Street, LaPush, WA 98350-0187, USA.D. G. Capone, T. Gunderson, and A. F. Michaels, Wrigley Institute for
Environmental Studies and Department of Biological Sciences, Universityof Southern California, Los Angeles, CA 90275, USA. ([email protected])E. J. Carpenter, Romberg Tiburon Center, San Francisco State University,
Tiburon, CA 94920, USA.C. Mahaffey, Department of Oceanography, School of Ocean and Earth
Science and Technology, University of Hawaii, Honolulu, HI 96822, USA.J. P. Montoya, School of Biology, Georgia Institute of Technology,
Atlanta, GA 30332, USA.A. Subramaniam, Lamont Doherty Earth Observatory of Columbia
University, Palisades, NY 10964, USA.
GB2024 CAPONE ET AL.: NITROGEN FIXATION IN THE NORTH ATLANTIC
17 of 17
GB2024


![The Genetics of Symbiotic Nitrogen Fixation: … › id › eprint › 7978 › ...nitrogen fixation as an alternative to nitrogen fertilizers is forecast to increase [1]. Symbiotic](https://img.pdfslide.us/doc/110x75/5f28b87fa2f7bf549f1d9235/the-genetics-of-symbiotic-nitrogen-fixation-a-id-a-eprint-a-7978-a-.jpg)