Embed Size (px)
Citation preview
13 (4): 544-xxx (2006)13 (4): 544-556 (2006)
Although the ecology and distribution of treelines have been studied for more than a century, the factors that limit tree establishment and growth at treelines are still debated (Stevens & Fox, 1991; Körner, 1998; Jobbagy & Jackson, 2000; Sveinbjörnsson, 2000; Sveinbjörnsson, Hofgaard & Lloyd, 2002). In this study, we define treeline as the zone or
ecotone containing upright trees > 3 m tall between a forest ecosystem and an alpine or arctic ecosystem.
Nutrient limitation has often been considered one fac-tor restricting plant growth at treeline; however, evidence that treeline stands have a greater degree of nutrient limita-tion than forested stands has been challenged. For example, Schulze, Chapin, and Gebauer (1994) reported nitrogen (N) to be the nutrient most limiting to white spruce (Picea glauca) near circumpolar treeline in the Brooks Range, Alaska; however, Sveinbjörnsson (2000) found no differen-tial limitation of N in white spruce between the treeline and
Nitrogen cycling at treeline: Latitudinal and elevational patterns across a boreal landscape1
Patricia F. LOOMIS2, Institute of Arctic Biology, 211 Irving I, University of Alaska–Fairbanks, Alaska 99775, USA.Roger W. RUESS, Institute of Arctic Biology, 311 Irving I, University of Alaska–Fairbanks, Alaska 99775, USA.Bjartmar SvEINBJöRNSSON, Department of Biological Sciences, University of Alaska–Anchorage,
3211 Providence Drive, Anchorage, Alaska 99508, USA.Knut KIELLAND, Institute of Arctic Biology, 311 Irving I, University of Alaska–Fairbanks,
Alaska 99775, USA.
Abstract: We studied spatial and temporal patterns of nitrogen pools and fluxes in soils at treeline and forested sites within three mountain ranges across a 785-km transect in Alaska during 2001–2002. We measured pools of soil mineral (ammonium and nitrate) and organic (amino acid and microbial biomass) nitrogen, in situ rates of net mineralization, net nitrification, net amino acid production, and decomposition, as well as soil carbon turnover in a laboratory incubation experiment. Soils at treeline were mostly colder than forested soils, particularly during fall and over winter, and had reduced rates of nitrogen cycling and litter decomposition relative to forested stands. Treeline soils also had lower rates of potential respiration per unit carbon, suggesting reduced soil organic matter quality relative to forest soils. Therefore, effects of both colder temperatures and poorer substrate quality appeared to suppress rates of nitrogen turnover at treeline. Seasonal patterns of nitrogen turnover were similar across latitudes (i.e., mountain ranges). On average, 70% of total annual net nitrogen mineralization occurred from August through May, suggesting that fall and winter are critical periods for soil nitrogen transformations in both forested and treeline ecosystems. Among mountain ranges, pool sizes and fluxes of nitrogen were similar despite significant variation in growing season length and mean annual temperatures. Soil moisture and soil organic matter quality may have stronger effects on variation in nitrogen cycling than temperature at our sites.Keywords: amino acids, mineralization, nitrogen cycling, seasonal patterns, treeline, winter.
Résumé : Nous avons étudié les patrons temporels et spatiaux du contenu et des flux d’azote dans le sol à la limite des arbres et dans des sites forestiers dans trois chaînes de montagnes le long d’un transect de 785 km en Alaska en 2001-2002. Nous avons mesuré le contenu du sol en azote minéral (ammonium et nitrate) et en azote organique (acides aminés et biomasse microbienne), les taux in situ de minéralisation nette, de nitrification nette, de production nette d’acide et de décomposition ainsi que le renouvellement du carbone du sol dans une expérience d’incubation en laboratoire. Les sols à la limite des arbres étaient en général plus froids que les sols forestiers, particulièrement durant l’automne et au cours de l’hiver et ils avaient des taux de cyclage d’azote et de décomposition de litière plus faibles que ceux des sites forestiers. Les sols à la limite des arbres avaient aussi des taux plus faibles de respiration potentielle par unité de carbone ce qui suggère que la matière organique des ces sols est de moins bonne qualité que celle des sols forestiers. Par conséquent, l’effet combiné de températures plus froides et d’un substrat de moins bonne qualité semble réduire les taux de renouvellement de l’azote à la limite des arbres. Les patrons saisonniers du renouvellement de l’azote étaient similaires à toutes les latitudes (i.e., entre les chaînes de montagnes). En moyenne, 70% de la minéralisation nette annuelle totale de l’azote se produisait de août à mai suggérant que l’automne et l’hiver sont des périodes critiques pour la transformation de l’azote du sol dans les écosystèmes forestiers et de la limite des arbres. Le contenu et les flux d’azote dans le sol étaient similaires entre les différentes chaînes de montagnes malgré des variations significatives dans la longueur de la saison de croissance et dans les températures moyennes annuelles. Il se peut donc que dans nos sites, l’humidité du sol et la qualité de la matière organique aient des effets plus importants que la température sur les variations du cycle de l’azote.Mots-clés : acides aminés, cyclage de l’azote, hiver, limite des arbres, minéralisation, patrons saisonniers.
Nomenclature: Flora of North America, 1993-; Hulten, 1968.
Introduction
1Rec. 2006-01-30; acc. 2006-06-28. Associate Editor: Tim Moore.2Author for correspondence. Current address: ABR Inc., P. O. Box 80410, Fairbanks 99709, Alaska, USA, e-mail: [email protected]
ÉCOSCIENCE, vOl. 13 (4), 2006
545
contiguous forest in the Chugach Range, Alaska. Nitrogen is often considered the most limiting nutrient to primary production in terrestrial plants (vitousek & Howarth, 1991), especially at high latitudes, where soils are dominated by cold temperatures and recalcitrant organic matter with low rates of decomposition (Nadelhoffer et al., 1992; Hobbie et al., 2000). Previous studies have emphasized that net rates of annual N mineralization fail to account for the annual N demand by plants in both boreal forest (Ruess et al., 1996) and arctic tundra ecosystems (Kielland, 1994; Schimel & Chapin, 1996). Current research indicates that organic N, particularly dissolved amino acids, constitutes a large por-tion of the N budget of plants in these high latitude ecosys-tems (Kielland, 1994; Lipson & Näsholm, 2001; McFarland et al., 2002). It follows that organic N may play a prominent role in the N economy of treeline plants. Because competi-tion between plants and soil microorganisms for amino acids is high during the growing season (Kaye & Hart, 1997; Jonasson et al., 1999; McFarland et al., 2002), study-ing the temporal patterns of both organic and inorganic N availability may be relevant in describing patterns of N availability between treeline and forested systems.
Research on the seasonal patterns of N cycling has shown that N sequestered in soil microbial biomass over winter can be released as a large flush during early spring (Brooks, Williams & Schmidt, 1998; Lipson, Schmidt & Monson, 1999). In N-limited systems, this over-winter sequestration of N in microbial biomass may serve to retain N in the system during snow melt and may subsequently constitute a large portion of the annual N available to plants (Brooks, Williams & Schmidt, 1998; Lipson, Schmidt & Monson, 2000). Moreover, prolonging the period of snow cover with a snow fence significantly increased subnival microbial N transformations (Brooks et al., 1995; Walker et al., 1999; Schimel, Bilbrough & Welker, 2004). The lower threshold for microbial activity in arctic soils is thought to be between -5 °C (Clein & Schimel, 1995) and -10 °C (Michaelson & Ping, 2003). Because the treeline ecotone is characterized by frequent high winds that can compact and potentially reduce the insulative properties of the snowpack (Pomeroy & Brun, 2001), soil temperatures may be lower in treeline soils compared with forested stands. Treelines may thus be subjected to a more variable climatic regime, with greater frequencies of freeze–thaw and/or wet–dry cycles than forested areas. These disturbances may result in reduced N accumulation within microbial biomass during winter and lower N availability at treeline throughout the growing season relative to forested areas.
We studied pools and fluxes of mineral, amino acid, and microbial biomass N at treeline and forested sites in three mountain ranges in Alaska for one year. Concurrently, we assessed site effects on decomposition with a common litter experiment. We also assessed intrinsic soil effects on decomposition with an incubation experiment in the labora-tory. Our objective was to characterize general spatial and temporal patterns of N cycling within treeline and forested landscapes across a latitudinal transect of mountain ranges and to identify any commonalities in soil N cycling at mul-tiple scales. We hypothesized that both N mineralization and soil organic matter quality would be lower at treeline sites
relative to forested sites, and would decrease with increas-ing latitude, due to direct and indirect effects of colder and more variable soil temperatures on these parameters.
MethodsStudy arEa
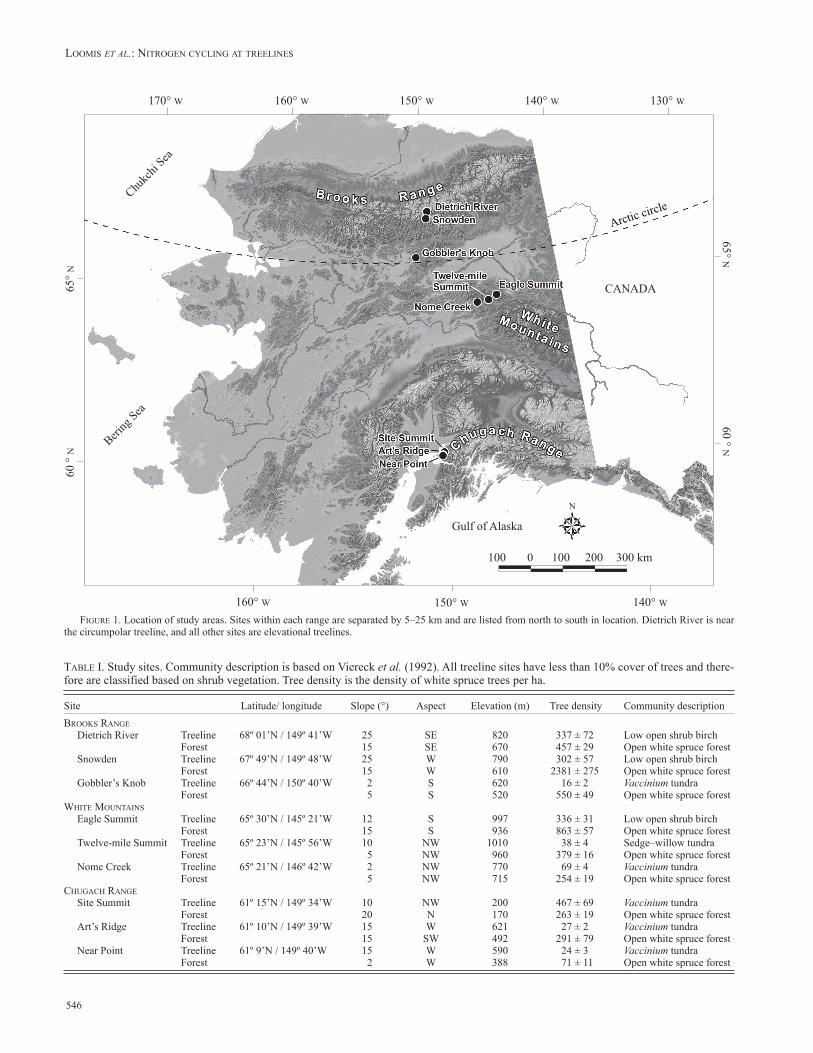
Study areas were located at three paired treeline and forest sites within each of three mountain ranges along a 785-km latitudinal transect in Alaska. Regions of study (Figure 1) included a dry arctic climate (Brooks Range), a cool interior (White Mountains), and a wet coastal climate (Chugach Range). One site within the Brooks Range was at circumpolar treeline, while the remaining sites were at elevational treeline. Treeline sites were established within the zone of sparse but upright trees (> 3 m) below the krummholz zone, when present. Each forested site was established within the forest, 0.5 to 1 km down-slope from the associated treeline site. All sites were located in white spruce–dominated forests, although black spruce, Picea mariana, was present at some sites. Aspect, elevation, and vegetation varied among sites (Table I).
The Western Regional Climate Center for individual population centres in Alaska, within or near each range, provided data for average climate for each region (http://www.wrcc.dri.edu). At Bettles in the Brooks Range, mean air temperatures for January and July are -25 °C and 15 °C, respectively, and mean annual precipitation is 354 mm. At Circle City near the White Mountains, mean air tempera-tures for January and July are -27 °C and 16 °C, respec-tively, and mean annual precipitation is 207 mm. However, Circle City is at a low elevation, and previous research in the White Mountains demonstrated that high-elevation areas are much wetter than low-elevation areas (Lloyd & Fastie, 2002). In Anchorage, near but lower in elevation than our sites in the Chugach Range, mean air tempera-tures for January and July are -10 °C and 15 °C, and mean annual precipitation is 400 mm.
NItrOgEN CyClINg
To assess spatial and seasonal patterns of pools and fluxes of dissolved inorganic N (DIN), amino acid N (AAN), and microbial biomass N (MBN), we conducted in situ soil incubations at four time periods during May 2001–May 2002: spring thaw, peak growing season, fall senescence, and over-winter. The goal was to be consistent in sampling each of these time periods within each moun-tain range, which was possible due to the 3–4 week lag in phenology (e.g., budbreak) between the southernmost and northernmost sites. Sites were sampled in order from south to north. During the spring 2002 sampling period, soils in the Brooks Range thawed prior to those in the White Mountains and the sampling sequence was adjusted to accommodate this.
Within each treeline or forested sub-site, a 50-m tran-sect was established parallel with the slope contour of the mountain. Six points were randomly selected along each transect, and soils were sampled near these points for the entire year. Rates of net DIN mineralization and net AAN production were measured using an in situ buried bag tech-nique (Robertson et al., 1999). We used a 6.7-cm-diameter
lOOmIS et al.: NItrOgEN CyClINg at trEElINES
546
FIgurE 1. Location of study areas. Sites within each range are separated by 5–25 km and are listed from north to south in location. Dietrich River is near the circumpolar treeline, and all other sites are elevational treelines.
tablE I. Study sites. Community description is based on viereck et al. (1992). All treeline sites have less than 10% cover of trees and there-fore are classified based on shrub vegetation. Tree density is the density of white spruce trees per ha.
Site Latitude/ longitude Slope (°) Aspect Elevation (m) Tree density Community descriptionbrOOkS raNgE Dietrich River Treeline 68º 01’N / 149º 41’W 25 SE 820 337 ± 72 Low open shrub birch Forest 15 SE 670 457 ± 29 Open white spruce forest Snowden Treeline 67º 49’N / 149º 48’W 25 W 790 302 ± 57 Low open shrub birch Forest 15 W 610 2381 ± 275 Open white spruce forest Gobbler’s Knob Treeline 66º 44’N / 150º 40’W 2 S 620 16 ± 2 Vaccinium tundra Forest 5 S 520 550 ± 49 Open white spruce forestWhItE mOuNtaINS Eagle Summit Treeline 65º 30’N / 145º 21’W 12 S 997 336 ± 31 Low open shrub birch Forest 15 S 936 863 ± 57 Open white spruce forest Twelve-mile Summit Treeline 65º 23’N / 145º 56’W 10 NW 1010 38 ± 4 Sedge–willow tundra Forest 5 NW 960 379 ± 16 Open white spruce forest Nome Creek Treeline 65º 21’N / 146º 42’W 2 NW 770 69 ± 4 Vaccinium tundra Forest 5 NW 715 254 ± 19 Open white spruce forestChugaCh raNgE Site Summit Treeline 61º 15’N / 149º 34’W 10 NW 200 467 ± 69 Vaccinium tundra Forest 20 N 170 263 ± 19 Open white spruce forest Art’s Ridge Treeline 61º 10’N / 149º 39’W 15 W 621 27 ± 2 Vaccinium tundra Forest 15 SW 492 291 ± 79 Open white spruce forest Near Point Treeline 61º 9’N / 149º 40’W 15 W 590 24 ± 3 Vaccinium tundra Forest 2 W 388 71 ± 11 Open white spruce forest
ÉCOSCIENCE, vOl. 13 (4), 2006
547
steel corer fitted with a perforated plastic sleeve to collect paired adjacent soil cores and sampled below the live moss and detritus layers to a depth of 20 cm. The function of the perforated sleeve was to maintain structural integrity of the soil core during sampling. The perforated sleeve containing the intact core was then placed in a 1-mil breathable poly-ethylene bag followed by a fine mesh bag, gently returned to the original location, covered with litter and left to incubate. Incubation length was four weeks for the spring, growing season, and senescence sampling periods and from September 2001 to early June 2002 for the over-winter sam-pling period. The second core in each pair was stored on ice and transported to the laboratory in Fairbanks. Soils were rocky at some sites and sampling to 20 cm was not possible; for these samples, the minimum depth of coring was 10 cm. After harvesting each core, the subsequent pit was back-filled with soil to minimize disturbance to adjacent samples.
In the laboratory, soils were placed in dark storage at 3 °C and processed within 30 h. Each core was weighed and homogenized by hand. Rocks and roots > 2 mm diameter were removed. Soil moisture was determined gravimetrically for each core by oven drying a 5-7 g sub-sample at 65 °C to a constant weight. A 20-g sub-sample from each core was extracted with 75 mL 0.5 M K2SO4 on an orbital shaker for 1 h and vacuum filtered through pre-rinsed Pall Gelman Type A/E glass fibre filter paper (Pall-Gelman Sciences, Ann Arbor, Michigan, USA) into 50-mL centrifuge tubes. This extract was used for analysis of DIN, AAN, and MBN concentrations. After collection, the incubated cores were processed similarly.
NO3--N and NH4
+-N concentrations were determined colorimetrically using a modified Technicon system auto-analyzer (Whitledge et al., 1981). Net DIN mineralization was calculated for each soil core pair as the difference in NO3
--N plus NH4+-N in excess of initial concentrations.
Net nitrification was calculated as the difference between NO3
--N concentrations for each pair.Total dissolved amino acid N was determined using the
ninhydrin method (Rosen, 1957). Net AAN production was calculated as the difference in AAN concentration between each final and initial core. All fluxes are reported per gram dry soil per day.
Microbial biomass N concentrations were analyzed from extracts of field fresh cores sampled in May, June, and September 2001 and from over-winter incubated cores in May 2002. MBN was determined using the chloroform fumigation-extraction method (Brookes et al., 1985). A 20-g sub-sample from each soil sample was fumigated with etha-nol-free chloroform for 24 h in a moistened modified pres-sure cooker, extracted in 75 mL 0.5 M K2SO4 following the procedure detailed for DIN, and frozen. Frozen samples were later thawed, digested using a persulfate oxidation digestion (Cabrera & Beare, 1993), and analyzed for NO3
--N colorimetrically using a modified Technicon system auto-analyzer (Whitledge et al., 1981). MBN was calculated as the difference in dissolved organic nitrogen (DON) between fumigated and non-fumigated samples.
SOIl OrgaNIC mattEr dECOmpOSItION
We examined the decomposability of soil organic matter by measuring mass loss over 1 y at all sites using
15.2- × 1.8-cm birch wood tongue depressors (TDs) as a common litter. TDs were oven dried for 24 h and weighed before placement in the field. During September 2001, three 20-m transects were randomly established at high, mid, and low elevations (spaced 10 m apart) at each forest and treeline sub-site. Five TDs were inserted vertically into the soil profile until flush with the surface of the organic layer at 5-m intervals along each transect. In September 2002, TDs were carefully collected, transported to the laboratory in Fairbanks, rinsed, oven-dried, and reweighed. Percent mass loss was calculated. The site at Site Summit on Fort Richardson Military Base was closed during fall 2001 and was not sampled.
Soil organic matter quality was assessed by measur-ing soil respiration in the laboratory. During September 2001, 10 cores (6.7 × 10 cm) were sampled at random loca-tions from high, mid, and low elevations at each sub-site. Samples were immediately stored on ice and frozen in the laboratory until the start of the experiment in May 2002. The exception was the site at Site Summit for reasons men-tioned above, where cores were collected in May 2002 and were frozen until the start of the experiment.
Half the cores from each treeline and forested sub-site were randomly assigned to either a low (5 °C) or a high temperature (9 °C) treatment. The purpose of having two temperature treatments was to assess any intrinsic tempera-ture sensitivity in soil respiration rates.
Each core was homogenized by hand as previously described. We used soils from the organic horizon unless the core contained less than 25 g organic soil, in which case soil from the mineral horizon was added to achieve a mass of 25 g. Soils were then split into two sub-samples. We determined water-holding capacity (WHC) with one sub-sample. These soils were then ground in a steel ball mill and analyzed for total carbon (C) & N on a LECO CNS 2000 (Leco Corporation, St. Joseph, Michigan, USA). Another 20-g sub-sample from each core was placed into an acid-washed glass mason jar (985 mL) and adjusted to 60% WHC. Jars were covered with breathable 1-mil plastic wrap held in place with rubber bands and pre-incubated in darkness at 3.5 °C for 7 d. Jars were then randomly assigned to one of the two temperature treatments and incubated in the dark for 11 weeks. Ten empty jars were also incubated as controls. Jars were sampled for respiration rate at 1, 2, 6, and 11 weeks. Jars were flushed with ambient air and readjusted to 60% WHC on a balance 24 h prior to sampling and capped with a tight-fitting metal lid equipped with a rubber sampling septa. A 15-mL gas sample was withdrawn by syringe from the headspace of each jar and analyzed for CO2 concentration using a LI-COR 6200 (LI-COR Corp., Lincoln, Nebraska, USA) modified with a syringe-injection system. Soil respiration was calculated and expressed as μg CO2-C·g soil DWT
-1·d-1 or as μg CO2-C·g soil C-1·d-1.
vEgEtatION aNd SOIl CharaCtErIStICS
Percent cover of vegetation growth forms in the under-story (excluding trees) was measured by ocular estimate for ten 1-m2 plots for each treeline and forest sub-site. Tree den-sity, tree basal diameter, and height were calculated using a point-centred quarter method (Bonham, 1989). During
lOOmIS et al.: NItrOgEN CyClINg at trEElINES
548
August 2002, five soil pits were dug to a depth of 30–50 cm at each sub-site to describe average depth of soil horizons. To determine average bulk density, soil C and N stocks, and average rockiness of the soil, five soil cores (6.7 × 20 cm) were collected in random locations. These procedures were not performed on soils from sites in the White Mountains due to logistical constraints. In the laboratory, we separated the cores by horizon, measured the mass of rocks in each horizon, homogenized the soil through a 4-mm sieve, and dried it. These samples were ground by mortar and pestle and analyzed for total C and N on a LECO CNS 2000 com-bustion analyzer.
ClImatE
Soil temperatures at 5 and 25 cm below the surface and air temperatures at 25 cm and 2 m above the surface were recorded hourly throughout the study with Campbell data loggers and thermistors (Campbell Scientific, Inc., Logan, Utah, USA) at both the treeline and forest stands in one site per mountain range. At the remainder of the sites, HOBO data loggers (Onset Computer Corp., Bourne, Massachusetts, USA) were used to record soil temperatures at both 5 and 25 cm and air temperatures at 25 cm and 2 m above the surface. Although we measured N indices only during 2001–2002, we used climate data averaged across 4 y (2000–2004) in order to account for gaps in the climate data that resulted from malfunctioning sensors.
StatIStICal aNalySIS
We used SAS 8.2 (SAS Institute, 1999) to analyze data and test for normality; where necessary, either log transformed or ranked data were analyzed. All significant statistical results from ranked data were compared with the analysis of the raw data, and unless divergent, results of the raw analysis are reported here. To determine differ-ences between treeline and forest, data were analyzed with a paired design by calculating a difference between means of each paired treeline and forested site and using those values in the analysis. Data with both high skewness and kurtosis were analyzed with sign tests in PROC UNIvARIATE; otherwise, paired Student’s T-tests were used to determine any overall difference between treeline and forested sites. Analysis of variance (PROC GLM) was used to determine if the difference between treeline and forest varied among mountain ranges or seasons.
When testing for temporal and spatial patterns, vari-ables with a significant difference between treeline and for-ested sites were analyzed separately by stand type (treeline or forest) to separate the analysis from the paired aspect of the design, and variables with no significant stand-type effect were compiled by site. We used ANOvA on mean data for each site with season, and range and as classes and as independent effects in the model. To test for differences in total soil C and N, we used a mixed-model ANOvA on replicates for each site with season, range, and site nested within range as classes and as independent effects in the model. Any significant effects were subsequently examined with a Tukey’s HSD test. Regression analysis (PROC REG) was used to describe relationships between N fluxes, N pools, temperature, or soil moisture. We used Spearman’s correlation (PROC CORR) to examine any
possible correlation between any of the measured variables. Statistical significance was determined at α = 0.05. Unless otherwise stated, data reported throughout the text represent means ± 1 SE.
ResultsvEgEtatION dESCrIptION
Percent cover of vegetation growth forms in the under-story and the density of white spruce varied between stand types and among ranges. In the Brooks Range, dwarf birch, Betula nana, was the dominant vascular species at most sites (both treeline and forest), excluding the Snowden forest site, where Labrador tea, Ledum palustre ssp. decumbens, was dominant, and the Gobbler’s Knob forest site, where alder, Alnus viridis ssp. fruticosa, was dominant. In the White Mountains, the most common vascular species varied among sites. At Eagle Summit, diamond leaf willow, Salix pulchra, had the most cover in the forest, whereas blueber-ry, Vaccinium uliginosum, had the most cover at treeline. At Twelve-Mile Summit, Salix pulchra was also the dominant species at the forest site, but the sedge Carex bigelowii was dominant at treeline. At Nome Creek, Vaccinium uliginosum was dominant at treeline, and Alaskan spirea, Spirea beau-verdiana, was most prevalent in the forest. In the Chugach Range, the vascular species with the highest cover was the same at all treeline sites: the crowberry, Empetrum nigrum ssp. hermaphroditum, which was also dominant in the for-est site at Site Summit. At Art’s Ridge, the dominant species in the forested site was the bluejoint grass, Calamagrostis canadensis. At Near Point forest, the most common under-story species was Alnus viridis.
SOIlS phySICal prOpErtIES
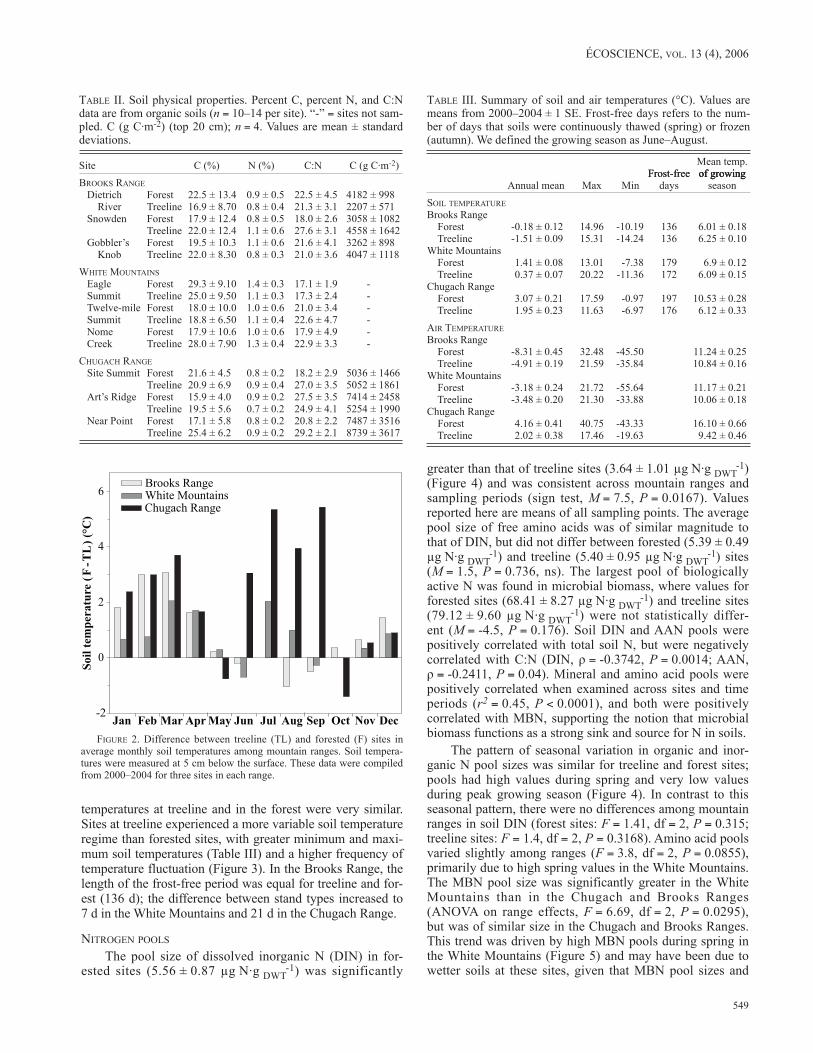
Total soil C was slightly greater at treeline sites (treeline = 22 ± 0.8%; forest = 20 ± 0.9%); however, these differences were not statistically significant (T = -1.19262, df = 8, P = 0.2672), which most likely is a function of the large variability among sites (Table II). The coefficients of variation (Cv) calculated for sites within each range varied from 11.7% (Brooks Range forest sites) to 30.1% (White Mountains forest sites). Total C on an aerial basis did not differ between treeline and forested sites (T = 1.0353, df = 1, P = 0.4889), and ranged from 3522 ± 315 g C·m-2 in the Brooks Range to 6646 ± 852 g C·m-2 in the Chugach Range. Total N was similar in treeline and forested sites (treeline = 0.90 ± 0.04%, forest = 0.96 ± 0.04%; T = 0.2517, df = 8, P = 0.8075). Total soil C was highest in the White Mountains, and similar in the Brooks and Chugach Ranges (Table II). The ratio of C to N did not vary between treeline and forest sites (T = -2.0367, df = 8, P = 0.0761) and was highest in the Chugach Range and lowest in the White Mountains. There was greater variability in total soil C and C:N ratio among sites within ranges than among ranges, and Cvs were two times greater among sites within ranges than among mountain ranges.
ClImatE
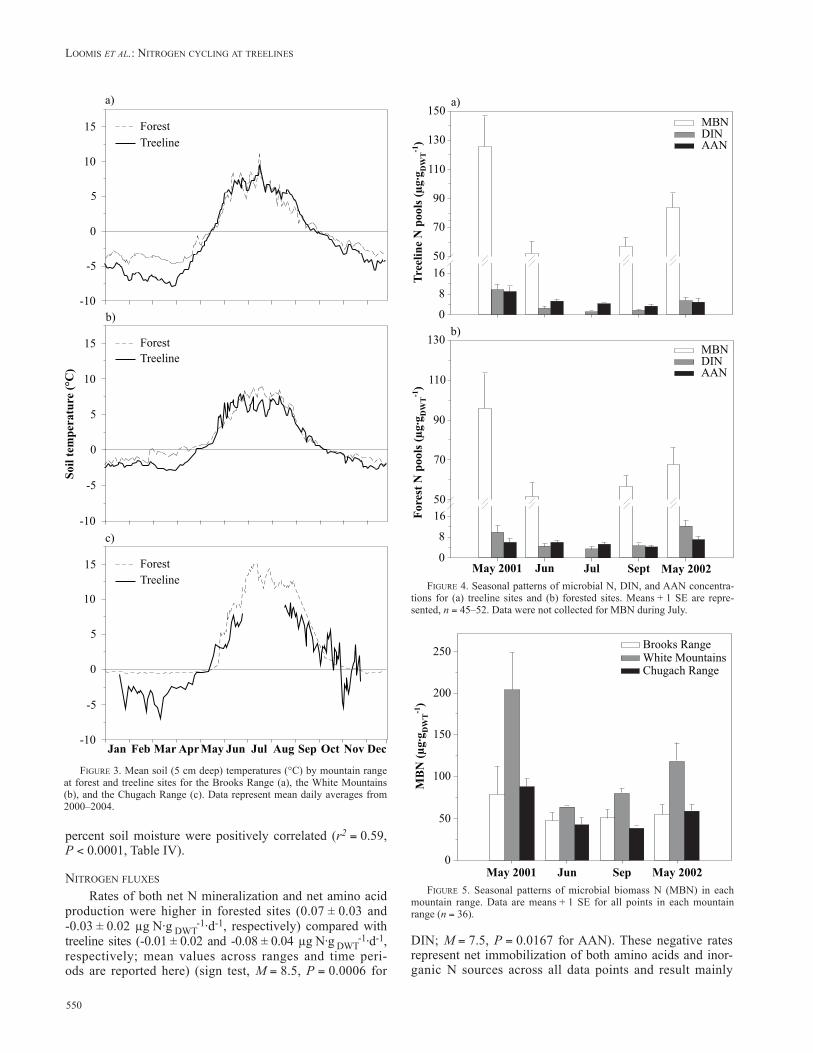
Overall, soils at treeline were colder than soils in the forest, particularly during winter (October to April; M = 17, P < 0.0001; Figure 2). During the remainder of the year, soil
ÉCOSCIENCE, vOl. 13 (4), 2006
549
temperatures at treeline and in the forest were very similar. Sites at treeline experienced a more variable soil temperature regime than forested sites, with greater minimum and maxi-mum soil temperatures (Table III) and a higher frequency of temperature fluctuation (Figure 3). In the Brooks Range, the length of the frost-free period was equal for treeline and for-est (136 d); the difference between stand types increased to 7 d in the White Mountains and 21 d in the Chugach Range.
NItrOgEN pOOlS
The pool size of dissolved inorganic N (DIN) in for-ested sites (5.56 ± 0.87 µg N·g dWt
-1) was significantly
greater than that of treeline sites (3.64 ± 1.01 µg N·g dWt-1)
(Figure 4) and was consistent across mountain ranges and sampling periods (sign test, M = 7.5, P = 0.0167). values reported here are means of all sampling points. The average pool size of free amino acids was of similar magnitude to that of DIN, but did not differ between forested (5.39 ± 0.49 µg N·g dWt
-1) and treeline (5.40 ± 0.95 µg N·g dWt-1) sites
(M = 1.5, P = 0.736, ns). The largest pool of biologically active N was found in microbial biomass, where values for forested sites (68.41 ± 8.27 µg N·g dWt
-1) and treeline sites (79.12 ± 9.60 µg N·g dWt
-1) were not statistically differ-ent (M = -4.5, P = 0.176). Soil DIN and AAN pools were positively correlated with total soil N, but were negatively correlated with C:N (DIN, ρ = -0.3742, P = 0.0014; AAN, ρ = -0.2411, P = 0.04). Mineral and amino acid pools were positively correlated when examined across sites and time periods (r2 = 0.45, P < 0.0001), and both were positively correlated with MBN, supporting the notion that microbial biomass functions as a strong sink and source for N in soils.
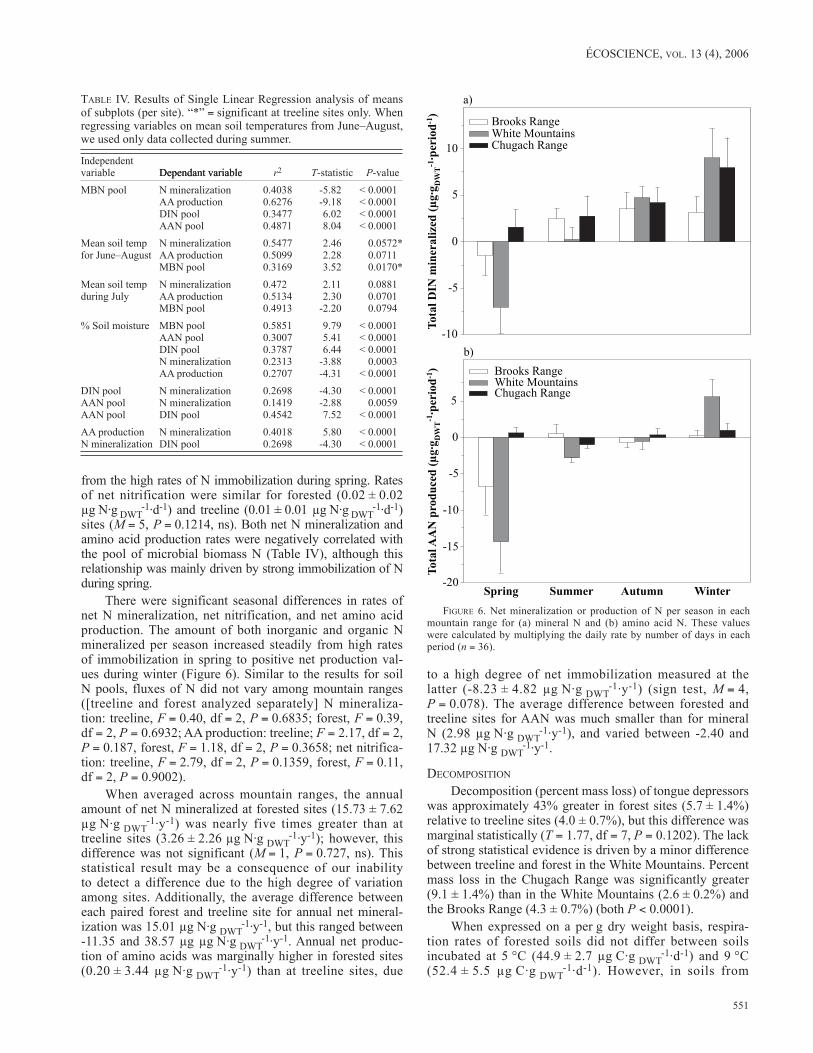
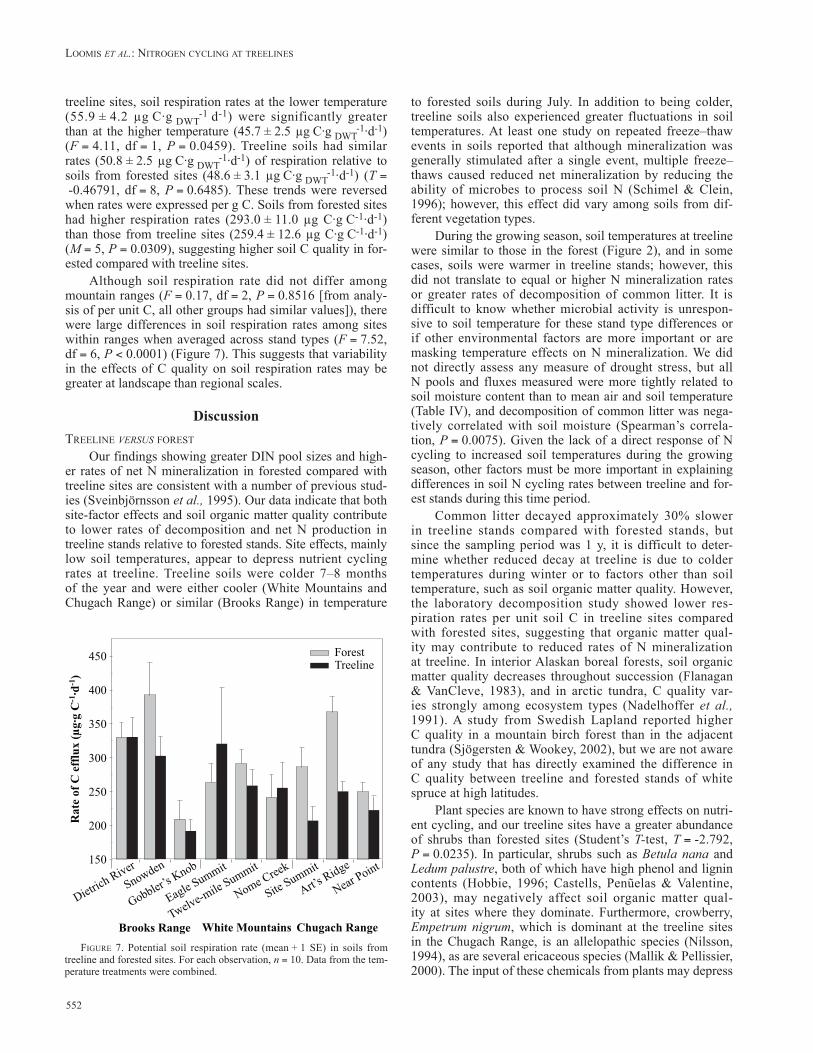
The pattern of seasonal variation in organic and inor-ganic N pool sizes was similar for treeline and forest sites; pools had high values during spring and very low values during peak growing season (Figure 4). In contrast to this seasonal pattern, there were no differences among mountain ranges in soil DIN (forest sites: F = 1.41, df = 2, P = 0.315; treeline sites: F = 1.4, df = 2, P = 0.3168). Amino acid pools varied slightly among ranges (F = 3.8, df = 2, P = 0.0855), primarily due to high spring values in the White Mountains. The MBN pool size was significantly greater in the White Mountains than in the Chugach and Brooks Ranges (ANOvA on range effects, F = 6.69, df = 2, P = 0.0295), but was of similar size in the Chugach and Brooks Ranges. This trend was driven by high MBN pools during spring in the White Mountains (Figure 5) and may have been due to wetter soils at these sites, given that MBN pool sizes and
tablE II. Soil physical properties. Percent C, percent N, and C:N data are from organic soils (n = 10–14 per site). “-” = sites not sam-pled. C (g C·m-2) (top 20 cm); n = 4. values are mean ± standard deviations.
Site C (%) N (%) C:N C (g C·m-2)brOOkS raNgE Dietrich Forest 22.5 ± 13.4 0.9 ± 0.5 22.5 ± 4.5 4182 ± 998 River Treeline 16.9 ± 8.70 0.8 ± 0.4 21.3 ± 3.1 2207 ± 571 Snowden Forest 17.9 ± 12.4 0.8 ± 0.5 18.0 ± 2.6 3058 ± 1082 Treeline 22.0 ± 12.4 1.1 ± 0.6 27.6 ± 3.1 4558 ± 1642 Gobbler’s Forest 19.5 ± 10.3 1.1 ± 0.6 21.6 ± 4.1 3262 ± 898 Knob Treeline 22.0 ± 8.30 0.8 ± 0.3 21.0 ± 3.6 4047 ± 1118WhItE mOuNtaINS Eagle Forest 29.3 ± 9.10 1.4 ± 0.3 17.1 ± 1.9 - Summit Treeline 25.0 ± 9.50 1.1 ± 0.3 17.3 ± 2.4 - Twelve-mile Forest 18.0 ± 10.0 1.0 ± 0.6 21.0 ± 3.4 - Summit Treeline 18.8 ± 6.50 1.1 ± 0.4 22.6 ± 4.7 - Nome Forest 17.9 ± 10.6 1.0 ± 0.6 17.9 ± 4.9 - Creek Treeline 28.0 ± 7.90 1.3 ± 0.4 22.9 ± 3.3 -ChugaCh raNgE Site Summit Forest 21.6 ± 4.5 0.8 ± 0.2 18.2 ± 2.9 5036 ± 1466 Treeline 20.9 ± 6.9 0.9 ± 0.4 27.0 ± 3.5 5052 ± 1861 Art’s Ridge Forest 15.9 ± 4.0 0.9 ± 0.2 27.5 ± 3.5 7414 ± 2458 Treeline 19.5 ± 5.6 0.7 ± 0.2 24.9 ± 4.1 5254 ± 1990 Near Point Forest 17.1 ± 5.8 0.8 ± 0.2 20.8 ± 2.2 7487 ± 3516 Treeline 25.4 ± 6.2 0.9 ± 0.2 29.2 ± 2.1 8739 ± 3617
FIgurE 2. Difference between treeline (TL) and forested (F) sites in average monthly soil temperatures among mountain ranges. Soil tempera-tures were measured at 5 cm below the surface. These data were compiled from 2000–2004 for three sites in each range.
tablE III. Summary of soil and air temperatures (°C). values are means from 2000–2004 ± 1 SE. Frost-free days refers to the num-ber of days that soils were continuously thawed (spring) or frozen (autumn). We defined the growing season as June–August.
Mean temp. Frost-free of growingFrost-free of growing of growing Annual mean Max Min days seasonSOIl tEmpEraturEBrooks Range Forest -0.18 ± 0.12 14.96 -10.19 136 6.01 ± 0.18 Treeline -1.51 ± 0.09 15.31 -14.24 136 6.25 ± 0.10White Mountains Forest 1.41 ± 0.08 13.01 -7.38 179 6.9 ± 0.12 Treeline 0.37 ± 0.07 20.22 -11.36 172 6.09 ± 0.15Chugach Range Forest 3.07 ± 0.21 17.59 -0.97 197 10.53 ± 0.28 Treeline 1.95 ± 0.23 11.63 -6.97 176 6.12 ± 0.33aIr tEmpEraturEBrooks Range Forest -8.31 ± 0.45 32.48 -45.50 11.24 ± 0.25 Treeline -4.91 ± 0.19 21.59 -35.84 10.84 ± 0.16White Mountains Forest -3.18 ± 0.24 21.72 -55.64 11.17 ± 0.21 Treeline -3.48 ± 0.20 21.30 -33.88 10.06 ± 0.18Chugach Range Forest 4.16 ± 0.41 40.75 -43.33 16.10 ± 0.66 Treeline 2.02 ± 0.38 17.46 -19.63 9.42 ± 0.46
lOOmIS et al.: NItrOgEN CyClINg at trEElINES
550
percent soil moisture were positively correlated (r2 = 0.59, P < 0.0001, Table Iv).
NItrOgEN FluxES
Rates of both net N mineralization and net amino acid production were higher in forested sites (0.07 ± 0.03 and -0.03 ± 0.02 µg N·g dWT
-1·d-1, respectively) compared with treeline sites (-0.01 ± 0.02 and -0.08 ± 0.04 µg N·g dWT
-1·d-1, respectively; mean values across ranges and time peri-ods are reported here) (sign test, M = 8.5, P = 0.0006 for
DIN; M = 7.5, P = 0.0167 for AAN). These negative rates represent net immobilization of both amino acids and inor-ganic N sources across all data points and result mainly
FIgurE 3. Mean soil (5 cm deep) temperatures (°C) by mountain range at forest and treeline sites for the Brooks Range (a), the White Mountains (b), and the Chugach Range (c). Data represent mean daily averages from 2000–2004.
FIgurE 4. Seasonal patterns of microbial N, DIN, and AAN concentra-tions for (a) treeline sites and (b) forested sites. Means + 1 SE are repre-sented, n = 45–52. Data were not collected for MBN during July.
FIgurE 5. Seasonal patterns of microbial biomass N (MBN) in each mountain range. Data are means + 1 SE for all points in each mountain range (n = 36).
ÉCOSCIENCE, vOl. 13 (4), 2006
551
from the high rates of N immobilization during spring. Rates of net nitrification were similar for forested (0.02 ± 0.02 µg N·g dWT
-1·d-1) and treeline (0.01 ± 0.01 µg N·g dWT-1·d-1)
sites (M = 5, P = 0.1214, ns). Both net N mineralization and amino acid production rates were negatively correlated with the pool of microbial biomass N (Table Iv), although this relationship was mainly driven by strong immobilization of N during spring.
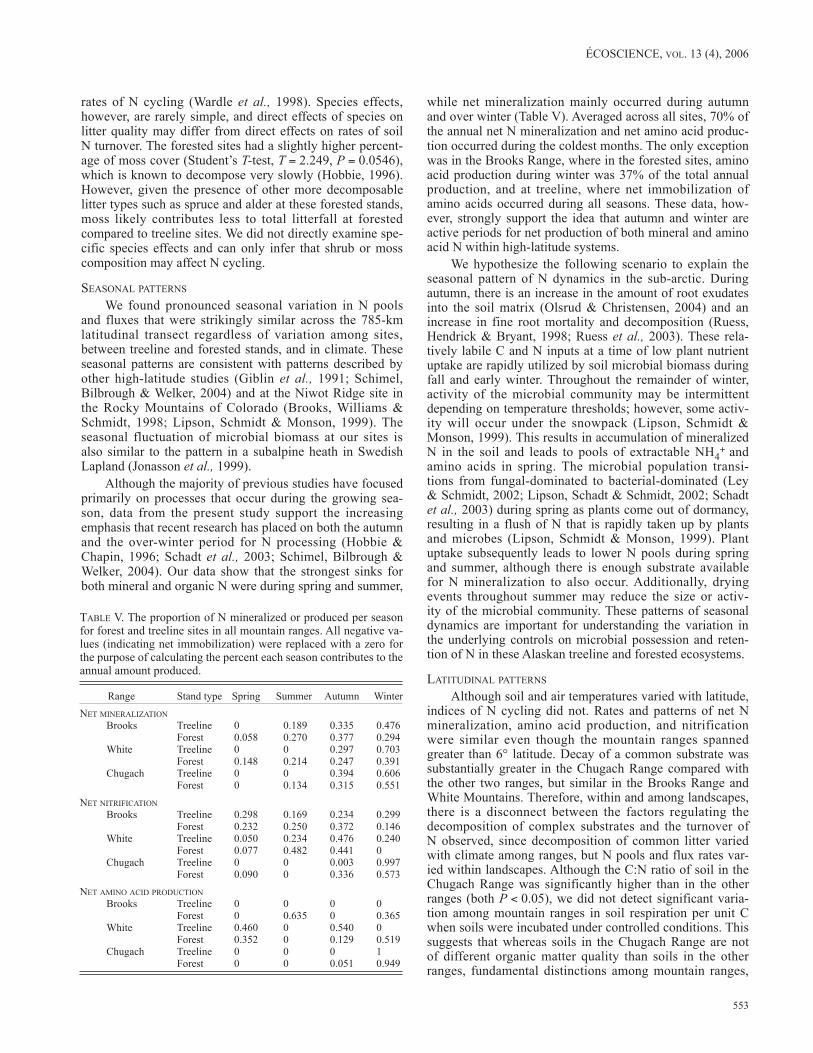
There were significant seasonal differences in rates of net N mineralization, net nitrification, and net amino acid production. The amount of both inorganic and organic N mineralized per season increased steadily from high rates of immobilization in spring to positive net production val-ues during winter (Figure 6). Similar to the results for soil N pools, fluxes of N did not vary among mountain ranges ([treeline and forest analyzed separately] N mineraliza-tion: treeline, F = 0.40, df = 2, P = 0.6835; forest, F = 0.39, df = 2, P = 0.6932; AA production: treeline; F = 2.17, df = 2, P = 0.187, forest, F = 1.18, df = 2, P = 0.3658; net nitrifica-tion: treeline, F = 2.79, df = 2, P = 0.1359, forest, F = 0.11, df = 2, P = 0.9002).
When averaged across mountain ranges, the annual amount of net N mineralized at forested sites (15.73 ± 7.62 µg N·g dWt
-1·y-1) was nearly five times greater than at treeline sites (3.26 ± 2.26 µg N·g dWt
-1·y-1); however, this difference was not significant (M = 1, P = 0.727, ns). This statistical result may be a consequence of our inability to detect a difference due to the high degree of variation among sites. Additionally, the average difference between each paired forest and treeline site for annual net mineral-ization was 15.01 µg N·g dWt
-1·y-1, but this ranged between -11.35 and 38.57 µg µg N·g dWt
-1·y-1. Annual net produc-tion of amino acids was marginally higher in forested sites (0.20 ± 3.44 µg N·g dWt
-1·y-1) than at treeline sites, due
to a high degree of net immobilization measured at the latter (-8.23 ± 4.82 µg N·g dWt
-1·y-1) (sign test, M = 4, P = 0.078). The average difference between forested and treeline sites for AAN was much smaller than for mineral N (2.98 µg N·g dWt
-1·y-1), and varied between -2.40 and 17.32 µg N·g dWt
-1·y-1.
dECOmpOSItION
Decomposition (percent mass loss) of tongue depressors was approximately 43% greater in forest sites (5.7 ± 1.4%) relative to treeline sites (4.0 ± 0.7%), but this difference was marginal statistically (T = 1.77, df = 7, P = 0.1202). The lack of strong statistical evidence is driven by a minor difference between treeline and forest in the White Mountains. Percent mass loss in the Chugach Range was significantly greater (9.1 ± 1.4%) than in the White Mountains (2.6 ± 0.2%) and the Brooks Range (4.3 ± 0.7%) (both P < 0.0001).
When expressed on a per g dry weight basis, respira-tion rates of forested soils did not differ between soils incubated at 5 °C (44.9 ± 2.7 µg C·g dWt
-1·d-1) and 9 °C (52.4 ± 5.5 µg C·g dWt
-1·d-1). However, in soils from
tablE Iv. Results of Single Linear Regression analysis of means of subplots (per site). “*” = significant at treeline sites only. When regressing variables on mean soil temperatures from June–August, we used only data collected during summer.
Independentvariable Dependant variableDependant variable r2 T-statistic P-valueMBN pool N mineralization 0.4038 -5.82 < 0.0001 AA production 0.6276 -9.18 < 0.0001 DIN pool 0.3477 6.02 < 0.0001 AAN pool 0.4871 8.04 < 0.0001Mean soil temp N mineralization 0.5477 2.46 0.0572*for June–August AA production 0.5099 2.28 0.0711 MBN pool 0.3169 3.52 0.0170*Mean soil temp N mineralization 0.472 2.11 0.0881during July AA production 0.5134 2.30 0.0701 MBN pool 0.4913 -2.20 0.0794% Soil moisture MBN pool 0.5851 9.79 < 0.0001 AAN pool 0.3007 5.41 < 0.0001 DIN pool 0.3787 6.44 < 0.0001 N mineralization 0.2313 -3.88 0.0003 AA production 0.2707 -4.31 < 0.0001DIN pool N mineralization 0.2698 -4.30 < 0.0001AAN pool N mineralization 0.1419 -2.88 0.0059AAN pool DIN pool 0.4542 7.52 < 0.0001AA production N mineralization 0.4018 5.80 < 0.0001N mineralization DIN pool 0.2698 -4.30 < 0.0001
FIgurE 6. Net mineralization or production of N per season in each mountain range for (a) mineral N and (b) amino acid N. These values were calculated by multiplying the daily rate by number of days in each period (n = 36).
lOOmIS et al.: NItrOgEN CyClINg at trEElINES
552
treeline sites, soil respiration rates at the lower temperature (55.9 ± 4.2 µg C·g dWt
-1 d-1) were significantly greater than at the higher temperature (45.7 ± 2.5 µg C·g dWt
-1·d-1) (F = 4.11, df = 1, P = 0.0459). Treeline soils had similar rates (50.8 ± 2.5 µg C·g dWt
-1·d-1) of respiration relative to soils from forested sites (48.6 ± 3.1 µg C·g dWt
-1·d-1) (T = -0.46791, df = 8, P = 0.6485). These trends were reversed when rates were expressed per g C. Soils from forested sites had higher respiration rates (293.0 ± 11.0 µg C·g C-1·d-1) than those from treeline sites (259.4 ± 12.6 µg C·g C-1·d-1) (M = 5, P = 0.0309), suggesting higher soil C quality in for-ested compared with treeline sites.
Although soil respiration rate did not differ among mountain ranges (F = 0.17, df = 2, P = 0.8516 [from analy-sis of per unit C, all other groups had similar values]), there were large differences in soil respiration rates among sites within ranges when averaged across stand types (F = 7.52, df = 6, P < 0.0001) (Figure 7). This suggests that variability in the effects of C quality on soil respiration rates may be greater at landscape than regional scales.
DiscussiontrEElINE versus FOrESt
Our findings showing greater DIN pool sizes and high-er rates of net N mineralization in forested compared with treeline sites are consistent with a number of previous stud-ies (Sveinbjörnsson et al., 1995). Our data indicate that both site-factor effects and soil organic matter quality contribute to lower rates of decomposition and net N production in treeline stands relative to forested stands. Site effects, mainly low soil temperatures, appear to depress nutrient cycling rates at treeline. Treeline soils were colder 7–8 months of the year and were either cooler (White Mountains and Chugach Range) or similar (Brooks Range) in temperature
to forested soils during July. In addition to being colder, treeline soils also experienced greater fluctuations in soil temperatures. At least one study on repeated freeze–thaw events in soils reported that although mineralization was generally stimulated after a single event, multiple freeze–thaws caused reduced net mineralization by reducing the ability of microbes to process soil N (Schimel & Clein, 1996); however, this effect did vary among soils from dif-ferent vegetation types.
During the growing season, soil temperatures at treeline were similar to those in the forest (Figure 2), and in some cases, soils were warmer in treeline stands; however, this did not translate to equal or higher N mineralization rates or greater rates of decomposition of common litter. It is difficult to know whether microbial activity is unrespon-sive to soil temperature for these stand type differences or if other environmental factors are more important or are masking temperature effects on N mineralization. We did not directly assess any measure of drought stress, but all N pools and fluxes measured were more tightly related to soil moisture content than to mean air and soil temperature (Table Iv), and decomposition of common litter was nega-tively correlated with soil moisture (Spearman’s correla-tion, P = 0.0075). Given the lack of a direct response of N cycling to increased soil temperatures during the growing season, other factors must be more important in explaining differences in soil N cycling rates between treeline and for-est stands during this time period.
Common litter decayed approximately 30% slower in treeline stands compared with forested stands, but since the sampling period was 1 y, it is difficult to deter-mine whether reduced decay at treeline is due to colder temperatures during winter or to factors other than soil temperature, such as soil organic matter quality. However, the laboratory decomposition study showed lower res-piration rates per unit soil C in treeline sites compared with forested sites, suggesting that organic matter qual-ity may contribute to reduced rates of N mineralization at treeline. In interior Alaskan boreal forests, soil organic matter quality decreases throughout succession (Flanagan & vanCleve, 1983), and in arctic tundra, C quality var-ies strongly among ecosystem types (Nadelhoffer et al., 1991). A study from Swedish Lapland reported higher C quality in a mountain birch forest than in the adjacent tundra (Sjögersten & Wookey, 2002), but we are not aware of any study that has directly examined the difference in C quality between treeline and forested stands of white spruce at high latitudes.
Plant species are known to have strong effects on nutri-ent cycling, and our treeline sites have a greater abundance of shrubs than forested sites (Student’s T-test, T = -2.792, P = 0.0235). In particular, shrubs such as Betula nana and Ledum palustre, both of which have high phenol and lignin contents (Hobbie, 1996; Castells, Penũelas & Valentine, 2003), may negatively affect soil organic matter qual-ity at sites where they dominate. Furthermore, crowberry, Empetrum nigrum, which is dominant at the treeline sites in the Chugach Range, is an allelopathic species (Nilsson, 1994), as are several ericaceous species (Mallik & Pellissier, 2000). The input of these chemicals from plants may depress
FIgurE 7. Potential soil respiration rate (mean + 1 SE) in soils from treeline and forested sites. For each observation, n = 10. Data from the tem-perature treatments were combined.
ÉCOSCIENCE, vOl. 13 (4), 2006
553
rates of N cycling (Wardle et al., 1998). Species effects, however, are rarely simple, and direct effects of species on litter quality may differ from direct effects on rates of soil N turnover. The forested sites had a slightly higher percent-age of moss cover (Student’s T-test, T = 2.249, P = 0.0546), which is known to decompose very slowly (Hobbie, 1996). However, given the presence of other more decomposable litter types such as spruce and alder at these forested stands, moss likely contributes less to total litterfall at forested compared to treeline sites. We did not directly examine spe-cific species effects and can only infer that shrub or moss composition may affect N cycling.
SEaSONal pattErNS
We found pronounced seasonal variation in N pools and fluxes that were strikingly similar across the 785-km latitudinal transect regardless of variation among sites, between treeline and forested stands, and in climate. These seasonal patterns are consistent with patterns described by other high-latitude studies (Giblin et al., 1991; Schimel, Bilbrough & Welker, 2004) and at the Niwot Ridge site in the Rocky Mountains of Colorado (Brooks, Williams & Schmidt, 1998; Lipson, Schmidt & Monson, 1999). The seasonal fluctuation of microbial biomass at our sites is also similar to the pattern in a subalpine heath in Swedish Lapland (Jonasson et al., 1999).
Although the majority of previous studies have focused primarily on processes that occur during the growing sea-son, data from the present study support the increasing emphasis that recent research has placed on both the autumn and the over-winter period for N processing (Hobbie & Chapin, 1996; Schadt et al., 2003; Schimel, Bilbrough & Welker, 2004). Our data show that the strongest sinks for both mineral and organic N were during spring and summer,
while net mineralization mainly occurred during autumn and over winter (Table v). Averaged across all sites, 70% of the annual net N mineralization and net amino acid produc-tion occurred during the coldest months. The only exception was in the Brooks Range, where in the forested sites, amino acid production during winter was 37% of the total annual production, and at treeline, where net immobilization of amino acids occurred during all seasons. These data, how-ever, strongly support the idea that autumn and winter are active periods for net production of both mineral and amino acid N within high-latitude systems.
We hypothesize the following scenario to explain the seasonal pattern of N dynamics in the sub-arctic. During autumn, there is an increase in the amount of root exudates into the soil matrix (Olsrud & Christensen, 2004) and an increase in fine root mortality and decomposition (Ruess, Hendrick & Bryant, 1998; Ruess et al., 2003). These rela-tively labile C and N inputs at a time of low plant nutrient uptake are rapidly utilized by soil microbial biomass during fall and early winter. Throughout the remainder of winter, activity of the microbial community may be intermittent depending on temperature thresholds; however, some activ-ity will occur under the snowpack (Lipson, Schmidt & Monson, 1999). This results in accumulation of mineralized N in the soil and leads to pools of extractable NH4
+ and amino acids in spring. The microbial population transi-tions from fungal-dominated to bacterial-dominated (Ley & Schmidt, 2002; Lipson, Schadt & Schmidt, 2002; Schadt et al., 2003) during spring as plants come out of dormancy, resulting in a flush of N that is rapidly taken up by plants and microbes (Lipson, Schmidt & Monson, 1999). Plant uptake subsequently leads to lower N pools during spring and summer, although there is enough substrate available for N mineralization to also occur. Additionally, drying events throughout summer may reduce the size or activ-ity of the microbial community. These patterns of seasonal dynamics are important for understanding the variation in the underlying controls on microbial possession and reten-tion of N in these Alaskan treeline and forested ecosystems.
latItudINal pattErNS
Although soil and air temperatures varied with latitude, indices of N cycling did not. Rates and patterns of net N mineralization, amino acid production, and nitrification were similar even though the mountain ranges spanned greater than 6° latitude. Decay of a common substrate was substantially greater in the Chugach Range compared with the other two ranges, but similar in the Brooks Range and White Mountains. Therefore, within and among landscapes, there is a disconnect between the factors regulating the decomposition of complex substrates and the turnover of N observed, since decomposition of common litter varied with climate among ranges, but N pools and flux rates var-ied within landscapes. Although the C:N ratio of soil in the Chugach Range was significantly higher than in the other ranges (both P < 0.05), we did not detect significant varia-tion among mountain ranges in soil respiration per unit C when soils were incubated under controlled conditions. This suggests that whereas soils in the Chugach Range are not of different organic matter quality than soils in the other ranges, fundamental distinctions among mountain ranges,
tablE v. The proportion of N mineralized or produced per season for forest and treeline sites in all mountain ranges. All negative va-lues (indicating net immobilization) were replaced with a zero for the purpose of calculating the percent each season contributes to the annual amount produced.
Range Stand type Spring Summer Autumn WinterNEt mINEralIzatION Brooks Treeline 0 0.189 0.335 0.476 Forest 0.058 0.270 0.377 0.294 White Treeline 0 0 0.297 0.703 Forest 0.148 0.214 0.247 0.391 Chugach Treeline 0 0 0.394 0.606 Forest 0 0.134 0.315 0.551NEt NItrIFICatION Brooks Treeline 0.298 0.169 0.234 0.299 Forest 0.232 0.250 0.372 0.146 White Treeline 0.050 0.234 0.476 0.240 Forest 0.077 0.482 0.441 0 Chugach Treeline 0 0 0.003 0.997 Forest 0.090 0 0.336 0.573NEt amINO aCId prOduCtION Brooks Treeline 0 0 0 0 Forest 0 0.635 0 0.365 White Treeline 0.460 0 0.540 0 Forest 0.352 0 0.129 0.519 Chugach Treeline 0 0 0 1 Forest 0 0 0.051 0.949
lOOmIS et al.: NItrOgEN CyClINg at trEElINES
554
such as the length of the growing season and warmer tem-peratures, may be more important than site differences in controlling decomposition processes. During the growing season, the average soil temperatures among mountain ranges varied within a few degrees. Most likely, variation in temperature within this narrow span does not limit the physiological capacity of microbes to process soil organic matter, which could explain why indices of N cycling did not change with increasing latitude. This is supported by the lack of a difference in respiration per gram C between soils incubated at 5 and 9 °C. Soils from other high-latitude ecosystems have also been shown to be relatively insensi-tive to temperature fluctuations within this range (Giblin et al., 1991; Nadelhoffer et al., 1991; Stottlemyer, Rhoades & Steltzer, 2001). Although soil N processes were similar across latitudes, branch growth of white spruce was almost three times greater in the Chugach Range than in the White Mountains or Brooks Range (M. Smith & T. Traustason, unpubl. data). This may be a function of the maritime cli-mate, the longer growing season, and higher temperatures during both summer and winter in the Chugach Range.
We found more variation among sites within ranges than among ranges when averaged across sites and stand types in soil percent C, soil moisture content, flux of C in the lab incubation, and amount of amino acids produced annually. Two studies analyzing trends of tree-ring growth in Alaska also report substantial regional and site variability in the response of white spruce to climate (Lloyd & Fastie, 2002; Wilmking et al., 2004). Lloyd and Fastie (2002) cor-related the width of tree rings to climate for white spruce growing at similar sites in the White Mountains and found that in the last century, growth of treeline trees at Eagle Summit was positively correlated with temperature, while at Twelve-mile Summit growth was not, but growth of treeline trees at Nome Creek exhibited a negative tempera-ture response. Treeline trees at all these sites also exhibited greater growth than trees in the forest during the last quarter century. A differential response of growth between treeline and forested stands was not found in the Brooks Range or the Alaska Range, although white spruce responded both positively and negatively to climate in both ranges (Wilmking et al., 2004). The authors of both studies attrib-uted the reduced growth response to warming temperatures over the past century to drought stress. Drought stress varies substantially among sites due to differences in topography, hydrological regimes, and proximity to permafrost, and it directly affects nutrient cycling and nutrient uptake by plants. At our sites, all pools and rates of N turnover were highly correlated to soil moisture, which is consistent with other studies in arctic and alpine ecosystems (Binkley et al., 1994; Fisk, Schmidt & Seastedt, 1998).
OrgaNIC NThe present results indicate that pools, fluxes, and
seasonal patterns of dissolved amino acids are similar to dissolved inorganic N. This is in contrast to the work of Kielland (1995) in arctic tundra, who reported amino acid concentrations 4 to 10 times higher than ammonium, although the range of amino acids he reported was similar (1–8 µg N·g DWT
-1) to the average concentration reported
here. This discrepancy may result from either a difference in sampling methodology or sample processing. Our data on the size and proportion of mineral to amino acid N are simi-lar to those reported for a boreal forest gradient in northern Sweden (Nordin, Högberg & Näsholm, 2001).
The microbial sink for amino acid N was stronger than the sink for mineral N at both treeline and forested sites. At treeline, there was reduced net production of amino acids, but this was not reflected by reduced N in the microbial biomass or by lower pools of dissolved AAN in soils. This suggests that the N taken up by microbes may support func-tions other than growth (e.g., the amount of N in micro-bial biomass) (vance & Chapin, 2001), although we have no data on the turnover rates of the microbial community. Amino acids cycle rapidly through microbes on the scale of hours, not months (Lipson et al., 2001; Jones & Kielland, 2002; McFarland et al., 2002; van Hees et al., 2005), so we can only speculate about the actual amount and rate of amino acids that are processed by microbes relative to inor-ganic N. Additionally, an unknown amount of amino acids taken up by microbes is further mineralized into DIN, which may lead to stronger microbial immobilization of AAN rela-tive to DIN. In N-limited systems, microbes are predicted to rely more strongly on organic N than mineral N to meet functional needs (Schimel & Bennett, 2004), especially at high latitudes (Kielland, 2001; Jones & Kielland, 2002). The fact that we observed stronger sinks for amino acids than mineral N may support this hypothesis. In particular, microbes may rely more strongly on organic N in the White Mountains, which were the coldest and wettest sites, with strong sinks for amino acid N.
ConclusionWe have presented evidence that both soil pools and
fluxes of organic and mineral N forms, and the ability of microbes to decay substrates, are reduced at treeline sites relative to contiguous forests over large spatial scales in Alaska. This pattern does not vary with broad changes in climate and most likely is due to differences in organic matter quality, reduced temperatures during winter, and increased disturbance (frequency of freeze–thaw and dry–rewet cycles) at treeline sites. The pattern of seasonal N dynamics described here is consistent across latitudes regardless of varying site factors. We suggest that the fall and over-winter periods are both critical to prevent N loss from the ecosystem by soil microbial activity, which acts to prevent N loss from the ecosystem and as a strong source for N for both plants and microbes. We observed greater variation in N processes within landscapes between treeline and forested stands than among mountain ranges along a 785-km latitudinal transect, suggesting that studies on local-scale controls over the N cycle may be more critical for calibrating ecosystem models than studies on broad-scale controls on N cycling, such as mean annual temperature.
AcknowledgementsWe thank K. Beattie, K. Olson, J. McFarland, S. Keller, C.
Jones, S. Lyle, and P. Petit for invaluable help with field and/or lab work. L. Oliver and T. Quintal of the UAF Forest Soils Lab were instrumental with the nutrient analysis. Funding was provided by
ÉCOSCIENCE, vOl. 13 (4), 2006
555
National Science Foundation grant OPP-ANS-9978143 and the Bonanza Creek Long-Term Ecological Research program (funded jointly by National Science Foundation grant DEB-0423442 and USDA Forest Service, Pacific Northwest Research Station grant PNW01-Jv11261952-231). Logistical support was provided by the Institute of Arctic Biology at the University of Alaska Fairbanks.
Literature citedBinkley, D., R. Stottlemyer, F. Suarez & J. Cortina, 1994. Soil
nitrogen availability in some arctic ecosystems in northwest Alaska: Responses to temperature and moisture. Écoscience, 1: 64–70.
Bonham, C.D., 1989. Measurements for Terrestrial vegetation. John Wiley & Sons, New York, New York.
Brookes, P. C., A. Landman, G. Pruden & D. S. Jenkinson, 1985. Chloroform fumigation and the release of soil nitrogen: A rapid direct extraction method to measure microbial biomass nitrogen in soil. Soil Biology & Biochemistry, 17: 837–842.
Brooks, P. D., M. W. Williams & S. K. Schmidt, 1998. Inorganic nitrogen and microbial biomass dynamics before and during spring snowmelt. Biogeochemistry, 43: 1–15.
Brooks, P. D., M. W. Williams, D. A. Walker & S. K. Schmidt, 1995. The Niwot Ridge snow fence experiment: Biogeochemical responses to changes in the seasonal snowpack. Pages 293–302 in K. Tonnessen, M. Williams & M. Tranter (eds.). Biogeochemistry of Seasonally Snow-Covered Catchments. Proceedings of a Boulder Symposium, July 1995. International Association of Hydrological Sciences Publication no. 228.
Cabrera, M. L. & M. H. Beare, 1993. Alkaline persulfate oxidation for determining total nitrogen in microbial biomass extracts. Soil Science Society of America Journal, 57: 1007–1012.
Castells, E., J. Peñuelas & D. W. valentine, 2003. Influence of the phenolic compound bearing species Ledum palustre on soil N cycling in a boreal hardwood forest. Plant and Soil, 251: 155–166.
Clein, J. S & J. P. Schimel, 1995. Microbial activity of tun-dra and taiga soils at sub-zero temperatures. Soil Biology & Biochemistry, 27: 1231–1234.
Fisk, M. C., S. K. Schmidt & T. R. Seastedt, 1998. Topographic patterns of above- and belowground production and nitrogen cycling in alpine tundra. Ecology, 79: 2253–2266.
Flanagan, P. W. & K. van Cleve, 1983. Nutrient cycling in relation to decomposition and organic-matter quality in taiga ecosys-tems. Canadian Journal of Forest Research, 13: 795–817.
Flora of North America Editorial Committee (eds.), 1993-. Flora of North America North of Mexico, 7 + volumes. Oxford University Press, Oxford.
Giblin, A. E., K. J. Nadelhoffer, G. R. Shaver, J. A. Laundre & A. J. McKerrow, 1991. Biogeochemical diversity along a riverside toposequence in arctic Alaska. Ecological Monographs, 61: 415–435.
Hobbie, S., 1996. Temperature and plant species control over litter decomposition in Alaskan tundra. Ecological Monographs, 66: 503–522.
Hobbie, S. & F. S. Chapin III, 1996. Winter regulation of tundra litter carbon and nitrogen dynamics. Biogeochemistry, 35: 327–338.
Hobbie, S., J. P. Schimel, S. E. Trumbore & J. R. Randerson, 2000. Controls over carbon storage and turnover in high-latitude soils. Global Change Biology, 6: 196–210.
Hulten, E., 1968. Flora of Alaska and Neighboring Territories: A Manual of the vascular Plants. Stanford Press, Stanford, California.
Jobbagy, E. G. & R. B. Jackson, 2000. Global controls of forest line elevation in the northern and southern hemispheres. Global Ecology & Biogeography, 9: 253–268.
Jonasson, S., A. Michelsen, I. K. Schmidt & E. v. Nielsen, 1999. Responses in microbes and plants to changed temperature, nutri-ent and light regimes in the arctic. Ecology, 80: 1828–1843.
Jones, D. L. & K. Kielland, 2002. Soil amino acid turnover domi-nates the nitrogen flux in permafrost-dominated taiga forest soils. Soil Biology & Biochemistry, 34: 209–219.
Kaye, J. P. & S. C. Hart, 1997. Competition for nitrogen between plants and soil microorganisms. Trends in Ecology & Evolution, 12: 139–143.
Kielland, K., 1994. Amino acid absorption by arctic plants: Implications for plant nutrition and nitrogen cycling. Ecology, 75: 2373–2383.
Kielland, K., 1995. Landscape patterns of free amino acids in arc-tic tundra soils. Biogeochemistry, 31: 85–98.
Kielland, K., 2001. Short-circuiting the nitrogen cycle: Ecophysiological strategies of nitrogen uptake in plants from marginal environments. Pages 376–398 in N. Ae, J. Arihara, K. Okada & A. Srinvasan (eds.). Plant Nutrient Acquisition: New Perspectives. Springer-verlag, Tokyo.
Körner, C., 1998. A re-assessment of high elevation treeline posi-tions and their explanation. Oecologia, 115: 445–459.
Ley, R. E. & S. K. Schmidt, 2002. Fungal and bacterial responses to phenolic compounds and amino acids in high latitude barren soils. Soil Biology & Biochemistry, 34: 989–995.
Lipson, D. A. & T. Näsholm, 2001. The unexpected versatility of plants: Organic nitrogen use and availability in terrestrial eco-systems. Oecologia, 128: 305–316.
Lipson, D. A., C. W. Schadt & S. K. Schmidt, 2002. Changes in soil microbial community structure and function in an alpine dry meadow following spring snow melt. Microbial Ecology, 43: 307–314.
Lipson, D. A., S. K. Schmidt & R. K. Monson, 1999. Links between microbial population dynamics and nitrogen availabil-ity in an alpine ecosystem. Ecology, 80: 1623–1631.
Lipson, D. A., S. K. Schmidt & R. K. Monson, 2000. Carbon availability and temperature control the post-snowmelt decline in alpine soil microbial biomass. Soil Biology & Biochemistry, 32: 441–448.
Lipson, D. A., T. K. Raab, S. K. Schmidt & R. K. Monson, 2001. An empirical model of amino acid transformations in an alpine soil. Soil Biology & Biochemistry, 33: 189-198.
Lloyd, A. H. & C. L. Fastie, 2002. Spatial and temporal variabil-ity in growth and climate response of treeline trees in Alaska. Climate Change, 52: 481–509.
Mallik, A. U. & F. Pellissier, 2000. Effects of Vaccinium myrtillus on spruce regeneration: Testing the notion of coevolutionary significance of allelopathy. Journal of Chemical Ecology, 26: 2197–2209.
McFarland, J. W., R. W. Ruess, K. Kielland & A. P. Doyle, 2002. Cycling dynamics of NH4
+ and amino acid nitrogen in soils of a deciduous boreal forest ecosystem. Ecosystems, 5: 775–788.
Michaelson, G. J. & C. L. Ping, 2003. Soil organic carbon and CO2 respiration at subzero temperatures in soils of arctic Alaska. Journal of Geophysical Research, 108(D2), 8164, doi:10.1029/2001JD000920.
Nadelhoffer, K. J., A. E. Giblin, G. R. Shaver & J. A. Laundre, 1991. Effects of temperature and substrate quality on element mineralization in six arctic soils. Ecology, 72: 242–253.
lOOmIS et al.: NItrOgEN CyClINg at trEElINES
556
Nadelhoffer, K. J., A. E. Giblin, G. R. Shaver & J. A. Laundre, 1992. Microbial processes and plant nutrient availability in arc-tic soils. Pages 281–300 in F. S. Chapin III, R. L. Jefferies, J. F. Reynolds, G. R. Shaver, J. Svoboda & E. W. Chu (eds.). Arctic Ecosystems in a Changing Climate: An Ecophysiological Perspective. Academic Press, San Diego, California.
Nilsson, M. C., 1994. Separation of allelopathy and resource com-petition by the boreal dwarf shrub Empetrum hermaphroditum Hagerup. Oecologia, 98: 1–7.
Nordin, A., P. Högberg & T. Näsholm, 2001. Soil nitrogen form and plant nitrogen uptake along a boreal forest productivity gradient. Oecologia, 129: 125–132.
Olsrud, M. & T. R. Christensen, 2004. Carbon cycling in subarctic tundra: Seasonal variation in ecosystem partitioning based on in situ 14C pulse-labeling. Soil Biology & Biochemistry, 36: 245–253.
Pomeroy, J. W. & E. Brun, 2001. Physical properties of snow. Pages 45–126 in H. G. Jones, J. W. Pomeroy, D. A. Walker & R. W. Hoham (eds.). Snow Ecology: An Interdisciplinary Examination of Snow-Covered Ecosystems. Cambridge University Press, Cambridge.
Robertson, G. P., D. Wedin, P. M. Groffman, J. M. Blair, E. A. Holland, K. J. Nadelhoffer & D. Harris, 1999. Soil carbon and nitrogen availability: Nitrogen mineralization, nitrification and soil respiration potentials. Pages 258–271 in A. Robertson, D. Coleman, C. Bledsoe & P. Sollins (eds.). Standard Soil Methods for Long-Term Ecological Research. Oxford University Press, New York, New York.
Rosen, H., 1957. A modified ninhydrin colorimetric analysis for amino acids. Archives of Biochemistry and Biophysics, 67: 10–15.
Ruess, R. W., K. van Cleve, J. Yarie & L. A. viereck, 1996. Contributions of fine root production and turnover to the car-bon and nitrogen cycling in taiga forests of the Alaskan interior. Canadian Journal of Forest Research, 26: 1326–1336.
Ruess, R. W., R. L. Hendrick & J. P. Bryant, 1998. Regulation of fine root dynamics by mammalian browsers in early succes-sional Alaskan taiga forests. Ecology, 79: 2706–2720.
Ruess, R. W., R. L. Hendrick, A. J. Burton, K. S. Pregitzer, B. Sveinbjörnsson, M. F. Allen & G. Maurer, 2003. Coupling fine root dynamics with ecosystem carbon cycling in black spruce forests of interior Alaska. Ecological Monographs, 74: 643–662.
SAS Institute, 1999. SAS Users Guide. version 8.2. SAS Institute, Cary, North Carolina.
Schadt, C. W., A. P. Martin, D. A. Lipson & S. K. Schmidt, 2003. Seasonal dynamics of previously unknown fungal lineages in tundra soils. Science, 301: 1359–1361.
Schimel, J. P. & J. Bennett, 2004. Nitrogen mineralization: Challenges of a changing paradigm. Ecology, 85: 591–602.
Schimel, J. P., C. Bilbrough & J. M. Welker, 2004. Increased snow depth affects microbial activity and nitrogen mineralization in two Arctic tundra communities. Soil Biology & Biochemistry, 36: 217–227.
Schimel, J. P. & F. S. Chapin III, 1996. Tundra plant uptake of amino acid and NH4
+ nitrogen in situ: Plants compete well for amino acid N. Ecology, 77: 2142–2147.
Schimel, J. P. & J. S. Clein, 1996. Microbial response to freeze-thaw cycles in tundra and taiga soils. Soil Biology & Biochemistry, 28: 1061–1066.
Schulze, E. D., F. S. Chapin III & G. Gebauer, 1994. Nitrogen nutrition and isotope differences among life forms at the north-ern treeline of Alaska. Oecologia, 100: 406–412.
Seastedt, T. R. & G. A. Adams, 2001. Effects of mobile tree islands on alpine tundra soils. Ecology, 82: 8–17.
Sjögersten, S. & P. A. Wookey, 2002. Climatic and resource quality controls on soil respiration across a forest–tundra eco-tone in Swedish Lapland. Soil Biology & Biochemistry, 34: 1633–1646.
Stevens, G. C. & J. F. Fox, 1991. The causes of treeline. Annual Review of Ecology and Systematics, 22: 177–191.
Stottlemyer, R., C. Rhoades & H. Steltzer, 2001. Soil tempera-ture, moisture, and carbon and nitrogen mineralization at a taiga–tundra ecotone, Noatak National Preserve, northwestern Alaska. Studies by the US Geological Survey Professional Paper 1678: 127–137.
Sveinbjörnsson, B., 2000. North American and European treelines: External forces and internal processes controlling position. Ambio, 29: 388–395.
Sveinbjörnsson, B., A. Hofgaard & A. Lloyd, 2002. Natural causes of the tundra–taiga boundary. Ambio Special Report, 12: 23–29.
Sveinbjörnsson, B., J. Davis, W. Abadie & A. Butler, 1995. Soil carbon and nitrogen mineralization at different elevations in the Chugach mountains of south-central Alaska, USA Arctic and Alpine Research, 27: 29–37.
vance, E. D. & F. S. Chapin III, 2001. Substrate limitations to microbial activity in taiga forest floors. Soil Biology & Biochemistry, 33: 173–188.
van Hees, P. A., D. L. Jones, R. Finlay, D. L. Godbold & U. S. Lundström, 2005. The carbon we do not see—The impact of low molecular weight compounds on carbon dynamics and res-piration in forest soils: A review. Soil Biology & Biochemistry, 37: 1–13.
viereck, L. A., C. T. Dyrness, A. R. Batten & K. J. Wenzlick, 1992. The Alaska vegetation Classification. US Department of Agriculture, Forest Service Pacific Northwest Research Station General Technical Report PNW-GTR-286, Portland, Oregon.
vitousek, P. M. & R. W. Howarth, 1991. Nitrogen limitation on land and in the sea: How can it occur? Biogeochemistry, 13: 87–115.
Walker, M. D., D. A. Walker, J. M. Welker, A. M. Arft., T. Bardsley, P. D. Brooks, J. T. Fahnestock, M. H. Jones, M. Losleben, A. N. Parsons, T. R. Seastedt & P. L. Turner, 1999. Long-term experi-mental manipulation of winter snow regime and summer tem-perature in arctic and alpine tundra. Hydrological Processes, 13: 2315–2330.
Wardle, D. A., M. C. Nilsson, C. Gallet & O. Zackrisson, 1998. An ecosystem-level perspective of allelopathy. Biological Revue, 73: 305–319.
Whitledge, T. E, S. C. Malloy, C. J. Patton & C. D. Wirick, 1981. Automated nutrient analysis in seawater. Technical Report BNL-51398, Brookhaven National Laboratory, Upton, New York.
Wilmking, M., G. P. Juday, v. A. Barber & H. S. Zald, 2004. Recent climate warming forces contrasting growth responses of white spruce at treeline in Alaska through temperature thresh-olds. Global Change Biology, 10: 1724–1736.