Embed Size (px)
Citation preview

Purdue UniversityPurdue e-Pubs
Open Access Dissertations Theses and Dissertations
Fall 2013
Nitrogen and Potassium Dynamics of SelectedIndiana SoilsChun ZhaoPurdue University
Follow this and additional works at: https://docs.lib.purdue.edu/open_access_dissertations
Part of the Soil Science Commons
This document has been made available through Purdue e-Pubs, a service of the Purdue University Libraries. Please contact [email protected] foradditional information.
Recommended CitationZhao, Chun, "Nitrogen and Potassium Dynamics of Selected Indiana Soils" (2013). Open Access Dissertations. 12.https://docs.lib.purdue.edu/open_access_dissertations/12

Graduate School ETD Form 9 (Revised 12/07)
PURDUE UNIVERSITY GRADUATE SCHOOL
Thesis/Dissertation Acceptance
This is to certify that the thesis/dissertation prepared
By
Entitled
For the degree of
Is approved by the final examining committee:
Co-Chair
To the best of my knowledge and as understood by the student in the Research Integrity and Copyright Disclaimer (Graduate School Form 20), this thesis/dissertation adheres to the provisions of Purdue University’s “Policy on Integrity in Research” and the use of copyrighted material.
Approved by Major Professor(s): ____________________________________
____________________________________
Approved by: Head of the Graduate Program Date
Chun Zhao
Nitrogen and Potassium Dynamics of Selected Indiana Soils
Doctor of Philosophy
Brad Joern
Jim Camberato
Darrell Schulze
Hao Zhang
Brad Joern
Joseph Anderson 10/10/2013

NITROGEN AND POTASSIUM DYNAMICS OF SELECTED INDIANA SOILS
A Dissertation
Submitted to the Faculty
of
Purdue University
by
Chun Zhao
In Partial Fulfillment of the
Requirements for the Degree
of
Doctor of Philosophy
December 2013
Purdue University
West Lafayette, Indiana

ii
To Ben

iii
ACKNOWLEDGEMENTS
I would like to thank my co-advisors, Dr. Brad Joern and Dr. Jim
Camberato, for providing me this life-changing opportunity to study and do
research here at Purdue. Their guidance and help through my six-year study are
really appreciated. I also want to thank my committee, Dr. Darrell Schulze and Dr.
Hao Zhang for their valuable input into my research program.
I want to thank all my instructors who taught me not only knowledge but
also skills that benefit me for my future career. I want to thank Dr. George Van
Scoyoc for providing me a teaching opportunity and many thanks to Sherry Fulk-
Bringman who inspired my great interest in teaching.
I would like to thank all the people who helped me in my research program.
Thanks to Dr. Eileen Kladivko for her help with the soil water pressure analyses.
Thanks to Dr. Sylvie Brouder for providing the soil samples. Thanks to Judy
Santini for assisting with statistical analysis. I also would like to thank my
labmates Blucher, Branly, and Min for their suggestions and help to my study and
research. I want to thank all the undergraduate lab workers who assisted me with
laboratory analysis.
Last but not least, I want to thank my family and all my friends. Without all
their love and support, I could not become who I am and could not go this far. I
am so thankful.

iv
TABLE OF CONTENTS
Page LIST OF TABLES ............................................................................................... viii LIST OF FIGURES ...............................................................................................xi ABSTRACT .........................................................................................................xv CHAPTER 1. NITROGEN MINERALIZATION IN SOILS: A LITERATURE REVIEW ..................................................................................... 1
1.1 Introduction .................................................................................... 1
1.2 Soil Nitrogen Mineralization ........................................................... 2
1.3 Factors Affecting Soil Nitrogen Mineralization ............................... 2
1.4 Prediction of Soil Nitrogen Mineralization ...................................... 4
1.4.1 Laboratory Measurements ...................................................... 4 1.4.2 Field Estimates ........................................................................ 6 1.4.3 Predicting Nitrogen Mineralization with Models ....................... 7
1.5 Nitrogen Cycling in the Soil ............................................................ 9
1.5.1 Immobilization ......................................................................... 9 1.5.2 Nitrification .............................................................................. 9 1.5.3 Denitrification ........................................................................ 12 1.5.4 Ammonium Fixation............................................................... 13 1.5.5 Ammonia Volatilization .......................................................... 14 1.5.6 Biological Nitrogen Fixation ................................................... 17 1.5.7 Nitrate Leaching .................................................................... 18 1.5.8 Crop Uptake .......................................................................... 19
1.6 Nitrogen Fertilizer Management .................................................. 20
1.6.1 Application Rate .................................................................... 20 1.6.2 Application Methods .............................................................. 22 1.6.3 Application Timing ................................................................. 22
1.7 Concluding Remarks ................................................................... 23
1.8 Reference .................................................................................... 25
CHAPTER 2. ESTIMATING POTENTIALLY MINERALIZABLE NITROGEN IN INDIANA SOILS ....................................................................... 42
2.1 Abstract ....................................................................................... 42

v
2.2 Introduction .................................................................................. 44
2.3 Materials and Methods ................................................................ 47
2.3.1 Comparison of Different Biological Methods used to Measure ... Mineralized Nitrogen ............................................................... 47 2.3.2 Estimation of Mineralizable Nitrogen in Indiana Soils at ........... Different Depths .................................................................... 49 2.3.3 Field Experiment ................................................................... 52 2.3.4 Data Analysis ........................................................................ 53
2.4 Results and Discussion ............................................................... 54
2.4.1 Comparison among Different Biological Methods for ............... Measuring Mineralized Nitrogen ............................................ 54 2.4.2 Estimation of Mineralizable Nitrogen in Indiana Soils at ........... Different Depths .................................................................... 58 2.4.3 Nitrogen Mineralization Potential from Field Estimates ......... 63
2.5 Conclusions ................................................................................. 66
2.6 Reference .................................................................................... 67
CHAPTER 3. CAN WE IMPROVE IN-SEASON CORN NITROGEN FERTILIZER RECOMMENDATIONS WITH A NITROGEN TRANSFORMATION AND LOSS MODEL? ............................. 89
3.1 Abstract ....................................................................................... 89
3.2 Introduction .................................................................................. 90
3.3 Model Description ........................................................................ 93
3.3.1 Estimation of Soil Moisture and Temperature ....................... 93 3.3.2 Soil Nitrogen Transformation and Loss Processes ............... 93
3.4 Model Application ...................................................................... 100
3.4.1 Field Site ............................................................................. 100 3.4.2 Input Data ............................................................................ 100 3.4.3 Simulation Results and Discussion ..................................... 100
3.5 Conclusion ................................................................................. 102
3.6 Reference .................................................................................. 104
CHAPTER 4. POTASSIUM IN SOILS: A LITERATURE REVIEW ............... 115 Introduction ................................................................................ 115 4.1
Forms of Potassium ................................................................... 116 4.2
Structural Potassium ........................................................... 116 4.2.1 Nonexchangeable Potassium .............................................. 116 4.2.2 Exchangeable Potassium .................................................... 117 4.2.3 Solution Potassium.............................................................. 118 4.2.4
The Potassium Cycle ................................................................. 118 4.3

vi
Weathering/Formation ......................................................... 118 4.3.1 Release/Fixation ................................................................. 119 4.3.2 Crop K Uptake ..................................................................... 122 4.3.3
Methods of Assessing Nonexchangeable Potassium ................ 124 4.4
Boiling Nitric Acid Extraction ............................................... 124 4.4.1 Sodium Tetraphenylboron Extraction .................................. 124 4.4.2 Exhaustive Cropping of Soil in the Greenhouse .................. 125 4.4.3
Potassium Fertilizer Management ............................................. 125 4.5
Application Rate .................................................................. 125 4.5.1 Application Timing ............................................................... 126 4.5.2
Concluding Remarks ................................................................. 127 4.6
Reference .................................................................................. 128 4.7
CHAPTER 5. IMPACT OF BAND INJECTION OF ANHYDROUS AMMONIUM ON SOIL POTASSIUM CONCENTRATION ........................... 136
Abstract: .................................................................................... 136 5.1
Introduction ................................................................................ 137 5.2
5.3 Materials and Methods .............................................................. 140
5.3.1 Sample Treatment ............................................................... 140 5.3.2 Sample Analysis .................................................................. 141 5.3.3 Data Analysis ...................................................................... 142 Results and Discussion ............................................................. 142 5.4
Soil pH ................................................................................. 142 5.4.1 Soil Exchangeable and Nonexchangeable Potassium Content . 5.4.2
143 5.4.3 Comparison between Two Nonexchangeable Potassium ........ Extraction Methods.............................................................. 147 Conclusion ................................................................................. 148 5.5
Reference: ................................................................................. 150 5.6
CHAPTER 6. IMPACT OF MOISTURE ON SOIL TEST POTASSIUM LEVELS ............................................................................................... 162
Abstract ..................................................................................... 162 6.1
Introduction ................................................................................ 163 6.2
Materials and Methods .............................................................. 165 6.3
Results ....................................................................................... 166 6.4
Discussion ................................................................................. 167 6.5
Conclusion ................................................................................. 169 6.6
References: ............................................................................... 170 6.7

vii
APPENDICES
Appendix A Locations of Study Sites ............................................................ 177
Appendix B Summary of Analysis of Variance Tables .................................. 179
Appendix C Soil Water Retention Data ......................................................... 183
VITA ................................................................................................................. 185

viii
LIST OF TABLES
Table .............................................................................................................. Page
Table 1.1 Nitrogen uptake in the harvested portions of selected agronomic crops†.
............................................................................................................ 40
Table 2.1 Selected properties of eight Indiana soils collected at 0-30 cm depth of
the Ap horizon. .................................................................................... 74
Table 2.2 Predominat soil series and taxonomic class of soils for seven sites ... 75
Table 2.3 Properties of soils collected at four depths (0 to 15, 15 to 30, 30 to 45,
and 45 to 60cm) from seven sites in Indiana. ...................................... 76
Table 2.4 The cumulative amount of nitrogen (NO3--N and NH4
+-N) mineralized
by eight soils during the 16 week incubation for the leaching incubation
and static cup incubation methods. ..................................................... 77
Table 2.5 Root mean square errors for zero-order and first-order models fitted to
N mineralization data obtained for the leaching incubation and static
cup incubation methods. ...................................................................... 77
Table 2.6 Plant uptake nitrogen, mineral nitrogen in soils before and after
cropping, and observed net nitrogen mineralized under greenhouse
conditions. ........................................................................................... 78
Table 2.7 Predicted N0 and K values of four depth for seven soils†. The relative
contribution from the top soil (0-15cm) was indicated. ......................... 79

ix
Table 2.8 Results from various indices for predicting potentially mineralizable
nitrogen in seven soils of four depths. ................................................. 80
Table 2.9 Estimated field soil nitrogen supply (in kg ha-1) for seven soils in 2006,
2008, and 2010. ................................................................................... 81
Table 3.1 Summary of model parameter inputs. ............................................... 109
Table 3.2 Nitrogen model predictions at various fertilizer nitrogen rates from 2006
to 2011 at ACRE (Unit: kg ha-1). ........................................................ 110
Table 4.1 The amount of potassium removed in harvest portions of selected
agronomic crops† ............................................................................... 135
Table 5.1 Soil characteristics in the upper 30 cm of the Ap horizon of the
Chalmers, Pewamo, Pinhook, and Raub soil samples. ..................... 156
Table 5.2 Protected LSD(0.05) values for sources of variance in exchangeable
(Ex_K) and nonexchangeable (NonEx_K) K levels (mg kg-1) in
Chalmers, Pewamo, Pinhook, and Raub soils. .................................. 157
Table 6.1 Soil characterization of a bulk soil sample collected from five field sites.
.......................................................................................................... 173
Appendix Table
Appendix Table A.1 Geographic coordinates of study sites for chapter 2, 3 and 5.
......................................................................................................................... 178
Appendix Table B.1 Analysis of variance for mineralized N evaluated by different
incubation methods ........................................................................... 179
Appendix Table B.2 Analysis of variance for laboratory predicted mineralizable N
(N0), mineralization rate constant (k) and products of N0⨉k .............. 180

x
Appendix Table B.3 Analysis of variance for pH, exchangeable (Ex_K) and
nonexchangeable K (Nonex_K) levels in Chalmers, Pewamo, Pinhook,
and Raub soils after injection of anhydrous ammonia. ...................... 181
Appendix Table B.4 Analysis of variance for soil test K levels as affected by
drying. ................................................................................................ 182
Appendix Table C.1 Soil moisture contents at water retentions of 10 kPa, 33 kPa,
50 kPa, and 100 kPa for selected soils (unit: g g-1). .......................... 183
Appendix Table C.2 Soil moisture contents at water retention of 10 kPa for
selected soils at four depths. ............................................................. 184
xi
LIST OF FIGURES
Figure ............................................................................................................. Page
Figure 1.1 Nitrogen uptake rate of corn and wheat as a function of crop growth
over time. Adapted from UCWRC, unknown publish year. ................. 41
Figure 2.1 Time course of N mineralization of eight Indiana soils through 16
weeks for the leaching incubation method. The cumulative N values
obtained as a sum of NO3--N and NH4
+-N were mean of three
replicates. Error bars indicate the standard deviation of the mean of
three replicates. .................................................................................. 82
Figure 2.2 Time course of N mineralization of eight Indiana soils through 16
weeks for the static cup incubation method. The cumulative N values
obtained as a sum of NO3--N and NH4
+-N were mean of three
replicates. Error bars indicate the standard deviation of the mean of
three replicates. .................................................................................. 83
Figure 2.3 The linear relationship between mineralized nitrogen estimated from
two laboratory incubation methods to greenhouse measurements of
plant nitrogen uptake. ......................................................................... 84
Figure 2.4 Time course of N mineralization of four depths of soils from seven
locations. The cumulative N values obtained as a sum of NO3--N and
NH4+-N were mean of three replicates. Error bars indicate the
standard deviation of the mean of three replicates. ............................ 85

xii
Figure 2.5 Correlation between nitrogen indices and mineralizable N estimated
from long-term static cups incubation. ................................................ 86
Figure 2.6 Correlation between nitrogen indices and mineralization rate constant
k estimated from long-term static cups incubation. ............................. 87
Figure 2.7 The relationship between laboratory soil N mineralization estimates
and predicted soil N supply in the field. The horizontal error bars are
the standard deviation of the mean of triplicate measurements of lab
mineralization and the vertical error bars are the standard deviation of
the mean of three years of observations in the field. .......................... 88
Figure 3.1 The N cycle considered in this model. ............................................. 111
Figure 3.2 An example of model output showing soil N accumulation and loss
and crop N uptake resulting from an application of 224 kg ha-1 fertilizer
N (as UAN) in 2008 at ACRE. .......................................................... 112
Figure 3.3 Relationship between model-simulated corn N uptake and measured
corn grain yield for each individual site year. .................................... 113
Figure 3.4 Relationship between model-simulated corn N uptake and measured
corn grain yield (A) and relative corn grain yield (B) across 2006 to
2011. ................................................................................................ 114
Figure 5.1 Soil pH over 28 days after injection of anhydrous ammonia as affected
by distance from the anhydrous ammonia injection point in (A)
Chalmers, (B) Pewamo, (C) Pinhook, and (D) Raub soil. Dash lines
indicate initial soil pH. Soil pH values were obtained from a 1:2 slurry
as mean of three replicates. Error bars indicate the standard deviation
of the means. .................................................................................... 158
Figure 5.2 Distribution of exchangeable K over time and distance from the
anhydrous ammonia injection point in a Chalmers, Pewamo, Pinhook,

xiii
and Raub soil after injection of anhydrous ammonia. Dash lines
indicate the exchangeable K concentration in untreated soils. The
exchangeable K values are means of three replicates. Error bars
indicate the standard deviation of the means. .................................. 159
Figure 5.3 Distribution of total nonexchangeable K over time and distance from
the anhydrous ammonia injection point in a Chalmers, Pewamo,
Pinhook, and Raub soil after injection of anhydrous ammonia. Dash
lines indicate the total nonexchangeable K concentration in untreated
soils. The nonexchangeable K values are means of three replicates.
Error bars indicate the standard deviation of the means. ................. 160
Figure 5.4 Distribution of total nonexchangeable K over distance from the
anhydrous ammonia injection point in Pewamo soil seven days after
injection of anhydrous ammonia. Total nonexchangeable K was
extracted with boiling nitric acid (A) and by 7-d incubation in sodium
tetraphenylboron (STPB) (B). The nonexchangeable K values are
means of two replicates. Error bars indicate the standard deviation of
the means. ........................................................................................ 161
Figure 6.1 The relationship between Mehlich-3 soil test K levels of oven-dried
soils vs. Mehlich-3 soil test K levels of air-dried soils from five locations.
......................................................................................................... 174
Figure 6.2 Relationship between the Mehlich-3 soil test K levels of moist soils
from four locations (DPAC, NEPAC, SEPAC, and TPAC) and the
percent change in soil test K upon drying as described by the
logarithmic model [Y=a + b×log(x)]. Soil test K levels upon drying were
presented as the mean of air- and oven-dried samples. The vertical
lines showed soil K critical levels predicted using model: Critical K
=75+2.5*CEC (Vitosh et al., 1995). The vertical dash lines showed soil
K critical levels predicted using model: Critical K = 34.5-3.41×illite

xiv
K+3.52×CEC (Cox et al., 1999) where illite K is measured by NaBPh4+
extraction after soil was incubated in it for seven days. .................... 175
Figure 6.3 Relationship between the Mehlich-3 soil test K levels of moist soils
from PPAC and the percent change in soil test K upon drying. Soil test
K levels upon drying were presented as the mean of air- and oven-
dried samples. The vertical line showed soil K critical levels predicted
using model: Critical K =75+2.5*CEC (Vitosh et al., 1995). The vertical
dash line showed PPAC soil K critical level predicted using model:
Critical K = 34.5-3.41×illite K+3.52×CEC (Cox et al., 1999) where illite
K is measured by NaBPh4+ extraction after soil was incubated in it for
seven days. ...................................................................................... 176
Appendix Figure
Appendix Figure A.1 Locations of seven study sites where soil sample was
collected ........................................................................................... 177

xv
ABSTRACT
Zhao, Chun. Ph.D., Purdue University, December 2013. Nitrogen and Potassium Dynamics of Selected Indiana Soils. Major Professors: Brad Joern and Jim Camberato.
Nitrogen (N) is the most limiting essential nutrient for crop growth. Numerous
studies have been performed to improve N fertilizer recommendations. Accurate
prediction of soil N supply has been found to be one of the most important factors
that determine optimum fertilizer N rates. Seven soils collected from various
locations across Indiana at four different depths were tested for N mineralization
potential. Results showed that laboratory mineralizable N in the top layer (0-15
cm) of the seven soils ranged from 50 to 68 mg N kg-1 soil. In addition, more than
50% of the total mineralizable N was contributed from the 15 to 60 cm depths.
Different methodologies used for estimating soil N supply capacity were also
compared in this study. We found that soil N mineralization estimated from long-
term static laboratory incubation was correlated to crop N uptake under
greenhouse conditions. Some chemical indices such as Illinois Soil Nitrogen Test,
anaerobic-N, and Hot KCl-N also showed promises in predicting laboratory N
mineralization potential. However, the mineralizable N estimated from laboratory
incubations did not show any relationship with soil N supply in the field, which
can be attributed to large weather variations under field conditions. Therefore, a
process-based weather-driven N transformation and loss model was developed
to improve the prediction of optimum in-season fertilizer N rates. So far through
simple regression analyses from existing N response studies we found that
xvi
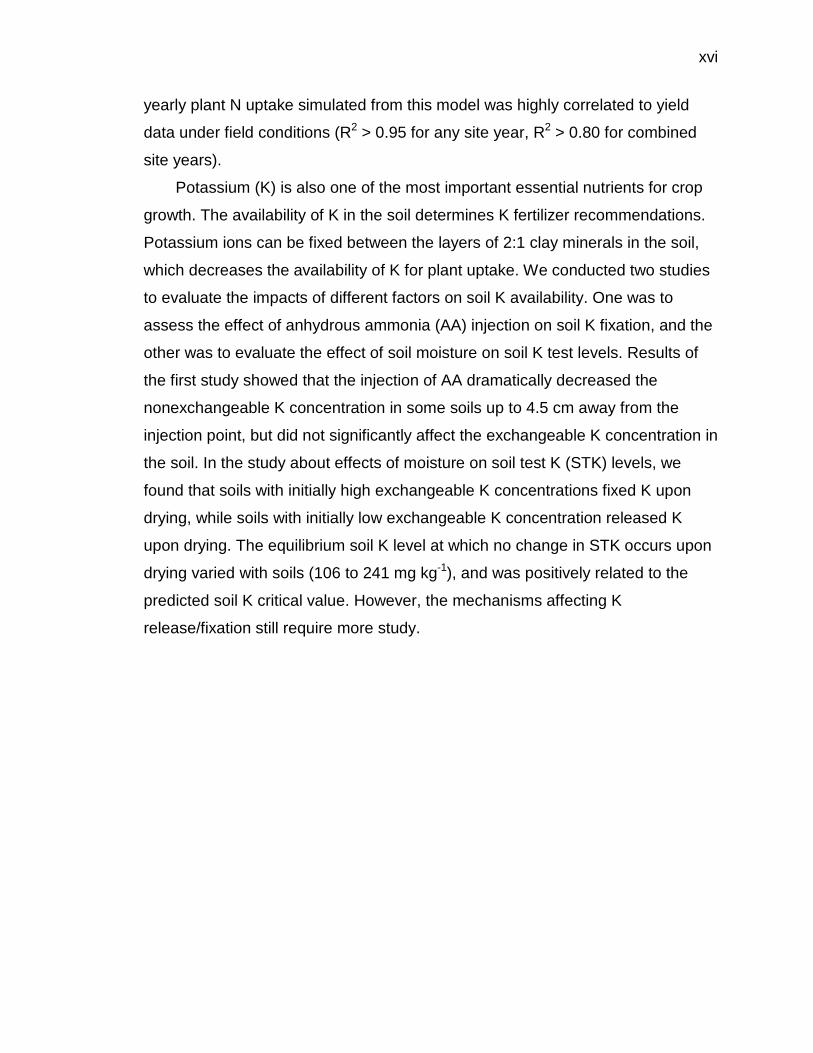
yearly plant N uptake simulated from this model was highly correlated to yield
data under field conditions (R2 > 0.95 for any site year, R2 > 0.80 for combined
site years).
Potassium (K) is also one of the most important essential nutrients for crop
growth. The availability of K in the soil determines K fertilizer recommendations.
Potassium ions can be fixed between the layers of 2:1 clay minerals in the soil,
which decreases the availability of K for plant uptake. We conducted two studies
to evaluate the impacts of different factors on soil K availability. One was to
assess the effect of anhydrous ammonia (AA) injection on soil K fixation, and the
other was to evaluate the effect of soil moisture on soil K test levels. Results of
the first study showed that the injection of AA dramatically decreased the
nonexchangeable K concentration in some soils up to 4.5 cm away from the
injection point, but did not significantly affect the exchangeable K concentration in
the soil. In the study about effects of moisture on soil test K (STK) levels, we
found that soils with initially high exchangeable K concentrations fixed K upon
drying, while soils with initially low exchangeable K concentration released K
upon drying. The equilibrium soil K level at which no change in STK occurs upon
drying varied with soils (106 to 241 mg kg-1), and was positively related to the
predicted soil K critical value. However, the mechanisms affecting K
release/fixation still require more study.

1
CHAPTER 1. NITROGEN MINERALIZATION IN SOILS: A LITERATURE REVIEW
1.1 Introduction
Nitrogen (N) is considered the most limiting essential nutrient required for
crop growth. Most plants take up greater amounts of N than any other nutrient,
and N is a major component of proteins, nucleic acids and chlorophyll (Brady and
Weil, 2008), which are all critical for plant growth.
A lack of N causes yellowish leaves, stunts growth and lowers yield, while an
adequate supply of N leads to rapid crop growth with high yields and good quality.
If N is oversupplied, excessive vegetative growth occurs and maturity can be
delayed (Brady and Weil, 2008). In some cases, plant stems can become tall and
weak and prone to lodging with heavy rain or wind. In addition, excessive N
applications can lead to poor crop N uptake efficiency and may result in
increased greenhouse gas emissions and nitrate loss to groundwater. Therefore
the development of optimum N fertilizer recommendations is important for
agronomic, economic and environmental reasons.
The main sources of N input to cropland include N supplied via commercial
fertilizers, manures and other N rich organic materials, biological N fixation from
legumes and other N-fixing organisms, atmospheric deposition, and N
mineralized from soil organic matter and crop residues (Cassman et al., 2002).
Except commercial fertilizer and manure application, other N input sources are
treated as an indigenous N supply. Typically the indigenous N supply ranges
from 80 to 240 kg N ha-1, while corn takes up about 190 kg N ha-1 to produce a
yield of 10,000 kg ha-1(Cassman et al., 2002).

2
Research also has shown that mineralized soil N is able to provide 20 to 80% of
the N required by crops (Broadbent, 1984). Improved estimates of soil N
mineralization should allow us to develop more accurate N fertilizer
recommendations to optimize crop yield and profitability while minimizing impacts
on the environment.
1.2 Soil Nitrogen Mineralization
Plants mostly take up N as nitrate (NO3-) and ammonium (NH4
+). However,
in the soil 89 to 98% of the total N is in the organic form (Foth and Ellis, 1996).
Organic N can be converted to mineral forms by a wide variety of heterotrophic
bacteria and fungi in a process called mineralization.
In well-drained soils, about 2% of the organic N is mineralized annually (Foth
and Ellis, 1996). Mineral soils with 2% organic matter contain nearly 2000 kg N
ha-1 in a 15-cm thick plow layer (based on a bulk density of 1.33 g cm-3), so
approximately 40 kg N ha-1 would be mineralized annually from the surface soil
layer. The amount of N from soil organic matter mineralization can be simply
predicted by a mass balance approach: mineralized N = (plant-uptake N + N loss
by leaching, volatilization, and denitrification + residual N) minus (inputs + initial
N content) (Keeney, 1980). However, this approach is not reliable, because N
loss is impossible measured precisely and plant N uptake depends on weather
and management. So far a number of techniques have been used to estimate
soil N mineralization rate, but no reference method is known to accurately
measure soil N mineralization (Raison et al., 1987).
1.3 Factors Affecting Soil Nitrogen Mineralization
Nitrogen mineralization in soils is affected by various factors, including
carbon (C) input rate (Matus et al., 2008), cropping system (Deng and Tabatabai,

3
2000; Senwo and Tabatabai, 2005), oxygen availability (Parr and Reuszer, 1959;
Zibilske and Bradford, 2006), soil pH (Fu et al., 1987; Senwo and Tabatabai,
2005), temperature and water content (Stanford et al., 1973; Stanford and
Epstein, 1974; Antonopoulos, 1999). In general, these are the same factors that
affect microbial activity and plant growth.
Carbon inputs from crop residues generally have significant and positive
effects on soil N mineralization (Matus et al., 2008). However, this effect also
depends on the capacity of soils to preserve soil organic C. In highly C saturated
sandy forest soils, free organic matter accumulated in the sand-size fraction
results in a considerable increase in N mineralization. However, cropped soils
can sequester soil organic C in their clay and silt fractions, which causes
substantial losses in labile C (Carter et al., 2003). Additionally, organic C inputs
and the quality of plant residues returned to the soil can be affected by the
cropping system (Moore et al., 2000). The effect of three crop rotation systems
on N mineralization was studied by Senwo and Tabatabai (2005). They found
that the amounts of N mineralized in soils from corn-oats-meadow-meadow
rotation plots were greater than in soils from continuous corn and corn-soybean
cropping systems, because crop rotations involving alfalfa or meadow increase
organic C inputs and quality, resulting in greater microbial biomass and activity.
The effect of soil pH on N mineralization is not obvious in most situations
because a wide range of organisms participate in this process. Studies showed
liming soils to greater pH values (from 4.9 to 6.7) does not affect N mineralization
rates (Dancer et al., 1973; Senwo and Tabatabai, 2005). However, liming effects
can increase N mineralization at high temperatures (Senwo and Tabatabai,
2005). In some extremely acid situations, mineralization is minimal (Foth and
Ellis, 1996).
Nitrogen mineralization generally increases with temperature and soil
moisture until an optimum is reached (Stanford et al., 1973; Stanford and Epstein,
1974; Antonopoulos, 1999). Within the range of 5 to 35 °C, an Arrhenius function

4
describes the relationship between temperature and N mineralization as a 10-
degree increase in temperature increases the mineralization rate two times
(Stanford et al., 1973; Kladivko and Keeney, 1987). At optimum soil temperatures,
mineralization increases with soil moisture up to near field capacity (Stanford and
Epstein, 1974), but mineralization in water-saturated soil is limited due to oxygen
deficiency (Campbell, 1978). However, the combined effect of moisture-
temperature interactions is still not clear (Cassman and Munns, 1980; Kladivko
and Keeney, 1987; Wennman and Kätterrer, 2006).
1.4 Prediction of Soil Nitrogen Mineralization
1.4.1 Laboratory Measurements
Numerous laboratory methods for estimating soil N availability have been
proposed (Bremner, 1965; Keeney, 1980; Bundy and Meisinger, 1994; Griffin,
2008). The most satisfactory methods currently available are biological methods
that measure mineral N produced when the soil is incubated under aerobic or
anaerobic conditions. Although these measurements estimate the pools of
potentially mineralizable N present at the time of sample collection, they may not
be a reliable index of field N mineralization rates due to the disturbance of soil
samples before laboratory incubation (Bremner, 1965; Keeney and Bremner,
1966; Raison et al., 1987) and the difference between incubation conditions in
laboratory and weather variations at field scale (Jarvis et al., 1996).
A variety of chemical extraction methods for N mineralization have also been
developed because these measurements are believed to be more rapid and
precise than biological methods (Keeney and Bremner, 1966; Schomberg et al.,
2009). However, none of these chemical techniques closely simulates the
microbial processes involved in soil N mineralization (Keeney and Bremner,
1966). The accuracy of each chemical method is highly influenced by soil type,

5
molarities of the extracting solution, soil-solution ratio, extraction time and
temperature (Ros et al., 2011a).
1.4.1.1 Biological Methods
The most widely used biological method for estimating soil N mineralization
potential is the aerobic incubation method established by Stanford and Smith
(1972). They predicted mineralizable soil N by a first-order exponential model
obtained from a biologically based, long-term aerobic incubation method. The
exponential equation is denoted by:
Nm = N0 (1-exp (-kt))
where Nm is cumulative net N mineralization in time t, N0 is the potentially
mineralizable N, and k is the first order rate constant. Some researchers
indicated that a two-pool model fits N mineralization data better than the one-pool
model (Molina et al., 1980; Beauchamp et al., 1986; Cabrera and Kissel, 1988),
because the pretreatment of soil samples (freezing and drying, or drying) can
result in a flush of N released on rewetting of soil samples (Cabrera and Kissel,
1988; Wang et al., 2003). Such processes take place fast, most likely within the
first four weeks of incubation. However, it is only a small pool of mineralizable N
which can be ignored according to Cabrera and Kissel (1988).
Waring and Bremner (1964) developed the short-term anaerobic incubation
method to estimate mineralizable N. This method quantifies the ammonium-N
produced in the soil, which is incubated under waterlogged conditions for 14 days
at 30 °C or 7 days at 40 °C. A strong relationship between the aerobic incubation
method and anaerobic incubation method has been observed in several studies
(Gianello and Bremner, 1986; Chan, 1997; Schomberg et al., 2009).
Exhaustive cropping under greenhouse conditions is also used to evaluate
soil N availability (Keeney and Bremner, 1966). Soils are cropped with plants in
the greenhouse and fertilized with a minus-N nutrient mixture. A cropping and

6
harvesting sequence is repeated for several months until the plants stop growing.
Total plant biomass and root uptake is measured along with the mineral N
concentration in the soils before and after cropping. It was found that the N
content in the first cutting of crop was highly affected by the initial N
concentration in the soil, while N uptake by the second and third cuttings was
correlated with laboratory indexes of N availability (Keeney and Bremner, 1966).
1.4.1.2 Chemical Methods
Chemical methods used as indices of soil N availability include extraction
with boiling water (Keeney and Bremner, 1966), hot or cold KCl (Gianello and
Bremner, 1986), alkaline KMnO4 (Subbiah and Asija, 1956), alkalai hydrolysis in
NaOH (Cornfield, 1960), Illinois Soil Nitrogen Test (ISNT, Khan et al., 2001) and
so on. Some of these methods were developed before 1980 and have been
evaluated in several papers (Keeney and Bremner, 1966; Campbell et al., 1997;
Schomberg et al., 2009). Some researchers found N extracted with boiling water
was closely related to N mineralization rate (Keeney and Bremner, 1966; Ros at
al., 2011a), while others found high correlations between hot KCl-extractable N
and N mineralization (Gianello and Bremner, 1986; Schomberg et al., 2009). The
ISNT was developed as a quick and simple alternative to determine amino sugar
N as hydrolysable amino sugar N has been shown to predict mineralizable soil N
(Bushong et al., 2008). However, there are also other reports that found low
correlations between chemical indexes and biological methods (Groot and Houba,
1995; Jalil et al., 1996; Selles et al., 1999; Curtin et al., 2006). So far no single
availability index of soil N mineralization/availability from chemical measurements
has been widely accepted.
1.4.2 Field Estimates
Numerous techniques have been developed to measure or estimate N
mineralization under field conditions, because these methods cause less soil
disturbance that can markedly affect soil mineralization rates (Bremner, 1965;

7
Keeney and Bremner, 1966; Raison et al., 1987) and take full consideration of
environmental changes (Raison et al., 1987). However, measuring soil N
mineralization in situ is not an easy task. Various methods exist, including placing
disturbed soil in plastic bags buried in the field (Eno, 1960), or undisturbed soil
columns using open-ended polyvinyl chloride (PVC) tubes (Adams and Attiwill,
1986; Kolberg et al., 1997; Gurlevik et al., 2004). These methods demand more
replications due to high spatial variability in N mineralization (Macduff and White,
1985). In addition, predictions of mineralizable N were significantly worse when
mineralization was measured in the field compared with measurements under
controlled conditions (Ros et al., 2011a). One of the greatest challenges with in-
field measurements is the inherent variability imposed by weather from site to
site and year to year. Although these climate variability issues are not an issue
with traditional biological and chemical laboratory methods, temporal changes in
mineralizable soil N are a reality at field scale.
1.4.3 Predicting Nitrogen Mineralization with Models
Nitrogen mineralization under field conditions has also been simulated
through modeling approaches by considering field fluctuations in temperature
and moisture (Cameron and Kowalenko, 1976; Myers et al., 1982; Antonopoulos,
1999). First-order kinetic models are used to quantify the mineralization process
(Stanford and Smith, 1972; Cameron and Kowalenko, 1976), where the
mineralization rate is proportional to the amount of potentially mineralizable soil
N, and is defined by the equation:
𝑑𝑁𝑑𝑡
= −𝑘𝑁0
where N0 is the amount of soil mineralizable N and k is the mineralization rate
constant. This equation can also be expressed as:
Nm = N0 (1-exp (-kt))

8
where Nm is cumulative net N mineralization in time t, N0 is the potentially
mineralizable N, and k is the first order rate constant. The potentially
mineralizable N is the fraction of organic N in the soil which is readily mineralized.
Ros et al. (2011b) indicated that the size of soil organic matter pools and
fractions is the primary factor that controls soil N mineralization potential.
To incorporate weather factors into the equation, the mineralization rate
constant k is adjusted by soil temperature and moisture factors, and based on a
model presented by Antonopoulos (1999), the equation is expressed as:
k1=ketew
where et is a temperature factor, and ew represents the effect of water content.
Johnsson et al. (1987) suggested the Q10 relationship to define the effect of
temperature on soil mineralization as follows:
et=Q10 (T1-T2)/10
where T1 is the soil temperature, T2 is the incubation temperature at which et is
equal to 1, and Q10 represents the change in N mineralization rate when
temperature is changed 10 degrees. Q10 of N mineralization is approximately 2
(Stanford et al., 1973; Kladivko, and Keeney, 1987) in the temperature range of 5
to 35°C. The soil moisture factor ew is a function of the soil water filled pore
space (WFPS) (Lafolie et al., 1997).
ew=[(θ-θw)/(θlo-θw)]2 when θ<θlo;
ew=1 when θlo≤θ≤θho;
ew=0.6 +(1-0.6)[(θs-θ)/(θs-θho)]2 when θ>θho;
where θs, θho, θlo, and θw are WFPS at saturation (WFPS=1), 60% and 50% of
WFPS, and WFPS at wilting point, respectively.
In the model presented by Cameron and Kowalenko (1976), the interaction
effect of temperature and moisture was also considered in the equation, and the

9
relationship between the mineralization rate constant k and the environmental
factors is expressed as:
k=10-6(-2.655 + 0.01943Tθ - 0.2064T + 0.1606θ)
where T is the soil temperature in Celsius, and θ is soil gravimetric water content
(g/g) in percentage.
1.5 Nitrogen Cycling in the Soil
1.5.1 Immobilization
The C:N ratio of a substrate is considered the most critical factor controlling
mineralization/immobilization (Foth and Ellis, 1996). The C:N ratio of soil organic
matter is relatively constant. When substrates with a wide C:N ratio (> 25:1) are
applied, soil C/N balance is destroyed, and the heterotrophic microorganisms
have to accumulate mineral N due to the N deficiency in these substrates. The
process of conversion of the mineral N into organic N is called immobilization.
After application of N fertilizers like urea and ammonium salts,
immobilization dominated over mineralization for a few days (Overrein, 1967;
Overrein, 1972). Addition of 250 kg N ha-1 increased the humus total N content
from 1.4 to 2%, and the net N mineralization for plots treated with urea or
ammonium salts was about twice that of the plots without fertilizer application,
because the immobilized fertilizer N was more active than native organic N
(Williams, 1972).
1.5.2 Nitrification
In aerobic soils, NH4+ is oxidized by chemoautotrophic bacteria or Archaea,
and converted to nitrite (NO2-), and eventually to NO3
-. This process is called
nitrification (Foth and Ellis, 1996). Two steps are involved in this process. The
first step is to oxidize the NH4+ to NO2
- as follows:

10
2 NH4+ + 3O2 = 2 NO2
- +2H2O + 4H+
Bacteria of the genus Nitrosomonas and several other bacteria are responsible
for this conversion. This step produces protons and is considered a natural soil
acidification process. The second step is conversion from NO2- to NO3
- by
Nitrobacter as follows:
2NO2- + O2 = 2NO3
-
Ammonium is immobile in the soil because it is commonly adsorbed on the
surface of clay minerals or fixed in between the layers of clay minerals, and NH4+
is readily available for plant uptake. However, NO3- is subject to loss from soils by
leaching or denitrification. Thus, a low rate of nitrification is desirable from the
stand point of increasing fertilizer use efficiency and improving groundwater
quality.
The primary factors that control nitrification in soil are temperature, moisture,
pH, NH4+ concentration and the use of nitrification inhibitors. Generally,
nitrification rates increase with temperature from 0 to 30 °C. The activities of
nitrifying bacteria cease below 0 °C (Sabey et al., 1959; Malhi and McGill, 1981)
and perform very slowly when the soil temperature is below 5 °C (Brady and Weil,
2008). The optimum temperature for nitrification is generally between 20 to 30 °C
(Brady and Weil, 2008). Malhi and McGill (1981) found that nitrification rate was
maximized at 20 °C and ceased at 30 °C in soils from central Alberta. However,
Russell et al. (1925) reported a maximum nitrification rate at 37 °C and that
activity ceased at 55 °C. Sabey et al. (1959) found that the specific impact of
temperature on soil nitrification was largely dependent on the climatic zone of the
study.
The optimum soil moisture content for nitrifying bacteria is about the same
as the optimum moisture for plant growth, which is about 60% WFPS (Brady and
Weil, 2008). However, the optimum moisture for nitrification differs slightly among
11
soils (Parton et al., 1996). Below the optimum soil moisture, nitrification rate
declines as soil moisture decreases (Malhi and McGill, 1982; Gilmour, 1984;
Parton et al., 1996). When soil is too wet, nitrification is not appreciable due to
the shortage of O2 in the soil system (Miller and Johnson, 1964; Malhi and McGill,
1982).
The effect of soil pH on nitrification rate is significant. Nitrification generally
increased with soil pH over the range of 4.9 to 7.2 (Gilmour, 1984). Dancer et al.
(1973) reported that nitrification rates were similar for pH from 5.3 to 6.6, but
significantly decreased at pH 4.7.
Besides temperature, moisture and soil pH, the abundance of NH4+ present
in the soil also plays an important role in the activities of nitrifying
microorganisms. Malhi and McGill (1982) indicated that an increase in nitrification
rate was observed when NH4+-N concentration increased from 50 to 200 µg∙g-1
soil, but nitrification rate decreased when the NH4+-N concentration increased to
300 µg·g-1 soil due to the combined effect of low pH and high salt content.
As indicated previously, a low rate of nitrification is desirable because NO3-
is more mobile and prone to loss through leaching or denitrification. Frozen
temperatures, a long dry season, extremely low pH, or absence of NH4+ all can
lead to low nitrification rates. However, none of these conditions are favorable for
plant growth. Conversely, most factors that favor optimum plant growth also favor
nitrification. Therefore, to slow nitrification rates under these conditions,
chemicals that can inhibit the nitrification process are sometimes used. These
chemicals are called nitrification inhibitors (NIs), and they can kill or interfere with
the metabolism of nitrifying bacteria and prevent the conversion from NH4+ to
NO2-, thereby reducing nitrate leaching potential and increasing N fertilizer use
efficiency. Many studies have reported an increase in corn yield with the
application of NIs (Malzer et al., 1979; Hoeft, 1984; Nelson and Huber, 1992;
Wolt, 2004). However, the effectiveness of NIs can be influenced by different soil
properties, environmental factors and application techniques. For example,

12
nitrapyrin [2-chloro-6-(trichloromethyl) pyridine], the most commonly used NI in
US, is generally less effective on soils with a high soil organic matter content
(Hendrickson and Keeney, 1979; Chancy and Kamprath, 1987; Wolt, 2000), or at
high temperatures (Bundy and Bremner,1973; Touchton et al., 1979).
1.5.3 Denitrification
Denitrification is the process of reducing NO3- to gaseous N forms such as
nitric oxide (NO), nitrous oxide (N2O), and nitrogen gas (N2). This process occurs
under an anaerobic environment where bacteria use NO3- as a terminal electron
acceptor during respiration in the absence of O2. Denitrification is favored in
anaerobic, warm, near-neutral soils containing adequate carbon and substrate
sources (Keeney, 1980). Denitrification is an important N loss process in poorly
drained surface soils of forests with high nitrification rates (Davidson and Swank,
1987).
In general, denitrification is favored by high soil moisture content, high soil
temperature, a low rate of oxygen diffusion as well as the presence of soluble
organic matter and NO3- (Luo et al., 1999).
Soil moisture content can markedly affect gaseous N loss (Myrold, 1988;
Jarvis et al., 1991; de Klein and van Logtestijn, 1994). These studies showed that
above a critical soil water threshold, denitrification rates increased sharply with
increased soil water content. Below that, soil moisture content does not appear to
be the predominant control factor (Pilot and Patrick, 1972; Klemedtsson et al.,
1991). According to a model by Davidson (1991), N2O is primarily derived from
denitrification at 60 to 80% WFPS due to decreased O2 supply. Liu et al. (2007)
reported that N loss rates were increased by a factor of 1.63 at 75% WFPS
compared to 60% WFPS in a clay loam soil. Temperature is also an important
factor controlling denitrification rates. Increase in temperature has both a direct
and an indirect effect on denitrification rates (Smith and Arah, 1990).
Temperature directly affects denitrification rates following the Arrhenius equation,

13
whereas the indirect effect is caused by an increase in the volume of anaerobic
zones.
The effect of moisture and temperature on denitrification varies with soil type.
The soil water threshold point for denitrification to occur differs with varying soil
texture (Barton et al., 1999). Generally, greater threshold soil moisture content is
observed in coarse-textured soils than in fine-textured soils with reported values
of 74% to 83% WFPS for sandy and sandy loam soils, 62% to 83% WFPS for
loam soils, and 50% to 74% for clay loam soils. Groffman and Tiedje (1991)
attributed such observations to the effect of soil texture on oxygen availability. In
fine-textured soils with smaller pores, it is easier to create anaerobic microsites at
lower water content. Maag and Vinther (1996) found that the denitrification
activity in a sandy loam soil responded significantly to both increased soil
moisture and increased temperature, whereas the coarse sandy soil only reacted
to increased temperature.
1.5.4 Ammonium Fixation
Ammonium ions have a similar ionic radius and energy of hydration as
potassium (K+) ions, so they can also be fixed in the interlayer region of 2:1 clay
minerals (Foth and Ellis, 1996). It has been reported that no equilibrium exists
between exchangeable and fixed NH4+ due to the competitive relationship
between the K+ ions and NH4+ ions for exchange sites (Nieder et al., 2011).
Solution and exchangeable NH4+ are considered readily available for plant
uptake. While fixed NH4+ is not immediately available to plants, it is released
when solution NH4+ is depleted by plant uptake or nitrification. Ammonium
fixation is faster than NH4+ release (Foth and Ellis, 1996; Steffens and Sparks,
1997). Drury et al. (1991) found that 18 to 23% of added NH4+ was fixed within
15 days of incubation, and Allison et al. (1953) found that only about 5 to 24% of
fixed NH4+ became available to nitrifying bacteria during a period of 2 months.
14
Clay type is considered the dominant factor affecting NH4+ fixation capacity
in the soil. Considerable fixation (about 1.6 to 3.8 cmol kg-1 soil) occurs in soil if
the predominant clay mineral is illite or vermiculite, while smectitic and kaolinitic
soils fix little NH4+ (about 0 to 0.9 cmol kg-1 soil) (Allison et al., 1953; Said, 1973).
Ammonium fixation is an important factor in fertilizer use efficiency when NH4+
fertilizers are added to micaceous soils, especially where band-injection of
anhydrous ammonium (AA) is widely applied, because 5 to 10 times greater
fixation of NH4+ has been reported with AA than NH4
+ salt fertilizers (Young and
Cattani, 1962).
1.5.5 Ammonia Volatilization
The process of ammonia (NH3) emission from the soil into the atmosphere is
called volatilization. Volatilization commonly occurs after the application of
manures or chemical fertilizers like anhydrous ammonia and urea (Brady and
Weil, 2008). This process is expressed as the following reversible reaction:
𝑁𝐻4+ + 𝑂𝐻− ⇔𝑁𝐻3↑+𝐻2𝑂
Therefore, soils with greater amounts of OH- ions (high pH) drive the
reaction to the right and enhance the volatilization process. Since volatilization is
a source of N loss, understanding the factors that influence volatilization is
important if we are to minimize NH3 loss from soils through improved N
management. In general, soil and weather conditions, fertilizer sources and
application techniques all impact NH3 volatilization (Brady and Weil, 2008).
Ammonia volatilization increases with soil pH (Brady and Weil, 2008). He et
al. (1999) found volatilization from surface applied (NH4)2SO4 was minimal in
soils with an initial pH of 3.5, but the volatilization rate rapidly increased from pH
4.5 up to pH 8.5. Nitrogen fertilizers like urea and anhydrous ammonia increase
soil pH and also increase NH3 volatilization (Fan and Mackenzie, 1993; Jones
and Jacobsen, 2001). However, changes in soil pH following fertilizer

15
applications are resisted in well-buffered soils. Therefore, soil properties such as
texture, organic matter content and cation exchange capacity (CEC) can also
have a significant effect on NH3 volatilization (Jones and Jacobsen, 2001).
Whitehead and Raistrick (1990) reported that following urea application, 23.5% of
the total applied N volatilized in a soil with a clay content of 230 g kg-1, an organic
matter content of 48 g kg-1 and a CEC value of 12.8 cmolc kg-1, whereas 38% of
the total applied N volatilized in a soil with a clay content of 100 g kg-1, an organic
matter content of 26 g kg-1 and a CEC value of 7.4 cmolc kg-1. As indicated by
O’Toole et al. (1985), when soil CEC (determined by BaCl2 buffered at pH 8.2
with triethanolamine) is lower than 26.8 cmolc·kg-1, NH3 losses increase rapidly
with CEC decreases, while above this critical value, minimal NH3 losses were
observed. However, Sommer and Ersball (1996) found no reduction in NH3
volatilization from urea with increasing CEC (7.7 to 12 cmolc kg-1; determined by
saturating the soil with Na+ and extracting the Na+ with ammonium acetate),
though the CEC of the soils in this study were below 26.8 cmolc·kg-1. They
explained the reduced effect of CEC resulted from the increased pH and
exchangeable Ca2+ concentration.
Temperature has a significant positive effect on NH3 volatilization. Huijsmans
et al. (2003) found that the percentage of NH3 volatilized increased from 35% to
56% of total ammoniacal N applied as temperature increased from 10 to 20 °C
96 hours after a surface-application of liquid swine manure. Fenn and Kissel
(1974) indicated that both the volatilization rate and total NH3 loss increased
when temperature increased from 12 to 32 °C. He et al. (1999) found the amount
of NH3 volatilized from (NH4)2SO4 in 60 days increased 3-fold as the incubation
temperature increased 25 °C to 45 °C, because the increasing temperature not
only increased the chemical reaction rate from NH4+ to NH3 and the diffusion rate
of NH3, but also decreased the activities of nitrifying bacteria which resulted in a
greater level of NH4+ available for conversion to NH3 with time.

16
The effect of soil moisture on NH3 volatilization is indirect. When soil is dry,
less NH3 volatilizes from urea due to decreased hydrolysis rates (Ferguson and
Kissel, 1986; Al-Kanani et al., 1991). Urea hydrolysis can be expressed by
following reaction equations:
(𝑁𝐻2)2𝐶𝑂 + 2𝐻2𝑂 → (𝑁𝐻4)2𝐶𝑂3
(𝑁𝐻4)2𝐶𝑂3 → 2𝑁𝐻3 + 𝐶𝑂2 + 𝐻2𝑂
𝑁𝐻3 + 𝐻2𝑂 → 𝑁𝐻4+ + 𝑂𝐻−
Ferguson and Kissel (1986) found that when the soil is dry, urea is not readily
hydrolyzed and NH3 loss is significantly reduced. Ammonia volatilization has also
been shown to be relatively low when manure is applied to a dry soil, possibly
due to increased infiltration (Sogaard et al., 2002). However, greater losses of
NH3 were observed after anhydrous ammonia was injected into a dry soil, which
could be explained by the rapid emission of NH3 through cracks and voids
between the dry soil particles (Sommer and Christensen, 1992).
Ammonia volatilization is greatly influenced by fertilizer sources, fertilizer
application techniques and fertilizer rates. For surface application of different
fertilizer sources, He et al. (1999) found in a sandy soil (pH=7.9) the NH3
volatilization potential (% of applied NH4-N) predicted under laboratory conditions
increased in the following order: NH4NO3 (17.6%) < (NH2)2CO (21.4%) <
(NH4)2SO4 (21.7%) < NH4HCO3 (23.2%). Al-Kanani et al. (1991) indicated that the
NH3 loss resulting from surface applied urea ammonium nitrate (UAN) solution
was greatly reduced compared to the NH3 loss from surface applied urea.
Whitehead and Raistrick (1990) determined that NH3 volatilization varied greatly
when five N sources (mono-ammonium phosphate (MAP), di-ammonium
phosphate (DAP), ammonium sulfate (AS), ammonium nitrate (AN), and urea)
were applied to the surface of four soils. For example, on a soil with a CEC of 7.4

17
cmol·kg-1, the maximum loss of NH3 was much greater from urea (40% of total N)
compared to AS (5% of total N). However, on another soil with CEC of 15.6
cmol·kg-1, AS had the greatest NH3 loss (up to 30% of the total N). Therefore, the
impact of different N sources on volatilization is a combined effect of both the
fertilizer N source and soil properties. Ammonia volatilization can be greatly
reduced by incorporating fertilizers below the soil surface, applying them during
cooler periods or by splitting the application (Jones and Jacobsen, 2001). With
manure application, Huijsmans et al. (2003) found that 68% of the total
ammoniacal N applied was lost via volatilization for surface spreading, compared
to 17% for surface incorporation and 2% for deep placement. With urea, NH3 loss
was negligible by banding at a depth of 2.5 cm (Bouwmeester et al., 1985).
1.5.6 Biological Nitrogen Fixation
Seventy-eight percent of air is N2. Nitrogen gas can be converted to forms of
N that are available to plants and other forms of life. This process is called “N
fixation”. There are three major N fixation processes: ammonia fertilizer
production, lightning, and biological fixation (Jones and Jacobsen, 2001). Among
these three, the fixation process which is carried out by organisms in the natural
environment is known as biological N fixation. Approximately 145 to 200 million
tons of N can be fixed through biological fixation worldwide on an annual basis
(Jones and Jacobsen, 2001). Therefore, besides plant photosynthesis, biological
N fixation is considered the most important biochemical reaction for life on earth
(Brady and Weil, 2008).
Only a limited number of bacteria are capable of carrying out biological N
fixation. The major species involved include Rhizobium, actinomycetes, and
cyanobacteria (Brady and Weil, 2008). Biological N fixation can be classified into
three categories: symbiotic fixation with legumes, symbiotic fixation with non-
legumes, and non-symbiotic fixation. Since symbiotic fixation with legumes is the
most important source for fixed N in corn-soybean cropping systems, it will be
discussed in the following paragraph.
18
For symbiotic fixation with legumes, legumes such as clovers and beans are
the host plants. Bacteria species including Rhizobium and Bradyrhizobium infect
the root hairs and the cortical cells of the host plants, and ultimately induce the
formation of root nodules that serve as the site of N fixation (Brady and Weil,
2008). The amount of N biologically fixed from the root nodules can be quite high
and is able to adequately meet the N needs of several plant species. The rate of
biological N fixation depends on soil and climatic conditions, such as soil pH, soil
salinity, nutrient content, temperature and moisture. Commonly, the legume-
Rhizobium associations have higher requirement than other plants for Mo, Ca
and neutral pH (Cooper et al., 1983; Hungria and Vargas, 2000). However, high
levels of available N in the soil tend to depress biological N fixation (Brady and
Weil, 2008).
1.5.7 Nitrate Leaching
In the soil system, available N is gained through mineralization, biological
fixation, and human inputs as manures and fertilizers and other amendments,
while soil N can also be lost due to plant uptake, denitrification, volatilization and
NO3- leaching. Nitrate is a highly soluble, negatively charged ion which is not
absorbed to dominantly negatively charged soil particles, so NO3- is prone to
move through the soil with excess water.
Nitrate leaching is a major source of N loss, especially in areas with
excessive applications of N fertilizer and frequent precipitation or irrigation. For
example, in Indiana the average annual NO3--N losses from drainage can be
more than 67 kg N ha-1 (Kladivko, 2001) which is approximately one quarter of
the total amount of N required for a high yielding corn crop. Nitrate leaching to
groundwater can cause human and animal health concerns. Because high NO3-
levels decrease the oxygen carrying capacity of hemoglobin and lead to
respiratory distress and even death of newborn babies, the USEPA issued a
drinking water standard of 10 mg L-1 NO3--N. When the NO3
--contaminated
groundwater moves downstream, it also can cause more widespread damage to
19
aquatic ecosystems (Brady and Weil, 2008). The Gulf of Mexico “Dead Zone”,
which covers up to 14,000 to 22,000 km2 is an area of hypoxic water caused by
nutrient enrichment from the Mississippi River. Most of the N that enters the
Mississippi River comes from Midwest farming states through surface runoff,
erosion, and nitrate leaching. The enriched nutrients in the water system lead to
excessive growth of algae, which depletes the dissolved oxygen in the water and
can cause fish kills and significantly alter biodiversity.
The two principle factors that affect NO3- leaching are the amount of water
moving through the soil profile and the amount of NO3- present in the soil solution.
Strategies used to reduce N loss through leaching include optimum N fertilizer
application rates and timing, the use of nitrification inhibitors, proper irrigation
management and growing cover crops.
1.5.8 Crop Uptake
In general only about 50% of applied fertilizer N is used by the intended crop,
while the rest is lost through various N transformation processes including
leaching, denitrification, and volatilization (Craswell and Godwin, 1984; Jones
and Jacobsen, 2001). Therefore, to increase fertilizer N use efficiency, it is
important to time fertilizer applications with crop N demand (Doerge et al., 1991).
The amount of N taken up by crops varies from approximately 56 to 224 kg
ha-1 per year, depending on crop type and yields (Jones and Jacobsen, 2001).
Table 1.1 lists N removal in the harvested portion of selected agricultural crops.
Plant N uptake rates vary greatly at different plant growth stages. In winter wheat,
pre-anthesis N uptake accounts for 75% to 90% of total N uptake at harvest
(Heitholt et al., 1990; Delogu et al., 1998). For corn, the total amount of N uptake
is not greatly different from that for wheat. However, the N demand by corn is
high for a relatively short time (Figure 1.1) (UCWRC, unknown publish year).

20
1.6 Nitrogen Fertilizer Management
Nitrogen fertilizer application is critical for optimum crop growth. However,
excessive applications of N fertilizer result in significant N losses and severe
environmental problems. Therefore, fertilizer N management strategies have
always been hot topics in agricultural production.
A fertilizer management strategy has to answer three essential questions:
“When”, “How”, and “How much”. When to apply the fertilizer? What application
method should be used? And what is the fertilizer application rate? The most
effective management strategy will be one that matches the release of fertilizer N
with crop N demand. Thus, each fertilizer management strategy will be case-
specific, and highly dependent on soil conditions, nutrient sources, and crop
types.
1.6.1 Application Rate
Until recently, Indiana used yield-based fertilizer recommendations and
recommended N fertilizer rates were based on the following relationship:
N application rate (lb/A) = -27 + (1.36*yield potential) - N credit
where the N credit is given based upon the previous crop. For example, a 30 lb/A
N credit is used if the previous crop was soybean (Vitosh et al., 1995). A 27 lb/A
credit is given for soil N supply. However, the 27 lb N/acre credit underestimates
N supply abilities of most Indiana soils, which results in an over application of N
fertilizer (Emmert, 2009). On the other hand, soil N supply capacity varies from
soil to soil. Soil N supply capacity is related to various soil properties including
soil organic matter content, soil microbial C and N, as well as soil texture and pH
(Franzluebbers et al., 2001; Senwo and Tabatabai, 2005; Ros et al., 2011b).
Through comparison between mineralizable N and different soil physical and
chemical properties across 98 agricultural soils, Ros et al. (2011b) concluded
that soil organic matter variables are most important in predicting soil N

21
mineralization potential. Assuming 2% of soil N is mineralized each year (Foth
and Ellis, 1996), soils with 3% of organic matter will release 60 lb N/acre, while
soils with 1% organic matter will only supply 20 lb N/acre. So with a 2%
difference in soil organic matter content, the difference in soil N supply credit can
be as high as 40 lb N/acre. Further, even on the same field, large year to year
variations within the optimum N rate for corn are observed. Soil N supply also
varies greatly from year to year due to the varied rainfall amount and temporal
distribution. Franzluebbers et al. (2001) indicated that in the field higher mean
annual temperature resulted in greater soil mineralized N, while higher mean
annual precipitation had inconsistent effects on soil N mineralization. Therefore, it
is not reasonable to use one fixed value for the soil N supply credit when
predicting the optimum N fertilizer rate for a variety of soils or for one soil under
different weather conditions.
A large body of research has shown that fertilizer N requirement is poorly
related to yield (Vanotti and Bundy, 1994; Bundy and Andraski, 1995;
Kachonoski et al., 1996; Mamo et al., 2003; Lory and Scharf, 2003; Scharf et al.,
2006; Bundy, 2006). Thus, a new fertilizer N recommendation strategy was
developed and adopted in several states in the Midwest (Sawyer et al., 2006).
Without considering the yield goal of the crops, this new approach generates
fertilizer N recommendations based on the results of numerous N response trials
conducted on different soils. After the N response trials are conducted, the
overall goal is to find out the economic optimum N rate from the yield response
curve derived from N response trial datasets while considering the cost of N
fertilizer and the price of corn grain. However, yield response to N is highly
dependent on soil type and weather. To convert a set of varying responses to N
rate recommendations, the maximum return to N (MRTN) approach is used
(Nafziger et al., 2004). The general steps are to fit the yield data collected at
various N rates from many N response trails to a curve to obtain a mathematical
equation of the curve, and then calculate the yield increase (above yield at zero
N) from the response curve equation. The net return is yield increase times the

22
grain price, and minus the cost of the fertilizer. The MRTN rate is the N rate with
the largest net return to N. Although soil N supply capacity is not directly included
in the calculation, it has been integrated in the yield response curve. In general,
this fertilizer recommendation strategy is more region- and soil-specific.
1.6.2 Application Methods
For granular fertilizers, typical N fertilizer application practices include
broadcast, broadcast-incorporated, surface banded, and deep banded; while
liquid fertilizers such as anhydrous ammonia and UAN are band-injected, or
sprayed as foliar fertilizer (Jones and Jacobson, 2009). Although broadcasting is
the easiest application practice to perform with less expensive equipment, it has
been shown to be less effective than surface or subsurface banding due to NH3
volatilization, especially for urea (Gould et al., 1986). Zero or minimal tillage
management systems have been widely adopted in the Midwestern US (Phillips
et al., 1980). No-till generally leads to greater soil moisture content, increased
microbial activity and increased urease activity on the surface of crop residues.
When urea is broadcast onto no-till fields, much of the fertilizer is in contact with
crop residues and a greater amount of urea-N will be lost through NH3
volatilization (Gould et al., 1986). However, when urea is banded at a depth of
2.5 cm, Bouwmeester et al. (1985) reported that NH3 loss through volatilization
was negligible.
1.6.3 Application Timing
Nitrogen fertilizer can be applied prior to seeding either in fall or spring,
applied at the time of seeding as a starter, or side dressed after emergence
(Jones and Jacobson, 2009). Fall application of N fertilizer results in N losses
through leaching, denitrification and surface runoff prior to the next growing
season. Research showed significantly lower corn grain yields from fall
application compared with spring application (Vitosh, 1985; Vetsch and Randall,
2004), and often these yield reductions cannot be compensated for by greater N
23
application rates (Vitosh, 1985). However, in an 8-year study conducted on a
Crosby silt loam soil in Ohio, nitrification inhibitors (nitrapyrin) with fall-applied N
fertilizers increased crop yields compared to fall application without nitrification
inhibitors (Stehouwer and Johnson, 1990).
Preplant applications of N fertilizers are common and easy to perform.
However, under certain soil and weather conditions, like sandy soils with
excessive rainfall early in the growing season, preplant applications can result in
significant N losses before crop uptake (Vitosh et al., 1995). Side dress
applications usually minimize these losses. However, side dress applications
also carry the risk of suboptimal timing due to wet conditions during the
application period or low N availability due to drought after side dressing.
Therefore, it is reasonable to conclude that weather is probably the single most
important factor that determines optimum fertilizer N application rates on a
seasonal basis.
1.7 Concluding Remarks
Soil N is a primary resource for plant growth, and N mineralization plays an
important role in soil N cycling. More accurate prediction of soil N mineralization
would allow us to develop better N fertilizer recommendations to optimize crop
yield and profit and reduce environmental pollution. Numerous methods,
including biological incubations, chemical measurements and field estimates
have been developed to estimate soil N mineralization. However, since N
mineralization in soils is a complex process which can be affected by various
factors, such as carbon input rates, cropping system, soil pH, temperature and
water content, so far no single method has been widely accepted that can
accurately quantify soil N mineralization. Thus, my research objectives are to
compare different methods for estimating soil N mineralization, determine soil N
mineralization potentials of different Indiana soils, and develop an N

24
transformation and loss model that couples a weather-driven crop growth model
with soil surface and subsurface N mineralization algorithms with soil and
fertilizer N transformation and loss processes to improve crop N fertilizer
recommendations.

25
1.8 Reference
Adams, M.A., and P.M. Attiwill. 1986. Nutrient cycling and nitrogen mineralization
in eucalypt forests of south eastern Australia. II. Indices of nitrogen
mineralization. Plant Soil 92: 341-362.
Al-Kanani, T., A.F. MacKenzie, and N.N. Barthakur. 1991. Soil water and
ammonia volatilization relationships with surface-applied nitrogen fertilizer
solutions. Soil Sci. Soc. Am. J. 55: 1761-1766.
Allison, F.E., M. Kefauver, and E.M. Roller. 1953. Ammonium fixation in soils.
Soil Sci. Soc. Am. J. 17: 107-110.
Antonopoulos, A.Z. 1999. Comparison of different models to simulate soil
temperature and moisture effects on nitrogen mineralization in the soil. J.
Plant Nutr. Soil Sci. 162: 667-675.
Barton, L., C.D.A. McLay, L.A. Schipper, and C.T. Smith. 1999. Annual
denitrification rates in agricultural and forest soils: A review. Aust. J. Soil Res.
37: 1073-1093.
Beauchamp, E.G., W.D. Reynolds, D. Brasche-Villeneuve, and K. Kirby. 1986.
Nitrogen mineralization kinetics with different soil pretreatments and
cropping histories. Soil Sci. Soc. Am. J. 50: 1478-1483.
Bouwmeester, R.J.B., P.L.G. Vlek, and J.M. Stumpe. 1985. Effect of
environmental factors on ammonia volatilization from a urea-fertilized soil.
Soil Sci. Soc. Am. J. 49: 376-381.
Brady, N.C., and R.R. Weil. 2008. Nitrogen and sulfur economy of soils. p. 543-
593. In Brady, N.C., and R.R. Weil (ed.) The nature and properties of soils.
Prentice Hall, New Jersey.

26
Bremner, J.M. 1965. Nitrogen availability indexes. p. 1324-1345. In C.A. Black
(ed.) Methods of soil analysis. Part 2. Chemical and microbiological
properties. Am. Soc. Agron. Inc, Monogr. 10. Madison, WI.
Broadbent, F.F. 1984. Plant use of soil nitrogen. p. 171-182. In R.D. Haulk (ed.)
Nitrogen in crop production. ASA, CSSA, and SSSA, Madison WI.
Bundy, L.G., and T.W. Andraski. 1995. Soil yield potential effects on performance
of soil nitrate tests. J. Product. Agric. 8: 561-568.
Bundy, L.G., and J.M. Bremner. 1973. Inhibition of nitrification in soils. Soil Sci.
Soc. Amer. Proc 37: 396-398.
Bundy, L.G., and J.J. Meisinger. 1994. Nitrogen availability indices. p. 951– 984.
In R.W. Weaver et al (ed.) Methods of soil analysis. Part 2. SSSA Book Ser.
5. ASA and SSSA, Madison, WI.
Bundy, L.G. 2006. Why evaluate corn nitrogen recommendation systems. In:
Sawyer, J., E. Nafziger, G.W. Randall, L.G. Bundy, G. Rehm, and B.C.
Joern. (ed.) Concepts and rationale for regional nitrogen rate guidelines for
corn. PM2015. Iowa State Univ. Ext. Ames.
Cameron, D.R., and C.G. Kowalenko. 1976. Modelling nitrogen processes in soil:
mathematical development and relationships. Can. J. Soil Sci. 56: 71-78.
Campbell, C.A. 1978. Soil organic carbon, nitrogen and fertility. p. 173-271. In M.
Schnitzer and S.U. Khan (ed.) Soil organic matter. Developments in Soil
Sciences 8. Elsevier, New York.
Carter, M.R., D.A. Angers, E.G. Gregorich, and M.A. Bolinder. 2003.
Characterizing organic matter retention for surface soils in eastern Canada
using density and particle size fractions. Can. J. Soil Sci. 83: 11–23.

27
Cassman, K.G., A. Dobermann, and D.T. Walter. 2002. Agroecosystems,
nitrogen-use efficiency, and nitrogen management. AMBIO 31: 132-140.
Cassman, K.G., and D.N. Munns. 1980. Nitrogen mineralization as affected by
soil moisture, temperature, and depth. Soil Sci. Soc. Am. J. 44: 1233-1237.
Chan, K.Y. 1997. Consequences of changes in particulate organic carbon in
vertisols under pasture and cropping. Soil Sci. Soc. Am. J. 61: 1376–1382.
Chancy, H.F., and E.J. Kamprath. 1987. Effect of nitrapyrin rate on nitrification in
soils having different organic matter contents. Soil Sci. 144: 29-35.
Cooper, J.E., M. Wood, and A.J. Holding. 1983. The influence of soil acidity
factors on rhizobia. p. 319-335. In: Jones, D.G., and D.R. Davies (Ed.)
Temperate Legumes: Physiology, Genetics and Nodulation. Pittman, London.
Cornfield, A.H. 1960. Ammonia released on treating soils with sodium hydroxide
as a possible means of predicting the nitrogen-supplying power of soil.
Nature 187: 260-261.
Craswell, E.T., and D.C. Godwin. 1984. The efficiency of nitrogen fertilizers
applied to cereals in different climates. Adv. Plant. Nutr. 1: 1-55.
Curtin, D, C.E. Wright, M.H. Beare, and F.M. McCallum. 2006. Hot water-
extractable nitrogen as an indicator of soil nitrogen availability. Soil Sci. Soc.
Am. J. 70: 1512-1521.
Dancer, W.S., L.A. Peterson, and G. Chesters. 1973. Ammonification and
nitrification of nitrogen as influenced by soil pH and previous N treatments.
Soil Sci. Soc. Am. J. 37: 67–69.
Davidson, E.A., and W.T. Swank. 1987. Factors limiting denitrification in soils
from mature and disturbed southeastern hardwood forests. Forest Sci. 33:
135-144.

28
Davidson, E.A. 1991. Fluxes of nitrous oxide and nitric oxide from terrestrial
ecosystems. p. 219-235. In Rogers, J.E., and W.B. Whitman (Ed.) Microbial
Production and Consumption of Greenhouse Gases: Methane, Nitrogen
Oxides and Halomethanes. American Society of Microbiology, Washington,
DC.
Dean, L.A. 1952. A concept concerning the measurement of available soil
nutrients. Soil Sci. 73: 263-272.
Delogu, G., L. Cattivelli, N. Pecchioni, D. de Falcis, T. Maggiore, and A.M.
Stanca. 1998. Uptake and agronomic efficiency of nitrogen in winter barley
and winter wheat. Eur. J. Agron. 9: 11-20.
Deng, S.P., and M.A. Tabatabai. 2000. Effect of cropping systems on nitrogen
mineralization in soils. Biol. Fertil. Soils 31: 211-218.
Doerge, T.A., R.L. Rothe, and B.R. Gardner. 1991. Nitrogen fertilizer
management in Arizona. College of Agriculture, University of Arizona.
http://cals.arizona.edu/crop/soils/nitfertmgtAZ.pdf.
Drury, C.F., E.G. Beauchamp, and L.J. Evans. 1989. Fixation and immobilization
of recently added 15NH4+ in selected Ontario and Quebec soils. Can. J. Soil
Sci. 69: 391-400.
Emmert, D. 2009. Using canopy reflectance to monitor corn response to nitrogen
and the effects of delayed nitrogen application. Master’s Thesis. Purdue
University.
Eno, C.F. 1960. Nitrate production in the field by incubating the soil in
polyethylene bags. Soil Sci. Soc. Am. Proc. 24: 277-279.
Fan, M.X., and A.F. Mackenzie. 1993. Urea and phosphate interactions in
fertilizer microsites: Ammonia volatilization and pH changes. Soil Sci. Soc.
Am. J. 57: 839-845.

29
Fenn, L.B., and D.E. Kissel. 1974. Ammonia volatilization from surface
applications of ammonium compounds on calcareous soils: II. Effects of
temperature and rate of ammonium nitrogen application. Soil Sci. Soc. Am.
Proc. 38: 606-610.
Ferguson R.B., and D.E. kissel. 1986. Effects of soil drying on ammonia
volatilization from surface-applied urea. Soil Sci. Soc. Am. J. 50: 485-490.
Foth, H.D., and B.G. Ellis. 1996. Soil fertility. p. 115-144. 2nd edition. CRC Press,
Boca Raton, FL.
Franzluebbers, A.J., R.L. Haney, C.W. Honeycutt, M.A. Arshad, H.H. Schomberg,
and F.M. Hons. 2001. Climatic influences on active fractions of soil organic
matter. Soil Biol. Biochem. 33: 1103-1111.
Fu, M.H., X.C. Xu, and M.A. Tabatabai. 1987. Effect of pH on nitrogen
mineralization in crop-residue-treated soils. Biol. Fertil. Soils 5: 115-119.
Gianello, C., and J.M. Bremner. 1986. A simple chemical method for assessing
potentially mineralizable organic nitrogen in soil. Commun. Soil Sci. Plant
Anal. 17: 195–214.
Gianello, C., and J.M. Bremner. 1988. A rapid steam distillation method of
assessing potentially available organic nitrogen in soil. Commun. Soil Sci.
Plant Anal. 19: 1551–1568.
Gilmour, J.T. 1984. The effects of soil properties on nitrification and nitrification
inhibition. Soil Sci. Soc. Am. J. 48: 1262-1266.
Gould, W.D., C. Hagedorn, and R.G.L. McCready. 1986. Urea transformations
and fertilizer efficiency in soil. Adv. Agron. 40: 209-238.

30
Griffin, T.S. 2008. Nitrogen availability. p. 616–646. In J.S. Schepers and W.R.
Raun (ed.) Nitrogen in agricultural soils. Agron. Monogr. 49. ASA, CSSA,
SSSA, Madison WI.
Groffman, P.M., and J.M. Tiedje. 1991. Relationships between denitrification,
CO2 production and air-filled porosity in soil of different texture and drainage.
Soil Biol. Biochem. 21: 621-626.
Groot, J.J.R., and V.J.G. Houba. 1995. A comparison of different indices for
nitrogen mineralization. Biol. Fertil. Soils 19: 1–9.
Gurlevik, N., D.N. Kelting, and H.L. Allen. 2004. Nitrogen mineralization following
vegetation control and fertilization in a 14-year-old loblolly pine plantation.
Soil Sci. Soc. Am. J. 68: 272-281.
Guthrie, T.F., and A.A. Bomke. 1980. Nitrification inhibition by N-serve and ATC
in soils of varying Texture. Soil Sci. Soc. Am. J. 44: 314-320.
He, Z.L., A.K. Alva, D.V. Calvert, and D.J. Banks. 1999. Ammonia volatilization
from different sources and effects of temperature and soil pH. Soil Sci. 164:
750-758.
Heitholt, J.J., L.I. Croy, N.O. Maness, and H.T. Nguyen. 1990. Nitrogen
partitioning in genotypes of winter wheat differing in grain N concentration.
Field Crops Res. 23: 133-144.
Hendrickson, L.L., D.R. Keeney, L.M. Walsh, and E.A. Liegel. 1978. Evaluation
of nitrapyrin as a means of improving N efficiency in irrigated sands. Agron J.
70: 699-704.
Hoeft, R.G. 1984. Current status of nitrification inhibitors. In R. O. Hauck (ed.)
Nitrogen in Crop Production. Am. Soc. Of Agronomy, Madison, WI.

31
Hungria, M., and M.A.T. Vargas. 2000. Environmental factors affecting N2 fixation
in grain legumes in the tropics, with an emphasis on Brazil. Field Crop Res.
65: 151-164.
Huijsmans, J.F.M., J.M.G. Hol, and G.D. Vermeulen. 2003. Effect of application
method, manure characteristics, weather and field conditions on ammonia
volatilization from manure applied to arable land. Atomopheric Environment
37: 3669-3680.
Jalil, A., C.A. Campbell, J.J. Schoenau, J.L. Henry, Y.W. Jame, and G.P. Lafond.
1996. Assessment of two chemical extraction methods as indices of
available nitrogen. Soil Sci. Soc. Am. J. 60: 1954–1960.
Jarvis, S.C., D. Barraclough, J. Williams, and A.J. Rook. 1991. Patterns of
denitrification loss from grazed grassland: effects of nitrogen fertilizer inputs
at different sites. Plant Soil 131: 77-88.
Jarvis, S.C., E.A. Stockdale, M.A. Shepherd, and D.S. Powlson. 1996. Nitrogen
mineralization in temperate agricultural soils: processes and measurement.
Adv. Agron. 57: 187-235.
Johnsson, H., L. Bergstrom, and P.E. Jansson. 1987. Simulated nitrogen
dynamics and losses in a layered agricultural soil. Agric. Eco. Environ. 18:
333-356.
Jones, C.A., and J.S. Jacobsen. 2001. Nitrogen cycling, testing and fertilizer
recommendations. Nutrient Management Module No. 3. Montana State
University Extension Service, Bozeman, MT.
Jones, C.A., and J.S. Jacobsen. 2009. Fertilizer placement and timing. Nutrient
Management Module No. 11. Montana State University Extension Service,
Bozeman, MT.

32
Kachonoski, R.G., G.L. Fairchild, and E.G. Beauchamp. 1996. Yield indices for
corn response to applied fertilizer: application in site-specific crop
management. p. 425-432. In: Robert, P.C., R.H. Rust, and W.E. Larson (ed.).
Third International Conference on Precision Agriculture. Precision
Agriculture. ASA, CSSA, and SSSA, Madison, WI.
Keeney, D.R. 1980. Nitrogen availability indexes. In: R.H. Miller (ed.) Methods of
soil analysis (rev). Part 3. Microbiological properties. Am. Soc. Agron. Inc,
Madison, WI.
Keeney, D.R., and J.M. Bremner. 1966. Comparison and evaluation of laboratory
methods of obtaining an index of soil nitrogen availability. Agron. J. 58: 498-
503.
Kladivko, E.J., and D.R. Keeney. 1987. Soil nitrogen mineralization as affected
by water and temperature interactions. Biol. Fertil. Soils 5: 248-252.
Kladivko, E.J. 2001. Nitrate leaching into tile drains at SEPAC. Agronomy Dept.,
Purdue University. AGRY 04-01. http://www.agry.purdue.edu/ext/pubs/AY-
04-01.pdf.
de Klein, C.A.M., and R.S.P. van Logtestijn. 1994. Denitrification in the top soil of
managed grasslands in The Netherlands in relation to soil type and fertilizer
level. Plant Soil 163: 33-44.
Klemedtsson, L., S. Simkins, B.H. Svensson, H. Johnsson, and T. Rosswall.
1991. Soil denitrification in three cropping systems characterized by
differences in nitrogen and carbon supply. Plant Soil 138: 273-286.
Kolberg, R.L., B. Rouppet, D.G. Westfall, and G.A. Peterson. 1997. Evaluation of
an in situ net soil nitrogen mineralization method in dryland agroecosystems.
Soil Sci. Soc. Am. J. 61: 504-508.

33
Lafolie, F., L. Bruckler, A.M. de Cockborne, and C. Laboucarie. 1997. Modeling
the water transport and nitrogen dynamics in irrigated salad crops. Irrig. Sci.
17: 95-104.
Liu, X.J., A.R. Mosier, A.D. Halvorson, C.A. Reule, and F.S. Zhang. 2007.
Dinitrogen and N2O emissions in arable soils: Effect of tillage nitrogen
source and soil moisture. Soil Biol. Biochem. 39: 2362–2370.
Lory, J.A., and P.C. Scharf. 2003. Yield goal versus delta yield for predicting
fertilizer nitrogen need in corn. Agron. J. 95: 994-999.
Luo, J., R.W. Tillman, P.R. Ball. 1999. Factors regulating denitrification in a soil
under pasture. Soil Biol. Biochem. 31: 913-927.
Maag, M., and F.P. Vinther. 1996. Nitrous oxide emission by nitrification and
denitrification in different soil types and at different soil moisture contents
and temperatures. Appl. Soil Ecol. 4: 5-14.
Macduff, J. H., and R.E. White. 1985. Net mineralization and nitrification rates in
a clay soil measured and predicted in permanent grassland from soil
temperature and moisture content. Plant Soil 86: 151-172.
Malhi, S.S., and W.B. McGill. 1982. Nitrification in three Alberta soils: effect of
temperature, moisture and substrate concentration. Soil Biol. Biochem. 14:
393-399.
Malzer, G.L., T.J. Graff, and J. Lensing. 1979. Influence of nitrogen rate, timing of
nitrogen application and use of nitrification inhibitors for irrigated spring
wheat and corn. In Univ. Minn. Soil Series 105 Report on Field Research in
Soils.
Mamo, M., G.L. Malzer, D.J. Mulla, D.R. Huggins, and J. Strock. 2003. Spatial
and temporal variation in economically optimum nitrogen rate for corn. Agron.
J. 95: 958-964.

34
Matus, F.J., C.H. Lusk, and C.R. Maire. 2008. Effects of soil texture, carbon input
rates, and little quality on free organic matter and nitrogen mineralization in
Chilean rain forest and agricultural soils. Comm. Soil Sci. Plant Anal. 39:
187-201.
Miller, R.D., and D.D. Johnson. 1964. The effect of soil moisture tension on
carbon dioxide evolution, nitrification, and nitrogen mineralization. Soil Sci.
Soc. Am. Proc. 28: 644-647.
Molina, J.A.E., C.E. Clapp, and W.E. Larson. 1980. Potentially mineralizable
nitrogen in soil: The simple exponential model does not apply for the first 12
weeks of incubation. Soil Sci. Soc. Am. J. 44: 442-443.
Moore, J.M., S. Klose, and M.A. Tabatabai. 2000. Soil microbial biomass carbon
and nitrogen as affected by cropping systems. Biol. Fertil. Soils 31: 200–210.
Myers, R.J.K., C.A. Campbell, and K.L. Weir. 1982. Quantitative relationship
between net nitrogen mineralization and moisture content of soil. Can. J. Soil
Sci. 62: 111-124.
Myrold, D.D. 1988. Denitrification in rye grass and winter wheat cropping
systems of Western Oregon. Soil Sci. Soc. Am. J. 52: 412-416.
Nafziger, E.D., J.E. Sawyer, and R.G. Hoeft. 2004. Formulating nitrogen
recommendations for corn in the Corn Belt using recent data. In: Proc. N.C.
Ext.-Ind. Soil Fertility Conf., Des Moines, IA. 17-18 Nov. 2004. Potash and
Phosphate Inst., Brookings, SD.
Nelson, D.W., and D. Huber. 1992. Nitrification inhibitors for corn production.
Iowa State Cooperative Extension Service. NCH-55.
Nieder, R., D.K. Benbi, and H.W. Scherer. 2011. Fixation and defixation of
ammonium in soils: a review. Biol. Fertil. Soils 47: 1–14.

35
Oberle, S.L., and D.R. Keeney. 1990. Factors influencing corn fertilizer N
requirements in the Northern U.S. Corn Belt. J. Prod. Agric 3: 527-534.
Øien, A., and A.R. Selmer-Olsen. 1980. A laboratory method for evaluation of
available nitrogen in soil. Acta Agric. Scand. 30: 149–156.
O’Toole, P., S.J. McGarry, and M.A. Morgan. 1985. Ammonia volatilization from
urea-treated pasture and tillage soils; effects of soil properties. J. Soil Sci. 36:
613-620.
Overrein, L.N. 1967. Immobilization and mineralization of tracer nitrogen in forest
raw humus. I. Effect of temperature on the interchange of nitrogen after
addition of urea-, ammonium-, and nitrate-N15. Plant and Soil 27: 1-19.
Overrein, L.N. 1972. Tracer studies on the internal nitrogen cycle in forest soil.
Medd Norske Skogforsoksv 29: 445-466.
Parr, J.F., and H.W. Reuszer. 1959. Organic matter decomposition as influenced
by oxygen level and method of application to soil. Soil Sci. Soc. Am. Proc.
23: 214-216.
Parton, W.J., A.R. Mosier, D.S. Ojima, D.W. Valentine, D.S. Schimel, K. Weier,
and A.E. Kulmala. 1996. Generalized model for N2 and N2O production from
nitrification and denitrification. Global Biogeochem. Cycles 10: 401-412.
Phillips, R.E., R.L. Blevins, G.W. Thomas, W.W. Frye, and S.H. Phillips. 1980.
No-tillage agriculture. Science 208: 1108-1113
Pilot, L., and W.H. Patrick. 1972. Nitrate reduction in soils: effect of soil moisture
tension. Soil Sci. 114: 312-316.
Raison, R.J., M.J. Connell, and P.K. Khanna. 1987. Methodology for studying
fluxes of soil mineral-N in situ. Soil Biol. Biochem. 19:521-530.
36
Rao, S.C. 1996. Evaluation of nitrification inhibitors and urea placement in no-
tillage winter wheat. Agron. J. 88: 904-908.
Ros, G.H., E.J.M. Temminghoff, and E. Hoffland. 2011a. Nitrogen mineralization:
a review and meta-analysis of the predictive value of soil tests. Eur. J. Soil
Sci. 62: 162-173.
Ros, G.H., M.C. Hanegraaf, E. Hoffland, and W.H. van Riemsdijk. 2011b.
Predicting soil nitrogen mineralization: Relevance of organic matter fractions
and soil properties. Soil Biol. Biochem. 43: 1714-1722.
Russel, J.C., G. Jones, and T.M. Bahrt. 1925. The temperature and moisture
factors in nitrate production. Soil Sci. 19: 381-398.
Sabey, B.R., L.R. Frederick, and W.V. Bartholomew. 1959. The formation of
nitrate from ammonium nitrogen in soils: III influence of temperature and
initial population of nitrifying organisms on the maximum rate and delay
period. Soil Sci. Soc. Am. Proc. 23: 462-465.
Said, MB. 1973. Ammonium fixation in the Sudan Gezira soils. Plant Soil 38: 9–
16.
Sawyer, J., E. Nafziger, G.W. Randall, L.G. Bundy, G. Rehm, and B.C. Joern.
2006. Concepts and rationale for regional nitrogen rate guidelines for corn.
PM2015. Iowa State Univ. Ext. Ames.
Scharf, P.C., N.R. Kitchen, K.A. Sudduth, and J.G. Davis. 2006. Spatially
variable corn yield is a weak predictor of optimal nitrogen rate. Soil Sci. Soc.
Am. J. 70: 2154-2160.

37
Schomberg, H.H., S. Wietholter, T.S. Griffin, D.W. Reeves, M.L. Cabrera, D.S.
Fisher, D.M. Endale, J.M. Novak, K.S. Balkcom, R.L. Raper, N.R. Kitchen,
M.A. Locke, K.N. Potter, R.C. Schwartz, C.C. Truman, and D.D. Tyler. 2009.
Assessing indices for predicting potential nitrogen mineralization in soils
under different management systems. Soil Sci. Soc. Am. J. 73: 1575-1586.
Selles, F., C.A. Campbell, B.G. McConkey, S.A. Brandt, and D. Messer. 1999.
Relationships between biological and chemical measures of N supplying
power and total soil N at field scale. Can. J. Soil Sci. 79: 353–366.
Senwo, Z.N., and M.A. Tabatabai. 2005. Effect of management systems on
nitrogen mineralization and nitrification in soils. Comm. Soil Sci. Plant Anal.
36: 1313-1326.
Sharifi, M., B.J. Zebarth, D.L. Burton, C.A. Grant, and J.M. Cooper. 2007.
Evaluation of some indices of potentially mineralizable nitrogen in soil. Soil
Sci. Soc. Am. J. 71: 1233–1239.
Smith, K.A., and J.R.M. Arah. 1990. Losses of nitrogen by denitrification and
emissions of nitrogen oxides from soils. The Fertilizer Society Proceedings
299, London.
Sogaard, H.T., S.G. Sommer, N.J. Hutchings, J.F.M. Huijsmans, D.W. Bussink,
And F. Nicholson. 2002. Ammonia volatilization from field-applied animal
slurry-the ALFAM model. Atmospheric Environment 36: 3309-3319.
Sommer, S.G., and B.T. Christensen. 1992. Ammonia volatilization after injection
of anhydrous ammonia into arable soils of diferent moisture levels. Plant Soil
142: 143-146.
Sommer, S.G., and A.K. Ersball. 1996. Effect of air flow rate, lime amendments,
and chemical soil properties on the volatilization of ammonia from fertilizers
applied to sandy soils. Boil. Fertil. Soils 21: 53-60.

38
Stanford, G., and E. Epstein. 1974. Nitrogen mineralization-water relations in
soils. Soil Sci. Soc. Am. Proc. 38: 103-107.
Stanford, G., M.H. Frere, amd D.H. Schwaninger. 1973. Temperature coefficient
of soil nitrogen mineralization. Soil Sci. 115: 121-123.
Stanford, G., and S.J. Smith. 1972. Nitrogen minerialization potentials of soils.
Soil Sci. Soc. Am. Proc. 36: 465-472.
Stehouwer, R.C., and J.W. Johnson. 1990. Urea and anhydrous ammonia
management for conventional tillage corn production. J. Prod. Agri. 3: 507-
513.
Subbiah, B.V., and G.L. Asija. 1956. A rapid procedure for the estimation of
avaible nitrogen in soils. Current Sci. 25: 259-260.
Touchton J.T., R.G. Hoeft, L.F. Welch, and W.L. Argyilan. 1979. Loss of
nitrapyrin from soils as affected by pH and temperature. Agron. J. 71: 865-
869.
UCWRC, unknown publish year. Dynamics of nitrogen availability and uptake. A
supporting document for the University of Califonia Water Resources Center
Nitrate Groundwater Pollution Hazard Index.
http://ucanr.org/sites/wrc/pdfs/HIDynamics.pdf.
Vanotti, M.B., and L.G. Bundy. 1994. An alternative rationale for corn nitrogen
fertilizer recommendations. J. Product. Agric. 7: 243-248.
Vetsch, J.A., and G.W. Randall. 2004. Corn production as affected by nitrogen
application timing and tillage. Agron. J. 96: 502-509.
Vitosh, M.L. 1985. Nitrogen management strategies for corn producers. Michigan
State University Extension Bulletin WQ06.

39
Vitosh, M.L., J.W. Johnson, and D.B. Mengel. 1995. The tri-state fertilizer
recommendations for corn, soybeans, wheat and alfalfa. Ext. Bull. E-2567.
Michigan State Univ., East Lansing; The Ohio State Univ., Columbus; and
Purdue Univ., West Lafayette, IN.
Waksman, S.A., and F.C. Gerretsen. 1931. Influence of temperature and
moisture upon the nature and extent of decomposition of plant residues by
microorganisms. Ecology 12: 33-60.
Waring, S.A., and J.M. Bremner. 1964. Ammonium production in soil under
waterlogged conditions as an index of nitrogen availability. Nature 201: 951–
952.
Wennman, P., and T. Kätterer. 2006. Effects of moisture and temperature on
carbon and nitrogen mineralization in mine tailings mixed with sewage
sludge. J. Environ. Qual. 35: 1135-1141.
Whitehead, D.C., and N. raistrick. 1990. Ammonia volatilization from five nitrogen
compounds used as fertilizers following surface application to soils. J. Soil
Sci. 41: 387-394.
Williams, B.C. 1972. Nitrogen mineralization and organic matter decomposition in
Scots pine humus. Forestry 45:177-188.
Wolt, J.D. 2000. Nitrapyrin behavior in soils and environmental considerations. J.
Envrion. Qual. 29: 367-379.
Young, J.L., and R.A. Cattani. 1962. Mineral fixation of anhydrous ammonia by
air-dry soils. Soil Sci. Soc. Am. Proc. 26: 147-152.
Zibilske, L.M., and J.M. Bradford. 2007. Oxygen effects on carbon, polyphenols,
and nitrogen minerlization potential in soil. Soil Sci. Soc. Am. J. 71: 133-139.

40
Table 1.1 Nitrogen uptake in the harvested portions of selected agronomic crops†.
Crop Unit of yield N uptake per unit of yield (lb/unit)
Alfalfa ton 60 Barley bushel 1.6
Corn silage ton 8.4 Wheat bushel 1.8
† Adapted from Jones and Jacobsen, 2001.

41
Figure 1.1 Nitrogen uptake rate of corn and wheat as a function of crop growth
over time. Adapted from University of Califonia Water Resources Center (UCWRC), unknown publish year.
Rat
e of
N u
ptak
e, k
g N
ha-1
d-1

42
CHAPTER 2. ESTIMATING POTENTIALLY MINERALIZABLE NITROGEN IN INDIANA SOILS
2.1 Abstract
Soil nitrogen (N) supply is probably the single most important factor that
causes observed differences in optimum fertilizer N rates for corn among soils in
similar climatic conditions. Better estimates of soil mineralization would improve
our ability to develop more accurate N rate recommendations for crop production.
Through a preliminary study, we found a static incubation was better than a
leaching incubation for predicting mineralized soil N under greenhouse conditions.
Subsequently we used the static incubation method to assess N mineralization of
seven major soils in Indiana at four different depths. The static incubation was
conducted in centrifuge tubes at 25 °C with a moisture tension of 10 KPa for 16
weeks. Every four weeks soils were destructively sampled and extracted with 1
M KCl for the analysis of NO3--N and NH4
+-N soil N. The cumulative net N
mineralization data were fitted to a first-order exponential model to determine
potentially mineralizable soil N (N0) and the N mineralization rate constant (k).
The N0 and k values estimated from this static incubation were related to some
“quick” chemical indices for predicting N0. The results showed that mineralizable
N decreased with depth, but more than 50% of the total mineralizable N was
contributed from a depth of 15 to 60 cm. The k values also varied with soil type
and depth. Several chemical methods (Illinois Soil Nitrogen Test, anaerobic-N,
hot KCl-N) were found to be related to the soil N mineralization potential with R2
greater than 0.6. However, none of them was able to predict the mineralization
rate constant k. Field soil N supply was also estimated through N response trials.

43
Results showed that on the same field the estimated soil N supply varied greatly
from year to year with a standard deviation as high as 28 kg N ha-1. In addition,
mineralizable soil N estimated from the laboratory incubation was not correlated
to the field measurements of soil N supply, which can be attributed to weather
variations, landscape positions, etc. under field conditions.

44
2.2 Introduction
Nitrogen (N) is the most likely limiting essential nutrient for growth of non-
legume crops. Soil N can typically provide 20 to 80% of the N required by crops
(Broadbent, 1984), but in most soils and most situations fertilizer N must be
added to maximize growth. Both under- and over- applications of N have
economic consequences, so it is important to develop accurate N fertilizer
application rate guidelines. Excessive N applications can lead to poor crop N
uptake efficiency and may result in increased greenhouse gas emissions and
nitrate loss to groundwater. Thus, the prediction of soil N mineralization gives us
the ability to develop more accurate N fertilizer recommendations to optimize
crop yields and profitabilty, and to reduce N losses to the environment.
Until recently, in Indiana and many midwest states, yield-based fertilizer
recommendations were the most employed fertilizer management strategies. For
example in in Indiana, Ohio, and Michigan the recommended N fertilizer rate for
corn was based on the following relationship:
N application rate (lb/A) = -27 + (1.36*yield potential)-N credit
where the N credit is given based on the previous crop (Vitosh et al., 1995). A 27
lb N/acre credit is given for soil N supply. However, the 27 lb N/acre credit
underestimates N supply capacity of most Indiana soils, which often results in an
excessive N fertilizer recommendation (Emmert, 2009). Further, soil N supplying
capacity varies from soil to soil and year to year. Soil N supplying capacity is
related to various soil properties including soil organic matter content, soil
microbial C and N, as well as soil texture and pH (Franzluebbers et al., 2001;
Senwo and Tabatabai, 2005; Ros et al., 2011). Based on comparisons among
mineralizable soil N estimated through laboratory incubation and various soil
physical and chemical properties across 98 agricultural soils, Ros et al. (2011a)
concluded that soil organic matter is the most important variable in predicting soil
N mineralization potential. Assuming 3.5% of soil N is mineralized each year

45
(Oberle and Keeney, 1990), soils with 3% of organic matter will release 105 lb
N/acre, while soils with 1% organic matter will only supply 35 lb N/acre. So a 2%
difference in soil organic matter content can produce as much as a 70 lb N/acre
difference in soil N supply. In addition, the effect of temperature and moisture on
soil N mineralization has been described by many researchers (Stanford et al.,
1973; Stanford and Epstein, 1974; Antonopoulos, 1999). Franzluebbers et al.
(2001) indicated that in the field higher mean annual temperature resulted in
greater net N mineralization, while higher mean annual precipitation had
inconsistent effects on net N mineralization. Because variations in soil N supply
are related to weather variations, it is not reasonable to use one fixed value for
soil N supply when predicting optimum N fertilizer rates for a variety of soils or for
one soil under different weather conditions. If we are to improve N fertilizer
recommendations, it is important that estimates of soil N supply consider both
soil and weather parameters.
Numerous laboratory methods for predicting soil N availability have been
proposed (Bremner, 1965; Keeney, 1980; Bundy and Meisinger, 1994; Griffin,
2008). Currently, the most satisfactory methods available for measurement of
laboratory mineralizable N are biological methods that measure mineral N
produced when soils are incubated under aerobic conditions. An approach
developed by Stanford and Smith (1972) has been commonly accepted to predict
the mineralized soil N from laboratory incubations using a first-order exponential
model. Another laboratory incubation approach using static cups has been widely
used as well (Keeney and Bremner, 1966; Zinati et al., 1997; Vernimmen et al.,
2007; Schomberg et al., 2009), because it is easier to perform and requires less
equipment. However, regardless of the method chosen, N mineralization
estimates from disturbed soils under controlled laboratory conditions by
themselves will not quantitatively predict soil N availability in the field, due to
differences in soil disturbance and weather in the field compared to the
laboratory (Cabrera and Kissel, 1988).

46
In addition to the relatively time consuming biological methods described
previously, several more rapid chemical indices of soil N availability have been
developed (Keeney and Bremner, 1966; Schomberg et al., 2009). However, none
of these chemical methods closely simulate the microbial processes involved in
soil N mineralization (Keeney and Bremner, 1966). The accuracy of these
chemical methods is highly influenced by soil drying temperature prior to
extraction, molarity of the extracting solution, soil-solution ratio, and extraction
time and temperature (Ros et al., 2009). Some chemical indices including total
carbon content, total N content, mineral N extracted by hot KCl, N mineralized
under anaerobic conditions, and N mineralized in 24 days have been found to be
highly correlated to soil N mineralization potentials estimated from long-term
biological incubations (Schomberg et al., 2009).
Although soil N mineralization potentials can be easily measured and
estimated from various laboratory procedures, limited work has been done to
compare soil N mineralization estimated through laboratory procedures to soil N
supply capacity under full field conditions. Schomberg et al. (2009) reported that
the soil N mineralization potential estimated from laboratory incubations was as
high as 500 mg kg-1, which is much greater than the total amount of N required
for corn growth. However, because these laboratory results were not compared
to field measures of crop N uptake or mineralization, it was not possible to
determine whether a high estimate like this would result in optimum crop yields
without additional fertilizer N applications. Therefore, it is more critical to find the
relationship between laboratory mineralizable N and field soil N supply.
In addition, the importance of subsoil N mineralization to crop production has
largely been overlooked. Most research on soil N mineralization has been limited
to the plow layer, in spite of the fact that most plants also obtain N mineralized
from deeper horizons (Cassmann and Munns, 1980). Cassmann and Munns
(1980) found that up to 58% of the total estimated mineralized N could be
attributed to the 18-108 cm soil depth. In 4 Moroccan soils studied by Soudi et al.

47
(1990), subsoil layers (below 20 cm) contributed 20 to 37% of total mineralized N.
For more accurate N fertilizer recommendations, the potential contributions of N
mineralized from subsoil should be considered.
The objectives of this study were to: (i) compare different biological methods
used to quantify mineralized soil N; (ii) estimate potentially mineralizable soil N
in Indiana soils at different depths using a long-term laboratory incubation
method; (iii) relate soil N mineralization potential estimated from a long-term
biological incubation method to some chemical N availability indexes; and (iv)
determine the relationships between various laboratory estimates of
mineralizable soil N and field soil N supply.
2.3 Materials and Methods
2.3.1 Comparison of Different Biological Methods used to Measure Mineralized
Nitrogen
Eight soils were collected from four sites where corn N response trials were
conducted following a previous soybean crop. The Chalmers and Raub soils
were collected from the Purdue Agricultural Center for Research and Education
(ACRE), the Blount and Pewamo soils were collected from the Davis-Purdue
Agricultural Center (DPAC), the Pinhook and Tracy soils were collected from
Pinney-Purdue Agricultural Center (PPAC), and the Cincinnati and Cobbsfork
soils were collected from Southeast-Purdue Agricultural Center (SEPAC). After
collection, all soils were screened under moist conditions to pass through a 1-cm
sieve and stored at 4 °C. Selected properties of these soils are presented in
Table 2.1.
2.3.1.1 Leaching incubation
Leaching incubation was performed according to Stanford and Smith (1972)
with modifications. Subsamples of the eight soils were sieved to pass a 2-mm
48
screen. One hundred grams of moist soil were transferred to a leaching tube with
a layer of glass wool placed in the bottom to prevent clogging of the porous
bottom. A layer of glass wool was also placed over the soil to avoid dispersion
during the process of leaching. Deionized water was then added to each tube to
bring the soil water potential to 10 KPa. The tubes were weighed every four days
to determine moisture loss and brought back to the proper moisture content with
deionized water. The tubes were kept covered with perforated parafilm to reduce
moisture loss and placed in an incubation chamber maintained at 25 °C for 16
weeks. Tubes were ranged in a randomized complete block design with three
replications. Weekly leaching of mineral N was conducted using 100 mL 5 mM
CaCl2 solution in 30 to 50 mL increments. The leachate was collected and
analyzed colorimetrically for mineral N (NH4+-N and NO3
--N) using an
autoanalyzer (AQ2, Seal Analytical, Inc., UK).
2.3.1.2 Static Cup Incubation
Static cup incubation was conducted based on a modified approach of
Schomberg et al. (2009). After sieving to pass a 2 mm screen, 25 g of moist soils
were placed into plastic cups. Deionized water was added to bring them to 10
KPa water potential. Cups were loosely covered with lids to reduce moisture loss
and placed in an incubation chamber with a constant temperature of 25 °C for 16
weeks. A randomized complete block design was used with soil type as the main
factor and incubation time as a blocking factor. Each sample had three
replications. These cups were weighed every four days to determine moisture
loss and brought back to their proper moisture content with deionized water. At
the end of each week, soils were sampled destructively by weighing 5 g soil out
of each cup and equilibrating with 50 mL 2 M KCl for 1 hour. Soil extracts were
analyzed for mineral N (NH4+-N and NO3
--N) as described above.

49
2.3.1.3 Greenhouse Experiment
One kilogram of each soil was mixed with a minus-N nutrient mixture (Allen
et al., 1976) and placed in 2 L perforated pots. These pots were arranged on a
greenhouse bench as a complete random block design with three replications.
Soils were moistened to approximately 33 KPa. Fifteen winter wheat seeds were
sown into each pot and thinned to 12 plants per pot after emergence. The
greenhouse temperature was set to 27±5 oC and the photoperiod extended to 16
h with high pressure Na lamps.
Plants were watered with deionized water. Leachate was collected and
returned to the pots to eliminate nutrient loss. Plants were harvested 2.5 cm
above the soil surface every 28 d and stubble was left in the pots to regrow. After
three harvests, soils were sieved again and all roots were recovered. A soil
subsample was taken to determine the moisture content. We then mixed the
remaining soil with the minus-N nutrient mixture and put the soil back into the pot
for three more harvest cycles. This process was repeated until the plants stopped
growing or died.
All of the plant tissues were dried at 60 °C, weighed, ground until they
passed a 1mm sieve, and analyzed for total N using a dry combustion method
with a CN analyzer (Flash 2000, CE Elantech, Inc., Lakewood, New Jersey).
Mineral N content in soils before and after cropping were also measured as
described above. Total nonexchangeable NH4+-N content in soils before and
after cropping were also measured using 7-d sodium tetraphenylboron extraction
(Cox et al., 1996).
2.3.2 Estimation of Mineralizable Nitrogen in Indiana Soils at Different Depths
Soil samples were taken from seven sites (Agricultural Center for Research
and Education (ACRE), Davis-Purdue Agricultural Center (DPAC), Northeast-
Purdue Agricultural Center (NEPAC), Pinney-Purdue Agricultural Center (PPAC),
Southeast-Purdue Agricultural Center (SEPAC), Southwest-Purdue Agricultural

50
Center (SWPAC), and Throckmorton-Purdue Agricultural Center (TPAC) in
Indiana. The predominant soil series for ACRE are Chalmers and Raub
(Chalmers-Raub), while Blount and Pewamo (Blount-Pewamo) for DPAC,
Rawson and Haskins (Rawson-Haskins) for NEPAC, Sebewa for PPAC,
Cobbsfork for SEPAC, Ade and Lyles (Ade-Lyles) for SWPAC, and Toronto for
TPAC (Table 2.2). In each field composite soil samples were collected from
depths of 0 to 15, 15 to 30, 30 to 45, and 45 to 60 cm. Samples were air-dried
and sieved through a 2 mm screen after collecting them from the field. Soil water
retention was determined for each sample using a pressure plate (Klute, 1986).
Soil organic matter content was determined by the loss-on-ignition method (Ball,
1964). Soil pH was measured with a glass electrode from a 1:2 soil/water
suspension. Soil texture was measured using the dispersion and sedimentation
procedure described by Jackson (1958). Selected soil properties are presented
in Table 2.3.
2.3.2.1 Static Cup Incubation
Five gram portions of sieved soil were placed into a plastic centrifuge tube
for each sample. Cups were loosely covered by lids to reduce moisture loss and
placed in a chamber with a constant temperature of 25 °C. A split-plot design
was used with soil type as a whole-plot factor and soil depth as a sub-plot factor
and each sample had three replications. Deionized water was added to bring soil
moisture content to 10 KPa water potential. The cups were weighed every seven
days to determine moisture loss and brought back to the proper moisture content
with deionized water. Soil in cups was destructively extracted after 2, 4, 8, 12,
and 16 weeks of incubation by using 50 mL 1 M KCl to rinse soil out of the cup
into a 125 mL flask. After a one hour shaking (170 rpm), suspensions were
filtered through a Whatman No. 1 filter paper and filtrates were collected for
analysis of mineral N (NO3--N and NH4
+-N). The mineral N concentration in all the
samples were analyzed colorimetrically using a continuous flow analyzer (Skalar
Analytical B.V., The Netherlands).

51
2.3.2.2 Nitrogen Mineralization Indices
2.3.2.2.1 Illinois Soil Nitrogen Test (ISNT)
The ISNT was conducted according to Khan et al. (2001). One gram of soil
was placed in a Mason jar along with 10 mL of 2 M NaOH. Samples were heated
to 50 °C for 5 hours. The volatilized NH3 gas was captured in the indicator
solution H3BO3 and the amount of captured NH4+-N was quantified using
acidimetric titration techniques.
2.3.2.2.2 Hot KCl Extractable NH4+ (Hot KCl-N)
Three grams of soil were placed in a 100 mL digestion tube and 20 mL of 2
M KCl were added to each tube. Each sample had three replicates. Tubes were
placed on a block digester maintained at 100 °C for 4 hours. After removal from
the block digester, the soil-solution mixture was filtered through a Whatman No. 1
filter paper and the filtrates were collected for further analysis of the NH4+-N. The
NH4+-N concentration in all the samples were analyzed colorimetrically using a
continuous flow analyzer (Skalar Analytical B.V., The Netherlands).
2.3.2.2.3 Short-term Anaerobic Incubation
To create an anaerobic condition, 5 g of soil sample were placed in the
bottom of a screw cap test tube (17 ml) and 12.5 mL of water were added to fill
the headspace inside the test tube. Samples were arranged in a chamber as a
two-factor factorial design with three replicates. After incubation at 40 °C for 7
days, samples were then transferred into a 50 mL centrifuge tube. The remaining
soil in the test tube was rinsed with 12.5 mL of 4 M KCl to ensure all the sample
was transferred into the centrifuge tube. After 30 min shaking (180 epm),
samples were filtered through a Whatman No. 1 filter paper and filtrates were
collected and stored at 4 °C for further analysis of the NH4+-N. The NH4
+-N
concentration in all the samples were analyzed colorimetrically using a
continuous flow analyzer (Skalar Analytical B.V., The Netherlands). The amount
of mineralized N (anaerobic-N) during 7-d anaerobic incubation was calculated

52
by subtracting the initial NH4+-N concentration from the final NH4
+-N
concentration.
2.3.2.2.4 Three Day Flush of CO2 (Fl_CO2)
Forty grams of soil were placed in a 50 mL glass beaker. Deionized water
was added to bring the soil moisture tension to 10 KPa. The glass beaker with
soil samples was put in a Mason jar along with a vial of 10 mL deionized water
and a vial of 10 mL 1 M NaOH. Lids were tightly fastened. Experimental design
was a two-factor factorial design with three replicates. After 3 days incubation at
25 °C, the vials with 1 M NaOH were taken out of the jars. Barium chloride was
added to the vials to precipitate carbonate. The quantity of CO2 produced was
determined by back-titrating excess NaOH with 1 M HCl. Controls (jars without
soil) were set to measure background CO2 concentration.
2.3.3 Field Experiment
Field experiments were conducted at the seven Purdue University
Agricultural Centers from which soil samples were taken. Corn was grown after
soybean in the same field in 2006, 2008 and 2010 at all locations. No-till
practices were used at SEPAC and NEPAC, while conventional tillage practices
were used elsewhere.
Starter fertilizer (urea ammonium nitrate, UAN) was applied 5 cm beside and
below the seed at planting at a rate of 0 to 32 kg N ha-1 (except one location, at
SWPAC starter fertilizer was broadcast prior to planting in a form of diammonium
phosphate at a rate of 20 kg N ha-1). Nitrogen fertilizer was applied at 6 different
rates from 0 to 224 kg ha -1 in 45 kg ha-1 increments. Fertilizer N was
sidedressed with UAN when corn was at approximately V6 growth stage.
Field estimates of soil N supplying capacity were predicted from grain yield
at a fertilizer N rate of 0 using a harvest index of 75% after subtracting the

53
amount of the starter fertilizer applied assuming the starter fertilizer use efficiency
was 100%.
2.3.4 Data Analysis
All statistical analyses were performed with version 9.2 of SAS (SAS
Institute Inc., 2008). Analysis of variance was conducted using the GLM
procedure. Soil type was used as a class variable. The MEANS procedure with
the LSD option was used for means separation. Relationships among the N
mineralization data obtained through various methods were determined with the
CORR procedure.
Linear regression was conducted to fit the cumulative net N mineralization
data obtained from the laboratory incubation to a zero-order model with the REG
procedure, and non-linear regression was performed to fit the N mineralization
data to a first-order exponential model with the NLIN procedure. The zero-order
kinetic model is of the form (Simard and N'dayegamiye, 1993):
Nm = b0 + kt
whereas the exponential equation is denoted by (Stanford and Smith, 1972)
Nm = N0 (1-exp (-kt))
where Nm is cumulative net N mineralization in time t, b0 is the y-intercept, N0 is
the potentially mineralizable N, and k is rate constant of N mineralization. All
results were adjusted to an oven-dry weight basis.

54
2.4 Results and Discussion
2.4.1 Comparison among Different Biological Methods for Measuring
Mineralized Nitrogen
Results from both biological incubation methods showed more than 96% of
the mineralized N was in the NO3--N form after 16 weeks (Table 2.4), because
NH4+-N was rapidly converted to NO3
--N by nitrifying bacteria under favorable
conditions.
The amount of mineralized N varied among the different soils for both
methods (Table 2.4). In the leaching incubation method, cumulative NH4+-N
recovered was 0.3 to 0.7 mg N kg-1 soil, and no significant differences in
cumulative NH4+-N recovery were observed among soils (P>0.05). For total
mineralized N, soils separated into 3 distinct groups, with the Blount, Pewamo,
Tracy and Cincinnatti soils having the greatest mineralized N (42-45 mg N kg-1
soil), the Chalmers, Pinhook and Cobbsfork having the next most mineralized N
(33-35 mg N kg-1 soil) and the Raub soil having the least mineralized N (29 mg N
kg-1 soil). With the static cup incubation method, soil mineralized N separated into
more distinct groups. The cumulative NH4+-N recovered was 0.2 to 2.2 mg N kg-1
soil. No significant difference in cumulative NH4+-N content was observed except
between Raub and Cobbsfork soils. The Blount soil produced the greatest
amount of total mineral N with a value of 73 mg N kg-1 soil. Nitrogen mineralized
in the Pewamo soil was not significantly different from that of the Blount soil. No
significant difference in total mineralized N was observed among Cobbsfork,
Tracy and Pinhook soils, however the total N mineralized in these soils were
significantly less than the total N mineralized in Pewamo and greater than that in
Raub, Cincinnati, and Chalmers. The Chalmers soil produced the least
mineralized N with 47 mg N kg-1 soil. Although the total mineralized N in
Cincinnati soil (50 mg N kg-1 soil) was greater than in Chalmers, the difference
was not significant (P>0.05).

55
Nitrogen mineralization data obtained from the leaching incubation method
showed that mineralized N steadily increased with time and had not slowed
appreciably at 16 weeks (Figure 2.1). Therefore, the first-order kinetic model
failed to fit the N mineralization data for 6 of the 8 soils studied. The smaller root
mean square errors presented in Table 2.5 indicate that, compared with the first-
order exponential model, a zero-order linear model was better fitted to the N
mineralization data obtained for the leaching incubation method. In these zero-
order models, the intercept (b0) ranged from -4.75 to 5.74 mg N kg-1 soil, and the
rate constant (k) ranged from 1.86 to 2.95 mg kg-1 week-1. Tabatabai and Al-
Khafaji (1980), reported the zero-order kinetic model was more appropriate to fit
the N mineralization data for 12 surface soils from Iowa. In their study, b0 of the
fitted zero-order models were in a range of -6.6 to 17.7 mg N kg-1 soil, and the
values of k were 1.7 to 4.2 mg kg-1 week-1. Simard and N'dayegamiye (1993)
also found that mineralized N in seven Quebec meadow soils showed a linear
increase with time through the whole incubation period using the leaching
incubation method (388 days), and their estimated parameters for b0 and k in the
zero-order models ranged from -14.2 to 17.5 mg N kg-1 soil and 2.69 to 10.27 mg
kg-1 week-1, respectively. The greater k values from the Quebec study are likely a
result of the samples being collected from fields under pasture crops.
With the static cup incubation method, in all eight soils, N mineralization over
the course of incubation was characterized by a linear increase in inorganic N for
the first 8 to 12 weeks of incubation and followed by reduction in mineralization
rate (Figure 2.2). The first order exponential model was a better fit to the N
mineralization data obtained through the static cups incubation method as
justified by smaller root mean square errors (Table 2.5). The N mineralization
potential (N0) and mineralization rate constant (k) were calculated for all eight
soils. The range of values observed for N0 was from 50 mg N kg-1 soil for
Chalmers soil to 128 mg N kg-1 soil for Blount soil, and the average value for N0
was 85 mg N kg-1 soil for eight soils. The rate constant k ranged from 0.0535 to
0.1687 week-1 with an average value of 0.0915 week-1. Schomberg et al. (2009)

56
estimated the N mineralization potentials for 44 soils collected from nine sites in
the southern US with the static incubation method, and the values for N0 reported
in his study ranged from 35 to 488 mg N kg-1 soil, while k values ranged from
0.018 to 0.174 week-1. Wang et al. (2003) also used the static cup incubation
method for prediction of mineralizable N in18 soils from Victoria, New South
Wales, and Queensland in Australia and reported N0 values ranged from 57 to
731 mg N kg-1 soil, and k values were in a range of 0.024 to 0.15 week-1.
Compared to the estimated values of N mineralization parameters from studies
by Wang et al. (2003) and Schomberg et al. (2009), our N0 values were generally
at the lower end of the range while our k values were generally at the higher end
of the range.
Lower amounts of mineralized soil N were observed with the leaching
incubation method compared to the static cup incubation method (Table 2.4).
One possible explanation may be that substantial amounts of labile soluble
organic N were removed by leaching in the leaching incubation (Smith et al.,
1980; Parker and Sommers, 1983; Beauchamp et al., 1986; Wang et al., 2003).
Wang et al. (2003) found that although the leached organic N accounted for only
0.7 to 2.4% of the total organic N of the soils, 22 to 90% of the leached organic N
was mineralized after two weeks incubation because the soluble organic N had
significantly greater mineralizability than the soil-bound organic N. Therefore,
some researchers suggest the use of total leached N (soluble organic + inorganic
N) rather than inorganic N alone for calculating N0 and k (Smith et al., 1980;
Beauchamp et al., 1986). However, other researchers have reported that using
total leached N to calculate N0 and k may overestimate the soil N mineralization
potential (Parker and Sommers, 1983; Wang et al., 2003). Motavalli et al. (1995)
suggested that the lower amount of mineralized N measured with the leaching
incubation method, compared to the static cup incubation, was a result of the
leaching solution failing to remove all of the NO3--N from the soil. Results in their
study showed that extraction efficiency for mineralized N using 0.01 M CaCl2 or
minus-N nutrient solution (containing 0.004 M CaCl2) was lower (3 to 8 mg kg-1

57
soil less for one extraction) compared with 2 M KCl, especially in smectitic soils
or soils with a higher proportion of macroaggregates. In addition, for the leaching
incubation method, within the 16 week incubation period, the mineralized N
linearly increased with time and did not level off, which indicated that soil did not
reach its mineralization potential within the 16 week incubation period; whereas
for the static cup incubation method, after 16 weeks incubation, mineralized soil
N was likely closer to the maximum potential value. Therefore, if the incubation
period was extended, the cumulative mineralized N measured from these two
incubation methods might not significantly differ. Motavalli et al. (1995) showed
that the cumulative amount of N mineralized after a one year long incubation did
not differ between leaching and non-leaching incubation methods.
The correlation between the amounts of mineralized N measured by these
two incubation methods was poor (p=0.4; r=0.3). As discussed previously, for the
leaching incubation method, 6 out of 8 soils did not reach their mineralization
potential within the 16 weeks incubation period, and this may explain the poor
relationship between mineralized N values measured for the two incubation
methods. However, we were able to estimate the N0 and k values for the Raub
and Cincinnati soils through both methods. Results showed that k values
estimated from leaching incubation were lower compared with that estimated
from the static cup incubation for both soils, indicating a slower mineralization
rate as determined using the leaching incubation method. The N0 values
estimated from both methods were similar for the Raub soil, but for the
Cincinnatti soil, the leaching incubation method was approximately 12 mg N kg-1
soil greater than for the static cup incubation method. The greater mineralizable
N value estimated from the leaching incubation method for the Cincinnati soil
might be attributed to leaching effects, which would increase soil pH if the initial
soil pH was very low (Wang et al., 2003).
The results for observed net N mineralized (Nob) by 8 different soils
measured by exhaustive cropping under greenhouse conditions showed that the

58
soils separated into three groups. These data are presented in Table 2.6. The
higher Nob group included the Cobbsfork and Blount soils with cumulative net
mineralized N values of 62 and 61 mg N kg-1 soil, respectively. The lower Nob
group included the Raub, Pinhook, and Chalmers soils with the amount of
cumulative net mineralized N ranging form 45 to 47 mg N kg-1 soil. The Nob
values for Pewamo, Tracy, and Cincinnati soils (50 to 58 mg N kg-1 soil ) was not
significantly different from either group. No significant difference in total
nonexchangeable NH4+-N content was observed for soil samples taken before
planting and after harvesting. By comparing mineralized N estimated from the
two laboratory incubation methods to mineralized soil N supply under
greenhouse conditions, the static cup incubation method was found to better
predict N mineralization from exhaustive cropping under greenhouse conditions
(Figure 2.3), which was expected because mineralized soil N measured using the
static cup incubation method was closer to the potential soil N mineralization
value through 16 weeks incubation.
In general, the static cup incubation method has more advantages for
estimating soil mineralizable N compared to the leaching incubation method as it
is an easier test to perform and soils approach soil N mineralization potential
more quickly.
2.4.2 Estimation of Mineralizable Nitrogen in Indiana Soils at Different Depths
2.4.2.1 Nitrogen Mineralization Potential Estimated by Static Cup Incubation
Similar to the previous experiment, recovered NH4+-N in soil samples was
low throughout the entire incubation period in all samples. The inorganic N was
mainly in the form of NO3--N, especially in the top soil layers due to nitrification.
An initial flush of mineralized N was observed in the surface soils during the
two weeks of incubation (Figure 2.4) and was likely due to the rewetting of
pretreated soil samples that increases the initial rate of N mineralization (Cabrera
and Kissel, 1988; Wang et al., 2003). Some researchers developed a two-pool

59
model that separates the mineralizable N into two pools, a large one that
mineralizes slowly and a small one that mineralizes rapidly (Molina et al., 1980;
Beauchamp et al., 1986; Cabrera and Kissel, 1988). However, this initial pool of
rapidly mineralizable N is generally small and usually does not significantly affect
the final results, so researchers tend to ignore it to simplify the model (Cabrera
and Kissel, 1988; Schomberg et al., 2009). A one-pool model was used to fit the
N mineralization data in our study to calculate N0 and k. Following the initial flush,
the N mineralization pattern of the seven soils was characterized by a steady
increase in inorganic N which began to level off after 8 or 12 weeks of incubation.
Cumulative mineralized N actually decreased after 12 weeks incubation in the
surface layer of the Toronto soil (Figure 2.4). Similar observations were made by
Schomberg et al. (2009) for 6 of 44 soil samples collected from nine sites in the
southern US, which they suggested might have resulted from denitrification
and/or immobilization of NO3--N in the soil.
For the surface soil (0-15 cm), Cobbsfork had the greatest N mineralization
potential with a N0 value of 68 mg N kg-1 soil, while Toronto soil had the least N0
value of 50 mg N kg-1 soil (Table 2.7). Soils separated into three groups, with
greater N0 values (68 to 63 mg N kg-1 soil) for Cobbsfork, Sebewa, and Ade-
Lyles surface soils, and significantly lower N0 values for Toronto surface soil.
However, the difference between N0 values (61 to 57 mg N kg-1 soil) for Blount-
Pewamo, Rawson-Haskins and Chalmers-Raub surface soils and N0 values for
soils in the other two groups was not significant (P>0.05). Soil mineralization
potential values were also reported by Campbell et al. (1984; 66 to 185 mg N
kg−1), and Walley et al. (2002; 9 to 401 mg N kg−1) for soils of Saskatchewan
(heavily manured soils excluded), and Carter and MacLeod (1987; 44 to 247 mg
N kg−1) for soils from Prince Edward Island. Schomberg et al. (2009) reported
that the N mineralization potentials for 44 soil samples collected from 9 sites in
the southern USA were in a range of 35 to 488 mg N kg-1 soil. Wang et al. (2003)
reported the N mineralization potentials for 18 soils collected from Victoria, New
South Wales, and Queensland in Australia were from 57 to 731 mg N kg-1 soil.

60
Although the measured values for N0 in our study were in the range of N0 values
reported in these previous studies, they were in the lower end of the range. The
lower values of N0 in this study compared with previous studies could be due to
the selection of nonmanured, cultivated soils, lower incubation temperature (25°C
vs. 35°C), or shorter incubation time (16 weeks vs. 41 weeks).
The mineralization rate constant, k, also varied among soils. Blount-Pewamo
soil had the greatest mineralization rate (0.2153 week-1). The k values for
Rawson-Haskins and Toronto soils (0.1710 and 0.1702 week-1) were less than
the k value for Blount-Pewamo soil, but the difference was not statistically
significant (P>0.05). The k values for Chalmers-Raub, Sebewa, Cobbsfork and
Ade-Lyles soils (0.1589 to 0.1190 week-1) were significantly less than the k value
for Blount-Pewamo soil (P<0.05) (Table 2.7). The large variation in k values of
different soils was in agreement with other studies (Paustian and Bonde, 1987;
Dendooven et al., 1995; Curtin and Wen, 1999; Wang et al., 2003; and
Schomberg et al., 2009). The averaged k value among all the samples in our
study was about 0.1594 week-1, which was greater than the k values reported by
Wang et al. (2003, 0.069 week-1) and Schomberg et al. (2009; 0.070 week-1), and
this difference might be related to the lower estimated N0 values and shorter
incubation times.
The relationship between estimated N0 and k values has been discussed by
Wang et al. (2003). They found a significant inverse relationship between N0 and
k values. They also indicated that lower values of N0 were observed if the
inorganic N production rate leveled off with time. This study was in agreement
with our observed results of relatively low N0 values and relatively high k values
compared to the studies mentioned previously. To provide a reliable benchmark
for comparing N mineralization capacities among different soils, Wang et al.
(2003) also suggested using a fixed value for mineralization rate constant k
(0.054 week-1) to determine the mineralization potential N0. However, due to the
large difference between the k values we calculated and Wang et al. (2003)

61
suggested, it might be not reasonable to use the fixed k value for the estimation
of the N mineralization potential in our study.
Soil mineralizable N measured in the laboratory generally decreased with
depth (Table 2.7). This observation could be attributed to a decrease in the
availability of organic N (amino acid N) to microorganisms with soil depth, as
reported by Hadas et al. (1986). The magnitude of the decrease generally
declined with soil depth. Averaged across seven soils, the estimated N0 values
significantly decreased from 0-15 cm depth to 15-30 cm depth and from 15-30
cm depth to 30-45 cm depth, but the difference between the two bottom depths
was small and not significant (P>0.05). The k value also varied with soil depth.
However, the variations in k with depth were not consistent because of the
confounding relationship between N0 and k. So as suggested by Mary and Remy
(1979), we also calculated the product of N0 ⨉ k to explore the effect of depth on
N mineralization. The results showed that N0 ⨉ k decreased with soil depth, with
values 11 for 0-15 cm, 7 for 15-30 cm, 4 for 30-45 cm, and 3 for 45-60 cm.
Similarly, the values of N0 ⨉ k among the top three layers were significantly
different while the values of N0 ⨉ k for the bottom two layers were statistically not
different (P>0.05). Similar results were found in previous studies. Cabrera and
Kissel (1988) fit the cumulative net N mineralization data to a two-pool model,
and both N1 and k1 values estimated for the large mineralizable N pool tended to
decrease with depth. Soudi et al. (1990) indicated the effect of depth on N
mineralization rate could be expressed by a model: mineralization rate = 0.54
exp(-0.040D) where D is the depth in cm, while our data showed the relationship
between averaged N0 value and depth was expressed as N0=72 exp(-0.020D)
where D is the depth in cm.
The percentage of the total mineralizable N in the surface layer (0-15 cm)
varied from 33 to 48% (Table 2.7). Averaged among all seven soils, the surface
soil (0-15 cm) contributed approximately 42% of total mineralizable soil N, thus
about 58% of potentially mineralizable soil N can be supplied from the subsoil.

62
This result was consistent with the study by Cassmann and Munns (1980), who
showed that 58% of the total mineralized N was contributed from 18 to 108 cm
depth of soils. Cabrera and Kissel (1988) also indicated that 35 to 48% of the
total mineralizable soil N came from the surface layer (0-15 cm) in three Kansas
soils to a depth of 120 cm. Persson and Wiren (1995) found that the contribution
of the soil surface layer was as high as 74% of the total net soil N mineralization,
but their study was conducted on nonfertilized forest soils with organic horizons.
2.4.2.2 Chemical Indices of Nitrogen Availability
For the surface soil, the ISNT ranged from 123 to 218 kg N ha-1 (average of
170 kg N ha-1) with the greatest ISNT value for Sebewa soil and the least ISNT
value for Ade-Lyles soil (Table 2.8). The anaerobic-N value for Cobbsfork soil
was the greatest (61 mg N kg-1 soil). The anaerobic-N values for Toronto,
Chalmers-Raub, and Sebewa were not statistically different, but all significantly
less than that for Cobbsfork soil (P<0.05). Rawson-Haskins had the lowest
anaerobic-N value (38 mg N kg-1 soil) and it was significantly lower than all the
other soils except Blount-Pewamo (P<0.05). The hot KCl-N for seven surface
soils varied from 7 to 11 mg N kg-1 soil. Although the range was small, the hot
KCl-N values were separated into more distinct groups as shown in Table 2.8.
The Fl_CO2 values for seven surface soils ranged from 44 to 107 mg C kg-1 soil
(average of 67 mg C kg-1 soil). However, no significant difference in Fl_CO2
values was observed (P>0.05), since the standard deviations of three replicates
of samples were really large. The N availability indices ISNT, anaerobic-N, and
hot KCl-N all generally decreased with depth. However, depth did not have
significant effect on Fl_CO2 values.
Of the four N availability indices, ISNT, anaerobic-N, and hot KCl-N showed
promise in predicting potentially mineralizable N with R2> 0.60 (Figure 2.5).
Among these three indices, ISNT and hot KCl-N can be determined in a relatively
short period of time (4 or 5 hours) compared to the 7 days needed for the
anaerobic N test. None of the indices were correlated to the mineralization rate

63
constant k (Figure 2.6). Our results are consistent with the results from
Schomberg et al. (2009) who found that total C, total N, N mineralized by hot KCl,
anaerobic N, and N mineralized in 24 d were reasonable predictors of N0, but
none were predictors for k. The ISNT was developed as a quick and simple
alternative to determine amino sugar N as hydrolysable amino sugar N has been
shown to predict mineralizable soil N (Bushong et al., 2008).
However, arguments still exist. Curtin and Wen (1999) found that hot KCl-N
was poorly correlated to laboratory mineralizable N (R2=0.13) but mineralization
rate k can be predicted with a function of hot KCl-N/N0 (R2=0.64). Sharifi et al.
(2007a) also reported a poor relationship between hot KCl-N and N0 with a R2
value of 0.26.
2.4.3 Nitrogen Mineralization Potential from Field Estimates
Field studies suggest that soil N supply varies from soil to soil and year to
year (Table 2.9). In 2006, field soil N supply ranged from to 23 kg N ha-1
(Cobbsfork soil) to 96 kg N ha-1 (Toronto soil). In 2008, soil N supply was
greatest in Sebewa soil with a value of approximately 64 kg N ha-1 and least in
Cobbsfork soil with a value of 24 kg N ha-1. In 2010, field soil N supply was in a
range of 25 kg N ha-1 (Ade-Lyles soil) to 53 kg N ha-1 (Rawson-Haskins soil).
Averaged across three years, Soil N supply in Toronto soil (76 kg N ha-1) was
greater than soil N supply in all other soils except Chalmers-Raub and Sebewa.
The difference in soil N supply in Chalmers-Raub, Sebewa, Rawson-Haskins,
and Blount-Pewamo soils (61-36 kg N ha-1) was not statistically different (P>0.05).
The average soil N supply was least in Ade-Lyles and Cobbsfork soils with
values of 30 kg N ha-1 and 27 kg N ha-1, respectively. The total amount of
laboratory mineralizable N of all four layers ranged from 115 to 183 mg kg-1 N in
the seven soils (Table 2.7). Compared with soil N supply estimated from the field,
clearly, laboratory mineralization potentials overestimate potentially plant-
available soil N supply. This result was in agreement with Cabrera and Kissel
(1988), who showed that mineralizable N estimated from laboratory incubations

64
overpredicted the amount of the mineralized N in the field by 67 to 343%. Delphin
(2000) also compared net N mineralization estimated by calculating the N
balance sheet in the field to the amount of mineralized N measured from
laboratory incubation as well as from an outdoor incubation. Results of this study
showed that, although the amount of mineralized N measured from laboratory
incubation was in good agreement with the values measured through outdoor
incubation, both methods over predicted net N mineralization in the field.
Relationships between laboratory soil N mineralization estimates and soil N
supply in the field were poor (Figure 2.7). The poor relationship between
laboratory mineralizable N and field soil N supply can be attributed to the
consistent moisture and temperature conditions as well as minimal N loss under
laboratory conditions when compared to the inherent variability of these factors in
the field. Within the range of 5 to 35 °C, an Arrhenius function describes the
relationship between temperature and N mineralization, as a 10-degree increase
in temperature increases the mineralization rate two times (Cassman and Munns,
1980; Kladivko and Keeney, 1987). In our research, 25 °C was used as the
laboratory soil incubation temperature, and the temperature variation was within
1°C. In the field, fluctuation in temperature from 0 to 35 °C are common and can
lead to large variations in soil N mineralization. The optimum soil moisture
tension for N mineralization is between 10 and 30 KPa (Stanford and Epstein,
1974; Myers et al., 1982). At greater moisture contents, soil N mineralization is
limited due to oxygen deficiency (Foth and Ellis, 1997). Mineralized N also
decreases linearly with moisture tension from 30 to 150 KPa (Stanford and
Epstein, 1974). In our study, soil samples were incubated with moisture tension
of 10 KPa. Under such conditions, soil N mineralization was maximized. In the
field, excessively wet or dry conditions significantly decrease soil N
mineralization rates. In addition, field soil N availability is also affected by other N
transformation and loss mechanisms such as denitrification and leaching, which
are driven by temperature and moisture as well. For example, heavy precipitation
results in large mineral N loss through leaching. In Indiana the average annual

65
nitrate-N loss from drainage tiles was as high as 70 kg ha-1 (Kladivko, 2001)
which is approximately one third of the typical N fertilizer application rate. When a
heavy rainfall happens after several weeks of high temperature (>25 °C), large
amounts of mineralized soil N and fertilizer N can be lost from the crop root zone
via leaching and or denitrification, resulting in a significant loss of soil N supply in
the field. Some studies suggest that combining soil N mineralization potential and
pre-plant soil mineral N content increased correlation coefficients between
laboratory mineralization estimates and field soil N supply indices (Stanford et al.,
1977; Kuo et al., 1996; Carpenter-Boggs et al., 2000). However, pre-plant soil
mineral N content is highly sensitive to the sampling date (McTaggart and Smith
1993; Zebarth and Paul 1997). Therefore, it might not be reliable to use the pre-
plant soil mineral N content as a predictive test for fertilizer recommendations,
especially in humid environments where the NO3--N concentrations in the soil
change rapidly over time (Sharifi et al., 2007b).
Figure 2.7 also clearly showed for most soils the variability in soil N supply
measured in the field was greater than the variability in soil N supply measured in
the laboratory. The variability of field soil N supply among years indicates that
weather is the most important factor that impacts soil N mineralization in the field.
In a study established in potato trials located in New Brunswick and Prince
Edward Island, Canada and Maine, USA. Sharifi et al. (2007b) compared N0, k,
and N0 ⨉ k predicted from laboratory incubation methods with the field soil N
supply estimated from plant N uptake without fertilizer application (PNU0N),
PNU0N plus mineral N content in the top 30cm depth of soil at harvest
(PNU0N+SMNh), or relative yield. Similar to our results, they found little
correlation between N0 and any field-based indices of soil N supply. Although the
k and N0 ⨉ k were significantly correlated with PNU0N and PNU0N+SMNh
(r=0.54–0.67) for the 2004-2005 data, the relationship between these
mineralization parameters and the indices of field soil N supply was weak
(r=0.13-0.39) due to the large yearly variation in field soil N supply.
66
2.5 Conclusions
When comparing two long-term aerobic incubation methods, the static cup
incubation method required less incubation time for the prediction of soil N
mineralization potential, and the measured mineralized N with this method was
better correlated to plant N uptake measured under greenhouse conditions.
Several short-term chemical indices showed promises in predicting soil N
mineralization potentials as well, most notably ISNT, hot KCl and anaerobic N.
However, there were difficulties in extrapolating results from laboratory
incubations to field scale where weather factors and other N transformation and
loss processes play a more important role in controlling soil N supply. Therefore,
to better predict field soil N supply, a weather-driven model should be developed
to incorporate soil surface and subsurface N mineralization potentials with crop
growth and N uptake parameters and N transformation and loss mechanisms.

67
2.6 Reference
Allen, S.E., G.L. Terman, and L.B. Clements. 1976. Greenhouse techniques for
soil-plant-fertilizer research. National Fertilizer Development Center, Muscle
Shoals, AL.
Antonopoulos, A.Z. 1999. Comparison of different models to simulate soil
temperature and moisture effects on nitrogen mineralization in the soil. J.
Plant Nutr. Soil Sci. 162: 667-675.
Ball, D.F. 1964. Loss-on-ignition as an estimate of organic matter and organic
carbon in non-calcareous soils. J. Soil Sci. 15: 84-92.
Beauchamp, E.G., W.D. Reynolds, D. Brasche-Villeneuve, and K. Kirby. 1986.
Nitrogen mineralization kinetics with different soil pretreatments and
cropping histories. Soil Sci. Soc. Am. J. 50: 1478-1483.
Bremner, J.M. 1965. Nitrogen availability indexes. p. 1324-1345. In C.A. Black
(ed.) Methods of soil analysis. Part 2. Chemical and microbiological
properties. Am. Soc. Agron. Inc, Monogr. 10. Madison, WI.
Broadbent, F.F. 1984. Plant use of soil nitrogen. p. 171-182. In R.D. Haulk (ed.)
Nitrogen in crop production. ASA, CSSA, and SSSA, Madison WI.
Bundy, L.G., and J.J. Meisinger. 1994. Nitrogen availability indices. p. 951– 984.
In R.W. Weaver et al. (ed.) Methods of soil analysis. Part 2. SSSA Book Ser.
5. ASA and SSSA, Madison, WI.
Bushong, J.T., T.L. Roberts, W.J. Ross, R.J. Norman, N.A. Slaton, and C.E.
Wilson, Jr. 2008. Evaluation of distillation and diffusion techniques for
estimating hydrolyzable amino sugar-nitrogen as a means of predicting
nitrogen mineralization. Soil Sci. Soc. Am. J. 72: 992-999.

68
Cabreba, M.L., and D.E. Kissel. 1988. Evaluation of a method to predict nitrogen
mineralized from soil organic matter under field conditions. Soil Sci. Soc. Am.
J. 52: 1027-1031.
Campbell, C.A., Y.W. Jame, and G.E. Winkleman. 1984. Mineralization rate
constants and their use for estimating nitrogen mineralization in some
Canadian prairie soils. Can. J. Soil Sci. 64: 333–343.
Carter, M.R., and J.A. MacLeod. 1987. Biological properties of some Prince
Edward Island soils: Relationship between microbial biomass nitrogen and
mineralizable nitrogen. Can. J. Soil Sci. 67: 333–340.
Carpenter-Boggs, L., J.L. Pikul Jr, M.F. Vigil, and W.E. Riedell. 2000. Soil
nitrogen mineralization influenced by crop rotation and nitrogen fertilization.
Soil Sci. Soc. Am. J. 64: 2038-2045.
Cassman, K.G., and D.N. Munns. 1980. Nitrogen mineralization as affected by
soil moisture and depth. Soil Sci. Soc. Am. J. 44: 1233-1237.
Cox, A.E., B.C. Joern, and C.B. Roth. 1996. Nonexchangeable ammonium and
potassium determination in soils with a modified sodium tetraphenylboron
method. Soil Sci. Soc. Am. J. 60: 114-120.
Curtin, D., and G. Wen. 1999. Organic matter frations contributing to soil nitrogen
mineralization potential. Soil Sci. Soc. Am. J. 63: 410-415.
Dean, L.A. 1952. A concept concerning the measurement of available soil
nutrients. Soil Sci. 73: 263-272.
Delphin, J.E. 2000. Estimation of nitrogen mineralization in the field from an
incubation test and from soil analysis. Agronomie 20: 349–361.

69
Emmert, D. 2009. Using canopy reflectance to monitor corn response to nitrogen
and the effects of delayed nitrogen application. Master’s Thesis. Purdue
University.
Foth, H.D., and B.G. Ellis. 1996. Soil fertility. p. 115-144. 2nd ed. CRC Press,
Boca Raton, FL.
Franzluebbers, A.J., R.L. Haney, C.W. Honeycutt, M.A. Arshad, H.H. Schomberg,
and F.M. Hons. 2001. Climatic influences on active fractions of soil organic
matter. Soil Biol. Biochem. 33: 1103-1111.
Griffin, T.S. 2008. Nitrogen availability. p. 616–646. In J.S. Schepers and W.R.
Raun (ed.) Nitrogen in agricultural soils. Agron. Monogr. 49. ASA, CSSA,
SSSA, Madison WI.
Jalil, A., C.A. Campbell, J.J. Schoenau, J.L. Henry, Y.W. Jame, and G.P. Lafond.
1996. Assessment of two chemical extraction methods as indices of
available nitrogen. Soil Sci. Soc. Am. J. 60: 1954–1960.
Keeney, D.R. 1980. Nitrogen availability indexes. In R.H. Miller (ed.) Methods of
soil analysis (rev). Part 3. Microbiological properties. Am. Soc. Agron. Inc,
Madison, WI.
Keeney, D.R., and J.M. Bremner. 1966. Comparison and evaluation of laboratory
methods of obtaining an index of soil nitrogen availability. Agron. J. 58: 498-
503.
Khan, S.A., R.L. Mulvaney, and R.G. Hoeft. 2001. A simple soil test for detecting
sites that are nonresponsive to nitrogen fertilization. Soil Sci. Soc. Am. J. 65:
1751-1760.
Kladivko, E.J. 2001. Nitrate leaching into tile drains at SEPAC. Agronomy Dept.,
Purdue University. AGRY 04-01. http://www.agry.purdue.edu/ext/pubs/AY-
04-01.pdf.

70
Kladivko, E.J., and D.R. Keeney. 1987. Soil nitrogen mineralization as affected
by water and temperature interactions. Biol. Fertil. Soils 5: 248-252.
Klute, A. 1986. Water retention. Laboratory methods. Chap. 26. In A. Klute (ed.)
Methods of soil analysis. Part 1, 2nd edition. Agronomy 9: 635-662.
Kuo, S., U.M. Sainju, and E. Jellum. 1996. Winter cover cropping influence on
nitrogen mineralization, presidedress soil nitrate test, and corn yields. Biol.
Fertil. Soils 22: 310-317.
Mary, B., and J.C. Remy. 1979. Evaluation of the mineralization potential of
arable soils: Significance of the mineralization kinetics of humified organic
matter. Ann. Agron. 30: 513-527.
McTaggart, I.P., and K.A. Smith. 1993. Estimation of potentially mineralizable
nitrogen in soil by KCl extraction. Plant Soil 157: 175-184.
Molina, J.A.E., C.E. Clapp, and W.E. Larson. 1980. Potentially mineralizable
nitrogen in soil: The simple exponential model does not apply for the first 12
weeks of incubation. Soil Sci. Soc. Am. J. 44: 442-443.
Motavalli, P.P., S.D. Frey, and N.A. Scott. 1995. Effects of filter type and
extraction efficiency on nitrogen mineralization measurements using the
aerobic leaching soil incubation method. Biol. Fertil. Soil 20: 197-204.
Myers, R.J.K., C.A. Campbell, and K.L. Weir. 1982. Quantitative relationship
between net nitrogen mineralization and moisture content of soil. Can. J. Soil
Sci. 62: 111-124.
Oberle, S.L., and D.R. Keeney. 1990. Factors influencing corn fertilizer N
requirements in the Northern U.S. Corn Belt. J. Prod. Agric 3: 527-534.
Parker, C.F., and L.E. Sommers. 1983. Mineralization of nitrogen in sewage
sludges. J. Environ. Qual. 12: 150–156.

71
Paustian, K., T.A. Bonde. 1987. Interpreting incubation data on nitrogen
mineralization from soil organic matter. In: Cooley, J.H. (ed.) Soil organic
matter dynamics and soil productivity. Proceedings of INTECOL workshop,
Athens, GA, pp 101–112.
Persson, T., and A. Wiren. 1995. Nitrogen mineralization and potential
nitrification at different depths in acid forest soils. Plant Soil 168-169: 55-65.
Ros, G.H., E. Hoffland, C. van Kessel, and E.J.M. Temminghoff. 2009.
Extractable and dissolved soil organic nitrogen. Soil Biol. Biochem. 41:
1029-1039.
Ros, G.H., M.C. Hanegraaf, E. Hoffland, and W.H. van Riemsdijk. 2011.
Predicting soil nitrogen mineralization: Relevance of organic matter fractions
and soil properties. Soil Biol. Biochem. 43: 1714-1722.
Schomberg, H.H., S. Wietholter, T.S. Griffin, D.W. Reeves, M.L. Cabrera, D.S.
Fisher, D.M. Endale, J.M. Novak, K.S. Balkcom, R.L. Raper, N.R. Kitchen,
M.A. Locke, K.N. Potter, R.C. Schwartz, C.C. Truman, and D.D. Tyler. 2009.
Assessing indices for predicting potential nitrogen mineralization in soils
under different management systems. Soil Sci. Soc. Am. J. 73: 1575-1586.
Senwo, Z.N., and M.A. Tabatabai. 2005. Effect of management systems on
nitrogen mineralization and nitrification in soils. Comm. Soil Sci. Plant Anal.
36: 1313-1326.
Sharifi, M., B.J. Zebarth, D.L. Burton, C.A. Grant, and J.M. Cooper. 2007a.
Evaluation of some indices of potentially mineralizable nitrogen in soil. Soil
Sci. Soc. Am. J. 71: 1233–1239.

72
Sharifi, M., B.J. Zebarth, D.L. Burton, C.A. Grant, G.A. Porter, J.M. Cooper, Y.
Leclerc, G. Moreau, and W.J. Arsenault. 2007b. Evaluation of laboratory-
based measures of soil mineral nitrogen and potentially mineralizable
nitrogen as predictors of field-based indices of soil nitrogen supply in potato
production. Plant Soil 301: 203-214.
Simard, R.R., and A. N'dayegamiye. 1993. Nitrogen mineralization potential of
meadow soils. Can. J. Soil Sci. 73: 27-38.
Smith, J.L., R.R. Schnabel, B.L. McNeal, and G.S. Campbell. 1980. Potential
errors in the first-order model for estimating soil nitrogen mineralization
potentials. Soil Sci. Soc. Am. J. 44: 996–1000.
Soudi, B., A. Sbai, and C.N. Chiang. 1990. Nitrogen mineralization in semiarid
soils of Morocco: rate constant variation with depth. Soil Sci. Soc. Am. J. 54:
756-761.
Stanford, G., and E. Epstein. 1974. Nitrogen mineralization-water relations in
soils. Soil Sci. Soc. Am. Proc. 38: 103-107.
Stanford, G., M.H. Frere, amd D.H. Schwaninger. 1973. Temperature coefficient
of soil nitrogen mineralization. Soil Sci. 115: 121-123.
Stanford, G., and S.J. Smith. 1972. Nitrogen minerialization potentials of soils.
Soil Sci. Soc. Am. Proc. 36: 465-472.
Stanford, G., J.N. Carter, D.T. Westermann, and J.J. Meisinger. 1977. Residual
nitrate and mineralizable soil nitrogen in relation to nitrogen uptake by
irrigated sugar beets. Agron. J. 69: 303-308.
Tabatabai, M.A., and A.A. Al-Khafaji. 1980. Comparison of nitrogen and sulfur
mineralization in soils. Soil Sci. Soc. Am. J. 44: 1000-1006.

73
Vernimmen, R.R.E., H.A. Verhoef, J.M. Verstraten, L.A. Bruijnzeel, N.S. Klomp,
H.R. Zoomer, and P.E. Wartenbergh. 2007. Nitrogen mineralization,
nitrification and denitrification potential in contrasting lowland rain forest
types in central Kalimantan, Indenesia. Soil Biol. Biochem. 39: 2992-3003.
Walley, F., T. Yates, J.W. van Groenigen, and C. van Kessel. 2002.
Relationships between soil nitrogen availability indices, yield, and nitrogen
accumulation of wheat. Soil Sci. Soc. Am. J. 66: 1549–1561.
Wang, W.J., C.J. Smith, and D. Chen. 2003. Towards a standardized procedure
for determining the potentially mineralizable nitrogen of soil. Biol. Fertil. Soils
37: 362-374.
Williams, J.D., C.R. Crozier, J.G. White, R.W. Heiniger, R.P. Sripada, And D.A.
Crouse. 2007. Illinois soil nitrogen test predicts southeastern U.S. corn
economic optimum nitrogen rates. Soil Sci. Soc. Am. J. 71: 735-744.
Zebarth, B.J., and J.W. Paul. 1997. Growing season nitrogen dynamics in
manured soils in south coastal British Columbia: implications for a soil nitrate
test for silage corn. Can. J. Soil Sci. 77: 67-76.
Zinati, G.M., D.R. Christenson, and D. Harris. 2007. Estimation of field N
mineralization from laboratory incubation for sugar beet production in
Michigan. Comm. Soil Sci. Plant Anal. 38: 827-842.
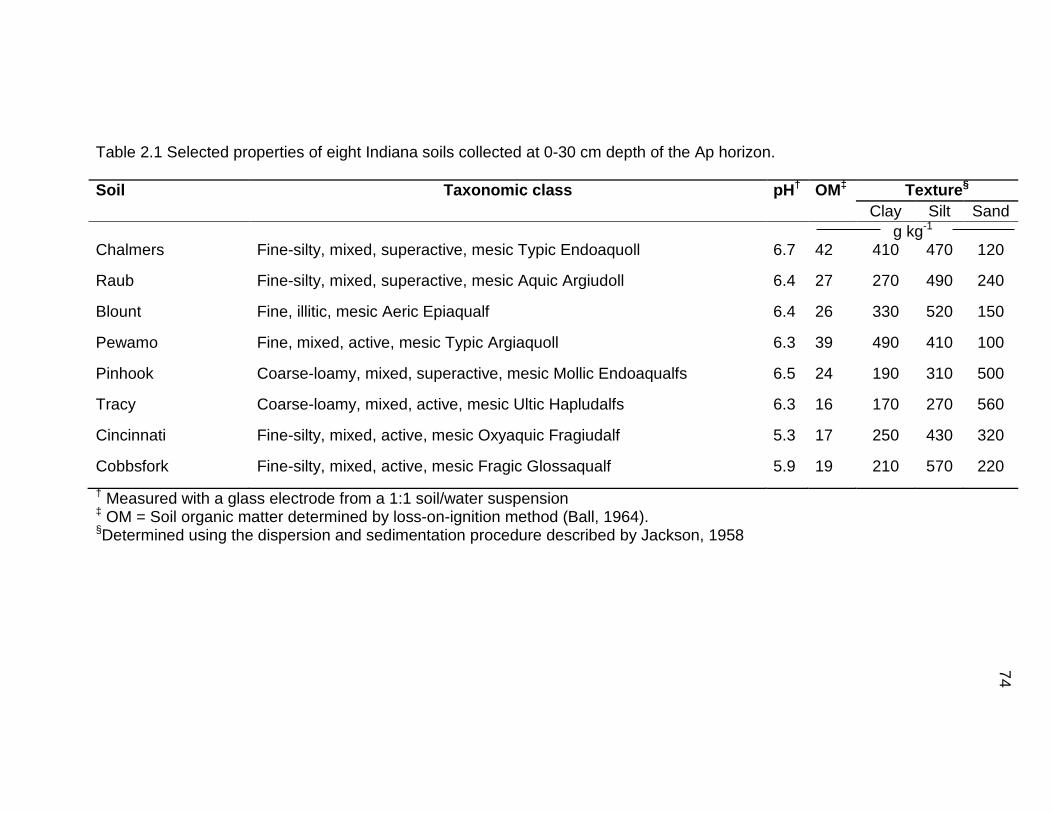
74
Table 2.1 Selected properties of eight Indiana soils collected at 0-30 cm depth of the Ap horizon. Soil Taxonomic class pH† OM‡ Texture§
Clay Silt Sand g kg-1 Chalmers Fine-silty, mixed, superactive, mesic Typic Endoaquoll 6.7 42 410 470 120
Raub Fine-silty, mixed, superactive, mesic Aquic Argiudoll 6.4 27 270 490 240
Blount Fine, illitic, mesic Aeric Epiaqualf 6.4 26 330 520 150
Pewamo Fine, mixed, active, mesic Typic Argiaquoll 6.3 39 490 410 100
Pinhook Coarse-loamy, mixed, superactive, mesic Mollic Endoaqualfs 6.5 24 190 310 500
Tracy Coarse-loamy, mixed, active, mesic Ultic Hapludalfs 6.3 16 170 270 560
Cincinnati Fine-silty, mixed, active, mesic Oxyaquic Fragiudalf 5.3 17 250 430 320
Cobbsfork Fine-silty, mixed, active, mesic Fragic Glossaqualf 5.9 19 210 570 220 † Measured with a glass electrode from a 1:1 soil/water suspension ‡ OM = Soil organic matter determined by loss-on-ignition method (Ball, 1964). §Determined using the dispersion and sedimentation procedure described by Jackson, 1958

75
Table 2.2 Predominant soil series and taxonomic class of soils for seven sites Location Soil Series and Taxonomic class
ACRE Chalmers: Fine-silty, mixed, superactive, mesic Typic Endoaquoll
Raub: Fine-silty, mixed, superactive, mesic Aquic Argiudoll
DPAC Blount: Fine, illitic, mesic Aeric Epiaqualf
Pewamo: Fine, mixed, active, mesic Typic Argiaquoll
NEPAC Rawson: Fine-loamy, mixed, active, mesic Oxyaquic Hapludalf
Haskins: Fine-loamy, mixed, active, mesic Aeric Epiaqualf
PPAC Sebewa: Fine-loamy over sandy or sandy-skeletal, mixed, superactive, mesic Typic Argiaquoll
SEPAC Cobbsfork: Fine-silty, mixed, active, mesic Fragic Glossaqualf
SWPAC Ade: Coarse-loamy, mixed, superactive, mesic Lamellic Argiudoll
Lyles: Coarse-loamy, mixed, superactive, mesic Typic Endoaquoll
TPAC Toronto: Fine-silty, mixed, superactive, mesic udollic Epiaqualf

76
Table 2.3 Properties of soils collected at four depths (0 to 15, 15 to 30, 30 to 45, and 45 to 60cm) from seven sites in Indiana.
Soil Depth pH† OM‡ Texture§ Clay Silt Sand
cm g kg-1
Chalmers-Raub
0-15 6.5 36 350 470 190 15-30 7.6 37 380 440 190 30-45 6.2 25 400 450 160 45-60 6.4 25 360 450 200
Blount-Pewamo
0-15 7.1 36 410 430 170 15-30 7.8 31 450 400 160 30-45 7.9 30 440 400 170 45-60 8.0 25 500 330 180
Rawson-Haskins
0-15 6.4 25 270 320 420 15-30 6.8 21 340 290 380 30-45 7.3 17 380 230 400 45-60 7.9 19 420 220 370
Sebewa 0-15 6.6 32 270 280 460
15-30 6.4 31 320 280 410 30-45 6.6 23 320 300 390 45-60 6.9 17 300 280 430
Cobbsfork 0-15 6.2 23 240 630 130
15-30 5.8 20 320 580 110 30-45 5.7 19 320 580 110 45-60 5.5 19 310 540 160
Ade-Lyles 0-15 6.4 14 110 200 700
15-30 6.9 10 100 210 700 30-45 7.0 04 100 190 710 45-60 7.0 06 120 190 700
Toronto 0-15 6.2 24 230 580 200
15-30 5.7 22 310 540 160 30-45 5.6 19 320 430 260 45-60 5.6 22 370 410 230
† Measured with a glass electrode from a 1:1 soil/water suspension. ‡ OM = Soil organic matter determined by loss-on-ignition method (Ball, 1964). §Determined using the dispersion and sedimentation procedure described by Jackson (1958).

77
Table 2.4 The cumulative amount of nitrogen (NO3--N and NH4
+-N) mineralized by eight soils during the 16 week incubation for the leaching incubation and static cup incubation methods.
Soil Leaching incubation Static cup incubation
NH4+-N NO3
--N Total NH4+-N NO3
--N Total mg kg-1 soil
Chalmers 0.4a† 34c 35b 0.7ab 46e 47e Raub 0.7a 28d 29c 2.2a 53d 55d
Blount 0.3a 44a 45a 1.0ab 72a 73a Pewamo 0.6a 41b 42a 0.6ab 67ab 68ab Pinhook 0.3a 34c 35b 0.6ab 61c 62c
Tracy 0.5a 42ab 42a 1.4ab 63bc 65bc Cincinnati 0.5a 43ab 44a 0.7ab 49de 50de Cobbsfork 0.6a 33c 33b 0.2b 66bc 66bc
† Numbers followed by the same letter are not significantly different (p>0.05).
Table 2.5 Root mean square errors for zero-order and first-order models fitted to N mineralization data obtained for the leaching incubation and static cup incubation methods.
Soil Leaching incubation Static cup incubation
Zero-order First-order Zero-order First-order Chalmers 0.7 1.6 3.3 2.5
Raub 0.9 0.7 2.8 2.4 Blount 1.7 5.3 3.6 2.3
Pewamo 0.4 1.6 3.1 2.4 Pinhook 1.2 2.9 3.8 3.1
Tracy 1.6 4.1 2.3 2.0 Cincinnati 0.7 0.4 1.9 1.1 Cobbsfork 0.5 1.9 4.4 2.7

78
Table 2.6 Plant uptake nitrogen, mineral nitrogen in soils before and after cropping, and observed net nitrogen mineralized under greenhouse conditions (unit: mg kg-1).
Soil Nuptake
† Nr‡ Nmin
§ Nob¶ Nonex_Nb
†† Nonex_Na‡‡
Chalmers 54d§§ 4 11 47b 177A 186A Raub 58cd 2 15 45b 146A 140A Blount 69ab 4 12 61a 226A 209A Pewamo 69ab 5 16 58ab 282A 278A Pinhook 62bc 2 17 46b 126A 126A Tracy 73a 2 18 57ab 126A 127A Cincinnati 59cd 2 11 50ab 125A 126A Cobbsfork 74a 4 16 62a 110A 128A
†Nuptake is the total N taken up by plants at harvest. ‡Nr is measured soil mineral N in the soils after two cropping sequence. §Nmin is the measured soil mineral N in the soils before planting. ¶Nob, the observed net N mineralized in soils, was determined using the following equation: Nob=(Mineral Nr + Plant Nuptake) – Mineral Nmin +Nloss. Nloss is considered as the amont of N leached from the soil, which is negligible, because we returned the leachate back to the pots. ††Nonex_Nb is the measured total nonexchangeable NH4
+-N content in the soils before planting. ‡‡ Nonex_Na is the measured total nonexchangeable NH4
+-N content in the soils after two cropping sequence. §§Capital letters indicate the difference in total nonexchangeable NH4
+-N content before planting and after harvesting. Lower case letters indicate difference in N amount as affected by soil type. Numbers followed by the same letter are not significantly different (p>0.05).

79
Table 2.7 Predicted N0 and K values of four depth for seven soils †. The relative contribution from the top soil (0-15cm) was indicated.
Soil
0-15cm 15-30cm 30-45cm 45-60cm Sum of
N0 % in top
layer§ Ave. k
N0 k N0 ⨉ k
N0 k N0 ⨉ k
N0 k N0 ⨉ k
N0 k N0 ⨉ k
Chalmers-Raub 57ab‡ 0.2083 12 47 0.1240 6 29 0.1077 3 41 0.0361 1 175ab 33 0.1190b
Blount-Pewamo 61ab 0.2469 15 47 0.2394 11 41 0.1876 8 37 0.1873 7 183a 33 0.2153a
Rawson-Haskins 60ab 0.1651 10 29 0.2009 6 30 0.2240 7 28 0.0941 3 151bc 41 0.1710ab
Sebewa 67a 0.1118 7 31 0.1897 6 22 0.1379 3 20 0.1016 2 141c 48 0.1352b
Cobbsfork 68a 0.2286 16 30 0.2077 6 27 0.0724 2 16 0.0762 1 142c 48 0.1462b
Ade-Lyles 63a 0.1520 10 30 0.2542 8 20 0.0830 2 18 0.1851 3 131cd 48 0.1589b
Toronto 50b 0.1408 7 30 0.2165 6 20 0.1709 3 13 0.1525 2 115d 44 0.1702ab
Average 61A 0.1791α 11a 35B 0.1991α 7b 27C 0.1405β 4c 25C 0.1190β 3c 148 42 0.1594
† N0 is the potentially mineralizable N with a unit of mg kg-1, and k is the first order rate constant (week-1). ‡ Numbers followed by the same notation symbol are not significantly different (p>0.05). § Top layer: 0-15 cm depth; % in top layer=N0(0-15 cm)/sum of N0 × 100%
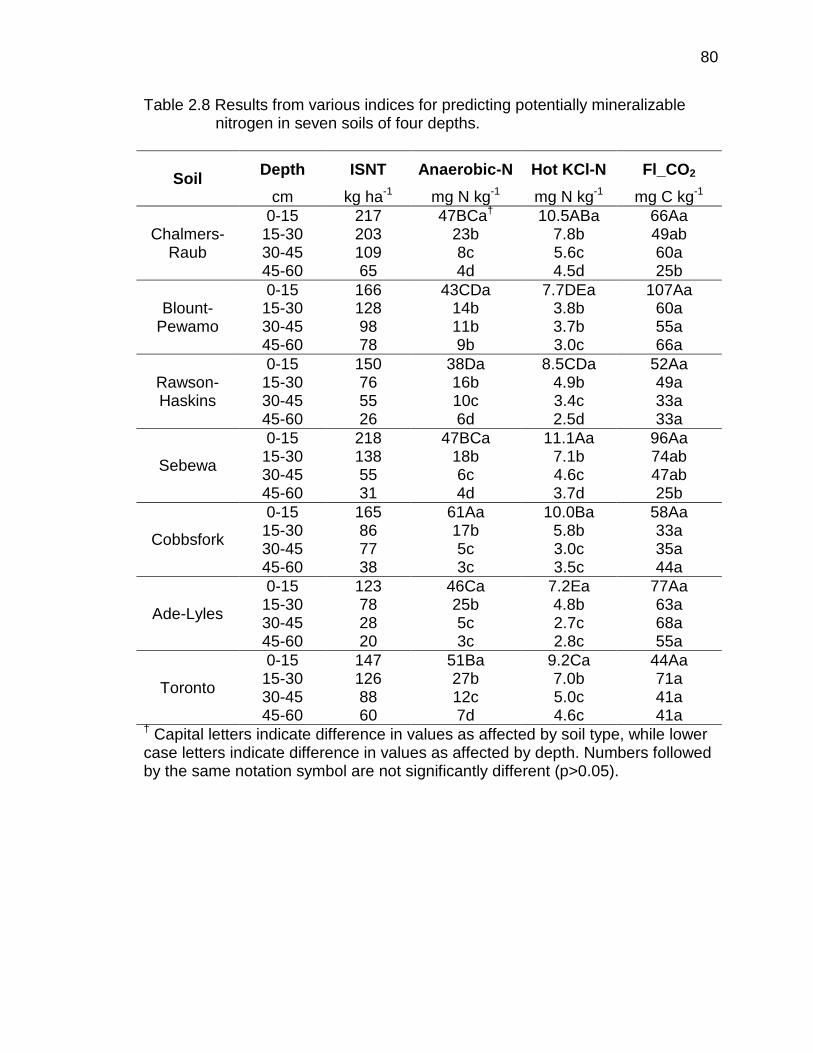
80
Table 2.8 Results from various indices for predicting potentially mineralizable nitrogen in seven soils of four depths.
Soil Depth ISNT Anaerobic-N Hot KCl-N Fl_CO2 cm kg ha-1 mg N kg-1 mg N kg-1 mg C kg-1
Chalmers-Raub
0-15 217 47BCa† 10.5ABa 66Aa 15-30 203 23b 7.8b 49ab 30-45 109 8c 5.6c 60a 45-60 65 4d 4.5d 25b
Blount-Pewamo
0-15 166 43CDa 7.7DEa 107Aa 15-30 128 14b 3.8b 60a 30-45 98 11b 3.7b 55a 45-60 78 9b 3.0c 66a
Rawson-Haskins
0-15 150 38Da 8.5CDa 52Aa 15-30 76 16b 4.9b 49a 30-45 55 10c 3.4c 33a 45-60 26 6d 2.5d 33a
Sebewa 0-15 218 47BCa 11.1Aa 96Aa
15-30 138 18b 7.1b 74ab 30-45 55 6c 4.6c 47ab 45-60 31 4d 3.7d 25b
Cobbsfork 0-15 165 61Aa 10.0Ba 58Aa
15-30 86 17b 5.8b 33a 30-45 77 5c 3.0c 35a 45-60 38 3c 3.5c 44a
Ade-Lyles 0-15 123 46Ca 7.2Ea 77Aa
15-30 78 25b 4.8b 63a 30-45 28 5c 2.7c 68a 45-60 20 3c 2.8c 55a
Toronto 0-15 147 51Ba 9.2Ca 44Aa
15-30 126 27b 7.0b 71a 30-45 88 12c 5.0c 41a 45-60 60 7d 4.6c 41a
† Capital letters indicate difference in values as affected by soil type, while lower case letters indicate difference in values as affected by depth. Numbers followed by the same notation symbol are not significantly different (p>0.05).

81
Table 2.9 Estimated field soil nitrogen supply (in kg ha-1) for seven soils in 2006, 2008, and 2010.
Soil 2006 2008 2010 Mean STD†
Chalmers-Raub 86 50 46 61ab 22
Blount-Pewamo 28 45 N/A‡ 36bc 12 Rawson-Haskins 40 34 53 42bc 10
Sebewa 70 64 44 59ab 13
Cobbsfork 23 24 35 27c 7
Ade-Lyles 35 31 25 30c 5
Toronto 96 57 N/A 76a 28 † STD=standard deviation. ‡ Data is not available.

82
Cum
ulat
ive
net N
min
eral
izat
ion
thro
ugh
leac
hing
incu
batio
n, m
g ka
-1
0
10
20
30
40
50
60
70
80
Chalmers: Nt= 3.59+1.8632t, r2=0.99
Raub: Nt= 76(1-exp(-0.0283t)), r2=0.99
Blount: Nt= -4.75+2.9502t, r2=0.99
Pewamo: Nt= 5.74+2.2452t, r2=1.00
0 2 4 6 8 10 12 14 16 180
10
20
30
40
50
60
70
80Pinhook: Nt= -2.46+2.1927t, r2=0.99
Tracy: Nt= -2.50+2.6752t, r2=0.98
Week of incubation
0 2 4 6 8 10 12 14 16 18
Cincinnati: Nt=93(1-exp(-0.0387t)), r2=1.00
Cobbsfork: Nt= -0.93+2.1768t, r2=1.00
Figure 2.1 Time course of N mineralization of eight Indiana soils through 16 weeks for the leaching incubation method. The cumulative N values obtained as a sum of NO3
--N and NH4+-N were mean of three
replicates. Error bars indicate the standard deviation of the mean of three replicates.

83
0
20
40
60
80
100
120
Chalmers: Nt=50(1-exp(-0.1687t)), r2=0.97
Raub: Nt=79(1-exp(-0.0765t)), r2=0.98
Week of incubation0 2 4 6 8 10 12 14 16 18C
umul
ativ
e ne
t N m
iner
aliz
atio
n th
roug
h st
atic
cup
s in
cuba
tion,
mg
kg-1
0
20
40
60
80
100
120
Pinhook: Nt=80(1-exp(-0.0912t)), r2=0.99
Tracy: Nt=88(1-exp(-0.0838t)), r2=0.98
0 2 4 6 8 10 12 14 16 18
Cincinnati: Nt=81(1-exp(-0.0599t)), r2=1.00
Cobbsfork: Nt=92(1-exp(-0.0828t)), r2=0.99
Blount: Nt=128(1-exp(-0.0535t)), r2=0.99Pewamo: Nt=79(1-exp(-0.1153t)), r2=0.99
Figure 2.2 Time course of N mineralization of eight Indiana soils through 16
weeks for the static cup incubation method. The cumulative N values obtained as a sum of NO3
--N and NH4+-N were mean of three
replicates. Error bars indicate the standard deviation of the mean of three replicates.

84
Mineralized N from greenhouse experiment, mg kg-1
40 45 50 55 60 65 70
Min
eral
ized
N fr
om la
bora
tory
incu
batio
n, m
g kg
-1
20
30
40
50
60
70
80
Leaching incubationStatic cups incubation
Figure 2.3 The linear relationship between mineralized nitrogen estimated from two laboratory incubation methods to greenhouse measurements of plant nitrogen uptake.
y=1.0232x + 6.1599 R2=0.61
y=0.4296x + 15.003 R2=0.26

85
Figure 2.4 Time course of N mineralization of four depths of soils from seven locations. The cumulative N values obtained
as a sum of NO3--N and NH4
+-N were mean of three replicates. Error bars indicate the standard deviation of the mean of three replicates. Letters indicate difference in cumulative mineralized N as affected by different incubation times. Points labeled by the same letter are not significantly different (p>0.05).
PPAC
Week of incubation
0 2 4 6 8 10 12 14 160
20
40
60
80SEPAC
0 2 4 6 8 10 12 14 16
SWPAC
0 2 4 6 8 10 12 14 16
TPAC
0 2 4 6 8 10 12 14 16
NEPAC
0 2 4 6 8 10 12 14 16
DPAC
0 2 4 6 8 10 12 14 16
ACRE
0 2 4 6 8 10 12 14 16
Cum
ulat
ive
net N
min
eral
izat
ion,
mg
kg-1
0
20
40
60
80 0-15cm 15-30cm 30-45cm 45-60cm
cc
c
b
a
ab
cdd
a
b b ca
b
cd
e
a
b
c
d d
a
bb b
bc c
a
b c
d d
a
bc
cd
a a
cdc c
ab
c
d d
ab
ce
d
ab
c
dc
aa
bc
bc
a bc d
e
b b ba b
c cd
a
aa
b c bc
ab c
d d
bc bc ca
bc
d d
a a
b
c
b
b bc
a a c b bcbc b
c
a
aaa
aa
b b
a
b bc
d
a
aa
ab
a
cd
cba

86
NH4+ -N concentration, mg N kg-1Carbon content, mg C kg-1
ISNT
NH4+ -N concentration, kg ha-1
0 50 100 150 200 25010
20
30
40
50
60
70
80
Anaerobic-N
NH4+ -N concentration, mg N kg-1
0 10 20 30 40 50 60 70
CO2 flush
20 40 60 80 100 120
Labo
rato
ry m
iner
aliz
able
N, m
g kg
-1
10
20
30
40
50
60
70
80
Hot KCl-N
2 4 6 8 10 12
Figure 2.5 Correlation between nitrogen indices and mineralizable N estimated
from long-term static cups incubation.
R2=0.67
R2=0.28
R2=0.75
R2=0.61

87
NH4+ -N concentration, kg ha-1 NH4
+ -N concentration, mg N kg-1
NH4+ -N concentration, mg N kg-1Carbon content, mg C kg-1
Anaerobic-N
0 10 20 30 40 50 60 70
ISNT
0 50 100 150 200 250
Min
eral
izat
ion
rate
con
stan
t k, w
eek-
1
0.00
0.05
0.10
0.15
0.20
0.25
0.30
CO2 flush
20 40 60 80 100 1200.00
0.05
0.10
0.15
0.20
0.25
0.30Hot KCl-N
2 4 6 8 10 12
Figure 2.6 Correlation between nitrogen indices and mineralization rate constant k estimated from long-term static cups incubation.
R2=0.09
R2=0.15 R2=0.06
R2=0.15

88
Laboratory mineralizable N, mg kg-1
0 40 80 120 160 200 240
Fiel
d so
il N
sup
ply
estim
ates
, kg
ha-1
0
20
40
60
80
100
120Top layer (0-15 cm)All layers (0-60 cm)
Figure 2.7 The relationship between laboratory soil N mineralization estimates and predicted soil N supply in the field. The horizontal error bars are the standard deviation of the mean of triplicate measurements of lab mineralization and the vertical error bars are the standard deviation of the mean of three years of observations in the field.
89
CHAPTER 3. CAN WE IMPROVE IN-SEASON CORN NITROGEN FERTILIZER RECOMMENDATIONS WITH A NITROGEN TRANSFORMATION AND
LOSS MODEL?
3.1 Abstract
The year to year variability in optimum fertilizer nitrogen (N) rate for corn
grown on the same field clearly indicates that weather drives soil and fertilizer N
transformations and crop N availability. To better predict in-season optimum N
rates in the field, we developed an N model that couples soil surface and
subsurface N mineralization algorithms with soil and fertilizer N transformation
and loss processes. Processes considered in the model include soil N
mineralization, nitrification, denitrification, and nitrate leaching, and the model is
driven by air temperature, soil moisture and pH, and a crop growth model.
Readily available data including soil texture, pH and organic matter, daily air
temperature and precipitation/irrigation, fertilizer N source, placement and timing,
and crop planting/emergence date are used as model inputs. Through simple
regression analyses from existing N response studies (6 site years) we found
that yearly plant N uptake simulated from this model was highly correlated to
yield data under field conditions (R2 > 0.95 for any site year, R2 > 0.80 for
combined site years). Thus, we believe that this model has the potential to
improve the prediction of optimum in-season fertilizer N rates compared to
traditional fertilizer N recommendation strategies.

90
3.2 Introduction
Nitrogen (N) fertilizer applications are critical for optimum corn yield and
profitability. Too little N results in suboptimal yield while excessive N fertilizer
applications result in significant N losses and negative environmental
consequences. Therefore, optimizing fertilizer N application rates has always
been one of the most researched topics in agricultural history. In Indiana, a yield
based fertilizer recommendation strategy had been used for decades using the
following relationship: N application rate (lb/A) = -27 + (1.36*yield potential)-N
credit, where the N credit is given based upon the previous crop (Vitosh et al.,
1995). A 27 lb /acre credit was given for soil N supply. However, numerous
studies have shown that fertilizer N requirement is poorly related to yield (Vanotti
and Bundy, 1994; Bundy and Andraski, 1995; Kachonoski et al., 1996; Mamo et
al., 2003; Lory and Scharf, 2003; Scharf et al., 2006; Bundy, 2006). As a result, a
new fertilizer N recommendation strategy was developed, and has been adopted
in several states in the Midwest (Sawyer et al., 2006). Without considering the
yield goal of the crops, this new approach generates fertilizer N
recommendations based on the results of numerous N response trials conducted
on different soils. This approach requires yield data from many N response trials
and many site-years. While this approach is conclusive based on past field
results it may not be useful to predict the optimum N rate for the upcoming
growing season due to large year to year variations in optimum N rate for corn
grown on the same field due to variable weather factors (temperature,
precipitation, etc.). Weather variables play an important role in regulating N
dynamics in the soil-water-plant system. In addition, this approach only
generates N recommendations for optimum management scenarios where most
of the N is applied as a sidedress application when corn is near the V6 growth
stage. Thus, the development of a N simulation model which is driven by weather
factors and integrates various transformation and loss processes of soil and
fertilizer N could lead to a better understanding of N dynamics in agricultural
ecosystems and improve the prediction of optimum in-season fertilizer N rates

91
compared to the fertilizer N recommendation strategies currently used in the
cornbelt of the Midwestern US.
Numerous models that simulate soil N transformations and transport have
been developed. However, most of them models one single N transformation or
transport process. For example, N mineralization under field conditions has been
simulated through a modeling approach that considers field fluctuations in
temperature and moisture (Cameron and Kowalenko, 1976; Myers et al., 1982;
Antonopoulos, 1999). Parton et al. (1996) developed a model to simulate the
production of nitrogen (N2) and nitrous oxide (N2O) from nitrification and
denitrification. They found that N2O fluxes from both mechanisms are a function
of soil temperature, soil pH, and soil water-filled pore space. Good agreement
between simulated and measured data was observed in this study with r2 greater
than 0.62. Johnsson et al. (1991), developed a denitrification model that included
a field potential denitrification rate and functions for the effect of soil aeration
status, soil temperature, and soil NO3--N content. The denitrification rates
simulated by this model were within 20% of the mean of the measured values for
two seasons. For ammonia (NH3) volatilization, some models simulate NH3
volatilization by dealing with the transformations between different species of
ammoniacal N in the soil, as well as the movement of ammoniacal N and water
within the soil profile and between the soil surface and the atmosphere
(Rachhpal-Singh and Nye, 1986; Kirk and Nye, 1991; Genermont and Cellier,
1997). Sogaard et al. (2002) described the volatilization process by a Michaelis-
Menten-type equation, with the volatilization loss rate as a function of various
factors that significantly affect volatilization, including soil water content, air
temperature, wind speed, fertilizer type, application method, and rate, etc.
In addition, there are some models that integrate various N transformation
and transport processes to simulate different mineral-N dynamics. For example,
a model named SOILN was developed for the simulation of soil N dynamics, in
which processes such as plant uptake, mineralization/immobilization, nitrification,

92
denitrification, and leaching are considered (Bergstrom et al., 1991). However,
the results showed the simulated N-uptake tended to overestimate the field
measurements for some site-years. Another model, the Danish simulation model
DAISY, simulated soil N dynamics and biomass production by considering a
number of modules including a hydrological model for soil water dynamics, a soil
temperature model, a soil N model, and a crop model for crop N uptake (Hansen
et al., 1991). The model failed to accurately estimate the amount of N in the soil-
plant system in heavily fertilized treatments due to the underestimation of the
denitrification rate. Another N simulation model, DRAINMOD−N II, was
developed to model different N transformation and transport processes including
atmospheric deposition, application of mineral N fertilizers including urea and
anhydrous ammonia, soil amendment with organic N sources including plant
residues and animal waste, plant uptake, organic C decomposition and
associated N mineralization/immobilization, nitrification, denitrification, NH3
volatilization, and N losses via subsurface drainage and surface runoff (Youssef
et al., 2005). Although some studies have tested this model and found this model
showed promise in predicting N losses from drained agricultural lands (Youssef
et al., 2006; Slazar et al., 2009; Thorp et al., 2009), no research was reported on
the use of this model to predict soil available N or to relate the model-simulated
results to crop production.
Our model, driven by environmental factors including temperature, soil
moisture and pH, etc., couples soil surface and subsurface N mineralization
algorithms with soil and fertilizer N transformation and loss processes and crop N
uptake to improve the prediction of optimum in-season fertilizer N rates. Currently,
processes considered in the model include soil N mineralization, nitrification,
denitrification, and nitrate leaching.

93
3.3 Model Description
3.3.1 Estimation of Soil Moisture and Temperature
In the first step, soil temperature and moisture are simulated, and then the
outputs are utilized as driving factors for the N model. Soil temperature is
estimated from the 7 day running average air temperature. However, time lags
and damping effects with depth are not yet accounted for, which may result in the
overestimation of the topsoil temperature and underestimation of the subsoil
temperature. Soil moisture content is estimated from irrigation scheduling
software (www.purdue.edu/agsoftware/irrigation), which is based on FAO
irrigation and drainage paper No. 56: Crop Evapotranspiration (Allen et al. 1998).
Precipitation, evapotranspiration, crop water uptake, and contribution from prior
irrigation events are included in the soil moisture model. The evapotranspiration
rate is determined based on the Penman-Monteith equation.
3.3.2 Soil Nitrogen Transformation and Loss Processes
Nitrogen transformation and loss processes considered in the model include
soil N mineralization, nitrification, denitrification, nitrate leaching and so on
(Figure 3.1). This daily time step model currently calculates crop N uptake and N
transformations and losses as follows:
1. Determine amount of organic N that will mineralize;
2. Determine applied fertilizer ammonium (NH4+) and nitrate (NO3
-) N;
3. Determine amount of NH4+-N converted to NO3
--N;
4. Determine amount of N taken up by crop;
5. Determine amount of NO3--N lost due to denitrification;
6. Determine amount of NO3--N lost through leaching.

94
3.3.2.1 Mineralization
Nitrogen released through mineralization is able to provide 20 to 80% of the
N required by crops (Broadbent, 1984). Accurate prediction of soil N
mineralization is crucial for developing accurate N fertilizer recommendations.
To simulate N mineralization, first-order kinetic models are often used to
quantify the process (Sanford and Smith, 1972; Cameron and Kowalenko, 1976),
where the mineralization rate is proportional to the amount of potentially
mineralizable soil N, and is defined by the equation:
𝑑𝑁𝑑𝑡
= −𝑘𝑁0
where N0 is the amount of soil mineralizable N and k is the mineralization rate
constant. This equation can also be expressed as:
Nm = N0 (1-exp (-kt))
where Nm is cumulative net N mineralization at time t, N0 is the potentially
mineralizable soil N, and k is the first order rate constant. Potentially
mineralizable soil N is the fraction of organic N in the soil which is readily
mineralized. Ros et al. (2011) indicated that the size of soil organic matter pools
and fractions is the primary factor that controls soil N mineralization potential. So
in our model, the mineralization potential is a function of soil organic matter
content.
To incorporate weather factors into the equation, the mineralization rate
constant k is adjusted by soil temperature and moisture factors, and based on a
model presented by Antonopoulos (1999) the equation is expressed as:
k1=ketew

95
where et is a temperature factor, and ew represents the effect of water content.
Johnsson et al. (1987) suggested to the use the Q10 relationship to define the
effect of temperature on soil mineralization as follows:
et=Q10 (T1-T2)/10
where T1 is the soil temperature, T2 is the incubation temperature at which et
equals to 1, and Q10 represents the changes in rate when temperature is
changed 10 degrees. Q10 of N mineralization is approximately 2 (Stanford et al.,
1973; Kladivko, and Keeney, 1987) in the temperature range of 5 to 35 °C. The
soil moisture factor ew is a function of the soil water filled pore space (WFPS)
(Antonopoulos, 1999).
ew=(1/θ-1/θw)/(1/θlo-1/θw) when θ<θlo;
ew=1 when θlo≤θ≤θho;
ew=0.6 + (1-0.6)(1/θs-1/θ)/(1/θs-1/θho) when θ>θho;
where θs, θho, θlo, and θw are WFPS at saturation, WFPS=0.6, WFPS=0.5, and
WFPS at wilting point, respectively.
3.3.2.2 Nitrification
Nitrification is a process through which NH4+ is oxidized by
chemoautotrophic bacteria, and converted to NO2-, and eventually to NO3
- (Foth
and Ellis, 1996). Two steps are involved in this process. The first step is to
oxidize the NH4+ to NO2
- as follow:
2 NH4+ + 3O2 = 2 NO2
- +2H2O + 4H+
Bacteria of the genus Nitrosomonas and several other bacteria are responsible
for this conversion. This step produces protons and is considered a natural soil
acidification process. The second step is conversion from NO2- to NO3
- by
Nitrobacter as follows:

96
2NO2- + O2 = 2NO3
-
Nitrification can be calculated by:
𝑁𝑛𝑖𝑡𝑟𝑖𝑓𝑖𝑐𝑎𝑡𝑖𝑜𝑛 = 𝑘𝑒𝑡𝑒𝑚𝑒𝑝𝐻eNH4
in which k is the potential nitrification rate (μg N g-1soil day-1) and et, em, epH, and
eNH4 are response functions accounting for the effects of soil temperature, soil
water content, soil pH and initial NH4+ content, respectively.
Generally, nitrification rate increases with temperature from 0 to 30 °C. The
activities of nitrifying bacteria cease below 0 °C (Sabey et al., 1959; Malhi and
McGill, 1981) and perform very slowly when the soil temperature is below 5 °C
(Brady and Weil, 2008). The optimum temperature for nitrification is generally
between 20 to 30 °C (Brady and Weil, 2008). The temperature effect can be
expressed as following algorithm:
et = −0.06 + 0.13e0.07∗T (Parton et al., 1996)
The optimum soil moisture content for nitrifying bacteria is about the same
as the most favorable moisture for plant growth, which is about 60% WFPS
(Brady and Weil, 2008). However, the optimum moisture for nitrification differs
slightly with soil texture (Parton et al., 1996). Below the optimum soil moisture,
nitrification rate declines as soil moisture decreases (Malhi and McGill, 1982;
Gilmour, 1984; Parton et al., 1996). When soil is too wet, due to the shortage of
O2 in the soil system, nitrification is not appreciable (Miller and Johnson, 1964;
Malhi and McGill, 1982). Parton et al. (1996) used following algorithm to model
the effect of moisture on nitrification:
𝑒𝑚 = (𝜃 − 𝑏𝑎 − 𝑏
)𝑑�𝑏−𝑎𝑎−𝑐� �
𝜃 − 𝑐𝑎 − 𝑐
�𝑑
Θ is the actual value of soil WFPS. For sandy soil, the estimated values of a, b, c,
and d are 0.55, 1.70, -0.007, and 3.22, respectively, while for medium-textured

97
soils, the estimated values of a, b, c, and d are 0.60, 1.27, 0.0012, and 2.84,
respectively.
The effect of soil pH on nitrification rate is significant. Nitrification generally
increased with soil pH over the range of 4.9 to 7.2 (Gilmour, 1984). Dancer et al.
(1973) reported that nitrification rates were similar for pH from 5.3 to 6.6, but
were substantially less at pH 4.7. Besides temperature, moisture, and soil pH,
the abundance of NH4+ present in the soil also plays an important role in the
activity of nitrifying microorganisms. Malhi and McGill (1982) indicated that an
increase in nitrification rate was observed when NH4+-N concentration increased
from 50 to 200 µg∙g-1 soil, but nitrification rate decreased when the NH4+-N
content was up to 300 µg·g-1 soil due to the combined effect of low pH and high
salt content. The algorithms for pH and NH4+-N content effects are described as:
𝑒𝑝𝐻 = 0.56 + 𝑎𝑟𝑐 tan (𝑝𝑖∗0.45∗(−5+𝑝𝐻)𝑝𝑖
(Parton et al., 1996)
𝑒𝑁𝐻4 = 1 − 𝑒−0.0105∗𝑁𝐻4 (Parton et al., 1996)
3.3.2.3 Denitrification
Denitrification is the process of reducing NO3- to gaseous forms such as
nitric oxide (NO), nitrous oxide (N2O), and nitrogen gas (N2). This process occurs
under an anaerobic environment, where bacteria use NO3- as a terminal electron
acceptor in respiration in the absence of O2. Denitrification is favored in
anaerobic, warm, near-neutral soils containing adequate carbon and substrate
sources (Keeney, 1980).
Denitrification can be calculated from an equation presented by Johnsson et
al. (1991):
𝑁𝑑𝑒𝑛𝑖𝑡𝑟𝑖𝑓𝑖𝑐𝑎𝑡𝑖𝑜𝑛 = 𝑘𝑒𝑡𝑒𝑚𝑒𝑁𝑂3

98
Where k is a potential rate (μg N g-1soil day-1) and et, em, and eNO3 are response
functions based on the effects of soil temperature, soil water content and NO3--N
content, respectively.
The effect of temperature on denitrification rates follows the Arhenius
equation:
et=Q10 (T1-T2)/10
where T1 is the soil temperature, T2 is the temperature at which et equals 1, and
Q10 represents the changes in rate when temperature is changed 10 degrees.
Q10 is approximately 3 (Johnsson et al., 1991) when the temperature is above
5 °C.
The moisture effect on denitrification rates is highly dependent on a critical
soil moisture threshold value. Above this value, denitrification rates increased
sharply with increased soil moisture content. Below that, soil moisture content
appeared not to be the predominant control factor (Pilot and Patrick, 1972;
Klemedtsson et al., 1991). Such moisture effects can be described as:
𝑒𝑚 = (𝜃 − 𝜃𝑑𝜃𝑠 − 𝜃𝑑
)2
where Θd is a threshold point of soil water content with a value of approximately
60% water-filled pore space (Johnsson et al., 1991). The soil water threshold
point differs with soil texture (Barton et al., 1999). Generally, greater threshold
soil moisture content is observed in coarse-textured soils than in fine-textured
soils with reported values of 74% to 83% WFPS for sandy and sandy loam soils,
62% to 83% WFPS for loam soils, and 50% to 74% for clay loam soils. em
increases from the threshold point and reaches maximum at saturation (θs).

99
Denitrification is favored when there are adequate substrate sources
(Keeney, 1980). So the effect of NO3- concentration in the soil is also considered
in our model.
eNO3 =CNO3
CNO3 + Cs
In this equation, the half-saturation constant, Cs, is the concentration of NO3- at
which the reduction factor eNO3 is 50% of maximum. The estimated half-
saturation constant is 2.45 μg N g-1soil (Klemedtsson et al., 1991).
3.3.2.4 Crop Nitrogen Uptake
Simulation of crop N uptake is based on the thermal unit concept that crop
growth can be described as a temperature sum (growing degree days).
Calculation of the growing degree days (GDD) using the modified formula
suggested by the National Oceanic and Atmospheric Administration in 1971, and
the temperature limit for corn growth is not lower than 10 ˚C or higher than 30 ˚C.
Four or more crop specific N uptake rates are utilized according to crop
development and the length of the growing season (Table 3.1). Both NO3--N and
NH4+-N are assumed equally available for crop uptake. When the amount of
mineral N present in the soil is insufficient to satisfy the crop demands, the actual
crop N uptake is the available mineral N content in the soil.
3.3.2.5 Nitrate Leaching
Nitrate leaching is calculated based on water flow and NO3--N concentration
in each soil layer. For a given layer with water outflow to the layer below, NO3--N
amount is reduced proportionately, while for each layer with water inflow from
layers above, water’s NO3--N is added to its NO3
--N amount. New NO3--N
concentration is then recalculated for each soil layer.

100
3.4 Model Application
3.4.1 Field Site
The experimental field was located at Purdue University's Agronomy Center
for Research and Education (ACRE) in West Lafayette, Indiana. The climate in
the region is temperate and humid with an average annual precipitation of about
889 mm and an average annual temperature of about 10.6 °C. The parent
material in this area consists of loess deposits and underlying till. The soil
taxonomic class is Typic Endoaquolls, characterized as a poorly drained soil with
silty clay loam texture and high in organic matter content. The top surface soil (0-
30 cm) has about 35% clay, 3.6% organic matter, and a pH of 6.5-7.6, while in
the subsurface soil (30-60 cm) organic matter content decreased by
approximately 1%. The cropping system was corn-soybean rotation. In each
year, 28 kg ha-1 N was applied as a starter fertilizer at planting, with 0, 45, 90,
134, 179, or 224 kg ha-1 sidedressed in early June as urea ammonium nitrate
(UAN). The yield data were obtained in this field experiment from 2006 to 2011
for all N treatments. These data were used to validate the N simulation model.
3.4.2 Input Data
The input data used in this model (Table 3.1) include soil texture with depth,
and soil pH and organic matter (OM), and daily high and low air temperature, and
precipitation/irrigation as well as fertilizer N source, placement and timing, and
crop planting/emergence date, while humidity and wind speed are optional. Soil
and weather data can be obtained based on location. Weather data can be
imported from web services such as U.S. National Weather Service Forecast,
and iMETOS ag Weather Station Data.
3.4.3 Simulation Results and Discussion
The NH4+-N and NO3
--N pools as well as cumulative mineralized N,
cumulative crop N uptake, cumulative denitrified N, and cumulative leached N
are simulated through the model. In Figure 3.2, an example of model output

101
showed simulated soil N accumulation and loss and crop N uptake resulted from
an application of a total of 252 kg ha-1 fertilizer N (as UAN) in 2008 at ACRE. The
peak of the NH4+-N happened early in May from the application of fertilizer N.
After that, the NH4+-N content in the soil slowly decreased, and converted to NO3
-
-N through nitrification indicated by a gradual increase in NO3--N concentration in
soil. The simulated N mineralization rate did not elevate until late March because
of the low temperature during winter time (<10 °C), and it reached the soil
mineralization potential late in September with a value of 173 kg N ha-1. This field
received totally 1090 mm of rain from October 2007 to October 2008. The model
estimates that these rainfall events resulted in a loss of 39 kg ha-1 N through
leaching and the high soil moisture content resulted from the rainfall events
caused loss of 29 kg ha-1 N through denitrification. Excess NO3--N was predicted
at the end of the growing season which may be lost through leaching in the
coming year. Together leaching loss, denitrification loss, as well as the excess
NO3- in the soil, the total simulated N loss was as high as 112 kg ha-1 resulted
from application of 252 kg ha-1 fertilizer N. The model predicted 313 kg ha-1 N
was taken up by plants.
Table 3.2 shows a summary of model-simulated NO3--N, NH4
+-N, cumulative
denitrified N, cumulative leached N, cumulative mineralized N, and cumulative
crop N uptake at various fertilization rates from 2006 to 2011 at ACRE. In the
table, it indicates that the NH4+-N estimated by the model generally decreases
with the increasing fertilizer application rates, but the concentration of the NH4+-N
left in the soil at the end of the growing season is very low. Excessive amounts of
NO3--N are only predicted when fertilizer rate is higher than 208 kg ha-1. In 2006,
the model estimates the NO3--N left in the soil at the end of the growing season is
as high as 56 kg ha-1. In this case, high amounts of NO3--N will be detected in the
tile drainage if there are rainfall events during the winter or early spring.
Otherwise, in arid areas, the excess NO3--N left in the soil can also be available
for the growth of crops in the coming growing season.

102
The model estimates the accumulative denitrified N generally increases with
the increasing fertilizer application rates (Table 3.2). The N loss through
denitrification and leaching are also highly dependent on rainfall in that year. For
example, in both 2009 and 2011, 28 kg ha-1 N was applied at planting, with 179
kg ha-1 sidedressed in early June. In 2011 the field received over 76 mm of rain
on June 20th and another 51 mm on July 1st. These rainfall events resulted in
rapid losses of over 34 kg ha-1 N due to leaching based on the estimation of the
model. The total simulated N loss through denitrification and leaching was 123 kg
ha-1 in 2011. In 2009, the field received a 66 mm rain on June 1st, but this
occurred prior to sidedressing. So the model estimates 75 kg ha-1 N lost through
denitrification and leaching in 2009. Less N loss results in higher crop N uptake.
The model’s estimate of crop N uptake is 304 kg ha-1 in 2009 and only 258 kg ha-
1 in 2011, while the field-measured grain yield was 14 Mg ha-1 in 2009 and 12 Mg
ha-1 in 2011.
The relationship between modeled corn N uptake and measured corn grain
yield was strong (R2 > 0.8) across 6 years (Figure 3.4). For each individual site
year, the R2 value was greater than 0.97 (Figure 3.3). Additionally, the
relationships between the simulated corn N uptake and measured corn grain
yield were nearly linear with the coefficient for the quadratic term in the equations
lower than 0.0004.
3.5 Conclusion
In general, the strong correlation between the model-simulated N uptake and
field-measured crop yield validated the performance of this N transformation and
loss model. Thus, we believe this N model has the potential to improve the
prediction of optimum in-season fertilizer N rates compared to traditional fertilizer
N recommendation strategies. However, more work still has to be done to

103
improve and further validate this model under different soil, weather, and
management conditions.
Further programming is underway to i) incorporate NH3 volatilization and
manure N mineralization into the model, ii) calculate net rainfall infiltration based
on variations in topography and soils, iii) test the model across different soil and
climatic conditions and iv) add more crops (corn and winter wheat are the only
crops currently programmed).

104
3.6 Reference
Allen, R. G., L.S. Pereira, D. Raes, and M. Smith. 1998. Crop evapotranspiration:
guidelines for computing crop water requirements. FAO Irrigation and
Drainage Paper No. 56. Rome, Italy.
Antonopoulos, A.Z. 1999. Comparison of different models to simulate soil
temperature and moisture effects on nitrogen mineralization in the soil. J.
Plant Nutr. Soil Sci. 162: 667-675.
Barton, L., C.D.A. McLay, L.A. Schipper, and C.T. Smith. 1999. Annual
denitrification rates in agricultural and forest soils: a review. Aust. J. Soil Res.
37: 1073-1093.
Bergstrom, L., H. Johnsson, and G. Torstensson. 1991. Simulation of soil
nitrogen dynamics using the SOILN model. Fert. Res. 27: 181-188.
Brady, N.C., and R.R. Weil. 2008. Nitrogen and sulfur economy of soils. p. 543-
593. In Brady, N.C., and R.R. Weil (ed.) The nature and properties of soils.
Prentice Hall, New Jersey.
Broadbent, F.F. 1984. Plant use of soil nitrogen. p. 171-182. In R.D. Haulk (ed.)
Nitrogen in crop production. ASA, CSSA, and SSSA, Madison WI.
Bundy, L.G., and T.W. Andraski. 1995. Soil yield potential effects on performance
of soil nitrate tests. J. Product. Agric. 8: 561-568.
Cameron, D.R., and C.G. Kowalenko. 1976. Modeling nitrogen processes in soil:
mathematical development and relationships. Can. J. Soil Sci. 56: 71-78.
Dancer, W.S., L.A. Peterson, and G. Chesters. 1973. Ammonification and
nitrification of nitrogen as influenced by soil pH and previous N treatments.
Soil Sci. Soc. Am. J. 37: 67–69.
105
Das, B.S., G.J. Kluitenberg, and G.M. Pierzynski. 1995. Temperature
dependence of nitrogen mineralization rate constant: A theoretical approach.
Soil Sci. 159: 294-300.
Foth, H.D., and B.G. Ellis. 1996. Soil fertility. p. 115-144. 2nd edition. CRC Press,
Boca Raton, FL.
Genermont, S., and P. Cellier. 1997. A mechanistic model for estimating
ammonia volatilization from slurry applied to bare soil. Agric. For. Meteorol.
88: 145-167.
Gilmour, J.T. 1984. The effects of soil properties on nitrification and nitrification
inhibition. Soil Sci. Soc. Am. J. 48: 1262-1266.
Hansen, S., H.E. Jensen, N.E. Nielsen, and H. Svendsen. 1991. Simulation of
nitrogen dynamics and biomass production in winter wheat using the Danish
simulation model DAISY. Fert. Res. 27: 245-259.
Johnsson Holger, Leif Klemedtsson, Asa Nilsson, and B.H. Svensson. 1991.
Simulation of field scale denitrification losses from soils under grass ley and
barley. Plant and Soil 138: 287-302.
Kachonoski, R.G., G.L. Fairchild, and E.G. Beauchamp. 1996. Yield indices for
corn response to applied fertilizer: application in site-specific crop
management. In: Robert, P.C., R.H. Rust, and W.E. Larson (ed.). Third
International Conference on Precision Agriculture. Precision Agriculture,
425-432. Madison, WI, ASA, CSSA, and SSSA.
Keeney, D.R. 1980. Nitrogen availability indexes. In: R.H. Miller (ed.) Methods of
soil analysis (rev). Part 3. Microbiological properties. Am. Soc. Agron. Inc,
Madison, WI.

106
Kirk, G.J.D., and P.H. Nye. 1991. A model of ammonia volatilization from applied
urea. V. The effects of steady-state drainage and evaporation. J. Soil Sci. 42:
103-113.
Kladivko, E.J., and D.R. Keeney. 1987. Soil nitrogen mineralization as affected
by water and temperature interactions. Biol. Fertil. Soils 5: 248-252.
Klemedtsson, L., S. Simkins, B.H. Svensson, H. Johnsson, and T. Rosswall.
1991. Soil denitrification in three cropping systems characterized by
differences in nitrogen and carbon supply. Plant Soil 138: 273-286.
Lory, J.A., and P.C. Scharf. 2003. Yield goal versus delta yield for predicting
fertilizer nitrogen need in corn. Agron. J. 95: 994-999.
Malhi, S.S., and W.B. McGill. 1982. Nitrification in three Alberta soils: effect of
temperature, moisture and substrate concentration. Soil Biol. Biochem. 14:
393-399.
Mamo, M., G.L. Malzer, D.J. Mulla, D.R. Huggins, and J. Strock. 2003. Spatial
and temporal variation in economically optimum nitrogen rate for corn. Agron.
J. 95: 958-964.
Miller, R.D., and D.D. Johnson. 1964. The effect of soil moisture tension on
carbon dioxide evolution, nitrification, and nitrogen mineralization. Soil Sci.
Soc. Am. Proc. 28: 644-647.
Myers, R.J.K., C.A. Campbell, and K.L. Weir. 1982. Quantitative relationship
between net nitrogen mineralization and moisture content of soil. Can. J. Soil
Sci. 62: 111-124.
Parton W.J., A.R. Mosier, D.S. Ojima, D.W. Valentine, D.S. Schimel, K.Weier,
and A.E. Kulmala. 1996. Generalized model for N2 and N2O production from
nitrification and denitrification. Global Biogeochemical Cycles 10: 401-412.

107
Pilot, L., and W.H. Patrick. 1972. Nitrate reduction in soils: effect of soil moisture
tension. Soil Sci. 114: 312-316.
Rachhpal-Singh, and P.H. Nye. 1986. A model of ammonia volatilization from
applied urea. I. Development of the model. J. Soil Sci. 37: 9-20.
Ros, G.H., M.C. Hanegraaf, E. Hoffland, and W.H. van Riemsdijk. 2011.
Predicting soil nitrogen mineralization: Relevance of organic matter fractions
and soil properties. Soil Biol. Biochem. 43: 1714-1722.
Sabey, B.R., L.R. Frederick, and W.V. Bartholomew. 1959. The formation of
nitrate from ammonium nitrogen in soils: III influence of temperature and
initial population of nitrifying organisms on the maximum rate and delay
period. Soil Sci. Soc. Am. Proc. 23: 462-465.
Salazar, O., I. Wesstrom, M.A. Youssef, R.W. Skaggs, and A. Joel. 2009.
Evaluation of the DRAINMOD-N II model for predicting nitrogen losses in a
loamy sand under cultivation in south-east Sweden. Agric. Water Manage.
96: 267-281.
Sawyer, J., E. Nafziger, G.W. Randall, L.G. Bundy, G. Rehm, and B.C. Joern.
2006. Concepts and rationale for regional nitrogen rate guidelines for corn.
PM2015. Iowa State Univ. Ext. Ames.
Scharf, P.C., N.R. Kitchen, K.A. Sudduth, and J.G. Davis. 2006. Spatially
variable corn yield is a weak predictor of optimal nitrogen rate. Soil Sci. Soc.
Am. J. 70: 2154-2160.
Sogaard H.T., S.G. Sommer, N.J. Hutchings, J.F.M. Huijsmans, D.W. Bussink,
and F. Nicholson. 2002. Ammonia volatilization from field-applied animal
slurry-the ALFAM model. Atmospheric Environment 36: 3309-3319.
Stanford, G., M.H. Frere, amd D.H. Schwaninger. 1973. Temperature coefficient
of soil nitrogen mineralization. Soil Sci. 115: 121-123.

108
Stanford, G., and S.J. Smith. 1972. Nitrogen minerialization potentials of soils.
Soil Sci. Soc. Am. Proc. 36: 465-472.
Thorp, K.R., M.A. Youssef, D.B. Jaynes, R.W. Malone, and L. Ma. 2009.
DRAINMOD-N II: Evaluated for an agricultural system in Iowa and compared
to RZWQM-DSSAT. Trans. ASABE 52: 1557-1573.
Vanotti, M.B., and L.G. Bundy. 1994. An alternative rationale for corn nitrogen
fertilizer recommendations. J. Product. Agric. 7: 243-248.
Vitosh, M.L., J.W. Johnson, and D.B. Mengel. 1995. The tri-state fertilizer
recommendations for corn, soybeans, wheat and alfalfa. Ext. Bull. E-2567.
Michigan State Univ., East Lansing; The Ohio State Univ., Columbus; and
Purdue Univ., West Lafayette, IN.
Youssef, M.A., R.W. Skaggs, G.M. Chescheir, and J.W. Gilliam. 2005. The
nitrogen simulation model, DRAINMOD-N II. Trans. ASAE 48: 611-626.
Youssef, M.A., R.W. Skaggs, G.M. Chescheir, and J.W. Gilliam. 2006. Field
evaluation of a model for predicting nitrogen losses from drained lands. J.
Environ. Qual. 35: 2026-2042.

109
Table 3.1 Summary of model parameter inputs.
Soil Parameter†
Depth Clay Silt H2Owp‡ AWC§ Bulk
Density OM Soil pH Ksat
in % % In/in In/in mg cm-3 % um sec-
1 13 31 59 0.23 0.19 1.4 4.5 6.7 9.17 30 34 56 0.23 0.19 1.5 2 7.2 9.17 45 19 40 0.13 0.14 1.6 0.75 7.2 9.17 60 15 40 0.11 0.14 1.8 0.75 7.9 0.92
Crop and Management Parameter Crop N Uptake Function
Crop Corn GDD-C N Uptake Rate¶
Growing Season 120 days 0-278 0.0605 Projected Yield 200 units/A 278-556 0.4234 Rooting Depth 3 feet 556-833 0.2822
Starting Residue 30% 833-1111 0.2016 1111-1389 0.1008 1389-1528 0.1008
Nitrogen Transformation Parameter
k Optimum Temp.
Threshold WFPS
Optimum WFPS Range
Day-1 ˚C cm3 cm-3 cm3 cm-3 Mineralization - 25 - 0.5-0.6
Nitrification 18% 30 - 0.6 Denitrification 7.5% 30 0.6 - † Source of soil parameter data is NRCS Soil Data Mart. ‡ Volumetric soil water content at wilting point. § Available water capacity. ¶ Crop N uptake rates are in kg ha-1 of N per centigrade growing degree. cle considered in this model.

110
Table 3.2 Nitrogen model predictions at various fertilizer nitrogen rates from 2006 to 2011 at ACRE (Unit: kg ha-1).
Year Ferti.N† Min.N† UptakeN† Denitri.N† LeachN† Nitrate† Ammonium† 2006 28 173 149 12 39 0 1 2006 73 173 196 15 34 0 1 2006 118 173 239 17 34 0 0 2006 163 173 282 20 34 0 0 2006 207 173 310 22 34 15 0 2006 252 173 310 25 34 56 0 2007 28 173 158 13 29 0 1 2007 73 173 205 16 25 0 0 2007 118 173 247 19 25 0 0 2007 163 173 291 20 25 0 0 2007 207 173 310 21 25 25 0 2007 252 173 310 22 25 68 0 2008 28 173 148 8 44 0 1 2008 73 173 195 11 40 0 0 2008 118 173 236 16 39 0 0 2008 163 173 276 21 39 0 0 2008 207 173 313 26 39 3 0 2008 252 173 313 29 39 44 0 2009 28 173 135 5 58 0 4 2009 73 173 182 9 53 0 2 2009 118 173 222 14 53 0 2 2009 163 173 263 18 53 0 2 2009 207 173 304 22 53 0 2 2009 252 173 304 27 53 41 2 2010 28 173 153 8 34 5 1 2010 73 173 194 10 36 5 1 2010 118 173 224 14 48 5 1 2010 163 173 254 22 54 5 1 2010 207 173 280 36 59 5 1 2010 252 173 303 53 64 5 1 2011 28 173 141 13 46 0 1 2011 73 173 175 17 54 0 0 2011 118 173 206 25 61 0 0 2011 163 173 233 35 67 0 0 2011 207 173 258 50 73 0 0 2011 252 173 280 66 79 0 0 †Ferti.N is fertilizer N application rate. Min.N is model predicted cumulative mineralized N. UptakeN is model simulated crop N uptake. Denitri.N is model predicted cumulative denitrified N. LeachN is model predicted total leached N. Nitrate and Ammonium are predicted NO3
--N and NH4+-N concentrations in soils
at the end of each year.

111
Figure 3.1 The N cycle considered in this model.

112
Figure 3.2 An example of model output showing soil N accumulation and loss and crop N uptake resulting from an application of 224 kg ha-1 fertilizer N (as UAN) in 2008 at ACRE.
Planting Fertilizer applied

113
Figure 3.3 Relationship between model-simulated corn N uptake and measured corn grain yield for each individual site year.

114
Figure 3.4 Relationship between model-simulated corn N uptake and measured corn grain yield (A) and relative corn grain yield (B) across 2006 to 2011.

115
CHAPTER 4. POTASSIUM IN SOILS: A LITERATURE REVIEW
Introduction 4.1
Potassium (K) is an essential element for the growth and development of all
plants. After nitrogen (N) and phosphorus (P), K is the third nutrient most likely to
limit crop productivity. Plants take up K in its ionic form (K+) and it is not
incorporated into the structure of organic compounds, but remains in the ionic
form in solution in the cells. In addition to serving as an osmotic regulator, K+ is
an activator for over 80 different enzymes which are responsible for various
metabolic processes including protein formation, energy metabolism, sugar
degradation and so on (Brady and Weil, 2008).
Potassium is the seventh most abundant element and accounts for 2.6% of
the earth’ crust. The average total K content in the plow layer is approximately
0.83%, or 15,000 kg ha-1(Foth and Ellis, 1996). Most commercial crops require
100 to 300 kg K ha-1 for good growth (Haby et al., 1990). Therefore, when soils
have high amounts of plant-available K, the requirement for K fertilizer is low or
nonexistent. However, good K nutrition is critical to increase plants’ adaptability
to environmental stresses and to improve the quality of flowers, fruits, and
vegetables.
Due to the increasing recognition of the importance of K, extensive research
has been carried out worldwide to investigate soil K availability to plants and
numerous comprehensive literature reviews have summarized K chemistry in
soils (Martin and Sparks, 1985; Sparks and Huang, 1985; Sparks, 1987; Kirkman
et al., 1994).

116
Forms of Potassium 4.2
Potassium exists in soil in four forms: structural K, nonexchangeable K,
exchangeable K, and solution K. Although these four forms can be measured
separately with different analytical techniques, they are not clearly defined in the
soil.
Structural Potassium 4.2.1
Structural or mineral K is defined as K that is bonded within the crystalline
structure of K-bearing minerals. The mineral K content of soils depends on the
structure and composition of parent rocks (Malavato, 1985; Sparks and Huang,
1985). Generally, igneous rocks have greater mineral K contents than
sedimentary rocks. Among igneous rocks, the early formed basalts have mineral
K contents of approximately 7 g K kg-1, while later-formed igneous rocks such as
micas and K-feldspars are the primary sources of K-bearing minerals with more
than 70 g K kg-1 (Malavato, 1985). The mineral K content of sedimentary rocks
also varies, from approximately 6 g K kg-1 in limestone to about 30 g K kg-1 in
clayey shale (Malavato, 1985).
Indiana soils are developed under different parent materials, so the K
content varies according to the nature of the parent rocks. The northern area of
Indiana, affected by either the Wisconsin or Illinois glaciation, has high amounts
of micaceaous clay minerals. However, in the southern area of Indiana, the
parent rocks are mainly limestone and sandstone, and therefore have lower K
contents in the soil.
Nonexchangeable Potassium 4.2.2
Nonexchangeable K, often referred to as fixed K or interlayer K, is held
between the layers of micaceous clay minerals. Although nonexchangeable K is
not immediately accessible for plant uptake, it is still considered as the main K
reserve of the soil, because nonexchangeable K can become an important K

117
source for crop nutrition when exchangeable and solution K are depleted by crop
uptake or leaching.
The amount of nonexchangeable K in soil is influenced by the types and
quantities of clay minerals, particle size, and fixation or release of K in the
minerals (Kirkman et al., 1994). Clay type is considered the dominant factor
affecting the nonexchangeable K content in the soil. Generally, micas and
vermiculites contain greater amounts of nonexchangeable K than kaolinites and
smectites (Arifin et al., 1973; Shaviv et al., 1985; Goli-Kalanpa et al., 2008). A
significant positive relationship between nonexchangeable K and illite content
was found by Rezapour et al. (2009). Particle size also has an impact on
nonexchangeable K content (MacLean and Brydon, 1963; Munn et al., 1976).
The average amount of nonexchangeable K in the clay fraction can be 16 times
greater than in the silt or sand fractions (Al-Kanani et al., 1984). Thus, most K
fixation studies have focused on the clay fraction. However, Murashkina et al.
(2007) argued in their study that the silt fraction could also dominate fixation of
added K.
Exchangeable Potassium 4.2.3
Exchangeable K is held by electrostatic bonds at the edge and surface
positions of clay minerals as well as humus colloids. The exchange sites on clay
minerals resulting from isomorphic substitution are relatively constant. Due to the
protonation or deprotonation of reactive functional groups such as phenols and
carboxylic acids, the negative charges on humus colloids are pH dependent.
Exchangeable K is closely related to soil cation exchange capacity (CEC)
with a range of 10 to 400 mg K kg-1 (Kirkman et al., 1994). Soils with large
amounts of vermiculite or mica, and high organic matter content are generally
high in exchangeable K content.

118
Solution Potassium 4.2.4
Solution K is the form that can be readily used by plants or leached. Solution
K level is low (3 to 170 μg mL-1) when compared to soil total K (Kover and Barber,
1990; Brouder et al., 2003) and it is also subject to leaching. In many soils,
solution K content is not sufficient for plants to grow. However, solution K can be
replenished from exchangeable and nonexchangeable K forms. The release of K
to the surrounding soil water is characterized as a rapid release from the
exchange sites followed by a slow release from the edge and interlayer (Dihillon
and Dhillon, 1990; Jalali, 2006). Cox and Joern (1997) found that
nonexchangeable K release by NaBPh4 occurred in 96 h. Martin and Sparks
(1983) reported that, when equilibrated with H-saturated resin, K release from
soils was complete in about 40 days.
The Potassium Cycle 4.3
The amount of K present in each form at a given period of time is not fixed.
Changes among K forms occur with plant uptake, fertilizer addition, leaching
losses, release/fixation processes and so on. However, only solution K is readily
available for plant uptake. Thus, many studies have investigated the
transformation processes that determine K availability to plants.
Weathering/Formation 4.3.1
Mineral K is the primary form of K occurring in the soil and is not instantly
available for plant uptake. Release of K from these parent rocks follows the
process of weathering. The weathering process is influenced by the composition
and structure of the primary minerals, particle size distribution, environmental
factors, biological activity, etc. (Sparks and Huang, 1985). For example, biotites
weather easily, while feldspars weather slowly (Kirkman et al., 1994). The K
release rate from larger particles is greater than from smaller particles unless at
later stages of K depletion or from clay-size micas (Sparks and Huang, 1985).

119
Both high temperature and biological activity increase K release rate (Sparks and
Huang, 1985).
The general weathering sequence of K-bearing minerals is that mica
weathers to illite (hydrous mica), and eventually vermiculite or smectite. Along
this weathering sequence, water content, specific surface area and cation
exchange capacity increase, while K content decreases from approximately 10%
to less than 1% in these minerals (Kirkman et al., 1994). Potassium releases
from the mineral crystalline structure into the surrounding soil water.
Release/Fixation 4.3.2
Potassium ions can be entrapped in the ditrigonal cavities of the facing
interlayer oxygens between the unit cells of 2:1 layer silicates due to the
geometry of the fixation sites and the size of K+ ions. This fixation can decrease
the amount of K immediate availability to the plants. However, it is not permanent,
because interlayer K release occurs when exchangeable K and solution K are
depleted by crop uptake or leaching.
The release or fixation of K is a complex process, and its mechanism is not
well understood. According to Steffen and Sparks (1997), factors that affect
fixation and release of soil K include the type of clay, the occurrence of
wetting/drying and freezing/thawing, and factors that can affect solution K levels
such as fertilizer input, plant uptake, and leaching loss.
Type of Clay 4.3.2.1
The type of clay mineral is considered to be the dominant factor that
determines the extent of K fixation. Many researchers have indicated that soils
with more illites and vermiculites have greater K fixation capacity (Arifin et al.,
1973; Shaviv et al., 1985; Goli-Kalanpa et al., 2008). Goli-Kalanpa et al. (2008)
found that in soils with large amounts of smectites, a greater quantity of added K
remained in solution. Sorption of K+ by vermiculite causes the collapse in the

120
alternate layers and results in the formation of regularly interstratified mica-
vermiculite layers (Sawhney, 1971). Interstratification in clay minerals is known
as more than one kind of layer silicates that stack along the direction
perpendicular to the basal plane (Sawhney, 1989). The interstratified clay
minerals are abundant in the clay and silt fraction of soils and sediments.
The kinetics of nonexchangeable K release also depends on the relative
amounts of different K-bearing minerals. The nonexchangeable K release rate
from mica and vermiculite is diffusion-controlled (Dhillon and Dhillon, 1989; Cox
and Joern, 1997; Jalali, 2006), while the K release rate from biotite fits a first-
order model or a zero-order model depending on the extraction methods (Martin
and Sparks, 1983; Dhillon and Dhillon, 1989). Additionally, the release rate of
nonexchangeable K was found to be particle size dependent (Cox and Joern,
1997).
Wetting /Drying and Freezing/Thawing Effects 4.3.2.2
Drying of soils has been found to cause both fixation and release of K. Vitko
et al. (2009) investigated the effects of different drying methods (moist, air-dry,
and oven-dry) on the soil test K (STK) level of soil samples under different K
fertilizer rate treatments. Soil samples with an initial STK level greater than 100
mg kg-1 showed a significant decrease in STK after both air- and oven-drying,
which indicated fixation of K upon drying. Jones et al. (1960) dried samples at
110°C for 24 hours, and found the amount of exchangeable K either increased or
decreased depending on the soil type. Cook and Hutcheson (1960) concluded
that drying effects on STK levels depend on the initial exchangeable K
concentrations in the soil. When the initial exchangeable K was high, fixation
occurred upon drying; while when the initial exchangeable K was low, release
was observed.
However the mechanisms driving wetting/drying effects on STK have not
been well studied. Sparks and Huang (1985) postulated that the degree of

121
rotation of soil minerals changed upon drying, which caused changes in the K-O
bond. Cook and Hutcheson (1960) found that soils with low K-supplying potential
required more heating temperature for the clay minerals to collapse, which
explained why release occurred upon drying when the initial exchangeable K was
low (Cook and Hutcheson, 1960).
Similar effects of freezing/thawing on soil exchangeable content were found
by Fine et al. (1941). They concluded that soils of low fertility that received small
amounts of K fertilizer had an increase in exchangeable K content after freezing
treatment; however, exchangeable K content decreased after the freezing
treatment in soils with a high exchangeable K level.
Soil Solution K+ and NH4+ 4.3.2.3
When the concentration of K in the soil solution increases from the addition
of fertilizer K or the release of the K from primary minerals by weathering, the
shift in equilibrium may result in the fixation of K by clay minerals. On the other
hand, when the concentration of K in soil solution decreases due to crop removal
or leaching losses, release of K occurs to balance the shift in equilibrium.
Applying N fertilizer in the ammonium (NH4+) form as salts or as anhydrous
ammonia (AA) may also affect the fixation or release of K, because NH4+ has a
similar ionic radius as K+, and can also be fixed in the interlayer region of 2:1 clay
minerals. Thus, NH4+ ions compete with K+ for specific fixation sites, as well as
block the release of K. Previous studies found that the order of fertilizer
application is important for the competition of NH4+ and K+ for similar fixation sites
(Zhang et al., 2010). If NH4+ is applied after K+, a decrease in NH4
+ fixation and a
reduction in the release of nonexchangeable K was observed (Welch and Scott,
1961; Kilic et al., 1999). However, application of NH4+ prior to or at the same time
of K+ has been shown to decrease K fixation and increase exchangeable K
concentration in the soil near the fertilizer placement site (Acquaye and Mclean,
1966; Bartlett and Simpson, 1967; Stehouwer and Johnson, 1991; Brouder and

122
Cassman, 1994; Kilic et al., 1999). The exchangeable and fixed K concentrations
in soils are also influenced by fertilizer rates. In a study by Chen and Mackenzie
(1992), combinations of four N rates (0, 1, 2, and 3 cmol N kg-1 as NH4Cl) and
four K rates (0, 1, 2, and 3 cmol K kg-1 as KCl) were added to soil samples.
Results showed K fixation was enhanced by increased K rates and decreased by
increased N rates. At greater rates of both NH4+ and K fertilizer additions, NH4
+
fixation was favored over K+. However, from a long-term standpoint, high K
fertilization rates would decrease soil fixation capacities for both NH4+ and K (Liu
et al., 1997; Zhang et al., 2007).The effect of NH4+-N fertilizer application on K
fixation and release is also influenced by soil clay content. Fine-textured soils
generally have a greater capacity to absorb NH4+ than coarse-textured soils
(Jenny et al., 1945; Martin and Chapman, 1951; Stanley and Smith, 1956).
Stehouwer and Johnson (1991) found that the effect of simultaneous injection of
AA and KCl on the distribution of exchangeable and fixed K+ was more
pronounced in a silty clay loam soil than in a silt loam soil. In the silty clay loam
soil, compared to injection of KCl alone, injection of AA + KCl significantly
increased exchangeable K+ concentration and decreased fixed K+ concentration
at the injection point, whereas in the silt loam soil, little effect of the interactions
between AA and KCl fertilizers was shown. Chen and Mackenzie (1992) also
reported variations in fixed K amounts in different soils affected by added NH4Cl
and KCl fertilizers, as the fixed proportion of added K increased with soil clay
content. In addition, the competitive fixation of NH4+ and K+ is also affected by
the dominate type of clay present in the soil. Bajwa (1987) found that
montmorillonitic clays fix more NH4+ compared to K+, while vermiculitic clays fix
both in relatively equal proportions.
Crop K Uptake 4.3.3
Crop K uptake plays an important role in K cycling because large amounts of
K are removed by crops during growth and development. In general, the amount
of K taken up by crops is second only less than N (Korb et al., 2002). For sugar

123
beets, K removal can be as high as 515 kg ha-1 (CFA, 1995). The K removal rate
varies among crops, ranging from 1.4 to 60 lb per unit of yield (Table 4.1).
However, the K concentrations in small grains are much less than that in the
straw and roots (Vitosh et al., 1995). Thus, if the crop straw and chaff are left in
the field after harvest, a large portion of K removed by the crop will be returned to
the soil for crops grown the following season.
Mass flow and diffusion are the two dominant mechanisms accounting for K
delivery to crop roots. In soils naturally high in solution K or where fertilizer K has
been applied, considerable amounts of K move to crop roots with water flow.
However, when solution K concentrations are low, mass flow contributes only
about 10% of the required K (Tisdale et al., 1993). Diffusion occurs when there is
a K concentration gradient. Although diffusion only takes place in a small
distance (1 to 4 mm) around roots or out of clay interlayers, it accounts for 88 to
96% of K absorption (Tisdale et al., 1993).
Regardless of the transportation mechanisms, K moving to crop roots
requires sufficient water (Korb et al., 2002). Therefore, moisture is one of the
most important factors that influences crop K uptake. Skogley and Haby (1981)
showed that the quantity of K absorbed by crop roots increased 175% when soil
moisture increased from 10 to 28%. However, when soil moisture is too high,
crop roots cannot function normally due to low O2 concentrations in the soil and
K uptake can be reduced by 70% (Tisdale et al., 1993). Temperature also
significantly influences K uptake due to its effects on root activity and plant
physiological processes (Korb et al., 2002). Ching and Barber (1979) reported
that total K uptake by corn was 2.6 times greater at 29 °C compared with total K
uptake at 15 °C. In the same study, root growth significantly increased with
increased temperature. Deeper rooted crops can greatly improve the turnover of
available K in the soil by removing K from the subsoil and depositing it at the
surface when roots are left in the field after harvest (Korb et al., 2002).

124
Methods of Assessing Nonexchangeable Potassium 4.4
Various methods have been used to determine the nonexchangeable K
content in soils, including boiling nitric acid (HNO3), extraction with sodium
tetraphenylboron (NaBPh4), exhaustive cropping of soil in the greenhouse.
Boiling Nitric Acid Extraction 4.4.1
The quickest and easiest way to assess nonexchangeable K is to use boiling
HNO3. This method, described by Pratt (1965), is to boil the soil in 1N HNO3 over
a flame for 10 minutes, filter the slurry, leach the soil with dilute HNO3, and
determine the K content in the filtrate. This method has been modified in several
ways based on the boiling temperature or the boiling time (Pratt and Morse, 1954;
Conyers and Mclean, 1969). However, the main problem with boiling HNO3
method is its potential to dissolve K in primary minerals, resulting in an
overestimation of available K, and also the inability of HNO3 to completely extract
interlayer K, resulting in an underestimation of nonexchangeable K.
Sodium Tetraphenylboron Extraction 4.4.2
Scott et al. (1960) developed the NaBPh4 method to extract interlayer K in
soils. The BPh4- anion combines with solution K and forms a potassium
tetraphenylboron (KBPh4) precipitate, while Na+ exchanges with interlayer K.
After the extraction period, the KBPh4 precipitate is dissolved by boiling water
and the precipitate K is recovered by using Hg2+ to destroy BPh4-. Smith and
Scott (1966) optimized this method to obtain maximum K extraction. However, it
was not suitable for routine lab measurement due to the high volatility and toxicity
of Hg. Cox et al. (1996) modified this method by using Cu2+ as a replacement for
Hg2+ to make it more suitable for routine lab work. In their research, it was found
that NaBPh4 extraction removed much more nonexchangeable K than the boiling
HNO3 method and that NaBPh4 is able to more closely simulate the release
mechanism of nonexchangeable K by plant roots.

125
Exhaustive Cropping of Soil in the Greenhouse 4.4.3
Exhaustive cropping has also been used to determine plant-available
nonexchangeable K (Pratt, 1951; Cox et al., 1999). Soils are cropped with plants
in the greenhouse and fertilized with a K-minus nutrient mixture. Cropping and
harvesting sequences are repeated until the plants become K deficient or die.
Total plant biomass and root uptake is measured along with the exchangeable K
concentration in the soils before and after cropping. The difference between
initial and final exchangeable soil K is attributed to crop K uptake, with the
balance of K removal attributed to nonexchangeable K uptake. However, to
accurately assess the quantities of nonexchangeable K uptake by plants, soil
chemical and mineralogical measurements must be performed as exchangeable
K is in dynamic equilibrium with nonexchangeable K.
Potassium Fertilizer Management 4.5
Application Rate 4.5.1
Currently, soil test-based K fertilizer recommendations are widely used.
Through a soil test, the quantity of available K level in the soil is measured. The
current soil test K level is compared with the K demands of crops to determine if
additional fertilizer input is necessary and how much K fertilizer has to be applied.
The soil test level demanded by the crop for optimum growth is termed the critical
level. Any soil test level below the critical level indicates the nutrient in the soil is
deficient for crop growth (Vitosh et al., 1995). When the soil test level is above
the critical level, addition of fertilizer may also be necessary to maintain a high
level of the nutrient content in the soil to prevent future deficiencies and to guard
against nutrient deficiencies due to suboptimal environmental factors.
Soil test critical levels are the key to K fertilizer recommendations and they
are commonly determined by long-term field studies. For Indiana, Michigan and

126
Ohio, Vitosh et al. (1995) predicted the exchangeable K soil test critical levels
(mg K kg-1 soil) through an algorithm:
K Critical level=75+2.5*CEC
Cox et al. (1999) also reported that critical levels (mg K kg-1 soil) can be well
predicted (R2=0.986) in greenhouse studies using the model:
K Critical level=34.5-3.41*Illite K++3.52*CEC,
where illite K is the nonexchangeable K concentration in the soil measured by
NaBPh4 extraction after a 7-d incubation.
Application Timing 4.5.2
Many farmers in the Midwest US apply enough K in the fall prior to planting
corn to fertilize both the upcoming corn crop and the soybean crop grown in the
following year, because application of K fertilizers once for two years of crop
production saves on application costs, reduces traffic over the field, and fits a 2-
year or 4-year soil testing cycle (PPI and PPIC, 1999). Fall application of K is
typical because of time, workload, dry soils, available fertilizers, and application
before fall tillage (Sawyer and Mallarino, 2009). For soils with high amounts of
mica and vermiculite clay minerals and greater cation exchange capacity, added
K will be bonded to the exchange sites of organic matter and clay minerals or
fixed in the interlayer of clay minerals. This K can then be released back to the
soil solution when solution K is depleted by crop uptake. Although there is a long
time between fertilizer application and crop use, added K is assumed to be
readily available for the crops to be grown next year or for multiple years.
In a corn-soybean rotation, all K fertilizers can be applied after soybean
harvest and ahead of the corn. Enough K will be returned to the soil from corn
residues for the growth of the soybean crop in the following year. Soybean
removes greater quantities of K than corn does (PPI and PPIC, 1999; Korb et al.,

127
2002; IPNI, 2010) (Table 4.1), so it may be more efficient to assess soil test K
levels after soybean harvest due to both the greater K uptake and greater
demand of K late in the growing season for soybean compared to corn. In
addition, K fertilizer application after soybean harvest and ahead of corn instead
of after corn harvest and ahead of soybean fits better into most soil testing cycles.
However, as long as enough K fertilizer is applied to maintain a high soil test K
level, application time of K fertilizer is less critical.
Concluding Remarks 4.6
In this chapter we reviewed the different forms of K in soils, the various
factors that control K dynamics among each form, as well as different
assessment methods for nonexchangeable K. The most important aspect of
nonexchangeable K is how it releases to exchangeable and solution K forms,
which are readily accessible for plant uptake. However, the release or fixation of
K is a complex process, depending on a number of factors and this mechanism is
not well understood. Thus, my research objectives were (i) to assess the effect of
AA injection on K fixation around the injection point over time; and (ii) to evaluate
the effect of different soil moisture conditions (moist, air-dry, oven-dry) on soil
test K levels.

128
Reference 4.7
Al-Kanani, T., A.F. MacKenzie, and G.J. Ross. 1984. Potassium status of some
Quebec soils: K released by nitric acid and sodium tetraphenylboron as
related to particle size and mineralogy. Can. J. Soil Sci. 64: 99-106.
Aquaye, D.K., and A.J. Maclean. 1966. Influence of form and mode of nitrogen
fertilizer application on the availability of soil and fertilizer potassium. Can. J.
Soil Sci. 46: 23-28.
Arifin, H.F. Perkins, and K.H. Tan. 1973. Potassium fixation and reconstitution of
micaceous structures in soils. Soil Sic. 116: 31-35.
Bajwa, M.I. 1987. Comparative ammonium and potassium fixation by some
wetland rice soil clays as affected by mineralogical composition and
treatment sequence. J. Agron. Crop Sci. 158: 65-68.
Bartlett, R.J., and T.J. Simpson. 1967. Interaction of ammonium and potassium
in a potassium-fixing soil. Soil Sci. Soc. Am. Proc. 31: 219-222.
Brady, N.C., and R.R. Weil. 2008. Soil Phosphorus and Potassium. p. 594-638.
In Brady, N.C., and R.R. Weil (Ed.) The nature and properties of soils.
Prentice Hall, New Jersey.
Brouder, S.M., and K.G. Cassman. 1994. Evaluation of a mechanistic model of
potassium uptake by cotton in vermiculitic soil. Soil Sci. Soc. Am. J. 58:
1174-1183.
Brouder, S.M., M. Thom, V.I. Adamchuck, and M.T. Morgan. 2003. Potential
uses of ion-selective potassium electrodes in soil fertility management.
Comm. Soil Sci. Plant Anal. 34: 2699-2726.
CFA, 1995. Western fertilizer handbook. p. 338. 8th edition. California Fertilizer
Association. Interstate Publishers, Inc. Danville, Illinois.

129
Chen, J.S., and A.F. Mackenzie. 1992. Fixed ammonium and potassium as
affected by added nitrogen and potassium in three Quebec soils. Commun.
Soil Sci. Plant Anal. 23: 1145-1159.
Ching, P.C., and S.A. Barber. 1979. Evaluation of temperature effects on
potassium uptake by corn. Agron. J. 71: 1040-1044.
Conyers, E.S., and E.O. McLean. 1969. Plant uptake and chemical extractions
for potassium release characteristics of soils. Soil Sci. Soc. Am. Proc. 33:
226-230.
Cook, M.G., and T.B. Hutcheson, Jr. 1960. Soil potassium reactions as related to
clay mineralogy of selected Kentucky soils. Soil Sci. Soc. Am. J. 24: 252-256.
Cox, A.E., and B.C. Joern. 1997. Release kinetics of nonexchangeable
potassium in soils using sodium tetraphenylboron. Soil Sci. 162: 588-598.
Cox, A.E., B.C. Joern, and C.B. Roth. 1996. Nonexchangeable ammonium and
potassium determination in soils with a modified sodium tetraphenylboron
method. Soil Sci. Soc. Am. J. 60: 114-120.
Cox, A.E., B.C. Joern, S.M. Brouder, and D. Gao. 1999. Plant-available
potassium assessment with a modified sodium tetraphenylboron method.
Soil Sci. Soc. Am. J. 63:902-911.
Dhillon, S.K., and K.S. Dhillon. 1990. Kinetics of release of nonexchangeable
potassium by cation-saturated resins from Red (Alfisols), Black (Vertisols)
and Alluvial (Inceptisols) soils of india. Geoderma 47: 283-300.
Fine, L.O., T.A. Bailey, and E. Truog. 1941. Availability of fixed potassium as
influenced by freezing and thawing. Soil Sci. Soc. Am. J. 5: 183-186.

130
Goli-Kalanpa, E., M.H. Roozitalab, and M.J. Malakouti. 2008. Potassium
availability as related to clay mineralogy and rates of potassium application.
Comm. Soil Sci. Plant Anal. 39: 2721–2733.
Haby, V.A., M.P. Russelle, and E.O. Skogley. 1990. Testing soils for potassium,
calcium, and magnesium. p. 181-227. In R.L. Westerman (ed.) Soil Testing
and Plant ananlysis, 3rd Edition. Soil Sci. Soc. Am. Book Ser. #3. Soil Sci.
Soc. Am., Madison, WI.
International Plant Nutrition Institute (IPNI). 2010. Nutrients removed in harvested
portion of crop. Http://www.ipni.net (updated 10/28/2010).
Jalali, M. 2006. Kinetics of nonexchangeable potassium release and availability
in some calcareous soils of western Iran. Geoderma 135: 63-71.
Jenney, R., A.D. Ayres, and J.S. Hosking. 1945. Comparative behavior of
ammonia and ammonium salts in soils. Hilgardia 16: 429-457.
Jones, Jr., J.B., H.J. Mederski, D.J. Hoff, and J.H. Wilson. 1961. Effect of drying
some Ohio soils upon the soil test for potassium. Soil Sci. Soc. Am. J. 25:
123-125.
Kilic, K., M.R. Derici, and K. Saltali. 1999. The ammonium fixation in great soil
groups of Tokat region and some factors affecting the fixation I. The effect of
potassium on ammonium fixation. Turk. J. Agric. For. 23: 673-678.
Kirkman, J.H., A. Basker, A. Surapaneni, and A.N. MacGregor. 1994. Potassium
in the soils of New Zealand —a review. New Zealand J. Agri. Res. 37: 207-
227.
Korb, N., C. Jones, and J. Jacobsen. 2002. Potassium cycling, testing, and
fertilizer recommendations. Montana State University Extension Service,
Publication 4449-5.

131
Kovar, J.L., and S.A. Barber. 1990. Potassium supply characteristics of thirty-
three soils as influenced by seven rates of potassium. Soil Sci. Soc. Am. J.
54: 1356-1361.
Liu, Y.J., D.A. Laird, and P. Barak. 1997. Release and fixation of ammonium and
potassium under long-term fertility management. Soil Sci. Soc. Am. J. 61:
310-314.
MacLean, A.J., and J.E. Brydon. 1963. Release and fixation of potassium in
different size fractions of some Canadian soils as related to their mineralogy.
Can. J. Soil Sci. 43: 123-134.
Malavolta, E. 1985. Potassium status of tropical and subtropical region soils. p.
163-200. In R.D. Munson (ed.) Potassium in Agriculture. Soil Sci. Soc. Am.,
Madison, WI.
Martin, J.P., and H.D. Chapman. 1951. Volatilization of ammonia from surface-
fertilized soils. Soil Sci. 71: 25-34.
Martin, H.W., and D.L. Sparks. 1983. Kinetics of nonexchangeable potassium
release from two Coastal Plain soils. Soil Sci. Soc. Am. J. 47: 883-887.
Martin, H.W., and D.L. Sparks. 1985. On the behavior of nonexchangeable
potassium in soils. Comm. Soil Sci. Plant Anal. 16: 133-162.
Munn, D.A., L.P. Wildling, and E.D. McLean. 1976. Potassium release from sand,
silt, and clay separates. Soil Sci. Soc. Am. Proc. 40: 364-366.
Murashkina, M.A., R.J. Southard, and G.S. Pettygrove. 2007. Silt and fine sand
fractions dominate K fixation in soils derived from granitic alluvium of the
San Joaquin Valley, California. Geoderma 141: 283–293.

132
Potash and Phosphate Institute (PPI), and Potash and Phosphate Institute of
Canada (PPIC). 1999. Maintaining high soil tests: a strategy for managing
risk during low crop price. Http://www.ipni.net (updated July 1999).
Pratt, P.F. 1951. Potassium removed from Iowa soils by greenhouse and
laboratory procedures. Soil Sci. 72: 107-117.
Pratt, P.F. 1965. Potassium. p. 1023-1031. In C.A. Black (ed.) Methods of soil
analysis Part 2: Chemical and Microbiological Properties. Am. Soc. Agron.,
Madison, WI.
Pratt, P.F., and H.H. Morse. 1954. Potassium release from exchangeable and
nonexchangeable forms in Ohio soils. p. 747. Ohio Agric. Exp. Sta. Res. Bull.
Reitemeier, R.T., T.C. Brown, and R.S. Holmes. 1951. Release of native and
fixed nonexchangeable potassium of soils containing hydrous mica. p. 1049.
United States Dept. Agron. Tech. Bull.
Rezapour, S., A.A. Jafarzadeh, A. Samadi, and S. Oustan. 2009. Impacts of clay
mineralogy and physiographic units on the distribution of potassium forms in
calcareous soils in Iran. Clay Minerals 44: 327–337.
Sawhney, B.L. 1972. Selective sorption and fixation of cations by clay minerals: a
review. Clays Clay Miner 20: 93-100.
Sawhney, B.L. 1989. Interstratification in layer silicates. p 789-828. In J.B. Dixon
and S.B. Weed (ed.) Minerals in soil environments. 2nd ed. SSSA Book Ser.
1. SSSA, Madison, WI.
Sawyer, J. and A.P. Mallarino. 2009. Getting ready for fall fertilization.
Http://www.agronext.iastate.edu/soilfertility/ (updated 08/23/2009).

133
Scott, A.D., R.R. Hunziker, and J.J. Hanway. 1960. Chemical extraction of
potassium from soils and micaceous minerals with solutions containing
sodium tetraphenylboron. I. Preliminary experiments. Soil Sci. Soc. Am. Proc.
24: 46-51.
Shaviv, A., M. Mohsin, P.F. Pratt, and S.V. Mattigod. 1985. Potassium fixation
characteristics of five southern California soils. Soil Sci. Soc. Am. J. 49:
1105–1109.
Skogley, E.O., and V.A. Haby. 1981. Predicting crop response on high potassium
soils of frigid temperature and ustic moisture regimes. Soil Sci. Soc. Am. J.
45: 533-536.
Smith, S.J., and A.D. Scott. 1966. Extractable potassium in Grundite illite:
Method of extraction. Soil Sci. 102: 115-122.
Sparks, D.L. 1987. Potassium dynamics in soils. Advan. Soil Sci. 6: 1-63.
Sparks, D.L., and P.M. Huang. 1985. Physical chemistry of soil potassium. p.
201-276. In R.D. Munson (ed.) Potassium in Agriculture. Am. Soc. Agron.,
Madison, WI.
Stanley, F.A., and G.E. Smith. 1956. Effect of soil moisture and depth of
application on retention of anhydrous ammonia. Soil Sci. Soc. Am. Proc. 20:
557-561.
Steffens, D., and D.L. Sparks. 1997. Kinetics of nonexchangeable ammonium
release from soils. Soil Sci. Soc. Am. J. 61: 455-462.
Stehouwer, R.C., and J.W. Johnson. 1991. Soil adsorption interactions of band-
injection anhydrous ammonia and potassium chloride fertilizers. Soil Sci.
Soc. Am. J. 55: 1374-1381.
134
Tisdale, S.L., W.L. Nelson, J.D. Beaton, and J.L. Havlin. 1993. Soil and fertilizer
potassium. p. 230-265. In Tisdale, S.L., W.L. Nelson, J.D. Beaton, and J.L.
Havlin (ed.) Soil fertility and fertilizers. 5th ed. Macmillan Publishing
Company, New York.
Vitko, L.F., C.A.M. Laboski, and T.W. Andraski. 2009. Effects of sampling time,
soil moisture content, and extractant on soil test potassium levels. p. 124-
129. North Central extension-industry soil fertility conference proceeding.
Des Moines, IA.
Vitosh, M.L., J.W. Johnson, and D.B. Mengel. 1995. The tri-state fertilizer
recommendations for corn, soybeans, wheat and alfalfa. Ext. Bull. E-2567.
Michigan State Univ., East Lansing; The Ohio State Univ., Columbus; and
Purdue Univ., West Lafayette, IN.
Welch, L.F., and A.D. Scott. 1961. Availability of nonexchangeable soil
potassium to plants as affected by added potassium and ammonium. Soil
Sci. Soc. Am. Proc. 25: 102-104.
Zhang, F., J. Niu, W. Zhang, X. Chen, C. Li, L. Yuan, and J. Xie. 2010.
Potassium nutrition of crops under varied regimes of nitrogen supply. Plant
Soil 335: 21–34.
Zhang, H., M. Xu, J. Lv, H. Liu, X. Shi, and S. Huang. 2007. Potassium fixation
and affecting factors of three typical soils under long-term potassium
fertilization in China. Sci. Agri. Si. 40: 749-756.

135
Table 4.1 The amount of potassium removed in harvest portions of selected agronomic crops†
Crop Unit of yield K2O removed per unit of yield
(lb/unit) Alfalfa ton 60 Barley‡ bushel 1.6
Corn silage ton 8.4 Soybean bushel 1.4 Wheat‡ bushel 2.0
† Adapted from Korb et al., 2002. ‡ Wheat and barley harvest include grain and straw.

136
CHAPTER 5. IMPACT OF BAND INJECTION OF ANHYDROUS AMMONIUM ON SOIL POTASSIUM CONCENTRATION
Abstract: 5.1
In most studies on competitive ammonium (NH4+) and potassium (K+)
fixation, NH4+ is applied as a salt. However, band-injection of anhydrous
ammonia (AA) has been widely used in corn production for decades. We
conducted a laboratory study to assess the effect of band-injected AA on
exchangeable and nonexchangeable K concentrations near the injection point
over time in four soils. Soils were packed in rectangular boxes with AA injected in
the center at a rate equivalent to 170 kg N ha-1. Following injection, soils were
incubated in a chamber at a moisture tension of 0.05 MPa and 22 °C.
Exchangeable and nonexchangeable K concentrations were analyzed in soil
samples collected from 7 concentric zones at various distances from the injection
point at 7, 14, and 28 days after AA injection. The effect of AA injection was
more pronounced on nonexchangeable K than on exchangeable K. In the two
soils with higher clay content and cation exchange capacity, there was a steep
gradient of decreasing nonexchangeable K content up to 4.5 cm away from the
injection point. This effect lasted through 14 days. However, in the other two soils,
AA injection did not affect exchangeable or nonexchangeable K concentrations.
Without large increase in exchangeable K concentration, the reduction in
nonexchangeable K indicated the K was fixed more deeply in the clay mineral
interlayer. This study changes our perspectives on the blocking effect of NH4+ on
K release and explains K deficiency symptoms that occasionally result following
AA injection.

137
Introduction 5.2
Potassium (K) is an essential nutrient for plant growth. After nitrogen (N) and
phosphorus, K is the third most likely nutrient to limit crop productivity. Good K
nutrition is critical to increase plants’ adaptability to environmental stresses and
to improve the quality of flowers, fruits, and vegetables. Lack of K results in
stunted crop growth, poorly developed root systems, weak stalks, as well as
severe yield loss (Brady and Weil, 2008). Due to the increasing recognition of the
importance of K, extensive research has been carried out worldwide to
investigate soil K and its availability to plants. Researchers found that K+ ions can
be trapped between the layers of 2:1 clay minerals in the soil due to the
geometric structure of the fixation sites and the size of the K+ ions. This fixation
decreases K availability for plant uptake (Martin and Sparks, 1985; Sparks and
Huang, 1985; Sparks, 1987; Kirkman et al., 1994). Although many studies on soil
K fixation have been conducted, problems associated with soil K management
have often been ignored in the last decade. This is especially true in Asian
countries where N fertilizers have been over-applied while K fertilizer application
has been ignored, resulting in a continual depletion of soil K (Zhang et al., 2010).
In addition, under organic farming practices, soils also suffer from negative K
field balances, which may deplete soil exchangeable K if K release from soil
minerals does not replace the amount of K that is harvested.
In the northern two thirds of Indiana, soil parent material was affected by
either the Wisconsin or Illinois glaciation. Soils in this area of the state have large
quantities of K-bearing micaceaous clay minerals. Many researchers have
indicated that soils with more micaceaous clay minerals have greater K fixation
capacity (Arifin et al., 1973; Shaviv et al., 1985; Goli-Kalanpa et al., 2008).
However, these soils also can release fixed K when exchangeable and solution K
are depleted by crop uptake or leaching. Therefore, understanding K fixation and
release dynamics is critical in soils with greater quantities of micaceaous clay
minerals, especially when K fertilization is less than crop K removal.

138
The release or fixation of K is a complex process affected by numerous
factors including clay type, the occurrence of wetting/drying and freezing/thawing,
fertilizer input, etc.(Steffen and Sparks, 1997). Among these factors, application
of N fertilizer in an ammonium (NH4+) form can significantly impact the K nutrition
of crops. Ammonium ions have a similar ionic radius and energy of hydration as
K+ ions, so they can also be fixed in the interlayer of 2:1 clay minerals. The
competitive relationship between NH4+ and K+ fixation has been reported in
numerous studies (Welch and Scott, 1961; Scherer, 1982; Stehouwer and
Johnson, 1991; Kilic et al., 1999; Zhang et al., 2010). Previous studies found that
the order of fertilizer application is important for the relative competition of NH4+
and K+ for fixation sites (Zhang et al., 2010). Simultaneous application of NH4+
and K+ decreased K fixation and increased exchangeable K concentration in the
soil near the fertilizer placement site (Stehouwer and Johnson, 1991; Brouder
and Cassman, 1994; Kilic et al., 1999). Potassium applied before NH4+ addition
decreased NH4+ fixation and resulted in a large reduction in the release of
nonexchangeable K (Welch and Scott, 1961; Kilic et al., 1999). However, in
these studies, both N and K fertilizers were applied. Fewer studies have been
conducted to investigate the effect of N fertilizer alone on soil K fixation.
In most studies on competitive NH4+ and K+ fixation, NH4
+ is applied as a salt.
However, band-injection of anhydrous ammonium (AA) is widely used. Research
has found that AA injection results in greater fixation of NH4+ compared with
other forms of NH4+ salt fertilizers (Young and Cattani, 1962). The injection of AA
initially increases soil pH. The charge of soils generated from the broken edges
of clay minerals or on soil organic matter is pH-dependent and increases as soil
pH increases, resulting in greater retention of NH4+ (Nommick, 1957). Additionally,
an increase in dissolved organic carbon is observed for a short time after AA
injection (Tomasiewicz and Henry, 1985; Clay et al., 1995). Organic compounds
adsorbed on the surface of clay minerals have been shown to have a blocking
effect on NH4+ release and fixation (Greenland, 1965; Dudas and Pawluk, 1970;
Syers et al., 1970). Removal of organic matter from the clay surface increases

139
the amounts of NH4+ fixed with the application of ammonium-based N fertilizers
(Hinman, 1966).
In addition, in most previous studies, the amounts of fixed NH4+ and K+ in the
soil were analyzed separately with different methods. For nonexchangeable NH4+,
the HF/HCl digestion method developed by Silva and Bremner (1966) is
commonly used; whereas for nonexchangeable K+, the most commonly used
method is the boiling nitric acid (HNO3) extraction method developed by Pratt
(1965). The mechanism of the HF/HCl digestion method is to destroy the
structure of soil minerals with a very strong acid to dissolve the NH4+ in soil
minerals into the digestion solution. On the other hand, the HNO3 method
replaces the exchangeable and nonexchangeable K+ with H+ ions, in addition to
some K+ released by the dissolution of K-bearing minerals. Due to the difference
in mechanisms of the two analytical methods, it might not be reasonable to
directly compare the quantity of nonexchangeable NH4+ and K+ analyzed by
these methods. Additionally, research showed the HF/HCl digestion method
overestimated the amount of nonexchangeable NH4+ that is available for plants
(Nieder et al., 2011), while the boiling HNO3 method did not completely extract
interlayer K (Cox et al., 1996).
Scott et al. (1960) developed the sodium tetraphenylboron (NaBPh4) method
to extract interlayer K in soils. The BPh4- anion combines with solution K and
forms a potassium tetraphenylboron (KBPh4) precipitate, while Na+ exchanges
with interlayer K. After the extraction period, the KBPh4 precipitate is dissolved by
boiling water and the precipitate K is recovered by using Hg2+ to destroy BPh4-.
Smith et al. (1994) found that a 7-d extraction with NaBPh4 was also suitable for
the measurement of the nonexchangeable NH4+ in different soils. Therefore, the
NaBPh4 method can be used to extract both NH4+ and K+ at the same time. Cox
et al. (1996) modified this method by using Cu2+ as a replacement for Hg2+ to
make it more suitable for routine lab work. In their research, it was found that
NaBPh4 extraction extracted 71% of NH4+ released by the conventional HF/HCl

140
method and removed up to 10 times more nonexchangeable K than the boiling
HNO3 method because the NaBPh4 extraction is able to more closely simulate
the release mechanism of the nonexchangeable NH4+/K+ uptake by plant roots
as it simply depletes solution NH4+/K+.
The objective of this study was to simulate the band injection of AA under
laboratory conditions, and assess the effect of AA injection on K fixation around
the injection point over time in four soils with the modified NaBPh4 extraction
method.
Materials and Methods 5.3
Sample Treatment 5.3.1
Four soils were collected from 3 conventional tillage field sites. At each site
soils were sampled to a depth of 30 cm and stored in a field-moist condition at 4 ○C until used. Pertinent soil properties are presented in Table 5.1.
Soil samples were passed through a 2 mm sieve and packed into 30×30×5
cm boxes at a bulk density of 1.3 g cm-3. Deionized water was added to bring
water potential to 0.05 MPa and soil samples were allowed to equilibrate for 10
days at 20 ○C prior to fertilizer application. Using an apparatus similar to that
developed by Stehouwer and Johnson (1991), AA was added at a rate of 23 g
box-1 (equivalent to 170 kg ha-1 N). The AA was injected into the center of each
soil box. After the injection of AA, all boxes were incubated in a growth chamber
for 7, 14, or 28 days at 22 ○C. Boxes were arranged in a split-plot design with
different soil types as the main plots and different incubation times as subplots
and each treatment combination was replicated three times. The boxes were
weighed every 3 or 4 days to determine moisture loss, and brought back to their
original water content with deionized water. After each incubation time, boxes
were removed from the growth chamber for destructive sampling. Soil material

141
around the injection point was divided into seven concentric zones with
diameters of 0-4, 4-6, 6-9, 9-12, 12-15, 15-18, and 18-21 cm. Soils taken from
the same zone were pooled and mixed as one sample before any analysis.
Sample Analysis 5.3.2
Soil pH was measured with a glass electrode from a 1:2 soil:water
suspension. A 1-g subsample was used to determine exchangeable K after
extraction with Mehlich-3 solution. Total nonexchangeable K was extracted with
NaBPh4 using a 7-d extraction period according to Cox et al. (1996). We also
used the boiling HNO3 extraction method (Pratt, 1965), which is more widely
used to determine the total nonexchangeable K content in some samples in
which large reductions in nonexchangeable K content were observed with the 7-d
NaBPh4 extraction. All extracts were stored in sealed vials at 4 ○C before
determination of K+ concentration using a flame emission spectrophotometer.
Sodium Tetraphenylboron Extraction Procedure 5.3.2.1
Soil samples weighing 0.5 g were placed in Folin Wu tubes and 3 ml of
extracting solution (0.2 M NaBPh4-1.7 M NaCl-0.01 M EDTA) were added. After 7
d of incubation, 25 ml of quenching solution (0.5 M NH4Cl-0.11 M CuCl2) was
added to the tubes to stop K extraction. The tubes were then placed on a
digestion block preheated to 130 °C for 45 minutes. After removal from the
digestion block, the suspension in the tubes was diluted to 50 ml with deionized
water, mixed, and then left undisturbed for 2 hours to allow the soil to settle. We
transferred 20 ml of the top clear solution to vials containing 3 drops of
concentrated HCl. These solutions were stored at 4 °C before analysis.
Boiling Nitric Acid Extraction Procedure 5.3.2.2
We placed 2.5 g of air-dried, ground soil into digestion tubes. After adding 25
ml 1.0 M HNO3, these tubes were placed on a hot digestion block and gently
boiled for 10 minutes once boiling began. The suspension in the tubes was
filtered into a 100 ml volumetric flask. Soils in the funnel were rinsed with four 15-

142
ml aliquots of 0.1 M HNO3. Then flasks were brought to volume with 0.1 M HNO3.
Solutions in the flasks were stored at 4 °C before analysis.
Data Analysis 5.3.3
All statistical analyses were performed with version 9.2 of SAS (SAS
Institute Inc., 2008). Analysis of variance was conducted using the GLM
procedure. Soil type was considered as the main plot and used as a class
variable, while incubation time and distance were subplots. The MEANS
procedure with the LSD option was used for means separation.
Results and Discussion 5.4
Soil pH 5.4.1
Initial soil pH was in a range of 5.6 to 6.0. In all four soils, seven days after
injection of AA, soil pH within 6 cm of the point of AA injection increased
significantly (Figure 5.1). This increase in pH can be attributed to the reaction
between NH3 and H2O, through which OH- ions are produced. High pH (>8) near
the point of AA injection persisted through 14 days of incubation and at day 28 it
decreased likely due to nitrification. In the Chalmers and Pewamo soils, soil pH
had little change at the outer zones 9 to 11.5 cm away from the AA injection point
indicating that the injected AA did not move beyond 9 cm from the injection point.
In the Raub soil, the effect of AA injection on soil pH was significant up to 7.5 cm
from the injection point, whereas in Pinhook soil, a large decrease in pH was
observed at day 28 up to 11.5 cm away from the injection point. The impacted
area after AA injection was larger in the Pinhook soil than in the other three soils,
which might be due to the higher sand content in the Pinhook soil. Eno and Blue
(1954) found that soil pH was initially increased by AA injection but decreased
with time, and this effect was restricted to a 7.6 cm zone centered on the
injection row in sandy soil. Stanley and Smith (1956) reported a gradual

143
decrease in soil pH from center to 15 cm away from the injection point two
months after applying 6 g of AA (equivalent to 20 kg ha-1 N) in a silt loam soil.
Soil Exchangeable and Nonexchangeable Potassium Content 5.4.2
The average exchangeable K concentrations in each untreated soil
decreased in following order: Pewamo (258 mg kg-1) > Pinhook (242 mg kg-1) >
Raub (209 mg kg-1) > Chalmers (170 mg kg-1). These soils differed little in
exchangeable K and there was only a slight effect of AA injection on
exchangeable K (Figure 5.2).
In Indiana, K fertilizer recommendations are made based on soil test results
(Mehilich-3 or ammonium acetate, pH 7.0, exchangeable K content). Any soil test
K level below the critical soil test level indicates that the soil is K deficient for
optimum crop growth (Vitosh et al., 1995). When soil test K level is above the
critical level, addition of fertilizer may also be necessary to maintain the soil test
K level at or slightly above the critical level, even though no yield response to the
applied K will be observed.
The soil test K critical level can be calculated through an algorithm
developed by Vitosh et al. (1995):
K Critical level=75+2.5*CEC
Based on this algorithm, soil critical levels are 123 mg K kg-1, 118 mg K kg-1, 98
mg K kg-1, and 103 mg K kg-1 for soils Chalmers, Pewamo, Pinhook and Raub,
respectively. Cox et al. (1999) also reported that soil K critical levels can be well
predicted (R2=0.986) using the model:
K Critical level=34.5-3.41*Illite K++3.52*CEC
where illite K is the nonexchangeable K concentration (g K+ kg-1) in the soil
measured by NaBPh4 extraction after a 7-d incubation. Since CEC and K-bearing
minerals contents are the two major properties controlling K-buffering capacity in

144
the soil (Mengel and Busch, 1982), these two factors are both considered in the
equation. Based on Cox et al. (1999) model, Soil critical levels are 91 mg K kg-1,
70 mg K kg-1, 62 mg K kg-1, and 67 mg K kg-1 for the Chalmers, Pewamo,
Pinhook and Raub soils, respectively. Comparing soil test K levels and soil K
critical levels, in all four soils, soil test K levels are much greater than the soil K
critical levels, so no K fertilizer application is required. However, after solution K
and exchangeable K is depleted by crop uptake and leaching, the blocking effect
of NH4+ on fixed K release might result in K-deficiency in crops in late-season.
Therefore, it is important to determine the effect of AA injection on soil
exchangeable and nonexchangeable K content.
The total nonexchangeable K analyzed with NaBPh4 7-d extraction
decreased in the following order: Pewamo (7428 mg kg-1)> Chalmers (3228 mg
kg-1) > Raub (2019 mg kg-1) > Pinhook (1485 mg kg-1), and the total
nonexchangeable K concentrations in these four soils are positively correlated to
soil clay content. The positive relationship between soil nonexchangeable K
concentration and clay content is consistent with the results found in many
previous studies (McEwen and Matthews, 1957; MacLean and Brydon, 1963;
Munn et al., 1976). However, K fixation can also occur in silt or fine-sand size
fractions of the soil with the presence of silt or fine-sand size vermiculite minerals
(Murashkina et al., 2007).
In the Chalmers and Pewamo soils, the total nonexchangeable K
concentration decreased significantly in the soil up to 4.5 cm from the injection
point 7 days after the injection of AA, and this decrease persisted through 14
days of incubation, but after 28 days the effect was no longer apparent (Figure
5.3). Seven days after AA injection, a large variation in total nonexchangeable K
concentration was observed at the center zone (4.5-6 cm), which indicated that
the effect of AA injection on total nonexchangeable K concentration in soils 4.5-6
cm away from the injection point was not consistent among all three replications.

145
In the Pinhook and Raub soil, injection of AA had no significant effect on total
nonexchangeable K concentration.
Although greater movement of ammonia (NH3) was observed in the sandy
Pinhook soil, the injected AA had a more pronounced effect on exchangeable K
and nonexchangeable K concentrations in the Chalmers and Pewamo soils than
in Raub and Pinhook soils. This result may be attributed to the different textures
of soil samples. McDowell and Smith (1958) found that NH3 moved up to 7.5 cm
away from AA injection point in sandy and silt loam soils, while only moving 5 cm
in a clay soil. Their observations were similar to the results found in our study.
The reduced NH3 movement in the higher clay soils in both studies likely due to
the greater capacity of fine-textured soils to sorb NH3 compared coarser ones
(Jenny et al., 1945; Martin and Chapman, 1951; Stanley and Smith, 1956). This
also explains why AA injection had a more pronounced effect on K distributions
in the two soils with higher clay content. Similar results were observed by other
researchers. Stehouwer and Johnson (1991) found that the effect of
simultaneous injection of AA and KCl on the distribution of exchangeable and
fixed NH4+ and K+ were more pronounced in a silty clay loam soil than in a silt
loam soil. Chen et al. (1992) also reported that the variation in the quantity of
fixed K after adding N and K fertilizers was related to soil texture.
In addition to the amount of clay, the type of clay mineral is also considered
to be a dominant factor that determines the extent of K fixation and release.
Many researchers have shown that soils with more illites and vermiculites have
greater K fixation capacity (Arifin et al., 1973; Shaviv et al., 1985; Goli-Kalanpa et
al., 2008). Bajwa (1987) found that montmorillonitic clays fix more NH4+ and less
K+, while vermiculitic clays fix both. In soils with large amounts of smectites, a
greater quantity of added K remained in the form of solution K (Goli-Kalanpa et
al., 2008). Therefore, the effect of AA injection on K distribution in soils may be
explained by both differences in clay content and clay mineralogy.
Our results showed that the exchangeable and nonexchangeable K contents

146
in the Raub and Pinhook soils did not change much after the injection of AA,
whereas in Chalmers and Pewamo soils, AA injection significantly decreased the
nonexchangeable K content near the injection point, surprisingly without
increases in the exchangeable K concentration. This observation indicated that
some nonexchangeable K was fixed more deeply in the clay mineral interlayer
and became not extractable by NaBPh4. To the best of our knowledge, this
observation has not been reported previously. Stanley and Smith (1956)
evaluated the effect of AA injection on the availability of soil exchangeable K in a
Putnam silt loam soil. They showed that the effect of AA injection on the amount
of readily available K was not pronounced, with 10 mg kg-1 of HCl-extractable K
in the soil 0 to 3 cm away from the injection point and 7.9 mg kg-1 of HCl
extractable K in the untreated soils. Tung et al. (2009) evaluated K
concentrations in groundwater under different fertilizer application treatments.
They found that without the application of K fertilizer, K concentrations in the
groundwater decreased following the application of N fertilizer (at a rate of 3.75
kg ammonium chloride per palm per year equivalent to about 180 kg N ha-1),
however this decrease was not statistically significant because in the absence of
K application, soil solution K concentrations were very low, ranging from 1.3 to
10.7 mg L-1. Unfortunately, total nonexchangeable K content was not measured
in either of these studies. While the initial exchangeable K concentrations were
greater in the soils used in our studies, we also did not observe a pronounced
change in exchangeable K concentration upon AA injection.
Although the blocking effect of NH4+ on release of fixed K from clay minerals
has been observed in many studies (Welch and Scott, 1961; Springob, 1999),
the way in which AA application decreases nonexchangeable K content near the
injection point is not clear. We proposed two mechanisms to explain the
“disappearance” of K after AA injection: one is the deprotonation of clay minerals
due to the high pH resulting from AA injection; the other is the dehydration of
interlayer water caused by the reaction between NH3 and water. After AA
injection, the magnitude of soil pH generally increased by 2 (pH > 8.0), indicating
147
a large production of OH- groups, which reacts with the H+ ions on the surface of
clay minerals resulting in increased soil charge on the clay minerals and the
corresponding deprotonation can then lead to the collapse of the clay mineral
interlayer. The effect of pH changes on K fixation has been reported in some
early studies (Volk, 1934; Martin et al., 1946). Generally, K fixation increased
with soil pH. When soil pH value is as low as 2.5, no fixation occurred. As soil pH
value increased to 5.5, K fixation increased rapidly, and when soil pH was above
5.5, the increase in K fixation tended to slow down. The increased K fixation
resulted from the decreased amount of H+ ion present in the soil that competes
with K+ on the fixation sites at low pH (2.5 to 5.5) and the decreased number of
interlayer hydroxyl aluminum polymer cations when soil pH is between 5.5 and
8.0 (Thomas and Hipp, 1968). On the other hand, the water fixed in between the
2:1 clay mineral interlayers is more acidic (Mortland, 1966). The reaction
between NH3 and such “acidic” water is enhanced by the injection of AA.
Removal of the interlayer water fixed in clay minerals can potentially collapse the
clay mineral interlayer and reduce the amount of K extracted by all current
analytic methods. Further study on these two mechanisms will improve our
understanding of the blocking effect of NH4+ on soil K release.
Comparison between Two Nonexchangeable Potassium Extraction 5.4.3
Methods
Nonexchangeable K was extracted with both NaBPh4 and boiling HNO3.
Although nonexchangeable K levels using boiling HNO3 were 10 times less than
nonexchangeable K levels using NaBPh4, both methods showed large reductions
in nonexchangeable K concentrations near the injection point 7 days after AA
injection (Figure 5.4).
So far no chemical extraction method is regarded as ideal for predicting the
total nonexchangeable K content in soil. The boiling HNO3 extraction is a widely
accepted method because it is the quickest and easiest way of measuring the
148
amount of nonexchangeable K. However, the role of H3O+ in nonexchangeable K
release is questioned. Only within a certain range of pH or with a weak acid
concentration does H3O+ behave as an exchanger to replace the interlayer K.
With a higher concentration of acid, HNO3 may also dissolve structural forms of K
(Martin and Sparks, 1985). The NaBPh4 extraction method more closely
simulates the mechanism of nonexchangeable K release brought by uptake of K
by plant roots. The BPh4- anion combines with released solution K and
precipitates, while Na+ exchanges with the interlayer K (Scott et al., 1960). This
method is not widely used by commercial soil testing laboratories because of its
cost and mammalian toxicity of NaBPh4. In our research, we found that the
NaBPh4 method extracted 10 times more nonexchangeable K than the boiling
HNO3 extraction, which agrees with the study of Cox et al. (1996). The total
nonexchangeable K referred in our study was actually NaBPh4 extractable K.
However, neither of these methods was able to extract the nonexchangeable K in
soils near the injection point 7 days after AA injection.
Conclusion 5.5
In conclusion, injection of AA did not have a pronounced effect on
exchangeable K content in the soil, but dramatically decreased nonexchangeable
K contents by 40 to 60% near the injection point in Chalmers and Pewamo soils
for approximately 14 days.
From a mechanistic point of view, this result complicates the modeling of
release kinetics of nonexchangeable K in soils. Many studies found the parabolic
diffusion equation could be used to better explain the K release kinetics (Dhillon
and Dhillon, 1989; Cox and Joern, 1997; Jalali, 2006). However, they were only
studying the release of K from the nonexchangeable K pool to the exchangeable
K pool. When AA is injected, both exchangeable and nonexchangeable K
concentrations may decrease. Therefore, the parabolic diffusion equation is not

149
suitable for accurately predicting the release of K in the presence of blocking ions.
From a practical point of view, high K fixation potentials are observed in soils that
have large amounts of micaceous or vermiculitic clay minerals (Arifin et al., 1973;
Shaviv et al., 1985; Goli-Kalanpa et al., 2008). Injection of AA could exacerbate K
fixation in these soils and lead to K deficiency in crops, unless the grower applied
additional K fertilizer.
As we discussed above, the types and amounts of clay minerals are
believed to be the most important factors that determine K fixation and release.
Future studies shoud be conducted to evaluate the changes in clay mineral
properties after injection of AA, which we hope could further explain our
observations of reduced nonexchangeable K near the AA injection point in some
soils, but not others.

150
Reference: 5.6
Arifin, H.F. Perkins, and K.H. Tan. 1973. Potassium fixation and reconstitution of
micaceous structures in soils. Soil Sci. 116: 31-35.
Bajwa, M.I. 1987.Comparative ammonium and potassium fixation by some
wetland rice soil clays as affected by mineralogical composition and
treatment sequence. J. Agron. Crop Sci. 158: 65-68.
Brady, N.C., and R.R. Weil. 2008. Soil Phosphorus and Potassium. p. 594-638.
In Brady, N.C., and R.R. Weil (Ed.) The nature and properties of soils.
Prentice Hall, New Jersey.
Brouder, S.M., and K.G. Cassman. 1994. Evaluation of a mechanistic model of
potassium uptake by cotton in vermiculitic soil. Soil Sci. Soc. Am. J. 58:
1174-1183.
Chen, J.S., and A.F. Mackenzie. 1992. Fixed ammonium and potassium as
affected by added nitrogen and potassium in three Quebec soils. Commun.
Soil Sci. Plant Anal. 23: 1145-1159.
Clay, D.E., S.A. Clay, Z. Liu, and S.S. Harper. 1995. Leaching of dissolved
organic carbon in soil following anhydrous ammonia application. Biol. Fert.
Soils 19: 10-14.
Cox, A.E., B.C. Joern, and C.B. Roth. 1996. Nonexchangeable ammonium and
potassium determination in soils with a modified sodium tetraphenylboron
method. Soil Sci. Soc. Am. J. 60: 114-120.
Cox, A.E., and B.C. Joern. 1997. Release kinetics of nonexchangeable
potassium in soils using sodium tetraphenylboron. Soil Sci. 162: 588-598.

151
Cox, A.E., B.C. Joern, S.M. Brouder, and D. Gao. 1999. Plant-available
potassium assessment with a modified sodium tetraphenylboron method.
Soil Sci. Soc. Am. J. 63: 902-911.
Dhillon, S.K., and K.S. Dhillon. 1990. Kinetics of release of nonexchangeable
potassium by cation-saturated resins from Red (Alfisols), Black (Vertisols)
and Alluvial (Inceptisols) soils of India. Geoderma 47: 283-300.
Dudas, M.J., and S. Pawluk. 1970. Naturally occurring organo-clay complexes of
orthic black chernozems. Geoderma 3: 5-17.
Eno, C.F., and W.G. Blue. 1954. The effect of anhydrous ammonia on nitrification
and the microbiological population in sandy soils. Soil Sci. Soc. Am. J. 18:
178-181.
Green, C.J., A.M. Blackmer, and N.C. Yang. 1994. Release of fixed ammonium
during nitrification in soils. Soil Sci. Soc. Am. J. 58: 1411-1415.
Greenland, D.J. 1965. The absorption of sugars by organic compounds in soils. I.
Mechanisms of interaction between clays and defined organic compounds.
Soils Fertil. 28: 415-425.
Goli-Kalanpa, E., M.H. Roozitalab, and M.J. Malakouti. 2008. Potassium
availability as related to clay mineralogy and rates of potassium application.
Comm. Soil Sci. Plant Anal. 39: 2721–2733.
Hinman, W.C. 1966. Ammonium fixation in relation to exchangeable potassium
and organic matter content of two Saskatchwan soils. Can. J. Soil Sci. 46:
223-225.
Jackson, M.L. 1958. Soil chemical analysis. Prentice-Hall, Englewood Cliffs, NJ.
Jalali, M. 2006. Kinetics of nonexchangeable potassium release and availability
in some calcareous soils of western Iran. Geoderma 135: 63-71.

152
Jenney, R., A.D. Ayres, and J.S. Hosking. 1945. Comparative behavior of
ammonia and ammonium salts in soils. Hilgardia 16: 429-457.
Kilic, K., M.R. Derici, and K. Saltali. 1999. The ammonium fixation in great soil
groups of Tokat region and some factors affecting the fixation I. The affect of
potassium on ammonium fixation. Turk. J. Agric. For. 23: 673-678.
Kirkman, J.H., A. Basker, A. Surapaneni, and A.N. MacGregor. 1994. Potassium
in the soils of New Zealand —a review. New Zealand J. Agri. Res. 37: 207-
227.
MacLean, A.J., and J.E. Brydon. 1963. Release and fixation of potassium in
different size fractions of some Canadian soils as related to their mineralogy.
Can. J. Soil Sci. 43: 123-134.
Martin, J.P., and H.D. Chapman. 1951. Volatilization of ammonia from surface-
fertilized soils. Soil Sci. 71: 25-34.
Martin, H.W., and D.L. Spark. 1985. On the behavior of nonexchangeable
potassium in soils. Comm. Soil Sci. Plant Anal. 16: 133-162.
Martin, J.C., R. Overstreet, and D.R. Hoagland. 1946. Potassium fixation in soils
in replaceable and nonreplaceable forms in relation to chemical reactions in
the soil. Soil Sci. Soc. Am. Proc. 10: 94-101.
McDowell, L.L., and G.E. Smith. 1958. The retention and reactions of anhydrous
ammonia on different soil types. Soil Sci. Soc. Am. Proc. 22: 38-42
McEwen, H.B., and B.C. Matthews. 1957. Rate of release of nonexchangeable
potassium by Ontario soils in relation to natural soil characteristics and
management practice. Can. J. Soil Sci. 38: 36-43.
Mengel, K., and R. Busch. 1982. The importance of potassium buffer power on
the critical potassium level in soils. Soil Sci. 133:27–32.

153
Mortland, M.M. 1966. Ammonia interactions with soil minerals. pp. 188-197. In
M.H. McVikar et al. (ed.) Agricultural anhydrous ammonia technology and
use. AAI, ASA, and SSSA, Madison, WI.
Munn, D.A., L.P. Wildling, and E.D. McLean. 1976. Potassium release from sand,
silt, and clay separates. Soil Sci. Soc. Am. Proc. 40: 364-366.
Murashkina, M.A., R.J. Southard, and G.S. Pettygrove. 2007. Silt and fine sand
fractions dominate K fixation in soils derived from granitic alluvium of the
San Joaquin Valley, California. Geoderma 141: 283–293.
Nieder, R., D.K. Benbi, and H.W. Scherer. 2011. Fixation and defixation of
ammonium in soils: a review. Biol. Fertil. Soils 47: 1–14.
Nommick, H. 1957. Fixation and defixation of ammonium in soils. Acta. Agr.
Scandinavia 7: 395-436.
Scherer, H.W. 1982. Fixed NH4-N in relation to EUF-extractable K. Plant Soil 64:
67-71.
Scott, A.D., R.R. Hunziker, and J.J. Hanway. 1960. Chemical extraction of
potassium from soils and micaceous minerals with solutions containing
sodium tetraphenylboron. I. Preliminary experiments. Soil Sci. Soc. Am. Proc.
24: 46-51.
Shaviv, A., M. Mohsin, P.F. Pratt, and S.V. Mattigod. 1985. Potassium fixation
characteristics of five southern California soils. Soil Sci. Soc. Am. J. 49:
1105–1109.
Silva, J.A., and J.M. Bremner. 1966. Determination and isotope ratio analysis of
different forms of nitrogen in soils: 5. Fixed ammonium. Soil Sci. Soc. Am.
Proc. 30: 587-594.

154
Smith, S.J., J.F. Power, and W.D. Kemper. 1994. Fixed ammonium and nitrogen
availability indexes. Soil Sci. 158: 132-140.
Sparks, D.L. 1987. Potassium dynamics in soils. Advan. Soil Sci. 6: 1-63.
Sparks, D.L., and P.M. Huang. 1985. Physical chemistry of soil potassium. p.
201-276. In R.E. Munson (ed.) Potassium in Agriculture. American Society of
Angronomy, Madison, WI.
Springob, G. 1999. Blocking the release of potassium from clay interlayers by
small concentrations of NH4+ and Cs+. Euro. J. Soil Sci. 50: 665-674.
Stanley, F.A., and G.E. Smith. 1956. Effect of soil moisture and depth of
application on retention of anhydrous ammonia. Soil Sci. Soc. Am. Proc. 20:
557-561.
Steffens, D., and D.L. Sparks. 1997. Kinetics of nonexchangeable ammonium
release from soils. Soil Sci. Soc. Am. J. 61: 455-462.
Stehouwer, R.C., and J.W. Johnson. 1991. Soil adsorption interactions of band-
injection anhydrous ammonia and potassium chloride fertilizers. Soil Sci.
Soc. Am. J. 55: 1374-1381.
Syers, J.K., A.S. Campbell, and T.W. Walker. 1970. Contribution of organic
carbon and clay to cation exchange capacity in a chronosequence of sandy
soils. Plant Soil 33: 104-112.
Thomas, G.W., and B.W. Hipp. 1968. Soil factors affecting potassium availability.
pp. 269-291. In V.J. Kilmer et al. (ed.) The role of potassium in agriculture.
ASA, CSSA, and SSSA, Madison, WI.

155
Tung, P.G., M.K. Yusoff, N.M. Majid, G.K. Joo, and G.H. Huang. 2009. Effect of
nitrogen and potassium fertilizers on nutrient leaching and groundwater
quality under mature oil palm in Sabah during the monsoon period. Am. J.
App. Sci. 6: 1788-1799.
Vitosh, M.L., J.W. Johnson, and D.B. Mengel. 1995. The tri-state fertilizer
recommendations for corn, soybeans, wheat and alfalfa. Ext. Bull. E-2567.
Michigan State Univ., East Lansing; The Ohio State Univ., Columbus; and
Purdue Univ., West Lafayette, IN.
Volk, N.J. 1934. The fixation of potash in difficultly available forms in soil. Soil Sci.
37: 267-287.
Welch, L.F., and A.D. Scott. 1961. Availability of nonexchangeable soil
potassium to plants as affected by added potassium and ammonium. Soil
Sci. Soc. Am. Proc. 25: 102-104.
Young, J.L., and R.A. Cattani. 1962. Mineral fixation of anhydrous ammonia by
air-dry soils. Soil Sci. Soc. Am. Proc. 26: 147-152.
Zhang, F., J. Niu, W. Zhang, X. Chen, C. Li, L. Yuan, and J. Xie. 2010.
Potassium nutrition of crops under varied regimes of nitrogen supply. Plant
Soil 335: 21–34.

156
Table 5.1 Soil characteristics in the upper 30 cm of the Ap horizon of the Chalmers, Pewamo, Pinhook, and Raub soil samples.
Soil Series Soil Classification† Sand Silt Clay OM‡ CEC§ pH¶
g kg-1 cmol kg-1 Chalmers Fine-silty, mixed, superactive, mesic Typic Endoaquoll 120 470 410 42 19.3 6.0 Pewamo Fine, mixed, active, mesic Typic Argiaquoll 100 410 490 39 17.3 5.6 Pinhook Coarse-loamy, mixed, superactive, mesic Mollic Endoaqualfs 500 310 190 24 9.2 6.0
Raub Fine-silty, mixed, superactive, mesic Aquic Argiudoll 240 490 270 27 11.1 5.9 †Mineral classifications are mixed for all soils. ‡OM = Soil organic matter content determined by loss-on-ignition method (Ball, 1964). §CEC = Cation exchange capacity determined by summation of basic cations measured with Mehlich-3 extraction and acid cations extracted by Barium Acetate ¶Soil pH was measured with a glass electrode in a 1:2 soil:water suspension.
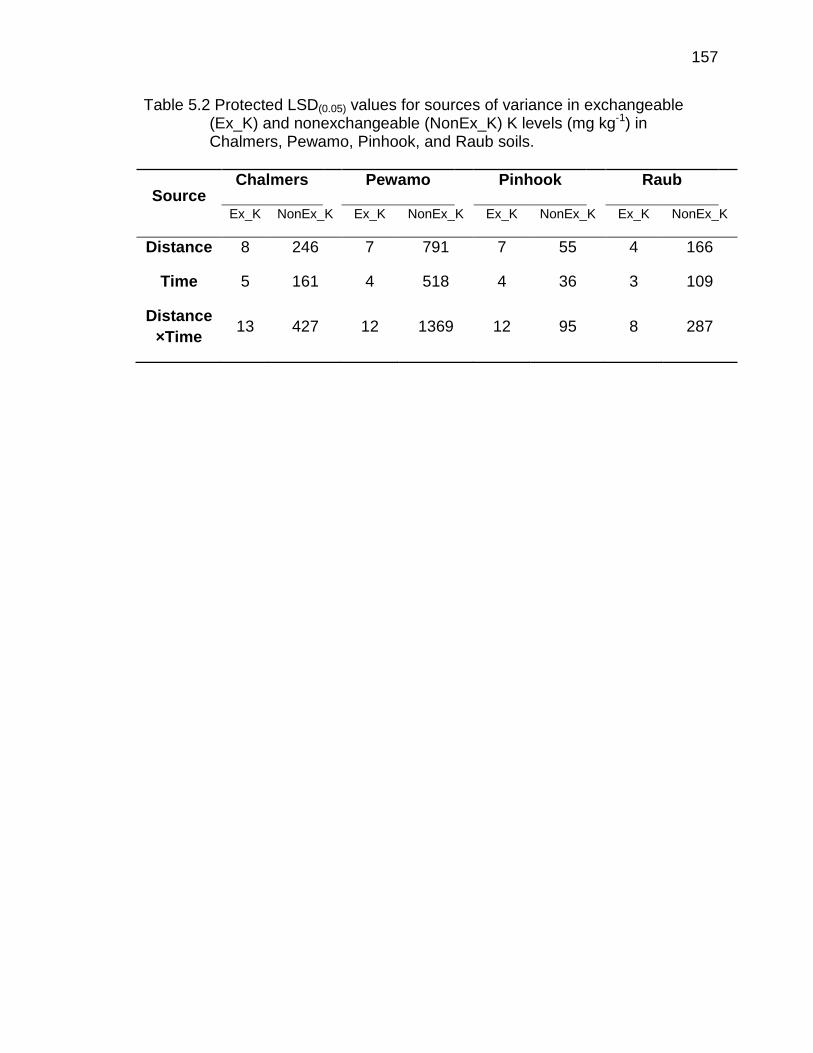
157
Table 5.2 Protected LSD(0.05) values for sources of variance in exchangeable (Ex_K) and nonexchangeable (NonEx_K) K levels (mg kg-1) in Chalmers, Pewamo, Pinhook, and Raub soils.
Source Chalmers Pewamo Pinhook Raub
Ex_K NonEx_K Ex_K NonEx_K Ex_K NonEx_K Ex_K NonEx_K
Distance 8 246 7 791 7 55 4 166
Time 5 161 4 518 4 36 3 109
Distance×Time 13 427 12 1369 12 95 8 287

158
Figure 5.1 Soil pH over 28 days after injection of anhydrous ammonia as affected
by distance from the anhydrous ammonia injection point in Chalmers, Pewamo, Pinhook, and Raub soil. Dash lines indicate initial soil pH. Soil pH values were obtained from a 1:2 slurry as mean of three replicates. Error bars indicate the standard deviation of the means. Letters indicate the difference in soil pH as affected by distance from the injection point. Points labeled by the same letter are not significantly different (p>0.05).

159
Figure 5.2 Distribution of exchangeable K over time and distance from the
anhydrous ammonia injection point in a Chalmers, Pewamo, Pinhook, and Raub soil after injection of anhydrous ammonia. Dash lines indicate the exchangeable K concentration in untreated soils. The exchangeable K values are means of three replicates. Error bars indicate the standard deviation of the means.
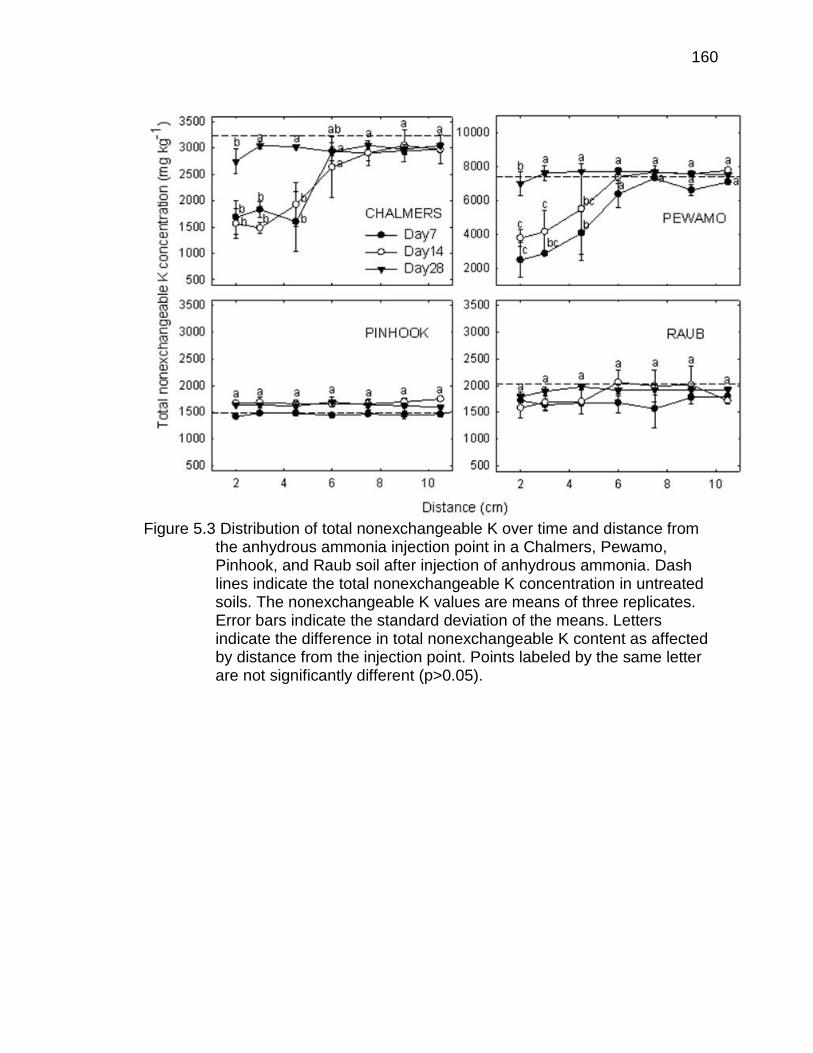
160
Figure 5.3 Distribution of total nonexchangeable K over time and distance from
the anhydrous ammonia injection point in a Chalmers, Pewamo, Pinhook, and Raub soil after injection of anhydrous ammonia. Dash lines indicate the total nonexchangeable K concentration in untreated soils. The nonexchangeable K values are means of three replicates. Error bars indicate the standard deviation of the means. Letters indicate the difference in total nonexchangeable K content as affected by distance from the injection point. Points labeled by the same letter are not significantly different (p>0.05).

161
Boiling nitric acid extraction
400
500
600
700
800
STPB 7-d extraction
Distance (cm)2 4 6 8 10
Tota
l non
exch
ange
able
K (m
g kg
-1)
2000
4000
6000
8000
10000
Figure 5.4 Distribution of total nonexchangeable K over distance from the anhydrous ammonia injection point in Pewamo soil seven days after injection of anhydrous ammonia. Total nonexchangeable K was extracted with boiling nitric acid and by 7-d incubation in sodium tetraphenylboron (STPB). The nonexchangeable K values are means of two replicates. Error bars indicate the standard deviation of the means.

162
CHAPTER 6. IMPACT OF MOISTURE ON SOIL TEST POTASSIUM LEVELS
Abstract 6.1
Soil testing results are critical to determine accurate soil fertilizer application
rates. Soil samples collected under different moisture contents can cause
variations in soil test K (STK) levels. Additionally, soil testing labs oven dry soil
samples at low temperature, which might not result in the best assessment of soil
available K because previous studies have found that soils may fix or release K
upon drying. This study was conducted to evaluate the impacts of moisture
content on STK levels and the relationship between STK level changes and soil
K critical values. Five field sites were established throughout Indiana from 1998
to 2002. Sites were cropped in a soybean-corn rotation. Four different rates of K
fertilizer (0, 67, 134, 202 kg K2O ha-1) were applied annually. Several soil
samples from each site were picked to provide a range in Mehlich-3 STK values
from 30 to 200 mg kg-1. The dry soil samples were rewetted to field capacity and
incubated at 25 ºC for 21 days before splitting into three subsamples for different
drying methods (moist, air-dry, and oven-dry at 40 ºC). Each sample was
extracted with Mehlich-3 to assess soil available K. The results showed that
mehlich-3 STK levels did not differ between the air-dried and oven-dried
treatment. Soils with low STK levels released K, while soils with high STK levels
fixed K upon drying. The equilibrium concentration of soil exchangeable K (at
which no change occurs in STK upon drying) varied with soils (104 to 241 mg
kg-1), and was positively related to the predicted soil K critical value.

163
Introduction 6.2
Currently, soil-test based K fertilizer recommendations are widely used
throughout the US. Through a soil test, the quantity of available K in the soil is
measured. The current soil test K (STK) level is compared with the K demands of
crops to determine if additional fertilizer input is necessary and, if so, how much
K fertilizer should be applied. Therefore, soil test results are critical to determine
accurate soil fertilizer application rates. However, current studies often suggest
poor relationships between STK levels and yield response (McLean, 1976;
Cassman et al., 1990), indicating possible existing errors in soil K testing.
Soil testing labs typically oven-dry soil samples for convenience, which might
not be a best assessment of soil available K. Previous studies have found that
soil moisture content has a dramatic impact on soil K dynamics (Thomas and
Hipp, 1968), because drying soil samples changes the soil solution’s ionic
strength and solution K concentration which results in fixation or release of soil K
(Brouder, 2010). For example, assuming a soil has a gravimetric moisture
content of 0.28 ml H2O g-1 soil and a solution K concentration of 30 mg L-1, after
soil moisture content is reduced to a 0.20 ml H2O g-1 soil, soil solution K
concentration would be 42 mg L-1 given that no K adsorption on the soil particles
occurred. This increase in soil solution K will shift the equilibrium condition
among different forms of soil K. However, the nature of this shift is still not well
understood.
In addition, soil samples taken in a dry season may also provide misleading
results for STK levels. Many studies have shown that STK levels vary for soil
samples collected at different times. Liebhardt and Teel (1977) measured STK
levels in soil samples taken periodically after crop harvest from 28 unfertilized
plots in Delaware. They found that STK values gradually increased from October
until late May. Childs and Jencks (1967) reported low available soil K levels in
September, which increased and reached a maximum during the winter months
(November to February), then decreased in the spring, and reached the lowest

164
STK level in early summer. Seasonal differences in STK levels were also
reported by Vitko et al. (2010). They found the difference between STK levels in
samples collected in fall verses in spring varied greatly from site to site and year
to year. Mallarino et al. (2011) also indicated that the effect of sample date on
STK levels was not consistent but site-specific. Large variations of STK across
fields were observed in this study as well. These observations may be partially
attributed to the variations in soil moisture content at the time the soil samples
were collected.
Another aspect of making accurate K fertilizer recommendations is to
determine the STK level that coincides with optimum crop growth, which is also
called the critical level. Any STK level below the critical level indicates that the
nutrient in the soil is deficient for optimum crop growth (Vitosh et al., 1995).
When the soil test level is above the critical level, fertilizer additions may still be
necessary to maintain the soil test level, even though no yield response will be
observed.
Accurate soil test critical levels are the key to optimizing fertilizer
recommendations. Soil test K critical levels are commonly determined from long-
term field studies. Vitosh et al. (1995) predicted STK critical levels for Indiana,
Michigan and Ohio through the following algorithm:
K Critical level=75+2.5*CEC
where CEC is the abbreviation for soil cation exchange capacity. However, this
model may not be reliable to predict the K critical level in soils with appreciable
amounts of non-exchangeable K. Cox et al. (1999) reported critical levels can be
well predicted (R2=0.99) using the model:
K Critical level=34.5-3.41*Illite K++3.52*CEC,
where illite K is the nonexchangeable K concentration (g K kg-1) in the soil
measured by sodium tetraphenylboron (STPB) extraction after a 7-d incubation.

165
This model has not been widely accepted for the prediction of soil K critical levels,
since the STPB extraction is not widely used by commercial soil testing
laboratories and it has not been tested in the field.
Previous studies have found that the impact of sample drying on STK level
changes is highly depending on the equilibrium concentration of soil
exchangeable K. At this level no changes in exchangeable K concentration would
be observed upon drying. The equilibrium level of K varies among soils (196 mg
K kg-1 in Cook and Hutchenson, 1960; 175 mg K kg-1 in Dowdy and Hutchenson,
1963; 420 mg K kg-1 in Haby et al., 1988), and is related to soil mineralogical
properties (Haby et al., 1990). Barbagelata (2006) also indicated that the
difference between exchangeable K levels in dried soils and moist soils had a
positive linear relationship with soil CEC when it was expressed in absolute
values. However, no study has been conducted to investigate the relationship
between the equilibrium concentration of K and soil K critical level.
The objectives of this study are to i) find out how Mehlich-3 extractable K
content varies under different soil moisture conditions (moist, air-dry, oven-dry) in
five soils; and ii) evaluate the relationship between the equilibrium level of K and
the soil K critical level.
Materials and Methods 6.3
Five field sites were established at Davis-Purdue Agricultural Center (DPAC),
Northeast-Purdue Agricultural Center (NEPAC), Pinney-Purdue Agricultural
Center (PPAC), Southeast-Purdue Agricultural Center (SEPAC), and
Throckmorton-Purdue Agricultural Center (TPAC) from 1998 to 2002 by Sylvie
Brouder. The soil taxonomic class and selected soil chemical and physical
properties for each location are presented in Table 6.1. All sites were cropped in
a soybean-corn rotation and received four different rates of K fertilizer (0, 67, 134,
202 kg K2O ha-1) for 4 years.

166
Soil samples were collected at two depths, 0-10 cm and 10-20 cm. After
taking the samples back to the laboratory, they were air dried, sieved to 2 mm,
and stored at room temperature before any analysis. According to prior Mehlich-3
STK results, we selected 91 samples to provide a range of STK values from 30
to 200 mg kg-1. These samples were rewetted to field capacity, placed in plastic
cups and incubated for 21 days at 25 ○C.
After 21 days of incubation, soil samples were split to undergo different
drying methods. One third of the sample was kept moist, one third was air-dried
and one third was oven-dried at 40 ○C for 16 hours. All samples were extracted
by Mehlich-3 solution to assess soil available K. All K concentrations were
determined using a flame photometer.
All statistical analyses were performed with version 9.2 of SAS (SAS
Institute Inc., 2008). Analysis of variance was conducted using the GLM
procedure. The relationship between the equilibrium concentrations of soil
exchangeable K and predicted soil K critical values was determined with the
CORR procedure. A curve was fitted with version 11.0 of SigmaPlot (Systat
Software Inc., 2008) for data showing the relationship between the Mehlich-3
STK level in moist soil and the percent change in STK upon drying in each soil.
Results 6.4
No significant differences (p>0.05) in Mehlich-3 STK level were observed
between air-dried and oven-dried samples except for PPAC soil in which fixation
of K was observed in most samples, however the amount fixed was all less than
10% (Figure 6.1). Therefore, Soil test K levels after drying are presented as the
average value of air- and oven-dried samples.
Four of five soils with low STK levels released K upon drying, while soils with
high STK levels fixed K upon drying. Among these soils, the highest amount of
released K was 24%, while up to 15% was fixed. In Figure 6.2, a logarithmic

167
regression line (Y=a + b log(x)) was drawn for each soil to show the relationship.
With higher R2 values, soils from NEPAC and SEPAC were best fitted to this
model. Unlike the soils from the other locations, soils from PPAC fixed K upon
drying at both low and high STK levels; however the amount fixed was generally
less than 10% (Figure 6.3).
The equilibrium concentration of soil exchangeable K (the level at which no
change in STK upon drying) varied greatly among soils and it decreased in the
following order: TPAC (241 mg kg-1) > DPAC (173 mg kg-1) > NEPAC (127 mg
kg-1) > SEPAC (106 mg kg-1). Soils from PPAC fixed K upon drying regardless of
STK level. Soil K critical levels were predicted using the models developed by
Vitosh et al. (1995) and Cox et al. (1999). Calculated from the Vitosh model, the
predicted soil K critical values were 106, 96, 87.5, 88, and 105 mg kg-1 for soils
from DPAC, NEPAC, PPAC, SEPAC, and TPAC, respectively, whereas
according to the Cox model, the predicted soil K critical values were 64, 49, 45,
48, and 66 mg kg-1 for soils from DPAC, NEPAC, PPAC, SEPAC, and TPAC,
respectively. The equilibrium STK levels were well correlated to the critical STK
values predicted by both the Cox model (r=0.92) and Vitosh model (r=0.87). Both
soil CEC and clay mineralogy are important for controlling K-buffering capacity in
the soil (Mengel and Busch, 1982) and most soils in Indiana are relatively high in
micaceaous clay minerals.
Discussion 6.5
The effect of drying on STK levels observed in our study was consistent with
other research. Cook and Hutcheson (1960) concluded that the effects of drying
on STK levels depend on the initial exchangeable K concentrations in the soil.
When the initial exchangeable K is high, fixation occurred upon drying; while
when the initial exchangeable K is low, release was observed. Jones et al. (1960)
dried samples at 110°C for 24 hours, and found that the amount of exchangeable

168
K either increased or decreased depending on the soil type. Vitko et al. (2009)
investigated the effects of different drying methods (moist, air-dry, and oven-dry)
on STK level of soil samples under different K fertilizer rate treatments. Their
results showed that soil samples with an initial STK level greater than 100 mg
kg-1 showed a significant decrease in STK after both air- and oven-drying, which
indicated the fixation of K upon drying. However, in some early studies (Luebs et
al., 1956; Hanway and Scott, 1959), they found that the ammonium acetate
extractable K concentrations in the soil tend to increase upon drying. The results
found in these previous studies might be due to initially lower exchangeable K
concentrations (less than 100 mg kg-1) in the soils they tested, as well as using
different extractants for measuring exchangeable K, as Hanway and Scott (1959)
found that different extractants have different sensitivities to drying.
In our study, we found that the effect of air-drying on STK level was similar
to oven-drying. However, many previous studies found that changes in
exchangeable K content were greater upon oven-drying than air-drying (Cook
and Hutcheson, 1960; Haby et al., 1988; Barbagelata, 2006). Jones et al. (1960)
also reported that air-drying always resulted in a release of K from
nonexchangeable form to exchangeable form, whereas oven-drying might
increase or decrease soil exchangeable K concentration depending on soil
properties. Vitko et al. (2009) found that, compared with air-drying, oven-drying
significantly increased the Bray-1 STK value in only one soil out of five, so the
effects of air-drying and oven-drying on soil exchangeable K level is dependent
on soil type, STK level and the extractant used.
Although many studies have been conducted to investigate the effect of
drying on STK levels, the mechanism(s) that controls K release or fixation in soils
is still not well understood. Different mechanisms were proposed to explain such
observation that soils with low STK levels released K upon drying, while soils
with high STK levels fixed K upon drying. Some researchers found soils with low
K-supplying potential required greater temperatures for clay minerals to collapse,

169
which may explain why release occurred when the initial exchangeable K was
low (Cook and Hutcheson, 1960). Dowdy and Hutcheson (1963) found that soil
clay mineralogy determined K release or fixation upon soil sample drying. They
found that illite appeared to be the source of K release when soil is dried, while
vermiculite and montmorillonite were related to K fixation. In addition, McLean
and Watson (1985) stated that the release of nonexchangeable K upon drying
when the STK level is low can be attributed to the expansion of layers at the
edge of the micaceous clay that happened upon soil drying; while when the STK
level is high, interlayer water is dried out upon soil drying, resulting in the
collapse of clay minerals and fixation of K.
Conclusion 6.6
In conclusion, STK levels varied with moisture content in soils with 2:1 clay
minerals. When the soil was low in K, an increase in STK occurred upon drying.
However, when the soil was high in K, STK decreased upon drying. This
indicated that the practice of drying prior to soil analysis used by most soil test
laboratories may not be appropriate for assessing STK levels. Additionally, under
dry conditions in the field, K availability will likely be overestimated in low testing
soils and underestimated in high testing soils. Luebs et al. (1956) reported that
crops could absorb 67 to 134 kg ha-1 more K when soils are moist compared to
dry soils. This study also helps explain observed K deficiencies in crops during
moisture stress, even on soils with relatively high STK levels.

170
References: 6.7
Barbagelata, P.A. 2006. Evaluation of potassium soil tests and methods for
mapping soil fertility properties in Iowa corn and soybean fields. PHD’s
dissertation. Iowa State University.
Barber, S.A., R.H. Bray, A.C. Caldwell, R.L. Fox, M. Fried, J.J. Hanway, D.
Hovland, J.W. Ketcheson, W.M. Laughton, K. Lawton, R.C. Lipps, R.A.
Olson, J.T. Pesek, K. Pretty, M. Reed, F.W. Smith, and E.M. Stickney. 1961.
North Central Regional potassium studies: II. Greenhouse experiments with
millet. North Central Regional Publication No. 123. Indiana Agr. Exp. Stn.
Res. Bul. RB 717.
Cook, M.G., and T.B. Hutcheson, Jr. 1960. Soil potassium reactions as related to
clay mineralogy of selected Kentucky soils. Soil Sci. Soc. Am. J. 24: 252-256.
Brouder, S.M. 2010. Nutrient cycling in soils: Potassium. In: Hatfield, J.L., and
T.J. Sauer (ed.) Soil Management: Building a Stable Base for Agriculture.
ASA-CSSA-SSSA, Madison, WI.
Cassman, K.G., D.C. Bryant, and B.A. Roberts. 1990. Comparison of soil test
methods for predicting cotton response to soil and fertilizer potassium on
potassium fixing soils. Commun. Soil Sci. Plant Anal. 21: 1727-1743.
Cox, A.E., B.C. Joern, S.M. Brouder, and D. Gao. 1999. Plant-available
potassium assessment with a modified sodium tetraphenylboron method.
Soil Sci. Soc. Am. J. 63: 902-911.
Dowdy, R.J., and T.B. Hutcheson, Jr. 1963. Effects of exchangeable potassium
level and drying on release and fixation of potassium by soils as related to
clay mineralogy. Soil Sci. Soc. Amer. Proc. 27: 31-34.

171
Haby, V.A., M.P. Russelle, and E.O. Skogley. 1990. Testing soils for potassium,
calcium, and magnesium. p. 181-227. In R.L. Westerman (ed.) Soil Testing
and Plant ananlysis, 3rd Edition. Soil Sci. Soc. Am. Book Ser. #3. Soil Sci.
Soc. Am., Madison, WI.
Haby, V.A., J.R. Sims, E.O. Skogley, and R.E. Lund. 1988. Effect of sample
pretreatment on extractable soil potassium. Commun. Soil Sci. Plant Anal.
19: 91-106.
Hanway J.J. and A.D. Scott. 1959. Soil potassium-moisture relations: III.
Determining the increase in exchangeable soil potassium on drying soils.
Soil Sci. Soc. Amer. Proc. 23: 22-24.
Jackson, M.L. 1958. Soil chemical analysis. Prentice-Hall, Englewood Cliffs, NJ.
Jones, Jr., J.B., H.J. Mederski, D.J. Hoff, and J.H. Wilson. 1961. Effect of drying
some Ohio soils upon the soil test for potassium. Soil Sci. Soc. Am. J. 25:
123-125.
Luebs, R.E., G. Stanford, and A.D. Scott. 1956. Relation of available potassium
to soil moisture. Soil Sci. Soc. Amer. Proc. 20: 45-50.
Liebhardt, W.C., and M.R. Teel. 1977. Fluctuations in soil test values for
potassium as influenced by time of sampling. Commun. Soil Sci. Plant Anal.
8: 591-597.
Mallarino, A.P., M.W. Clover, and R.R. Oltmans. 2011. Indentification of reasons
for high temporal soil-test potassium variation. p. 65-73. North Central
extension-industry soil fertility conference proceeding. Des Moines, IA.
Mengel, K., and R. Busch. 1982. The importance of potassium buffer power on
the critical potassium level in soils. Soil Sci. 133: 27–32.

172
McLean, E.O. 1976. Exchangeable K levels for maximum crop yields on soils of
different cation exchange capacities. Commun. Soil Sci. Plant Anal. 7: 823-
838.
McLean, E.O., and M.E. Watson. 1985. Soil measurements of plant-available
potassium. p 277-308. In R.D. Munson (ed.) Potassium in agriculture. ASA,
CSSA, and SSSA, Madison, WI.
Sparks, D.L., and P.M. Huang. 1985. Physical chemistry of soil potassium. p.
201-276. In R.D. Munson (ed.) Potassium in Agriculture. Am. Soc. Agron.,
Madison, WI.
Thomas, G.W., and B.W. Hipp. 1968. Soil factors affecting potassium availability.
pp. 269-291. In V.J. Kilmer et al. (ed.) The role of potassium in agriculture.
ASA, CSSA, and SSSA, Madison, WI.
Vitko, L.F., C.A.M. Laboski, and T.W. Andraski. 2009. Effects of sampling time,
soil moisture content, and extractant on soil test potassium levels. p. 124-
129. North Central extension-industry soil fertility conference proceeding.
Des Moines, IA.
Vitosh, M.L., J.W. Johnson, and D.B. Mengel. 1995. The tri-state fertilizer
recommendations for corn, soybeans, wheat and alfalfa. Ext. Bull. E-2567.
Michigan State Univ., East Lansing; The Ohio State Univ., Columbus; and
Purdue Univ., West Lafayette, IN.

173
Table 6.1 Soil characterization of a bulk soil sample collected from five field sites. Location Soil series Soil taxonomic class CEC†
cmolc kg-1 Illite K‡ g kg-1
Texture g kg-1§ Clay Sand Silt
DPAC Blount Fine, illitic, mesic Aeric Epiaqualf 12.4 4.19 350 110 540 NEPAC Glynwood Fine, illitic, mesic Aquic Hapludalfs 8.4 4.39 270 390 340 PPAC Tracy Coarse-loamy, mixed, active, mesic Ultic Hapludalfs 5.0 2.13 180 500 320
SEPAC Cobbsfork Fine-silty, mixed, active, mesic Fragic Glossaqualf 5.2 1.37 220 150 630 TPAC Toronto Fine-silty, mixed, superactive, mesic Udollic Epiaqualf 12.0 3.06 320 80 600
†CEC = Cation exchange capacity determined by summation of basic cations measured with Mehlich-3 extraction and acid cations extracted by Barium Acetate ‡Illite K = Nonexchangeable K extracted using 7-day incubation in 0.2 M NaBPh4
+ §Determined using the dispersion and sedimentation procedure described by Jackson, 1958

174
Figure 6.1 The relationship between Mehlich-3 soil test K levels of oven-dried
soils vs. Mehlich-3 soil test K levels of air-dried soils from five locations.

175
Figure 6.2 Relationship between the Mehlich-3 soil test K levels of moist soils
from four locations (DPAC, NEPAC, SEPAC, and TPAC) and the percent change in soil test K upon drying as described by the logarithmic model [Y=a + b×log(x)]. Soil test K levels upon drying were presented as the mean of air- and oven-dried samples. The vertical lines showed soil K critical levels predicted using model: Critical K =75+2.5*CEC (Vitosh et al., 1995). The vertical dash lines showed soil K critical levels predicted using model: Critical K = 34.5-3.41×illite K+3.52×CEC (Cox et al., 1999) where illite K is measured by NaBPh4
+ extraction after soil was incubated in it for seven days.

176
Figure 6.3 Relationship between the Mehlich-3 soil test K levels of moist soils from PPAC and the percent change in soil test K upon drying. Soil test K levels upon drying were presented as the mean of air- and oven-dried samples. The vertical line showed soil K critical levels predicted using model: Critical K =75+2.5*CEC (Vitosh et al., 1995). The vertical dash line showed PPAC soil K critical level predicted using model: Critical K = 34.5-3.41×illite K+3.52×CEC (Cox et al., 1999) where illite K is measured by NaBPh4
+ extraction after soil was incubated in it for seven days.

APPENDICES

177
Appendix A Locations of Study Sites
Figure A.1 Locations of seven study sites where soil sample was collected

178
Table A.1 Geographic coordinates of study sites for chapter 2, 3 and 5.
Site Latitude Longitude
ACRE 40.48428 -87.00816
DPAC 40.24583 -85.15053
NEPAC 41.11578 -85.44312
PPAC 41.45119 -86.93895
SEPAC 39.04344 -85.52725
SWAPC 38.74530 -87.48169
TPAC 40.26856 -86.87787

179
Appendix B Summary of Analysis of Variance Tables
Table B.1 Analysis of variance for mineralized N evaluated by different incubation methods
Incubation method Source of Var.† DF‡ NO3- NH4+ Total
P value
Leaching incubation Soil 7 0.0021 0.8329 0.0020
Block 2 0.2987 0.3083 0.2659 Error 14 - - -
Cups incubation Soil 7 <0.0001 0.4905 <0.0001
Block 2 0.6170 0.2173 0.2865 Error 14 - - -
Greenhouse Soil 7 N/A N/A 0.0002§
Block 2 N/A N/A 0.1439 Error 14 - - -
†Var.-variance ‡DF-degrees of freedom §Total plant uptake N under greenhouse conditions

180
Table B.2 Analysis of variance for laboratory predicted mineralizable N (N0), mineralization rate constant (k) and products of N0⨉k
Variable Source of Variance DF† P value
N0
Soil 6 <0.0001 Depth 3 <0.0001
Soil×Depth 18 <0.0001 Block 2 0.9305 Error 54 -
k
Soil 6 0.0306 Depth 3 0.0016
Soil×Depth 18 0.1269 Block 2 0.7238 Error 54 -
N0⨉k
Soil 6 <0.0001 Depth 3 <0.0001
Soil×Depth 18 0.0108 Block 2 0.5442 Error 54
† DF-degrees of freedom
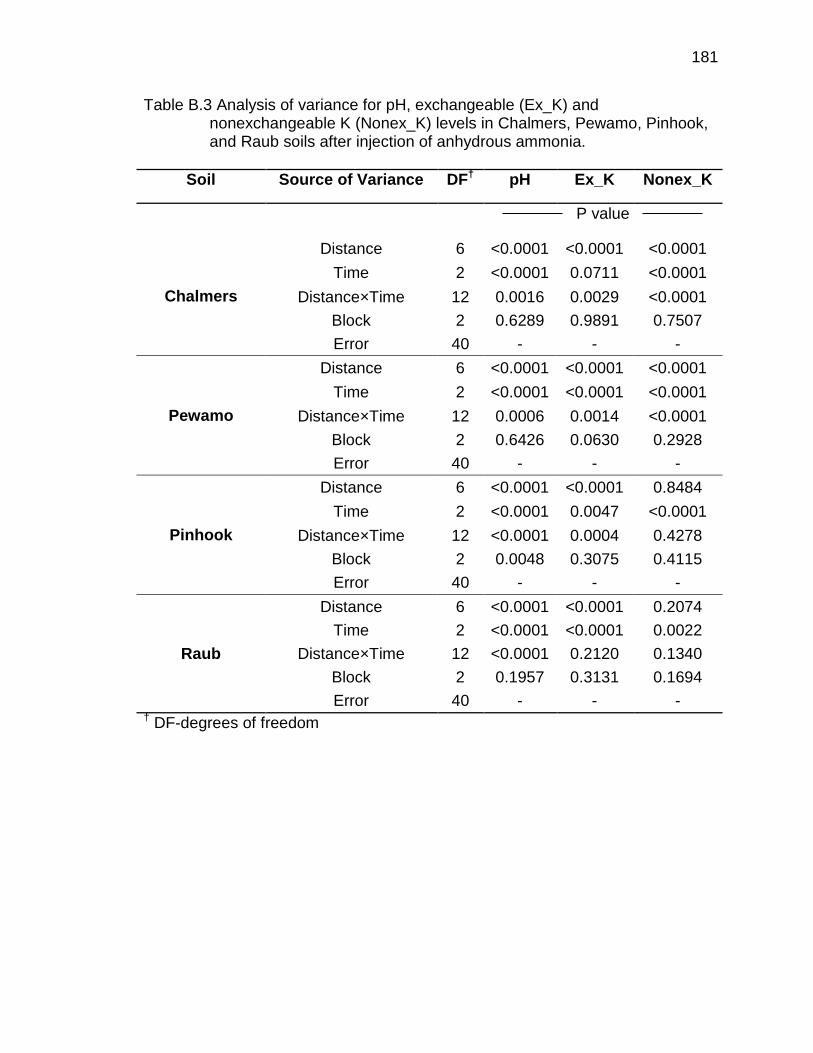
181
Table B.3 Analysis of variance for pH, exchangeable (Ex_K) and nonexchangeable K (Nonex_K) levels in Chalmers, Pewamo, Pinhook, and Raub soils after injection of anhydrous ammonia.
Soil Source of Variance DF† pH Ex_K Nonex_K
P value
Chalmers
Distance 6 <0.0001 <0.0001 <0.0001 Time 2 <0.0001 0.0711 <0.0001
Distance×Time 12 0.0016 0.0029 <0.0001 Block 2 0.6289 0.9891 0.7507 Error 40 - - -
Pewamo
Distance 6 <0.0001 <0.0001 <0.0001 Time 2 <0.0001 <0.0001 <0.0001
Distance×Time 12 0.0006 0.0014 <0.0001 Block 2 0.6426 0.0630 0.2928 Error 40 - - -
Pinhook
Distance 6 <0.0001 <0.0001 0.8484 Time 2 <0.0001 0.0047 <0.0001
Distance×Time 12 <0.0001 0.0004 0.4278 Block 2 0.0048 0.3075 0.4115 Error 40 - - -
Raub
Distance 6 <0.0001 <0.0001 0.2074 Time 2 <0.0001 <0.0001 0.0022
Distance×Time 12 <0.0001 0.2120 0.1340 Block 2 0.1957 0.3131 0.1694 Error 40 - - -
† DF-degrees of freedom

182
Table B.4 Analysis of variance for soil test K levels as affected by drying.
Location Source of Variance DF† Air-dry vs Oven-dry
Moist vs Oven-dry
P value
DPAC
Treat 1 0.4921 0.0064 Sample 19 <0.0001 <0.0001
Treat×Sample 19 0.3857 <0.0001 Block 2 <0.0001 0.0070
Treat×Block 2 <0.0001 0.0080 Error 76 - -
NEPAC
Treat 1 0.3989 0.0184 Sample 16 <0.0001 <0.0001
Treat×Sample 16 0.3498 0.0042 Block 2 0.0046 0.2646
Treat×Block 2 0.0012 0.0409 Error 60 - -
PPAC
Treat 1 0.0132 <0.0001 Sample 18 <0.0001 <0.0001
Treat×Sample 18 0.7879 0.1055 Block 2 0.0314 0.2245
Treat×Block 2 <0.0001 0.0078 Error 70 - -
SEPAC
Treat 1 0.3934 0.4847 Sample 14 <0.0001 <0.0001
Treat×Sample 14 0.1187 0.0157 Block 2 <0.0001 0.0003
Treat×Block 2 0.0001 0.0001 Error 53 - -
TPAC
Treat 1 0.7990 <0.0001 Sample 19 <0.0001 <0.0001
Treat×Sample 19 0.9036 0.1119 Block 2 <0.0001 0.0135
Treat×Block 2 0.0015 0.0306 Error 73
† DF-degrees of freedom

183
Appendix C Soil Water Retention Data
Table C.1 Soil moisture contents at water retentions of 10 kPa, 33 kPa, 50 kPa, and 100 kPa for selected soils (unit: g g-1).
Soil 10 kPa 33 kPa 50 kPa 100 kPa
Blount 0.27 0.25 0.24 0.22
Chalmers 0.31 0.28 0.26 0.23
Cincinnati 0.24 0.21 0.20 0.16
Cobbsfork 0.26 0.23 0.23 0.20
Pewamo 0.34 0.30 0.30 0.24
Pinhook 0.24 0.20 0.18 0.17
Raub 0.27 0.23 0.21 0.18
Tracy 0.20 0.18 0.16 0.14

184
Table C.2 Soil moisture contents at water retention of 10 kPa for selected soils at four depths.
Soil Depth 10 kPa
cm g g-1
Chalmers-Raub 0-15 0.37
15-30 0.39 30-45 0.37 45-60 0.37
Blount-Pewamo 0-15 0.34
15-30 0.36 30-45 0.37 45-60 0.38
Rawson-Haskins 0-15 0.28
15-30 0.27 30-45 0.28 45-60 0.28
Sebewa 0-15 0.31
15-30 0.30 30-45 0.31 45-60 0.30
Cobbsfork 0-15 0.35
15-30 0.33 30-45 0.35 45-60 0.35
Ade-Lyles 0-15 0.20
15-30 0.19 30-45 0.19 45-60 0.18
Toronto 0-15 0.34
15-30 0.35 30-45 0.37 45-60 0.37

VITA

185
VITA
Chun Zhao earned her Bachelor of Science degree in Soil and Agro-
chemistry at Northwest Agriculture and Forestry University in China in 2007. She
started her postgraduate study at Purdue University in August, 2007 to work with
Dr. Brad Joern and Dr. Jim Camberato in the area of Soil Fertility and Chemistry.
She received the Marvin and Barbara Phillips Scholarship as recognition of her
research work. Chun’s interests and enthusiasm in Soil Science not only showed
through her research but also her active involvement in teaching activities. She
assisted in the instruction of the courses AGRY 255 (Introduction to Soil Science)
and AGRY 365 (Soil Fertility) and received the outstanding graduate teaching
award in 2012.