Embed Size (px)
Citation preview
Bioresource Technology 101 (2010) 5712–5718
Contents lists available at ScienceDirect
Bioresource Technology
journal homepage: www.elsevier .com/locate /bior tech
Case Study
Nitrate removal by microbial enhancement in a riparian wetland
Yuansheng Pei a,*, Zhifeng Yang a, Binghui Tian b
a School of Environment, Beijing Normal University, Beijing, Chinab Research Center for Eco-Environmental Sciences, Chinese Academy of Science, Beijing, China
a r t i c l e i n f o
Article history:Received 21 October 2009Received in revised form 31 January 2010Accepted 3 February 2010Available online 3 March 2010
Keywords:Hydraulic efficiencyDenitrification activityBioremediationFunctional microbeRedox potential
0960-8524/$ - see front matter � 2010 Elsevier Ltd. Adoi:10.1016/j.biortech.2010.02.005
* Corresponding author. Address: No. 19, XinjiekouwTel./fax: +86 10 5880 0160.
E-mail address: [email protected] (Y. Pei).
a b s t r a c t
A riparian wetland (RW) was constructed in a river bend to study the effect of the addition of Bacillus sub-tilis FY99-01 on nitrate removal. Nitrate was removed more efficiently in the summer than in the winterowing to integrated hydraulic, microbial and environmental effects. The maximal nitrate removal and themean nitrate loss rate in the RW were 36.1% and 50.5 g/m2/yr, respectively. Statistic analyses indicatedthat the redox potential was very significant to denitrification while organic matter in the outflow, tem-perature and nitrate in the inflow significantly affected nitrate removal. These results suggest that an RWcan be a cost-effective approach to enhance microbial nitrate removal and can potentially be extended tosimilar river bends.
� 2010 Elsevier Ltd. All rights reserved.
1. Introduction
Successful bioremediation is dependent on an interdisciplinaryapproach involving microbiology, chemistry, ecology, geology,hydraulics and engineering (Iwamoto and Nasu, 2001; Watanabe,2002). Microbes have been applied to clean up groundwater, soils,lagoons, sludges, and process-waste streams (Boopathy, 2000)which are either fixed granular media (e.g. Tang et al., 2005) or rel-atively stationary waters (e.g. Anderson and Lovley, 1997). Fewmicrobial applications (e.g. Liu and Yuan, 2008) have been madeto flowing waters (e.g. river) in situ since it is difficult to preventwashing out of the added microbes in flowing waters.
There are contradictory opinions on how to enhance nitrate re-moval by way of improving the hydraulic efficiency in wetlands.On the one hand, Persson and Wittgren (2003) linked the hydraulicefficiency in ponds and similar surface flow wetlands to removal ofnutrients and suspended solids. They stated that the hydraulic res-idence time (HRT) only had a marginal effect on the efficiency ofnitrogen removal. On the other hand, Kjellin et al. (2007) con-cluded that the treatment efficiency strongly depended on the flowpattern and the HRT in wetlands; therefore, the effective volumeratio and degree of mixing that are related to the normal HRTand/or the mean HRT could be used to indicate the nutrient re-moval efficiency of ponds and wetlands.
ll rights reserved.
ai St., Beijing 100875, China.
Prior to sedimentation, filtration, precipitation, volatilization,adsorption and plant uptake, microbial transformation cruciallycontributes to nitrogen removal in wetlands (Kadlec and Knight,1996). Qualitative and quantitative microbial techniques may beapplied to determine the influence of specific microbial speciesor functional groups on nitrogen removal (Coates and Anderson,2000; Pieper and Reineke, 2000; Paul et al., 2005). Nitrogen re-moval is typically associated with specific microbial functionalgroups; thus methodologies that enhance the activity of thosegroups optimize denitrification (Shipin et al., 2005; Faulwetteret al., 2009). Nitrate (NO3–N) may be efficiently removed by bio-films when external organic carbon sources are added (Kesser}uet al., 2003). Culture-based studies have shown that denitrifyingbacteria in the genera Bacillus, Micrococcus and Pseudomonas arethe most common in soils while those belonging to Pseudomonas,Aeromonas and Vibrio are common in aquatic environments (Wada,1993). Bacillus subtilis FY99-01, a denitrifier able to quickly decom-pose organic matter in water and to promote sulfide and NO3–Nreduction was used by Xiong et al. (2003) in prawn breeding pools,and found to decrease NO3–N, hydrogen sulfide, and chemical oxy-gen demand (CODCr) significantly.
Temperature, pH, dissolved oxygen (DO), redox potential (ORP)and CODCr influenced NO3–N removal in wetland (Vymazal, 2007).ORP is considered a broad indicator of microbial diversity andactivity and can be used to optimize growth of functional bacteria(Faulwetter et al., 2009). Low ORP indicates reductive conditionsand that promotes anaerobic processes while high ORP indicatesoxidative conditions and aerobic processes. Low temperaturemay result in inhibition of the microbial activity due to the
Y. Pei et al. / Bioresource Technology 101 (2010) 5712–5718 5713
decrease of bacterial growth and metabolic rates (Mitsch andGosselink, 2000). At an optimal pH of 6–8, denitrification was high(Paul and Clark, 1989), sufficient organic carbon increased denitri-fication in wetlands since denitrifiers basically consist of heteroge-neous bacteria (Lin et al., 2002), and the CODCr/NO3–N ratiostrongly influenced NO3–N reduction (Güven, 2009).
In this study, NO3–N removal enhancement by B. subtilisFY99-01 strains introduced into an artificial riparian wetland(RW) along the Peach River, Guangxi Province, China, was investi-gated. The RW was constructed in a river bend and was designed asan in-stream system by adding control structures to the river itself(Mitsch et al., 2001). The RW was partially enclosed by a cofferdampacked with loess clay with one inlet and outlet for flow diversionof the river. Since B. subtilis was an indigenous microbe in the river,but with lower concentration, more B. subtilis FY99-01 was safelyadded to the RW to further enhance denitrification. The objectivesof this research were to determine the effect of B. subtilis FY99-01addition on NO3–N removal in an RW and to examine the effects ofhydraulic and environmental factors on denitrification in the RW.
2. Methods
2.1. Site description
The field pilot site is at a section of the Peach River in GuangxiProvince, China (Fig. 1a). The average flow velocity of the river is11.6 m3/s, on average. Its riverbed mainly consists of naked stones.A cofferdam made of packed loess clay and providing an in- andoutflow section was constructed along the river bend to separatethe RW from the river (Fig. 1a and b). The RW was either separatedfrom the river by the cofferdam or connected to the river throughthe inlet and the outlet.
The total area was 457 m2, water volume was about 1040 m3,and water depth was 1.5–3.5 m. The cofferdam was 35.0 m longand 2.0 m wide. The weir crest was 0.5 m higher than the normalwater level of the river. The effective width at the inlet was0.50 m, and the maximal and minimal water depth was 0.58 mand 0.29 m, respectively. The outlet had an effective width of0.24 m with a maximal and minimal water depth of 0.85 m and
Fig. 1. The schematic graph of the riparian wetland. (a) Location and arrangement ointroduction of microbes into the wetland.
0.55 m, respectively. Twelve sampling points were arranged(Fig. 1a).
2.2. Hydraulic efficiency tests
A pulse of potassium bromide (KBr) dissolved in water of theRW inlet was used to measure the HRT for four times: July 2006,October 2006, January 2007 and April 2007. Two kilograms ofKBr was dissolved in 20 L of river water and introduced to the inlet.Water samples were taken at the outlet twice a day for the first2 days, at every 4 h intervals for the following 4 days, and thentwice a day for the next 8 days. The bromide concentration in thewater samples was determined by ion chromatography.
The nominal residence time (tn) is defined as the ratio of the to-tal volume (V) to the hydrological load (Q). Since theoretical plugflow condition seldom occurs in natural systems, the mean resi-dence time (tm) is always less than tn. An effective volume ratio(e) is defined as e = tm/tn, which is typically linked to physicaldimensions of ponds or wetlands (Persson and Wittgren, 2003).In addition, the peak time (tp) on the concentration curve can beobserved. Persson and Wittgren (2003) developed a hydraulic effi-ciency factor (k) that equals to tp/tn, which was correlated withboth e and the degree of mixing. In this study, due to complexityof the RW, e and k were applied to determine the hydraulic effi-ciency of the RW.
2.3. Microbial analysis
Microbial communities at all sampling points (Fig. 1a) werecharacterized before the field test on July 5, 2006. Samples were ta-ken at the depth of 0–0.5 m with temperature of 22–27 �C. Thesamples were transferred to sterile glass bottles and kept at 4 �Cfor 2 h. Bacterial counts were obtained as described by Qian andHuang (1999) by plating on beef extract and peptone culture med-ium and incubation at 28 �C. 16S rDNA analysis of individual iso-lates was carried out according to Qian and Huang (1999). Partial16S rDNA gene sequences were obtained using Pf (50-AGA-GTTTGATCCTGGCTCAG-30) and Pr (50-GGTTACCTTGTTACGACTT-30). Positions for Pf and Pr corresponded to 8–27 and 1495–1514
f sampling points; (b) aerial view of the constructing riparian wetland; and (c)
0 50 100 150 200 250 300 350 4000.00
0.05
0.10
0.15
0.20
Nor
mal
ized
con
cent
ratio
n ( c
c 0)
t (h)
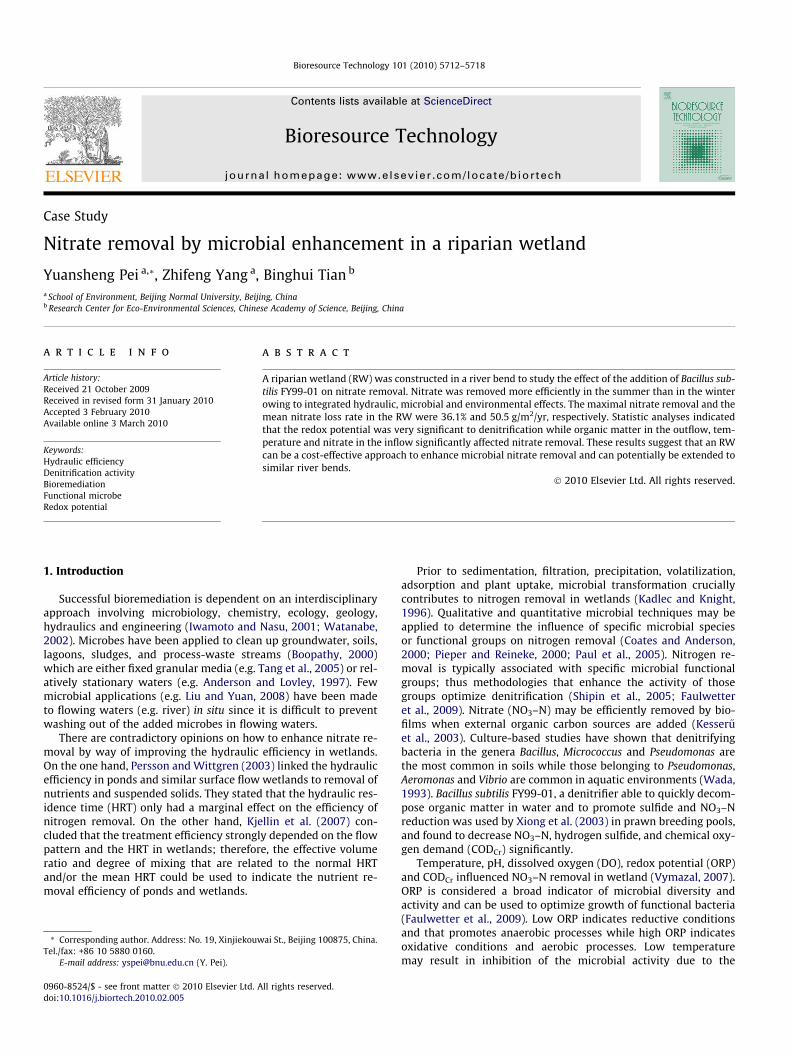
Fig. 2. Normalized tracer (KBr) response curve of the RW in July 2006.
5714 Y. Pei et al. / Bioresource Technology 101 (2010) 5712–5718
bits in Escherichia coli 16S rDNA, respectively. PCR was performedas described by Dong and Cai (2001). Sequencing of the purifiedPCR product was done by the Beijing Sanboyuanzhi Company,and the sequences were compared with existing sequences depos-ited in GenBank through the BLAST program. The clones were clus-tered into operational taxonomic units (OTUs) at a level ofsequence similarity of >97% (McCaig et al., 1999).
B. subtilis FY99-01 (Chinese patent number ZL 142 02147874.0)was cultured in the State Key Laboratory of Agricultural Microbiol-ogy in Central China Agricultural University (Liang et al., 2005) andpreserved in the China Center for Type Culture Collection (CCTCC)with the number of M202045. The strain B. subtilis FY99-01 wasused in both the static test in the laboratory (Section 2.4) andthe dynamic test in the field (Section 2.5). In the static test, bio-mass of the strain was determined by measuring optical density(OD) at 600 nm. In the dynamic test, a part of the strains were la-beled with green fluorescent protein (GFP) as described by Liu(2005). The coding sequence of gfp gene was amplified throughPCR from pAD123, a plasmid which contained the full-length gfpgene fragment. Then the recombinant plasmid pAXc-gfp was con-structed by ligating pAXc and gfp DNA fragments purified fromPCR products. pAXc-gfp was linearized and transformed into B. sub-tilis FY99-01. The linearized plasmid was integrated into the chro-mosome of B. subtilis FY99-01 on lacA locus. B. subtilis FY99-01 withGFP was selected by use of chloramphenicol resistance (5 lg/mL).GFP can be expressed stably even without the existence of antibi-otic (Liu, 2005). The strains with GFP in the RW were determinedby plate count and fluorescent observation (Olympus BX51, Japan).
2.4. Static tests
Denitrification by B. subtilis FY99-01 was tested in the labora-tory in the presence of NO3–N and NO2–N. Peach River water sam-ples containing 16.4–36.6 mg/L CODCr, 3.60–4.78 mg/L ammonium(NH4–N), 2.41–3.11 mg/L NO3–N and 0.077–0.081 mg/L NO2–Nwith pH of 6.2–7.2 were filtered with absorbent cotton, placed in500-mL serum bottles with 3.02 mg/L NO3–N and 2.54 mg/LNO2–N and inoculated with 107 cfu/L B. subtilis FY99-01. NO3–Nand NO2–N concentrations were measured every 2 h and comparedwith those of control water samples without inoculum. After com-plete removal of NO3–N and NO2–N, 16 mg KNO3 was added forfurther determination of the denitrification activity of the strainin the period of endogenous respiration.
Effects of carbon and nitrate on NO3–N removal were tested atC/N ratios of 4:1, 5:1, 6:1, 7:1, 8:1 and 9:1 by addition of eitherKNO3 or sodium citrate to the filtered samples with inoculums of1.0 � 107 cfu/L. The concentrations of NO3–N and NO2–N weremeasured after 36 h to determine the optimal C/N ratio. In addi-tion, NO3–N removal was measured for inoculums levels of 104,105, 106, 107, 108 and 109 cfu/L at a C/N ratio of 7:1.
2.5. Dynamic tests
Two sets of field tests were conducted to determine the efficien-cies of NO3–N removal in the RW from July 23 to September 21 in2006 and from January 8 to February 17 in 2007. The strains of B.subtilis FY99-01 with and without GFP were provided by the StateKey Laboratory of Agricultural Microbiology in Central China Agri-cultural University. The inoculums were yellow powders contain-ing 2.0 � 1010 B. subtilus FY99-01 spores/g. About 3 kg of thepowders containing 30 g strains labeled with GFP were mixed with25 L of water and 2.5 kg sugar in a 50-L plastic drum. The suspen-sion was released into the RW after 2 h (Fig. 1c). The strains withGFP in the RW were determined by plate count and fluorescentobservation. The observed value was enlarged by 100 times toapproximate the strain counts in the RW. The average concentra-
tion of the strain in the RW was up to 5.77 � 107 cfu/L. Afterwards,the strain was regularly supplied to the RW as 107 cfu/L once thecounts were less than 5 � 105 cfu/L. During the 60-day test periodin the summer, a total of 21 kg of the spore preparations was addedto the RW in 12 batches. In the winter (41 days), a total of 32 kgwas added in 17 batches.
CODCr, NH4–N, NO3–N and NO2–N concentrations were ana-lysed according to standard methods (APHA, 1999). DO was mon-itored using a DO probe (YSI 5905, USA); however, since DOreadings become unreliable at extremely low DO in anoxic andanaerobic conditions (Bishop and Li, 2004). ORP was monitoredas an alternative parameter. ORP, pH and temperature were de-tected using a pH/Oxi 340i handheld meter (WTW, Germany). Inconjunction with the SenTix ORP electrode, the meter directlymeasured the ORP voltage (mV) of water in the RW.
2.6. Statistic analysis
Stepwise linear regression (SLE) (SPSS 16.0 for Windows) wasused to analyse the effects of different environmental factors onNO3–N removal in situ. The dependent variable was the NO3–N re-moval rate. The independent variables included CODCr, NO3–N,ORP and DO at the inlet, CODCr, ORP and DO at the outlet, pH,and temperature. The NO3–N removal rate could be predicted fromone or more of the independent variables. The differences wereconsidered significant at P < 0.05.
3. Results and discussion
3.1. Hydraulic efficiencies of the RW
In July 2006, the average flow velocity and water flow throughthe inlet were 5.6 � 10�3 m/s and 130.65 m3/day, respectively. Thenominal HRT was 191 h and the nominal ratio of water exchangewas 12.6% per day. The normalized tracer response curve for thewater flow in the RW in July 2006 is shown in Fig. 2. The tracerconcentration in the outflow rapidly reached the maximum valueat 108 h and then gradually decreased. The peak was clearly ob-served in the tracer test. The mean HRT of water in the RW was147 h and the corresponding water volume for active flow was798 m3, equal to 76.8% of the total volume. The hydraulic efficiencyfactor was 0.565.
Tracer tests in different seasons are summarized in Table 1. Un-der a low hydraulic load in January 2007, the nominal HRT and themean HRT increased significantly while the peak time slightly in-creased. It was interesting that the effective volume ratio was still
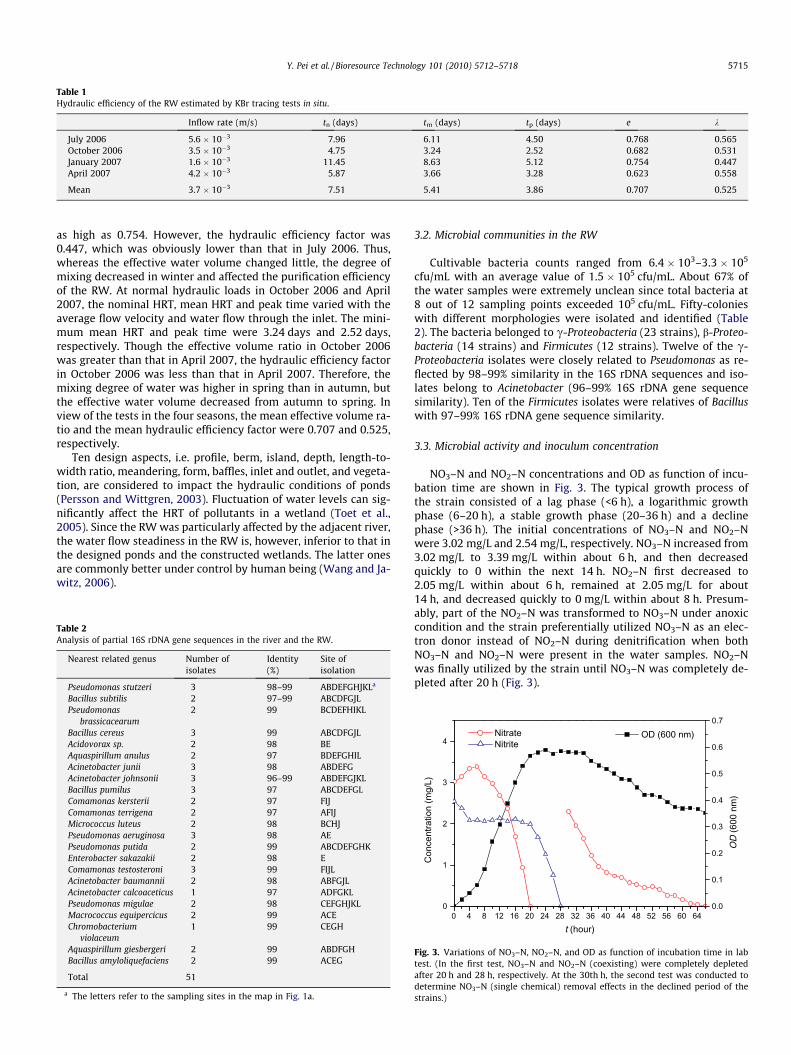
Table 1Hydraulic efficiency of the RW estimated by KBr tracing tests in situ.
Inflow rate (m/s) tn (days) tm (days) tp (days) e k
July 2006 5.6 � 10�3 7.96 6.11 4.50 0.768 0.565October 2006 3.5 � 10�3 4.75 3.24 2.52 0.682 0.531January 2007 1.6 � 10�3 11.45 8.63 5.12 0.754 0.447April 2007 4.2 � 10�3 5.87 3.66 3.28 0.623 0.558
Mean 3.7 � 10�3 7.51 5.41 3.86 0.707 0.525
Y. Pei et al. / Bioresource Technology 101 (2010) 5712–5718 5715
as high as 0.754. However, the hydraulic efficiency factor was0.447, which was obviously lower than that in July 2006. Thus,whereas the effective water volume changed little, the degree ofmixing decreased in winter and affected the purification efficiencyof the RW. At normal hydraulic loads in October 2006 and April2007, the nominal HRT, mean HRT and peak time varied with theaverage flow velocity and water flow through the inlet. The mini-mum mean HRT and peak time were 3.24 days and 2.52 days,respectively. Though the effective volume ratio in October 2006was greater than that in April 2007, the hydraulic efficiency factorin October 2006 was less than that in April 2007. Therefore, themixing degree of water was higher in spring than in autumn, butthe effective water volume decreased from autumn to spring. Inview of the tests in the four seasons, the mean effective volume ra-tio and the mean hydraulic efficiency factor were 0.707 and 0.525,respectively.
Ten design aspects, i.e. profile, berm, island, depth, length-to-width ratio, meandering, form, baffles, inlet and outlet, and vegeta-tion, are considered to impact the hydraulic conditions of ponds(Persson and Wittgren, 2003). Fluctuation of water levels can sig-nificantly affect the HRT of pollutants in a wetland (Toet et al.,2005). Since the RW was particularly affected by the adjacent river,the water flow steadiness in the RW is, however, inferior to that inthe designed ponds and the constructed wetlands. The latter onesare commonly better under control by human being (Wang and Ja-witz, 2006).
Table 2Analysis of partial 16S rDNA gene sequences in the river and the RW.
Nearest related genus Number ofisolates
Identity(%)
Site ofisolation
Pseudomonas stutzeri 3 98–99 ABDEFGHJKLa
Bacillus subtilis 2 97–99 ABCDFGJLPseudomonas
brassicacearum2 99 BCDEFHIKL
Bacillus cereus 3 99 ABCDFGJLAcidovorax sp. 2 98 BEAquaspirillum anulus 2 97 BDEFGHILAcinetobacter junii 3 98 ABDEFGAcinetobacter johnsonii 3 96–99 ABDEFGJKLBacillus pumilus 3 97 ABCDEFGLComamonas kersterii 2 97 FIJComamonas terrigena 2 97 AFIJMicrococcus luteus 2 98 BCHJPseudomonas aeruginosa 3 98 AEPseudomonas putida 2 99 ABCDEFGHKEnterobacter sakazakii 2 98 EComamonas testosteroni 3 99 FIJLAcinetobacter baumannii 2 98 ABFGJLAcinetobacter calcoaceticus 1 97 ADFGKLPseudomonas migulae 2 98 CEFGHJKLMacrococcus equipercicus 2 99 ACEChromobacterium
violaceum1 99 CEGH
Aquaspirillum giesbergeri 2 99 ABDFGHBacillus amyloliquefaciens 2 99 ACEG
Total 51
a The letters refer to the sampling sites in the map in Fig. 1a.
3.2. Microbial communities in the RW
Cultivable bacteria counts ranged from 6.4 � 103–3.3 � 105
cfu/mL with an average value of 1.5 � 105 cfu/mL. About 67% ofthe water samples were extremely unclean since total bacteria at8 out of 12 sampling points exceeded 105 cfu/mL. Fifty-colonieswith different morphologies were isolated and identified (Table2). The bacteria belonged to c-Proteobacteria (23 strains), b-Proteo-bacteria (14 strains) and Firmicutes (12 strains). Twelve of the c-Proteobacteria isolates were closely related to Pseudomonas as re-flected by 98–99% similarity in the 16S rDNA sequences and iso-lates belong to Acinetobacter (96–99% 16S rDNA gene sequencesimilarity). Ten of the Firmicutes isolates were relatives of Bacilluswith 97–99% 16S rDNA gene sequence similarity.
3.3. Microbial activity and inoculum concentration
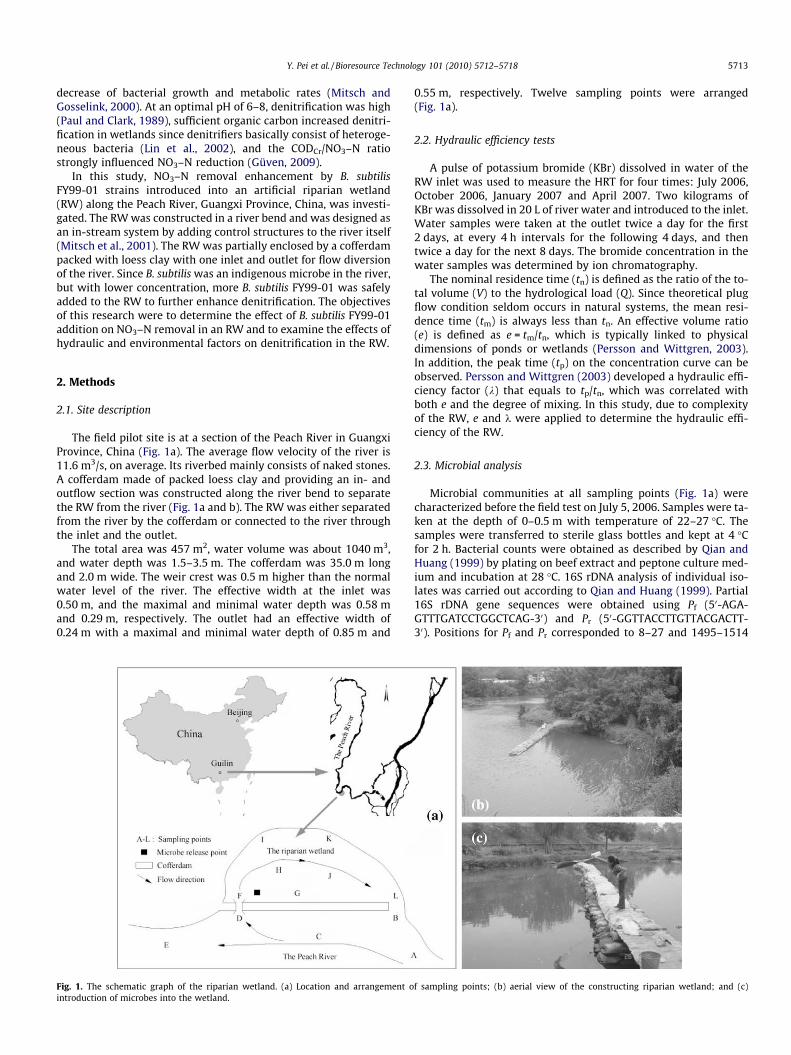
NO3–N and NO2–N concentrations and OD as function of incu-bation time are shown in Fig. 3. The typical growth process ofthe strain consisted of a lag phase (<6 h), a logarithmic growthphase (6–20 h), a stable growth phase (20–36 h) and a declinephase (>36 h). The initial concentrations of NO3–N and NO2–Nwere 3.02 mg/L and 2.54 mg/L, respectively. NO3–N increased from3.02 mg/L to 3.39 mg/L within about 6 h, and then decreasedquickly to 0 within the next 14 h. NO2–N first decreased to2.05 mg/L within about 6 h, remained at 2.05 mg/L for about14 h, and decreased quickly to 0 mg/L within about 8 h. Presum-ably, part of the NO2–N was transformed to NO3–N under anoxiccondition and the strain preferentially utilized NO3–N as an elec-tron donor instead of NO2–N during denitrification when bothNO3–N and NO2–N were present in the water samples. NO2–Nwas finally utilized by the strain until NO3–N was completely de-pleted after 20 h (Fig. 3).
0 4 8 12 16 20 24 28 32 36 40 44 48 52 56 60 640.0
0.1
0.2
0.3
0.4
0.5
0.6
0.7
0
1
2
3
4O
D (6
00 n
m)
OD (600 nm)
Con
cent
ratio
n (m
g/L)
t (hour)
Nitrate Nitrite
Fig. 3. Variations of NO3–N, NO2–N, and OD as function of incubation time in labtest. (In the first test, NO3–N and NO2–N (coexisting) were completely depletedafter 20 h and 28 h, respectively. At the 30th h, the second test was conducted todetermine NO3–N (single chemical) removal effects in the declined period of thestrains.)
0 10 20 30 40 50 601.50
1.75
2.00
2.25
2.50
2.75
3.00
3.25
3.50
3.75
0
10
20
30
40
Nitr
ate
conc
entr
atio
n (m
g/L)
t (d)
Inlet Outlet
(b)
Nita
te r
emov
al r
atio
(%
)
Nitrate removal ratio
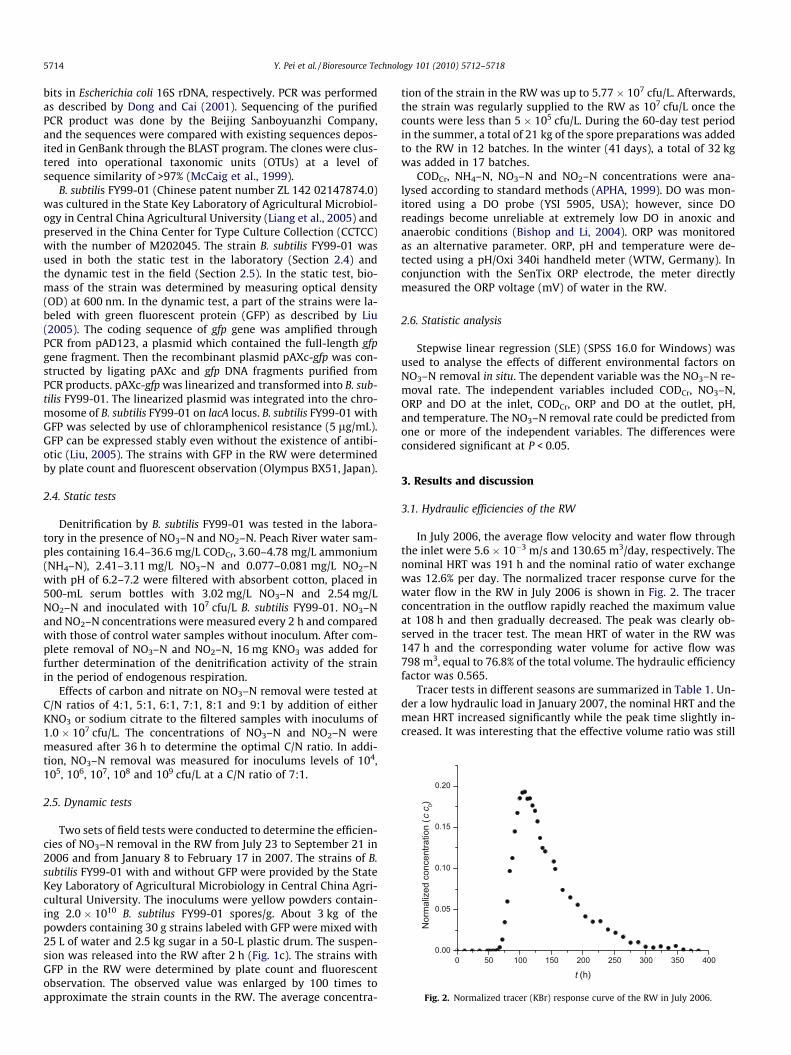
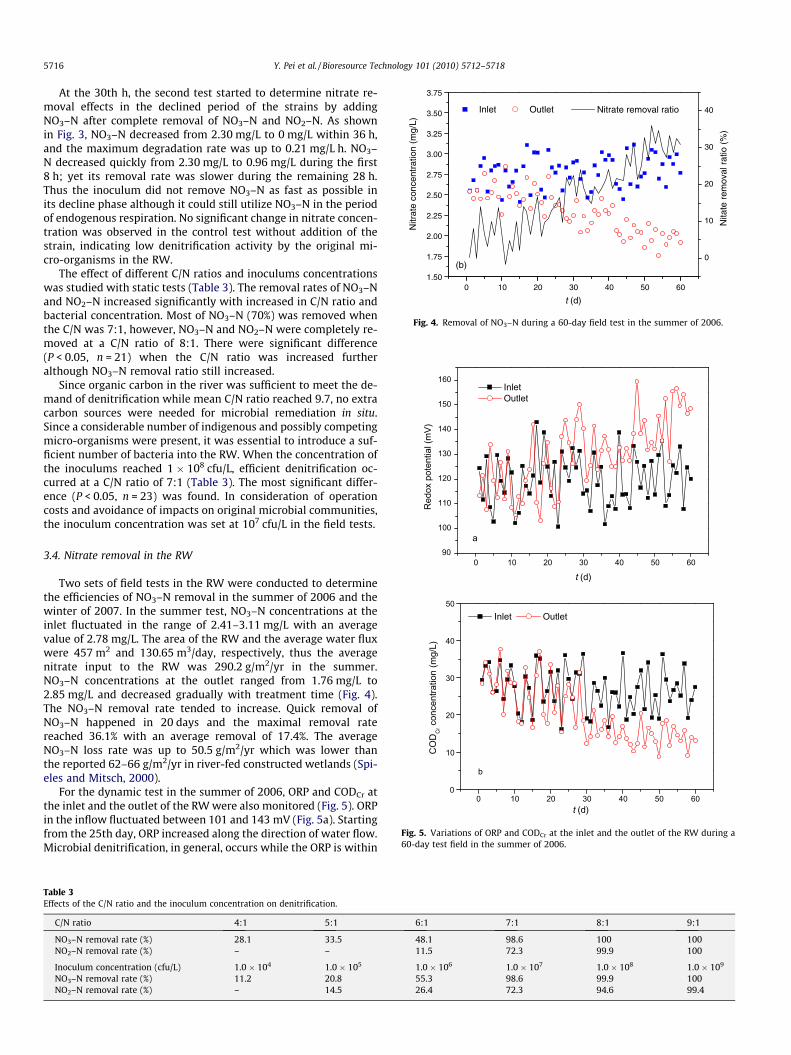
Fig. 4. Removal of NO3–N during a 60-day field test in the summer of 2006.
0 10 20 30 40 50 6090
100
110
120
130
140
150
160
a
Red
ox p
oten
tial (
mV)
t (d)
Inlet Outlet
0 10 20 30 40 50 600
10
20
30
40
50
t (d)
b
CO
DC
r con
cent
ratio
n (m
g/L)
Inlet Outlet
Fig. 5. Variations of ORP and CODCr at the inlet and the outlet of the RW during a60-day test field in the summer of 2006.
5716 Y. Pei et al. / Bioresource Technology 101 (2010) 5712–5718
At the 30th h, the second test started to determine nitrate re-moval effects in the declined period of the strains by addingNO3–N after complete removal of NO3–N and NO2–N. As shownin Fig. 3, NO3–N decreased from 2.30 mg/L to 0 mg/L within 36 h,and the maximum degradation rate was up to 0.21 mg/L h. NO3–N decreased quickly from 2.30 mg/L to 0.96 mg/L during the first8 h; yet its removal rate was slower during the remaining 28 h.Thus the inoculum did not remove NO3–N as fast as possible inits decline phase although it could still utilize NO3–N in the periodof endogenous respiration. No significant change in nitrate concen-tration was observed in the control test without addition of thestrain, indicating low denitrification activity by the original mi-cro-organisms in the RW.
The effect of different C/N ratios and inoculums concentrationswas studied with static tests (Table 3). The removal rates of NO3–Nand NO2–N increased significantly with increased in C/N ratio andbacterial concentration. Most of NO3–N (70%) was removed whenthe C/N was 7:1, however, NO3–N and NO2–N were completely re-moved at a C/N ratio of 8:1. There were significant difference(P < 0.05, n = 21) when the C/N ratio was increased furtheralthough NO3–N removal ratio still increased.
Since organic carbon in the river was sufficient to meet the de-mand of denitrification while mean C/N ratio reached 9.7, no extracarbon sources were needed for microbial remediation in situ.Since a considerable number of indigenous and possibly competingmicro-organisms were present, it was essential to introduce a suf-ficient number of bacteria into the RW. When the concentration ofthe inoculums reached 1 � 108 cfu/L, efficient denitrification oc-curred at a C/N ratio of 7:1 (Table 3). The most significant differ-ence (P < 0.05, n = 23) was found. In consideration of operationcosts and avoidance of impacts on original microbial communities,the inoculum concentration was set at 107 cfu/L in the field tests.
3.4. Nitrate removal in the RW
Two sets of field tests in the RW were conducted to determinethe efficiencies of NO3–N removal in the summer of 2006 and thewinter of 2007. In the summer test, NO3–N concentrations at theinlet fluctuated in the range of 2.41–3.11 mg/L with an averagevalue of 2.78 mg/L. The area of the RW and the average water fluxwere 457 m2 and 130.65 m3/day, respectively, thus the averagenitrate input to the RW was 290.2 g/m2/yr in the summer.NO3–N concentrations at the outlet ranged from 1.76 mg/L to2.85 mg/L and decreased gradually with treatment time (Fig. 4).The NO3–N removal rate tended to increase. Quick removal ofNO3–N happened in 20 days and the maximal removal ratereached 36.1% with an average removal of 17.4%. The averageNO3–N loss rate was up to 50.5 g/m2/yr which was lower thanthe reported 62–66 g/m2/yr in river-fed constructed wetlands (Spi-eles and Mitsch, 2000).
For the dynamic test in the summer of 2006, ORP and CODCr atthe inlet and the outlet of the RW were also monitored (Fig. 5). ORPin the inflow fluctuated between 101 and 143 mV (Fig. 5a). Startingfrom the 25th day, ORP increased along the direction of water flow.Microbial denitrification, in general, occurs while the ORP is within
Table 3Effects of the C/N ratio and the inoculum concentration on denitrification.
C/N ratio 4:1 5:1 6:1 7:1 8:1 9:1
NO3–N removal rate (%) 28.1 33.5 48.1 98.6 100 100NO2–N removal rate (%) – – 11.5 72.3 99.9 100
Inoculum concentration (cfu/L) 1.0 � 104 1.0 � 105 1.0 � 106 1.0 � 107 1.0 � 108 1.0 � 109
NO3–N removal rate (%) 11.2 20.8 55.3 98.6 99.9 100NO2–N removal rate (%) – 14.5 26.4 72.3 94.6 99.4
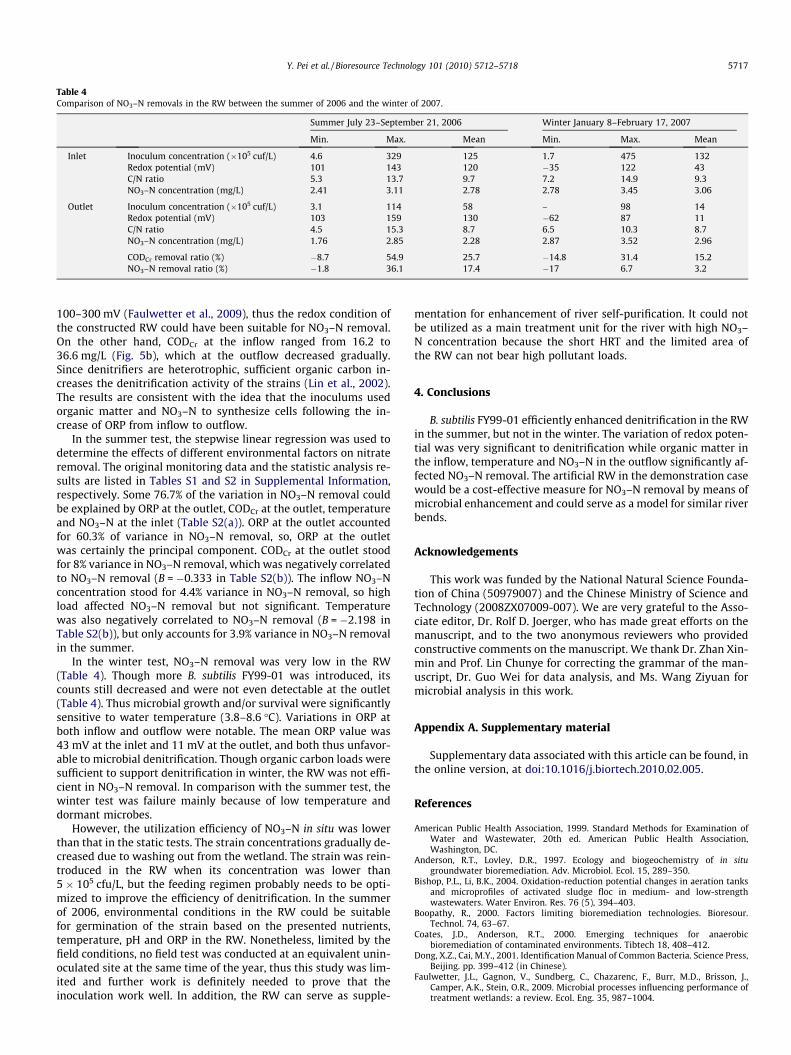
Table 4Comparison of NO3–N removals in the RW between the summer of 2006 and the winter of 2007.
Summer July 23–September 21, 2006 Winter January 8–February 17, 2007
Min. Max. Mean Min. Max. Mean
Inlet Inoculum concentration (�105 cuf/L) 4.6 329 125 1.7 475 132Redox potential (mV) 101 143 120 �35 122 43C/N ratio 5.3 13.7 9.7 7.2 14.9 9.3NO3–N concentration (mg/L) 2.41 3.11 2.78 2.78 3.45 3.06
Outlet Inoculum concentration (�105 cuf/L) 3.1 114 58 – 98 14Redox potential (mV) 103 159 130 �62 87 11C/N ratio 4.5 15.3 8.7 6.5 10.3 8.7NO3–N concentration (mg/L) 1.76 2.85 2.28 2.87 3.52 2.96
CODCr removal ratio (%) �8.7 54.9 25.7 �14.8 31.4 15.2NO3–N removal ratio (%) �1.8 36.1 17.4 �17 6.7 3.2
Y. Pei et al. / Bioresource Technology 101 (2010) 5712–5718 5717
100–300 mV (Faulwetter et al., 2009), thus the redox condition ofthe constructed RW could have been suitable for NO3–N removal.On the other hand, CODCr at the inflow ranged from 16.2 to36.6 mg/L (Fig. 5b), which at the outflow decreased gradually.Since denitrifiers are heterotrophic, sufficient organic carbon in-creases the denitrification activity of the strains (Lin et al., 2002).The results are consistent with the idea that the inoculums usedorganic matter and NO3–N to synthesize cells following the in-crease of ORP from inflow to outflow.
In the summer test, the stepwise linear regression was used todetermine the effects of different environmental factors on nitrateremoval. The original monitoring data and the statistic analysis re-sults are listed in Tables S1 and S2 in Supplemental Information,respectively. Some 76.7% of the variation in NO3–N removal couldbe explained by ORP at the outlet, CODCr at the outlet, temperatureand NO3–N at the inlet (Table S2(a)). ORP at the outlet accountedfor 60.3% of variance in NO3–N removal, so, ORP at the outletwas certainly the principal component. CODCr at the outlet stoodfor 8% variance in NO3–N removal, which was negatively correlatedto NO3–N removal (B = �0.333 in Table S2(b)). The inflow NO3–Nconcentration stood for 4.4% variance in NO3–N removal, so highload affected NO3–N removal but not significant. Temperaturewas also negatively correlated to NO3–N removal (B = �2.198 inTable S2(b)), but only accounts for 3.9% variance in NO3–N removalin the summer.
In the winter test, NO3–N removal was very low in the RW(Table 4). Though more B. subtilis FY99-01 was introduced, itscounts still decreased and were not even detectable at the outlet(Table 4). Thus microbial growth and/or survival were significantlysensitive to water temperature (3.8–8.6 �C). Variations in ORP atboth inflow and outflow were notable. The mean ORP value was43 mV at the inlet and 11 mV at the outlet, and both thus unfavor-able to microbial denitrification. Though organic carbon loads weresufficient to support denitrification in winter, the RW was not effi-cient in NO3–N removal. In comparison with the summer test, thewinter test was failure mainly because of low temperature anddormant microbes.
However, the utilization efficiency of NO3–N in situ was lowerthan that in the static tests. The strain concentrations gradually de-creased due to washing out from the wetland. The strain was rein-troduced in the RW when its concentration was lower than5 � 105 cfu/L, but the feeding regimen probably needs to be opti-mized to improve the efficiency of denitrification. In the summerof 2006, environmental conditions in the RW could be suitablefor germination of the strain based on the presented nutrients,temperature, pH and ORP in the RW. Nonetheless, limited by thefield conditions, no field test was conducted at an equivalent unin-oculated site at the same time of the year, thus this study was lim-ited and further work is definitely needed to prove that theinoculation work well. In addition, the RW can serve as supple-
mentation for enhancement of river self-purification. It could notbe utilized as a main treatment unit for the river with high NO3–N concentration because the short HRT and the limited area ofthe RW can not bear high pollutant loads.
4. Conclusions
B. subtilis FY99-01 efficiently enhanced denitrification in the RWin the summer, but not in the winter. The variation of redox poten-tial was very significant to denitrification while organic matter inthe inflow, temperature and NO3–N in the outflow significantly af-fected NO3–N removal. The artificial RW in the demonstration casewould be a cost-effective measure for NO3–N removal by means ofmicrobial enhancement and could serve as a model for similar riverbends.
Acknowledgements
This work was funded by the National Natural Science Founda-tion of China (50979007) and the Chinese Ministry of Science andTechnology (2008ZX07009-007). We are very grateful to the Asso-ciate editor, Dr. Rolf D. Joerger, who has made great efforts on themanuscript, and to the two anonymous reviewers who providedconstructive comments on the manuscript. We thank Dr. Zhan Xin-min and Prof. Lin Chunye for correcting the grammar of the man-uscript, Dr. Guo Wei for data analysis, and Ms. Wang Ziyuan formicrobial analysis in this work.
Appendix A. Supplementary material
Supplementary data associated with this article can be found, inthe online version, at doi:10.1016/j.biortech.2010.02.005.
References
American Public Health Association, 1999. Standard Methods for Examination ofWater and Wastewater, 20th ed. American Public Health Association,Washington, DC.
Anderson, R.T., Lovley, D.R., 1997. Ecology and biogeochemistry of in situgroundwater bioremediation. Adv. Microbiol. Ecol. 15, 289–350.
Bishop, P.L., Li, B.K., 2004. Oxidation-reduction potential changes in aeration tanksand microprofiles of activated sludge floc in medium- and low-strengthwastewaters. Water Environ. Res. 76 (5), 394–403.
Boopathy, R., 2000. Factors limiting bioremediation technologies. Bioresour.Technol. 74, 63–67.
Coates, J.D., Anderson, R.T., 2000. Emerging techniques for anaerobicbioremediation of contaminated environments. Tibtech 18, 408–412.
Dong, X.Z., Cai, M.Y., 2001. Identification Manual of Common Bacteria. Science Press,Beijing. pp. 399–412 (in Chinese).
Faulwetter, J.L., Gagnon, V., Sundberg, C., Chazarenc, F., Burr, M.D., Brisson, J.,Camper, A.K., Stein, O.R., 2009. Microbial processes influencing performance oftreatment wetlands: a review. Ecol. Eng. 35, 987–1004.
5718 Y. Pei et al. / Bioresource Technology 101 (2010) 5712–5718
Güven, D., 2009. Effects of different carbon sources on denitrification efficiencyassociated with culture adaptation and C/N ratio. Clean-Soil Air Water 37 (7),565–573.
Iwamoto, T., Nasu, M., 2001. Current bioremediation practice and perspective. J.Biosci. Bioeng. 92 (1), 1–8.
Kadlec, R.H., Knight, R.L., 1996. Treatment Wetlands. Lewis Publishers, Boca Raton.pp. 893.
Kesser}u, P., Kiss, I., Bihari, Z., Polyák, B., 2003. Biological denitrification in acontinuous-flow pilot bioreactor containing immobilized Pseudomonasbutanovora cells. Bioresour. Technol. 87, 75–80.
Kjellin, J., Wörman, A., Johansson, H., Lindahl, A., 2007. Controlling factors for waterresidence time and flow patterns in Ekeby treatment wetland, Sweden. Adv.Water Resour. 30, 838–850.
Liang, Y.X., Ge, X.Y., Hu, Y.M., Li, X.X., Gong, S.C., Yan, C.T., Tian, H.Z., Wang, J., Yin, X.,Chen, Z.J., Mei, Y.X., 2005. Water-Purifying Bacillus subtilis, Bacterial Agent andSolid Fermenting Process and Use. State Intellectual Property Office of thePeople’s Republic of China. Chinese Patent Number: ZL 02147874.0.
Lin, Y.F., Jing, S.R., Wang, T.W., Lee, D.Y., 2002. Effects of macrophytes and externalcarbon sources on nitrate removal from groundwater in constructed wetlands.Environ. Pollut. 119, 420–423.
Liu, F., 2005. Research on Labeling Bacillus subtilis with Green Fluorescent Proteinand its Application in Water Bioremediation. Graduation Thesis. HuaZhongAgric. Univ. (in Chinese).
Liu, Q., Yuan, G., 2008. Application of microorganism water treatment agent inflowing water treatment. J. Huazhong Univ. Sci. Technol. (Urban Sci. Ed.) 25 (1),82–84 (in Chinese).
McCaig, A.E., Glover, L.A., Prosser, J.I., 1999. Molecular analysis of bacterialcommunity structure and diversity in unimproved and improved uplandgrass pastures. Appl. Environ. Microbiol. 65 (4), 1721–1730.
Mitsch, W.J., Day, J.W., Gilliam Jr., J.W., Groffman, P.M., Hey, D.L., Randall, G.W.,Wang, N.M., 2001. Reducing nitrogen loading to the Gulf of Mexico from theMississippi River Basin: strategies to counter a persistent ecological problem.Bioscience 51 (5), 373–388.
Mitsch, W.J., Gosselink, J.G., 2000. Wetlands, third ed. Van Nostrand Reinhold Co.,NewYork, USA.
Paul, D., Pandey, G., Pandey, J., Jain, R.K., 2005. Accessing microbial diversity forbioremediation and environmental restoration. Trends Biotechnol. 23 (3), 135–142.
Paul, E.A., Clark, F.E., 1989. Soil Microbiology and Biochemistry. Academic Press,Inc., San Diego, CA, USA.
Persson, J., Wittgren, H.B., 2003. How hydrological and hydraulic conditions affectperformance of ponds. Ecol. Eng. 21, 259–269.
Pieper, D.H., Reineke, W., 2000. Engineering bacteria for bioremediation. Curr. Opin.Biotechnol. 11, 262–270.
Qian, C.R., Huang, Y.X., 1999. Laboratory Experiments in Microbiology. BeijingUniversity Press, Beijing (in Chinese).
Shipin, O., Kootatep, T., Khanh, N.T.T., Polprasert, C., 2005. Integrated naturaltreatment systems for developing communities: low-tech N-removal throughthe fluctuating microbial pathways. Water Sci. Technol. 51, 299–306.
Spieles, D.J., Mitsch, W.J., 2000. The effects of season and hydrologic and chemicalloading on nitrate retention in constructed wetlands: a comparison of low- andhigh-nutrient riverine systems. Ecol. Eng. 14, 77–91.
Tang, Y.J., Carpenter, S., Deming, J., Krieger-Brockett, B., 2005. Controlled release ofnitrate and sulfate to enhance anaerobic bioremediation of phenanthrene inmarine sediments. Environ. Sci. Technol. 39 (9), 3368–3373.
Toet, S., Van Logtestijn, R.S.P., Kampf, R., Schreijer, M., Verhoeven, J.T.A., 2005. Theeffect of hydraulic retention time on the removal of pollutants from sewagetreatment plant effluent in a surface-flow wetland system. Wetlands 25, 375–391.
Vymazal, J., 2007. Removal of nutrients in various types of constructed wetlands.Sci. Total Environ. 380, 48–65.
Wada, M., 1993. Relationship between water pollution and bacterial flora in riverwater. Nippon Eiseigaku Zasshi 48 (3), 707–720.
Wang, H.G., Jawitz, J.W., 2006. Hydraulic analysis of cell-network treatmentwetlands. J. Hydrol. 330, 721–734.
Watanabe, K., 2002. Linking genetics, physiology and ecology: an interdisciplinaryapproach for advancing bioremediation. J. Biosci. Bioeng. 94 (6), 557–562.
Xiong, W., Liang, Y.X., Dai, J.Y., Li, X.X., 2003. Research on the role of Bacillus subtilisin purifying Penaeus monodon mariculture water. J. Huazhong Agric. Univ. 22(3), 247–250 (in Chinese).