Embed Size (px)
Citation preview
Abstract A total of 910 maritime pine (Pinus pinaster Aiton) wood discs,belonging to a genetic trial of 80 families with 11–12 trees per family, wereused in this study. A near infrared (NIR) partial least squares regression(PLSR) model for the prediction of Kappa number of Pinus pinaster Aitonpulps obtained from samples pulped under identical conditions was calculated.Very good correlations between NIR spectra of maritime pine pulps andKappa numbers in the range from 58 to 100 were obtained. Besides the rawspectra, spectra pre-processed with ten methods were used for PLS analysis(cross validation with 57 samples), showing that even after test set validation(with 34 samples) no model decision could be made due to almost identicalstatistics. The final evaluation that proved the predictive power of the modelsby predicting pulps with unknown Kappa numbers allowed choosing a model
A. Alves Æ A. Santos Æ J. Rodrigues (&) Æ H. PereiraCentro de Estudos Florestais, Instituto Superior de Agronomia,Universidade Tecnica de Lisboa, Tapada da Ajuda, 1349-017 Lisboa, Portugale-mail: [email protected]
R. Simoes Æ A. SantosResearch Unit of Textile and Paper Materials, Universidade da Beira Interior,6201-001 Covilha, Portugal
D. da Silva PerezLaboratoire Bois Process, Afocel, Domaine Universitaire,BP 251, 38044 Grenoble Cedex, France
J. Rodrigues Æ H. PereiraTropical Research Institute of Portugal (IICT), Forest and Forest Products Centre,Tapada da Ajuda, 1349-017 Lisboa, Portugal
M. SchwanningerDepartment of Chemistry, BOKU-University of Natural Resourcesand Applied Life Sciences, Vienna, Muthgasse 18, 1190 Vienna, Austria
123
Wood Sci Technol (2007) 41:491–499DOI 10.1007/s00226-007-0130-0
ORI GI N A L
NIR PLSR model selection for Kappa numberprediction of maritime pine Kraft pulps
Ana Alves Æ Antonio Santos Æ Denilson da Silva Perez ÆJose Rodrigues Æ Helena Pereira Æ Rogerio Simoes ÆManfred Schwanninger
Received: 13 July 2006 / Published online: 14 March 2007� Springer-Verlag 2007
according to a minimal number of outliers found during this process. Theminimum–maximum normalized spectra in the wave number range from 6,110to 5,440 cm–1 used for the calculation gave the best model with a root meansquare error of prediction of 2.3 units of Kappa number, a coefficient ofdetermination of 95.9%, and one PLS component. The percentage of outliersduring evaluation was 0.9%.
Introduction
The surface covered by maritime pine (Pinus pinaster Aiton) in Portugal andFrance together is about 2 million hectares. Around 4 million tons are con-sumed for pulp production every year (CELPA 2004; da Silva Perez et al.2005).
The assessment of wood quality and its improvement are importantobjectives of many tree-breeding programs. Improvement of wood quality canonly be achieved by testing large numbers of trees, and for many pulpwoodquality traits this is not practical unless rapid cost-effective methods of mea-surement exist.
Kappa number determination is an indirect method for estimating theremaining lignin content in the pulp being an important measure of pulpwoodquality and an indicator of the degree of delignification and bleachability(Shin et al. 2004). The determination of the Kappa number with standardmethods is impractical when a large number of samples have to be evaluated.
Near infrared (NIR) spectroscopic techniques (Schimleck et al. 1997) wereshown to be powerful and rapid tools for the determination of wood com-ponents (Easty et al. 1990; Schultz and Burns 1990; Wright et al. 1990;Wallbacks et al. 1991; Michell 1995; Olsson et al. 1995; Hauksson et al. 2001;Schwanninger and Hinterstoisser 2001; Kelley et al. 2004; So et al. 2004; Sykeset al. 2005). Absorption bands observed in reflectance spectra of wood arisefrom overtones and combinations of vibrations of C–O, O–H, C–H, and N–Hbonds. In NIR spectroscopy, the problem of multiple overlapping peaks canbe handled through multivariate statistics and linear combinations of spectraldata. Being an indirect method NIR spectroscopy needs calibration: therelation between a spectral data set and known data of a set of samples(calibration data set) has to be established, which further has to be validated(test data set). Partial least squares regression (PLSR) is used to generateprediction models for e.g., wood (pulp) properties and NIR spectra.
Near infrared spectroscopy was already used for the determination of pulpyield (Schimleck and French 2002; Hodge and Woodbridge 2004; Schimlecket al. 2005), Kappa number determination of hardwood pulps (Michell 1995;Malkavaara and Alen 1998; Fardim et al. 2002; Terdwongworakul et al. 2005)and softwood pulps (Malkavaara and Alen 1998). However, the range ofKappa numbers was controlled by using the same starting material andvarying the pulping conditions, e.g., the wood chips were cooked to specified
492 Wood Sci Technol (2007) 41:491–499
123
Kappa numbers (cooking time for each batch varied, depending on the Kappanumber target) (Birkett and Gambino 1989; Easty et al. 1990; Antti et al.2000).
We developed an NIR PLSR model for the prediction of Kappa number ofmaritime pine Kraft pulps obtained from samples pulped under identicalconditions to further assess differences between families.
Materials and methods
A total of 910 maritime pine (Pinus pinaster Aiton) wood discs, belonging to agenetic trial of 80 families with 11–12 trees per family, were chipped. Samplesof 20 g oven-dry wood chips were submitted to Kraft pulping on a multi batchdigester cooking system under the following reaction conditions: active alkalicharge 18.5% (as Na2O), sulfidity 30%, H-factor 1600, liquor/wood ratio 4/1,time to temperature 90 min, time at temperature (170�C) 90 min. Theseconditions were set to obtain a Kappa number of 80 as needed for linerboardapplications. The cooked chips were disintegrated, washed, and screened (daSilva Perez et al. 2005).
The Kappa number of 91 samples was determined (TAPPI 1999).
Spectra collection
Two NIR spectra per pulp were collected in the wave number range from12,000 to 3,800 cm–1 with a NIR spectrometer (BRUKER, model Vector 22/N) in diffuse reflectance mode using a spinning cup module. Each spectrumwas obtained with 100 scans at a spectral resolution of 16 cm–1.
Data processing
In a first step, the infrared data from 57 samples were regressed against theKappa number, and by means of full cross validation with one sample omitteda significant number of PLS components (rank) was obtained using OPUSQuant 2 software (BRUKER).
Besides using the raw spectra, the following pre-processing methods wereapplied prior to calculation of the PLSR models: multiplicative scatter cor-rection (MSC), first derivative (1stDer), second derivative (2ndDer), vectornormalization (VecNor), straight line subtraction (SLS), minimum–maximumnormalization (MinMax), constant offset (ConOff), and combinations ofthem.
In a second step, a test set validation of the PLSR models was performedwith the independent 34-sample set covering the obtained Kappa numberrange.
In a third step, the calculated and validated models were used to predict theKappa number of the remaining pulps evaluating their predictive ability. Thenumber of outsiders (OS) and outliers (OL) of the models were compared.
Wood Sci Technol (2007) 41:491–499 493
123
A sample will be marked as an outsider if the predicted value lies outside thecalibrated range. A sample will be marked as an outlier if the Mahalanobisdistance is too large, meaning that the similarity of the spectra compared tothe calibration spectra is too low.
The quality of the models (calibration) was assessed by means of crossvalidation and test set validation results: coefficient of determination (R2),root mean square error of cross validation (RMSECV) and root mean squareerror of prediction (RMSEP). The selection of the final model is based on itspredictive ability following a procedure that has already been successfullyapplied (Gierlinger et al. 2002).
Results and discussion
The number of samples used in the calibration set, the test set, and a statisticalsummary of laboratory determined Kappa number for each set, is given inTable 1. The Kappa number of the 91 maritime pine kraft pulp samples rangedfrom 54.6 to 101.6 with an average of 80 and a standard deviation of 11.1. Thetarget Kappa number of 80 was obtained on average despite the large variationthat is mainly attributed to the raw material. This suggests that Kappa numbervariation could be used as a selection criterion in breeding programs.
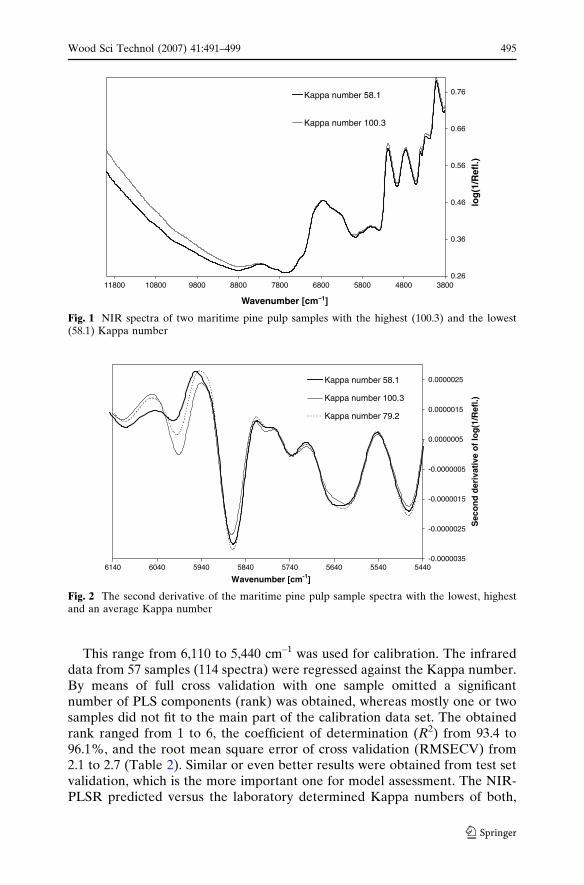
Two spectra of the pulp samples with the highest and the lowest Kappanumber used for calibration only show small differences (Fig. 1), except theincreasing slope in the higher wave number range. This is due to the higherlignin content and the degree of degradation, which is well known from, e.g.,thermal-treated wood (Schwanninger et al. 2004a).
To accentuate spectral differences, the second derivatives of the pulpsample spectra with the lowest (58.1), highest (100.3) and an average (79.2)Kappa number were calculated. The wave number range that has alreadybeen used (Schwanninger and Hinterstoisser 2001; Schwanninger et al. 2004b)for the determination of the lignin content in softwood is shown (Fig. 2). Themost remarkable differences are seen at about 5,990 cm–1. This band that isnormally found at about 5,980 cm–1 in maritime pine wood spectra can beassigned to the overtone of CH stretching of aromatic skeletal from lignin.With decreasing lignin content the amplitude of this band decreases and shiftsto higher wave numbers (Schwanninger and Hinterstoisser 2001; Schwannin-ger et al. 2004b).
Table 1 Number of samples and range of Kappa numbers in the calibration set and test set
Kappa number Calibration set Test set
No. of samples 57 34Maximum 100.3 101.6Minimum 58.1 54.6Average 80.5 79.1SD 10.7 11.8
494 Wood Sci Technol (2007) 41:491–499
123
This range from 6,110 to 5,440 cm–1 was used for calibration. The infrareddata from 57 samples (114 spectra) were regressed against the Kappa number.By means of full cross validation with one sample omitted a significantnumber of PLS components (rank) was obtained, whereas mostly one or twosamples did not fit to the main part of the calibration data set. The obtainedrank ranged from 1 to 6, the coefficient of determination (R2) from 93.4 to96.1%, and the root mean square error of cross validation (RMSECV) from2.1 to 2.7 (Table 2). Similar or even better results were obtained from test setvalidation, which is the more important one for model assessment. The NIR-PLSR predicted versus the laboratory determined Kappa numbers of both,
0.26
0.36
0.46
0.56
0.66
0.76
38004800580068007800880098001080011800
Kappa number 58.1
Kappa number 100.3
log
(1/R
efl.)
Wavenumber [cm–1]
Fig. 1 NIR spectra of two maritime pine pulp samples with the highest (100.3) and the lowest(58.1) Kappa number
-0.0000035
-0.0000025
-0.0000015
-0.0000005
0.0000005
0.0000015
0.0000025
54405540564057405840594060406140
Wavenumber [cm-1]
Sec
on
d d
eriv
ativ
e o
f lo
g(1
/Ref
l.)
Kappa number 58.1
Kappa number 100.3
Kappa number 79.2
Fig. 2 The second derivative of the maritime pine pulp sample spectra with the lowest, highestand an average Kappa number
Wood Sci Technol (2007) 41:491–499 495
123
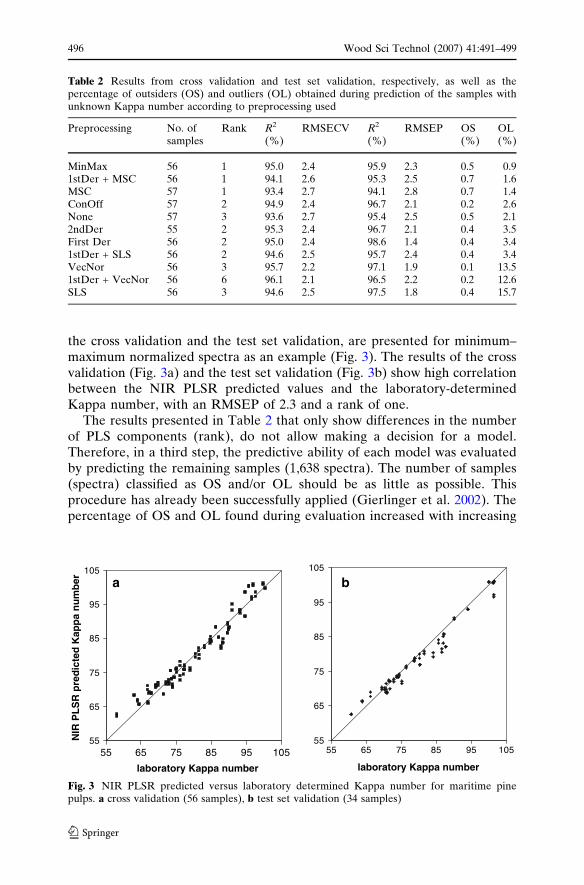
the cross validation and the test set validation, are presented for minimum–maximum normalized spectra as an example (Fig. 3). The results of the crossvalidation (Fig. 3a) and the test set validation (Fig. 3b) show high correlationbetween the NIR PLSR predicted values and the laboratory-determinedKappa number, with an RMSEP of 2.3 and a rank of one.
The results presented in Table 2 that only show differences in the numberof PLS components (rank), do not allow making a decision for a model.Therefore, in a third step, the predictive ability of each model was evaluatedby predicting the remaining samples (1,638 spectra). The number of samples(spectra) classified as OS and/or OL should be as little as possible. Thisprocedure has already been successfully applied (Gierlinger et al. 2002). Thepercentage of OS and OL found during evaluation increased with increasing
Table 2 Results from cross validation and test set validation, respectively, as well as thepercentage of outsiders (OS) and outliers (OL) obtained during prediction of the samples withunknown Kappa number according to preprocessing used
Preprocessing No. ofsamples
Rank R2
(%)RMSECV R2
(%)RMSEP OS
(%)OL(%)
MinMax 56 1 95.0 2.4 95.9 2.3 0.5 0.91stDer + MSC 56 1 94.1 2.6 95.3 2.5 0.7 1.6MSC 57 1 93.4 2.7 94.1 2.8 0.7 1.4ConOff 57 2 94.9 2.4 96.7 2.1 0.2 2.6None 57 3 93.6 2.7 95.4 2.5 0.5 2.12ndDer 55 2 95.3 2.4 96.7 2.1 0.4 3.5First Der 56 2 95.0 2.4 98.6 1.4 0.4 3.41stDer + SLS 56 2 94.6 2.5 95.7 2.4 0.4 3.4VecNor 56 3 95.7 2.2 97.1 1.9 0.1 13.51stDer + VecNor 56 6 96.1 2.1 96.5 2.2 0.2 12.6SLS 56 3 94.6 2.5 97.5 1.8 0.4 15.7
55
65
75
85
95
105
55 65 75 85 95 105
laboratory Kappa numberlaboratory Kappa number
55
65
75
85
95
105
55 65 75 85 95 105
NIR
PL
SR
pre
dic
ted
Kap
pa
nu
mb
er a b
Fig. 3 NIR PLSR predicted versus laboratory determined Kappa number for maritime pinepulps. a cross validation (56 samples), b test set validation (34 samples)
496 Wood Sci Technol (2007) 41:491–499
123
number of PLS components necessary to describe the data sets (Table 2).Models with a rank of one produced between 0.9 and 1.6% OL, those with arank of between two and three produced between 2.1 and 3.5% OL, and thoseneeding at least three PLS components produced between 12.6 and 15.7% OL(Table 2). However, this was partially expected since an increasing rank isalways accompanied by the risk of overfitting.
Terdwongworakul et al. (2005) found the range from 2,000 to 2,500 nm tobe useful to predict the lignin content in Eucalyptus camaldulensis. Within thisrange neither the model statistics nor the predictive ability improve, but thenumber of PLS components (rank) used to describe the data (not shown)increased. Therefore, this range was not used, especially because a smallerwave number range and therefore, smaller datasets can be faster calculatedand evaluated, which is important for in-line application. In a similar workcarried out with Eucalyptus grandis, multiple linear regression calibrationmodels for Kappa number, with 95% confidence limits of ±1.39 and a coef-ficient of correlation of 0.96, and for mixed pine pulps with a coefficient ofcorrelation of 0.99, with 95% confidence limits of ±2.13, were obtained usingfive single wavelengths (Birkett and Gambino 1989). Easty et al. (1990) ob-tained a R2 of 0.99 using the amplitude from the second derivative of the NIRspectra at 5,952 cm–1 for calibration of the Kappa number of hardwood–softwood blends, but did not use any kind of test set to validate this result.Antti et al. (2000) developed a model with a predictive ability according tocross validation of 98.2%; a test set consisting of 36 samples excluded from thecalibration model gave an RMSEP of 1.68. A reliable model will be obtainedonly if the model is able to predict the test samples in a proper way (Anttiet al. 1996, 2000), which is commonly agreed. But according to the resultspresented here, this is not sufficient, stressing the importance of an additionalstep (evaluation) to be able to make a decision for a model. Following that,the minimum–maximum normalized spectra gave the best model.
Conclusions
Several studies have proven the power of combining NIR data with multi-variate data analysis as a tool for characterizing pulps and for building modelsthat enable prediction of pulp properties from spectroscopic data (Michell1995; Olsson et al. 1995; Lindgren and Edlund 1998; Malkavaara and Alen1998; Antti et al. 2000; Hauksson et al. 2001; Fardim et al. 2002; Henriksenet al. 2004; Terdwongworakul et al. 2005). The results presented here dem-onstrate very good correlations between NIR spectra of maritime pine pulpsand the Kappa number. Besides using the raw spectra, spectra pre-processedwith ten methods were used for PLSR, showing that even after test set vali-dation no model decision could be made due to almost identical statistics.However, a low number of PLS components necessary to describe the data setcould support the decision. The final evaluation that proved the predictivepower of the models by predicting samples with unknown Kappa numbers
Wood Sci Technol (2007) 41:491–499 497
123
allowed choosing a model according to a minimal number of OL found duringthis process. Moreover, for the first time to our knowledge, Kappa number ofKraft pulps cooked under the same conditions was assessed by NIR spec-troscopy as a complementary criterion for a tree-breeding program.
Acknowledgments This work was supported by funding from the EU (research projectsGEMINI-QLRT-1999-0942) and Fundacao para a Ciencia e Tecnologia (Portugal), under POCTIand FEDER programs (research projects POCTI/AGR/33967/99 and POCTI/AGR/47353/2002)and was integrated in the activities of BIOPOL in Centro de Estudos Florestais (Portugal).
References
Antti H, Sjostrom M, Wallbacks L (1996) Multivariate calibration models using NIR spectroscopyon pulp and paper industrial applications. J Chemometr 10:591–603
Antti H, Alexandersson D, Sjostrom M, Wallbacks L (2000) Detection of kappa number distri-butions in kraft pulps using NIR spectroscopy and multivariate calibration. Tappi J 83:102–108
Birkett MD, Gambino MJT (1989) Estimation of pulp Kappa number with Near-Infrared spec-troscopy. Tappi J 72:193–197
Celpa (2004) A industria da pasta. Boletim Estatıstico. Celpa. Lisboa, CELPA – Associacao daIndustria Papeleira 1:36–46
Easty DB, Berben SA, DeThomas FA, Brimmer PJ (1990) Near-infrared spectroscopy for theanalysis of wood pulp: quantifying hardwood-softwood mixtures and estimating lignin content.Tappi J 73:257–261
Fardim P, Ferreira MMC, Duran N (2002) Multivariate calibration for quantitative analysis ofeucalypt kraft pulp by NIR spectrometry. J Wood Chem Technol 22:67–81
Gierlinger N, Schwanninger M, Hinterstoisser B, Wimmer R (2002) Rapid determination ofheartwood extractives in Larix sp by means of Fourier transform near infrared spectroscopy. JNear Infrared Spectrosc 10:203–214
Hauksson JB, Bergqvist G, Bergsten U, Sjostrom M, Edlund U (2001) Prediction of basic woodproperties for Norway spruce. Interpretation of near infrared spectroscopy data using partialleast squares regression. Wood Sci Technol 35:475–485
Henriksen HC, Naes T, Rodbotten R, Aastveit A (2004) Prediction of important sulphite pulpproperties from near infrared spectra: a feasibility study and comparison of methods. J NearInfrared Spectrosc 12:279–285
Hodge GR, Woodbridge WC (2004) Use of near infrared spectroscopy to predict lignin content intropical and sub-tropical pines. J Near Infrared Spectrosc 12:381–390
Kelley SS, Rials TG, Snell R, Groom LH, Sluiter A (2004) Use of near infrared spectroscopy tomeasure the chemical and mechanical properties of solid wood. Wood Sci Technol 38:257–276
Lindgren T, Edlund U (1998) Prediction of lignin content and pulp yield – from black liquorcomposition using near-infrared spectroscopy and partial least squares regression. Nord PulpPap Res J 13:76–80
Malkavaara P, Alen R (1998) A spectroscopic method for determining lignin content of softwoodand hardwood kraft pulps. Chemometr Intell Lab 44:287–292
Michell AJ (1995) Pulpwood quality estimation by near-infrared spectroscopic measurements oneucalypt woods. Appita J 48:425–428
Olsson RJO, Tomani P, Karlsson M, Joseffson T, Sjoberg K, Bjorklund C (1995) Multivariatecharacterization of chemical and physical descriptors in pulp using NIRR. Tappi J 78:158–166
Schimleck LR, French J (2002) Application of NIR spectroscopy to clonal Eucalyptus globulussamples covering a narrow range of pulp yield. Appita J 55:149–154
Schimleck LR, Wright PJ, Michell AJ, Wallis AFA (1997) Near-infrared spectra and chemicalcompositions of E-globulus and E-nitens plantation woods. Appita J 50:40–46
Schimleck LR, Payne P, Wearne RH (2005) Determination of important pulp properties of hybridpoplar by near infrared spectroscopy. Wood Fiber Sci 37:462–471
498 Wood Sci Technol (2007) 41:491–499
123
Schultz TP, Burns DA (1990) Rapid secondary analysis of lignocellulose: comparison of nearinfrared (NIR) and Fourier transform infrared (FTIR). Tappi J 73:209–212
Schwanninger M, Hinterstoisser B (2001) Determination of the lignin content in wood by FT-NIR.In: 11th ISWPC, International symposium on wood and pulping chemistry, Nice, CentreTechnique Papeterie III, pp 641–644
Schwanninger M, Hinterstoisser B, Gierlinger N, Wimmer R, Hanger J (2004a) Application ofFourier transform near infrared spectroscopy (FT-NIR) to thermally modified wood. HolzRoh-Werkst 62:483–485
Schwanninger M, Hinterstoisser B, Gradinger C, Messner K, Fackler K (2004b) Examination ofspruce wood biodegraded by Ceriporiopsis subvermispora using near and mid infrared spec-troscopy. J Near Infrared Spectrosc 12:397–409
Shin SJ, Schroeder LR, Lai YZ (2004) Impact of residual extractives on lignin determination inKraft pulps. J Wood Chem Technol 24:139–151
da Silva Perez D, Guillemain A, Chantre G, Alazard P, Alves A, Rodrigues JC, Rozenberg P,Plomion C, Robin E (2005) Improvement of wood, pulp and paper quality of maritime pine(Pinus pinaster Ait.) by combining rapid assessment techniques and genetics. In: Internationalsymposium on wood, fibre and pulping chemistry, vol 2. Appita Inc, Auckland, pp 207–214
So CL, Via BK, Groom LH, Schimleck LR, Shupe TF, Kelley SS, Rials TG (2004) Near infraredspectroscopy in the forest products industry. Forest Prod J 54:6–16
Sykes R, Li BL, Hodge G, Goldfarb B, Kadla J, Chang HM (2005) Prediction of loblolly pinewood properties using transmittance near-infrared spectroscopy. Can J Forest Res 35:2423–2431
TAPPI (1999) Kappa number of pulp, test method T 236 om-99. TAPPI Standard Test MethodsTerdwongworakul A, Punsuwan V, Thanapase W, Tsuchikawa S (2005) Rapid assessment of wood
chemical properties and pulp yield of Eucalyptus camaldulensis in Thailand tree plantationsby near infrared spectroscopy for improving wood selection for high quality pulp. J Wood Sci51:167–171
Wallbacks L, Edlund U, Norden B, Iversen T (1991) Multivariate characterization of pulp. Part 1:Spectroscopic characterization of physical and chemical differences between pulps using 13CCP/MAS NMR, FT-IR, NIR and multivariate data analysis. Nord Pulp Pap Res J 2:74–80
Wright JA, Birkett MD, Gambino MJT (1990) Prediction of pulp yield and cellulose content fromwood samples using near infrared reflectance spectroscopy. Tappi J 73:164–166
Wood Sci Technol (2007) 41:491–499 499
123