Embed Size (px)
Citation preview

ANNUAL REPORT 2017
For the Fiscal Year Ended March 31, 2017
Nippon Paper Industries Co., Ltd.(Securities Code: 3863)
NIP
PO
N P
AP
ER
IND
US
TR
IES
CO
., LTD
.A
NN
UA
L R
EP
OR
T 2
017
Se
curitie
s Co
de: 3
86
3
4-6, Kanda-Surugadai, Chiyoda-ku, Tokyo 101-0062, Japan
TEL +81-3-6665-1111
http://www.nipponpapergroup.com/english/
Nippon Paper Industries Co., Ltd.

MissionThe Nippon Paper Group aims to contribute to better living and cultural
progress everywhere it does business.
Vision1. Drive social sustainability through our business
2. Delight our customers
3. Instill pride in employees
4. Give back to society
ValuesChallenge: Embrace new challenges
Fairness: Be fair
Teamwork: Champion teamwork
SloganShaping the future with trees
To shape the future
with treesThe identity of the Nippon Paper Group is “with trees.” At the heart of our Group Mission is our belief in the possibilities of paper and the consistent contribution we have made to people’s lives and culture throughout our history. By applying our technology and expertise to maximize the value of renewable forest resources, we will continue to contribute to better living and cultural progress around the world.
Kitayama, a Nippon Paper-owned ForestKitayama, a Nippon Paper-owned Forest
11Nippon Paper Industries Co., Ltd. Annual Report 2017Nippon Paper Industries Co., Ltd. Annual Report 2017

Foundation and Strengths A Variety of Businesses
Wood Resources
Annual amount used: approx. 4.5 million BDT 1
Company-owned forests in Japan and overseas:
approx. 180,000 hectares 2
Technology
Number of patents: 263 3
Network
Group: 159 companies 4
Customers
Domestic share
Paper: 29.2% (No. 1) 5
Paperboard: 19.1% (No. 3) 5
1. (Bone dry tonnes) Amount used in domestic pulp and paper business 2. As of March 31, 2016 3. Number of patents in FY2016/3 4. Subsidiaries and affi liated companies as of March 31, 2017 5. Calendar year 2016
Paper Paperboard Healthcare
Wood Products and Building Materials Agriculture Leisure and
Others
Packaging ChemicalProducts Energy
Wood is a renewable resource that is characterized by its diverse applications, and makes possible the creation of some of the leading materials of our generation. As a comprehensive biomass company, Nippon Paper operates a broad range of businesses, from products using wood fi ber as the raw material such as paper, packaging and healthcare goods through to businesses that take full advantage of wood components, such as creating chemical products, producing lumber and construction materials and providing energy services. These businesses also contribute to mitigation of global warming, preservation of biodiversity and prevention of resource depletion.
as a comprehensive
biomass company,
33Nippon Paper Industries Co., Ltd. Annual Report 2017Nippon Paper Industries Co., Ltd. Annual Report 201722 Nippon Paper Industries Co., Ltd. Annual Report 2017Nippon Paper Industries Co., Ltd. Annual Report 2017
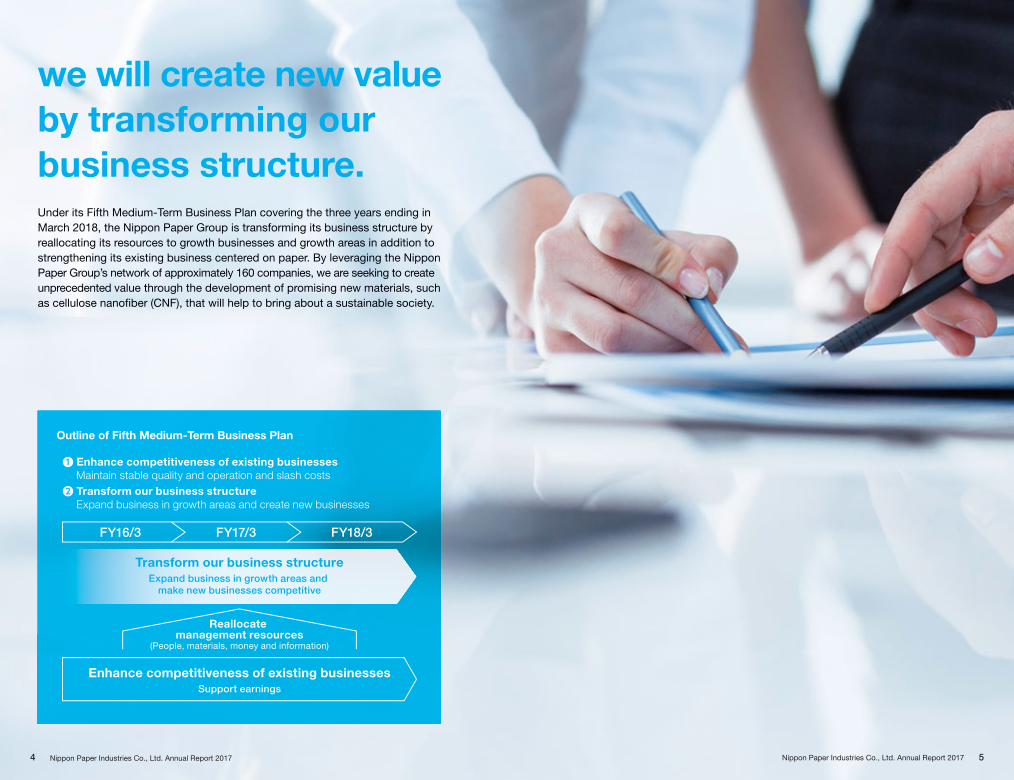
Outline of Fifth Medium-Term Business Plan
FY18/3FY17/3FY16/3
Transform our business structureExpand business in growth areas and
make new businesses competitive
Enhance competitiveness of existing businessesSupport earnings
Reallocate management resources
(People, materials, money and information)
❶ Enhance competitiveness of existing businesses
Maintain stable quality and operation and slash costs
❷ Transform our business structure
Expand business in growth areas and create new businesses
we will create new value
by transforming our
business structure.Under its Fifth Medium-Term Business Plan covering the three years ending in March 2018, the Nippon Paper Group is transforming its business structure by reallocating its resources to growth businesses and growth areas in addition to strengthening its existing business centered on paper. By leveraging the Nippon Paper Group’s network of approximately 160 companies, we are seeking to create unprecedented value through the development of promising new materials, such as cellulose nanofi ber (CNF), that will help to bring about a sustainable society.
Nippon Paper Industries Co., Ltd. Annual Report 20174 5Nippon Paper Industries Co., Ltd. Annual Report 2017

The Nippon Paper Group is a comprehensive biomass company that consistently creates new value from its core technologies for making paper from trees. Today, the Group’s businesses cover eco-friendly paper cartons, healthcare products that meet the needs of an aging society, and a variety of new materials, including cellulose nanofi ber and a packaging material with barrier properties.
The common denominator of our diverse businesses is that they all use forest trees, a renewable biomass resource. That is our major advantage from the standpoint of contributing to the creation of a sustainable society. We believe that helping to solve social issues is what will ultimately lead to the growth of the Nippon Paper Group.
FY2018/3 is the fi nal year of the Fifth Medium-Term Business Plan. In an increasingly challenging business environment, we will continue our efforts to enhance the competitiveness of our existing businesses and accelerate the transformation of our business structure. We are committed to increasing our corporate value to meet your expectations as stakeholders. We sincerely appreciate your support.
Introduction
To Our Stakeholders ......................... 6FY2017/3 Highlights .......................... 8Interview with the President .............. 12
Feature: Expectations for New Materials
That Will Accelerate Growth ......... 20
Business Section
The Nippon Paper Group at a Glance ..................................... 26
Pulp and Paper ................................. 28Paper-Related ................................... 34Wood Products and
Construction Related / Other .......... 38
Sustainability Section
Promotion of CSR Activities .............. 40Corporate Governance ..................... 41Comments from Outside Officers ..... 47Directors and Statutory Auditors ....... 48Human Resource Initiatives ............... 50Environmental Initiatives .................... 51Initiatives for Communities
and Society .................................... 52
Financial Section
Consolidated Six-Year Summary ....... 54Financial Overview ............................ 56Business and Other Risk Factors ...... 58Consolidated Financial Statements ... 60
Corporate Data
Consolidated Subsidiaries and Equity-Method Affiliates .................. 68
Domestic Network ............................ 70Overseas Network ............................ 72Company Profile ............................... 76Stock Information .............................. 77Investor Information and IR Calendar ...79
Contents
Notice regarding the consolidated fi nancial information appearing in this annual reportNippon Paper Industries Co., Ltd. (hereinafter “the Company”) merged with Nippon Paper Group, Inc. as of
April 1, 2013, and took over its consolidated fi nancial statements. The scope of consolidation for the Company
has not changed substantially from that of Nippon Paper Group, Inc., before the merger. Accordingly, the
consolidated fi nancial information in this annual report until the fi scal year ended March 31, 2013 represents
that of Nippon Paper Group, Inc.
DisclaimerStatements in this annual report concerning plans, forecasts, strategies, beliefs and other forward-looking
information related to Nippon Paper Industries Co., Ltd., and companies comprising its corporate group, other
than those of historical fact, are forecasts of future business performance based on the judgments of
management at Nippon Paper Industries Co., Ltd., and Nippon Paper Group companies in light of currently
available information. Accordingly, please refrain from making investment decisions based solely on forecasts
of business performance in this annual report. Actual business performance may differ signifi cantly from these
forecasts due to changes in a variety of factors.
Publisher: Nippon Paper Industries Co., Ltd. http://www.nipponpapergroup.com/english/
©Nippon Paper Industries Co., Ltd. 2017
This annual report shall not be reproduced or copied in any form or manner whatsoever without the prior
written consent of the copyright holder or as permitted by law.
We will utilize our strengths
as a comprehensive biomass
company to help solve
social issues and achieve
our own growth.
To Our Stakeholders
Fumio ManoshiroPresident and Representative Director
Nippon Paper Industries Co., Ltd.
6 7Nippon Paper Industries Co., Ltd. Annual Report 2017 Nippon Paper Industries Co., Ltd. Annual Report 2017

FY2017/3 Highlights
FY2017/3 Highlights
In FY2017/3, the Japanese economy continued on a moderate growth track, buoyed by improvement in the job market and income. However, the economic outlook was clouded by uncertainty about the effects of U.S. economic policies and concerns over slower growth in China and other newly industrialized countries.
The pulp and paper industry continued to face a challenging operating environment with slack demand for paper and weakening market conditions,
coupled with rising prices for raw materials and fuel, including wastepaper. The Nippon Paper Group responded to these conditions by steadily executing
the Fifth Medium-Term Business Plan. Initiatives included selling assets, investing in growth areas such as the packaging business and exiting the printing and publishing paper business in the United States. Results for the last fi ve fi scal years are summarized below.
Net Sales
Total Assets
Net Income* & Net Income per Share*
Cash Flow
Operating Income & Operating Income Margin
Net Interest-Bearing Debt & Debt/Equity Ratio
ROE & ROA
Cash Dividends per Share & Payout Ratio
1,025.11,081.3 1,052.5 1,007.1
2017/32016/32015/32014/32013/3
992.4
■■ Net sales (¥ billion)
25.1
28.5
23.7 22.623.8
2.5 2.62.2 2.2 2.4
2017/32016/32015/32014/32013/3
■■ Operating income (¥ billion)
● Operating income margin (%)
10.7
22.8 23.2
2.4
8.4
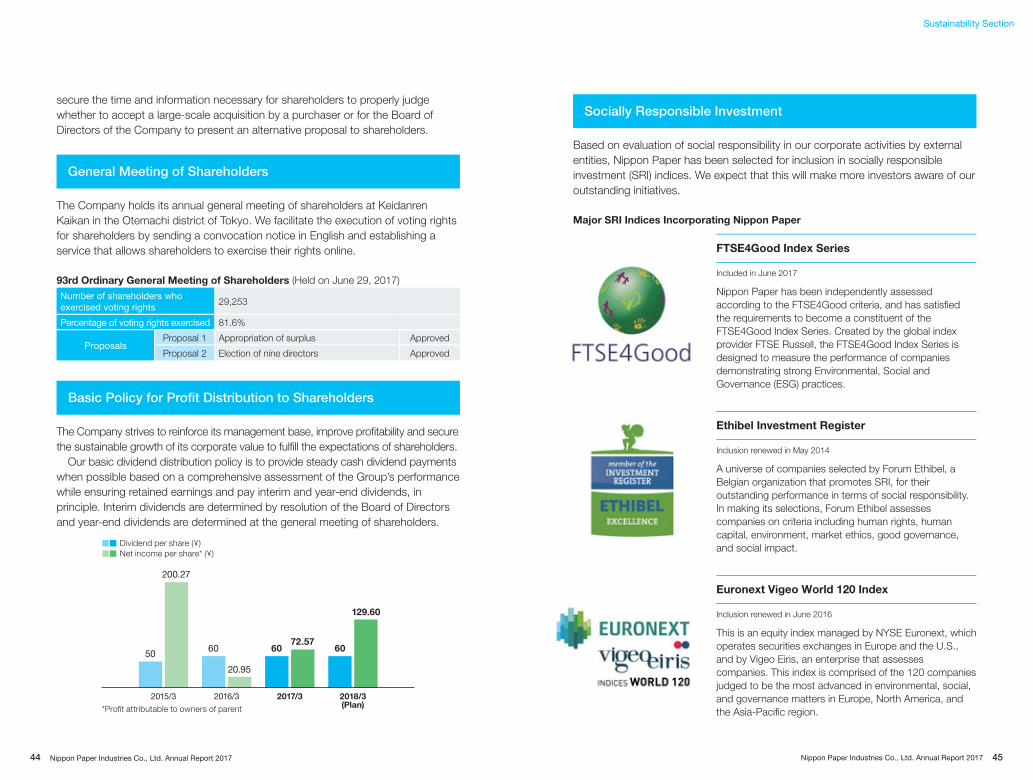
200.27
20.95
92.00
196.67
72.57
2017/32016/32015/32014/32013/3
■■ Net income* (¥ billion)
● Net income per share* (¥)
*Profit attributable to owners of parent
1,497.7 1,480.9 1,495.61,390.9 1,388.9
2017/32016/32015/32014/32013/3
■■ Total assets (¥ billion)
2017/32016/32015/32014/32013/3
719.3678.4
647.7591.3 588.0
1.91.7 1.6 1.5 1.5
■■ Net interest-bearing debt (¥ billion)
● Debt/equity ratio (times)
2017/32016/32015/32014/32013/3
■■ Cash flow from operating activities (¥ billion)
■■ Cash flow from investing activities (¥ billion)
● Free cash flow (¥ billion)
66.0 75.8 81.8
52.4
87.1
(61.8)
(24.9)(42.5)
16.3
(65.3)
4.2
50.939.4
68.7
4.24.24.2
50.950.950.939.439.439.4
68.768.768.7
21.8 40 40
50
60 60
82.7
2017/32016/32015/32014/32013/3
286.4286.4
25.025.020.343.543.5
■■ Cash dividends per share (¥)
● Payout ratio (%)
● ROE (%)
● ROA (%)
2.8
5.65.1
0.5
2.02.3
2.72.2
2.0
2.6
2017/32016/32015/32014/32013/3
8 9Nippon Paper Industries Co., Ltd. Annual Report 2017 Nippon Paper Industries Co., Ltd. Annual Report 2017

FY2017/3 Highlights
(Source: Japan Paper Association)
Share of Paper Market in 2016 (Jan.-Dec.)
Paper & Paperboard Consumption
Paper & Paperboard Consumption
Paper & Paperboard Consumption
Paper & Paperboard Consumption
Share of Paperboard Market in 2016 (Jan.-Dec.)
Material Balance of Domestic Pulp and Paper Business(FY2016/3)
Paper Companies by Production Volume
Paper Companies by Production Volume
■Japan ■China ■Asia (except Japan and China) ■North America ■Europe ■Others
201520142013201220110
100
200
300
400
500
(Millions of tonnes)
0
2,000
4,000
6,000
8,000
■ Paper ■ Paperboard
2017/32016/32015/32014/32013/3
(kt)
■ Paper & paperboard ■ Chemical products
■ Packaging ■ Healthcare ■ Other
2016/32015/32014/32013/32012/30
50
100
150
200
250
300
International P
aper
(U.S
.)
Nine D
rago
ns Pap
erH
old
ings (C
hina)
UP
M (F
inland)
Sto
ra Enso (F
inland)
Oji G
roup
(Japan)
WestR
ock (U
.S.)
Sm
urfit Kap
pa G
roup
(Ireland)
Nip
po
n P
ap
er G
rou
p(J
ap
an
)
Sap
pi (S
outh A
frica)
DS
Sm
ith (U.K
.)
(Top 10 companies in 2015) (Millions of tonnes)
0
2015105
25
■Newsprint ■Printing and business communication paper
■Containerboard ■Paperboard for paper containers
■Other (Packaging, household and miscellaneous use)
0
5
10
15
20
25
30
2017/32016/32015/32014/32013/3
(Millions of tonnes)
0
2
4
6
Marusum
i P
aper
Tokushu To
kai P
aper
Mitsub
ishi P
aper M
illsC
huetsu Pulp
& P
aper
Ho
kuetsu K
ishu Pap
erR
engo
Oji P
aper
Daio P
aper
Oji M
ateria
Nip
po
n P
ap
er
(Top 10 companies in 2016) (Millions of tonnes)
29.2 % 19.1 %
Industry Data
Worldwide Domestic
+0.4 % ‒0.5 %Year-on-year Year-on-year
Production of Nippon Paper Group
Number of Patent Applications by Nippon Paper Group
(Source: Japan Paper Association)
InputRaw materials
Woodchips 4,464 thousand BDt
Logs 26 thousand BDt
Pulp 355 thousand ADt
Wastepaper 3,064 thousand ADt
Water consumption 831 million tonnes
Energy
Purchased electricity 872 GWh
Oil 158 thousand kl
Coal 2,054 thousand tonnes
Gas 95 thousand tonnes
Other non-fossil fuels 1,342 thousand tonnes
Black liquor* 3,256 thousand tonnes*A by-product of producing pulp from wood chips.
OutputPaper products
Paper and household 4.12 million tonnes
Paperboard 1.67 million tonnes
Pulp 32 thousand tonnes
(Source: RISI)
(Source: RISI)
(Source: RISI)
(Source: Japan Paper Association)
(Source: Japan Paper Association)
(Source: Japan Paper Association)
10 11Nippon Paper Industries Co., Ltd. Annual Report 2017 Nippon Paper Industries Co., Ltd. Annual Report 2017

In the final year of the Fifth Medium-Term Business Plan, we will focus on advancing to a new stage.
Interview with the President
Fumio ManoshiroPresident and Representative DirectorNippon Paper Industries Co., Ltd.
What are your thoughts on Nippon Paper’s performance and the factors that affected it in FY2017/3? In FY2017/3, the second year of our Fifth Medium-Term Business Plan, which covers the three years ending March 31, 2018, demand for paper continued to fall, reflecting the declining circulation of newspapers and magazines. In addition to further weakening of market conditions, wastepaper and fuel prices rose and the yen depreciated in the second half of the year, making the external environment even more difficult. We responded by announcing price adjustments for printing and business communication paper and containerboard, but the effect of those adjustments will be realized in FY2018/3. We also made cost improvements at our mills and plants. Unfortunately, we were unable to realize the effects as planned because of shutdowns due to the Kumamoto earthquakes and typhoons, and operating disruptions due to problems with boilers and other factors. As a result of these setbacks, we did not achieve our goals for “enhancing competitiveness of existing businesses,” one of the two pillars of the medium-term business plan.
On the other hand, for the other pillar of the plan, to “transform our business structure (expand business in growth areas and make new businesses competitive),” we have steadily made the necessary investments and achieved very good results, backed by rising demand for household paper and healthcare products, one of the growth sectors we are targeting. In overseas business
(Billions of yen)
FY2017/3 YoY Change
Net sales 992.4 (14.7)
Operating income 23.8 1.2
Ordinary income 27.0 9.9
Net income* 8.4 6.0
*Profit attributable to owners of parent
FY2017/3 Consolidated Results
12 13Nippon Paper Industries Co., Ltd. Annual Report 2017Nippon Paper Industries Co., Ltd. Annual Report 2017
12 13

operations, we signifi cantly improved earnings by strengthening our asset portfolio with measures including the purchase of a liquid packaging board business in the United States (Nippon Dynawave Packaging) and the sale of assets owned by Nippon Paper Industries USA Co., Ltd.
While results with the two pillars of the plan contrasted sharply, even our steady progress in transforming our business structure was not enough to fully offset the slump in existing businesses. Even though earnings increased in comparison with the previous fi scal year, we fell short of the targets in the medium-term plan, which is very disappointing.
Our tasks in FY2018/3 are clear: We must adjust prices, stabilize mill operations and further speed up the transformation of our business structure. We will continue to make every effort to realize these objectives.
As you begin the fi nal year of the Fifth Medium-Term
Business Plan, please give your analysis and
assessment of the plan’s progress to date.
The main reason for the weak operating income over the last two years is the decline in the paper and paperboard business, one of our existing businesses.
Interview with the President
At the same time, our expansion in growth areas, the linchpin of our business structure transformation, got off to a slow start in the fi rst year, but our investments have begun to yield results in the second year. In the Paper-Pak business, for example, the innovative cartons we introduced under license from Elopak of Norway are being adopted by several beverage manufacturers. In the Chemical business, we began sales of a hardcoat fi lm for OLED displays and in March 2017 completed work on expansion of production capacity for dissolving pulp. For new materials such as cellulose nanofi ber (CNF), we entered the market development phase with the establishment of the Innovative Material Sales Division. Overall, we are making steady progress with our structural transformation.
I also think it is important to make sure that our employees fully understand our Group Mission, which we formulated concurrently with this medium-term business plan. After more than two years, we have made solid progress in that effort. The Group Mission is becoming a unifying force, and whenever I go to our operating sites, I can feel that the direction we want to move in is shared.
Our operating income target of ¥50.0 billion will have to be carried over into the next medium-term business plan, but in FY2018/3 we will focus on advancing to the next stage by restoring earnings in the paper and paperboard business and achieving operating income of ¥30.0 billion.
Progress of the Fifth Medium-Term Business Plan
2015/3
(Billions of yen)
Operating income¥50.0 billion
23.7
2016/3
22.6
32.0
2017/3
23.8
41.0
2018/3
30.0
50.0
Fifth MTBP target
Projected to fall short of target
Actual
Target
Fifth Medium-TermBusiness Plan
Sixth Medium-TermBusiness Plan
Actual and Projected Operating Income in Fifth Medium-Term Business Plan
Theme Situation in FY2017/3 Key Measures in FY2018/3
Enhance competitiveness
of existing businesses
(Paper & paperboard)
◆ Start of business alliance with Tokushu Tokai Paper
◆ The effects of cost improvements were not yet realized as numerous operating disruptions occurred
◆ Exited printing and publishing paper business in North America
◆ Make product price adjustments and stabilize operations
◆ Restore profi tability in overseas operations
Transform our business structure
(Packaging)
(Healthcare)
(Chemicals)
(New materials)
(Energy)
◆ Purchased liquid packaging board business in U.S.
◆ Purchased paper container processing company in India
◆ Made concentrated investment in Nippon Paper Crecia Kyoto Mill
◆ Completed expansion of dissolving pulp production capacity
◆ Start of operation of Suzukawa Energy Center
◆ Restructure production operations in Paper-Pak business
◆ Construction of new facility by joint venture between Nippon Paper Crecia and Kasuga Paper Industry
◆ Expand production capacity for functional coating resin products
◆ Establish mass production facilities (Ishinomaki and Gotsu) and demonstration plant (Fuji) for CNF
◆ Start of operation of Ishinomaki thermal power generation facility (planned for March 2018)
14 15Nippon Paper Industries Co., Ltd. Annual Report 2017 Nippon Paper Industries Co., Ltd. Annual Report 2017

What specifi c actions are you taking for the future
growth of the Nippon Paper Group, including your
policies for new businesses?
To realize the transformation of our business structure, our policy of allocating business resources to new products and new businesses will not change. The Research and Development Division will fl exibly move human resources in cooperation with the Group as a whole. We are also reviewing our production and sales structures. The Paper-Pak and Chemical businesses, which were previously structured as business divisions, have been reorganized into sales divisions. For example, the Iwakuni Mill produces paper and chemical products. Until now, these were handled by two different divisions, and we had the problem of organizational silos. With the new organizational structure, the mill as a whole will be able to produce paper and chemical products in the optimal balance.
The Innovative Material Sales Division we established in June 2017 will work to stimulate demand for and expand sales of new products such as our paper-based packaging material with barrier properties (see the feature on pages 20-24 for details), as well as CNF. The division will not only focus on selling these products as raw materials but also support the various end products while using ingenuity to maximize the potential of each one. It will partner with companies in downstream sectors of the supply chain and also seek opportunities for mergers and acquisitions.
By making research and development, production and sales divisions Group-wide organizations, we will discover the seeds of new possibilities from various information and perspectives, and will facilitate the establishment of new products and new businesses. I fi rmly believe that this will accelerate the growth of the Group overall.
As for the outstanding issue of enhancing existing businesses, given the current structural decline in domestic demand for paper, we will make further efforts to increase productivity, and will consider the use of AI and the Internet of Things as well.
In addition, we are taking steps to improve our distribution structure, and have established an intermediate holding company, Nippon Paper Logistics Co., Ltd., to oversee major logistics companies in the Group. If we can form alliances and conduct collaborative logistics not only within the Nippon Paper Group but also with other companies in our industry and other industries, we will be able to control distribution on the scale of about ¥100 billion. Our intent is to realize cost savings by creating a more streamlined and optimized overall distribution structure. The distribution reforms will greatly benefi t not only the products of existing businesses but also products in growth areas such as the Paper-Pak business.
Interview with the President
Please tell us your thoughts on how you will help to
solve the various social challenges as a comprehensive
biomass company, and how that will contribute to the
growth of the Nippon Paper Group.
A universal challenge in the global community, and a value expected from companies, is the formation of a sustainable society and preservation of the biodiversity on which it is based. Companies that respond to these objectives in the course of conducting their business should be able to achieve their own sustainable growth.
The Nippon Paper Group’s businesses have a clear competitive edge in that they use renewable wood resources as their starting point. While petroleum-derived raw materials are used in many products, we utilize renewable, carbon-neutral wood to create products with various kinds of pulp, which gives us a major advantage. For example, improvements in the cost and convenience of paper packages have enabled them to compete on an equal footing with petroleum-derived products. “A comprehensive biomass company shaping the future with trees” and “contributing to better living and cultural progress” – these are phrases in the Group Mission we formulated in 2015. I am certain that embodying them will help lead to a sustainable society, and ultimately contribute to the advancement of the Nippon Paper Group.
16 Nippon Paper Industries Co., Ltd. Annual Report 2017 17Nippon Paper Industries Co., Ltd. Annual Report 2017
FeatureExpectations for New
Materials That Will
Accelerate Growth
In addition to environment-related issues, we have identifi ed nine CSR priority issues (material issues), including “dialogue with stakeholders,” “occupational safety and health,” and “coexistence with local communities and society at large” (see the Sustainability Report on our website for details). I believe that continuing to fulfi ll our responsibility as a corporate citizen and to be seen as an essential part of society is also a prerequisite for our growth.
Please outline the approaches that management
considers important and your aspirations for the
future, as well as any closing message for shareholders
and other stakeholders.
One of the values we highlight in our Group Mission is “fairness.” I place importance on transparency in management and a strong sense of commitment. I tell our people in the Management Audit Offi ce, which reports directly to me, that they are the last line of defense. We also increased the number of outside directors to two in FY2017/3.
Operating income of ¥50.0 billion, which was a target in the Fifth Medium-Term Business Plan, is the required level of strength for the Nippon Paper Group of today, and we must achieve it quickly. More specifi cally, it is the minimum hurdle for realizing a good balance of strategic investment for growth, returns to shareholders, treatment of employees, and a sound fi nancial position. Right now we need to place top priority on strategic investment for growth. Consequently, we plan to pay dividends of ¥60 per share (interim and year-end dividends of ¥30 each) for FY2018/3, the same as in FY2017/3. We will maintain the debt-equity ratio at around 1.5 times.
We are currently in a period that will require patience from not only shareholders but employees, who are also stakeholders. However, one component of our Vision is to “instill pride in employees.” I am certainly proud of them for their dedicated efforts under trying circumstances, and the existence of such employees is a premise of sound management, and is a key foundation for maximizing value for shareholders.
The entire management team is dedicated to making FY2018/3 a year that marks a new stage in our drive to achieve operating income of ¥50.0 billion. We will continue to make every effort to meet or exceed the expectations of our stakeholders.
Interview with the President
18 Nippon Paper Industries Co., Ltd. Annual Report 2017

The research that had been conducted by the Research and Development Division uncovered potential new products, while sales operations identifi ed customer needs. In 2015, Nippon Paper launched the New Product Development Committee to generate ideas across departmental lines. The committee breaks down organizational silos and scouts out ideas from throughout the Group, which are presented by employees to senior management once every three months. In this “intrapreneurial” program, a budget and staff are allocated to intriguing themes in order to quickly develop them into new businesses.
The New Product Development Committee has met 10 times to date. The ideas approved by the committee are turned into projects, and a project “owner” is chosen from the department in charge of commercialization. The owner is responsible for shepherding the project to commercial production. Two of the products profi led on the following pages, SHIELDPLUSTM and MinerPaTM, emerged from this initiative. The program has also become a driving force for generating new products and new businesses, including the development of a low-cost system for monitoring machinery and equipment with wireless sensors.
New Product Development Plans and Progress
Applying Our Group
Strength to New Material
DevelopmentTo further accelerate the transformation of its business structure, one of the two pillars of the Fifth Medium-Term Business Plan, Nippon Paper is using its wood- and paper-related technologies to develop innovative new materials. In this feature, we outline the characteristics of MinerPaTM and SPOPSTM, which we developed in 2016, and SHIELDPLUSTM, for which we have strengthened application development, and convey the passion of the researchers who developed them.
Newly Developed Products
Made from Wood
Feature
Overall Policy
Progress
Looking Ahead
As a comprehensive biomass company shaping the future with trees, Nippon Paper will continue to propose ideas for new materials and new products. One emerging trend is the worldwide shift from plastic to paper as a way of curbing CO2 emissions and reducing landfi ll waste. To capitalize on this business opportunity, we intend to develop paper alternatives wherever feasible. With that approach, we will broaden the possibilities of paper.
A new technology that gives various functions to pulp. It provides added value according to the intended purpose, such as fl ame resistance, deodorizing and antibacterial effects, or radiation shielding.
From refi ll to replacement: Wouldn’t it be nice if liquid containers could just be switched out to eliminate the annoyance of refi lling them? That simple concept led to the creation of SPOPSTM.
A paper material that is impermeable to oxygen and vapor. It enables the use of paper as a food packaging material, which was previously diffi cult with paper alone, and expands packaging possibilities.
TM
TM
20 21Nippon Paper Industries Co., Ltd. Annual Report 2017 Nippon Paper Industries Co., Ltd. Annual Report 2017

Feature: Expectations for New Materials That Will Accelerate Growth
The contents in packaging, including food, tend to deteriorate over time and with environmental changes. Consequently, it is important for the packaging material to have properties that inhibit degradation of the contents by preventing the permeation of oxygen and water vapor, and that prevent the penetration of odors from outside and preserve the aroma of the contents. By adding to paper a protective barrier layer that provides strong protection for contents, we developed SHIELDPLUSTM, an eco-friendly barrier packaging material made of paper. We are preparing to market this product for a wide range of applications.
We are focusing on creating new materials and containers from renewable paper and pulp to help make people’s lives more comfortable. We will begin sales of SHIELDPLUSTM, a barrier packaging material made from paper, and are developing MinerPaTM, a functional material, and SPOPSTM, a replaceable paper container, which we expect to launch as new products in the near future.
Using our proprietary technology to combine inorganic mineral particles and pulp (cellulose fi bers), we developed MinerPaTM, a functional material that has the characteristics and properties of inorganic minerals. MinerPaTM can be processed into different shapes, such as wet pulp, sheets, and powder, and is suitable for recycling. We plan to develop it for applications in various fi elds, such as fl ame-retardant wallpaper and paper towels with deodorizing and antibacterial properties.
We are developing SPOPSTM, the world’s fi rst* replaceable paper-based liquid container. Since the cartridges (Paper-Pak containers) are simply switched out, unlike refi ll-type pouch containers, they do not require the time and trouble of refi lling the contents. The box shape improves distribution effi ciency, thus contributing to energy savings, and enhances the convenience of store displays and storage at home. With paper accounting for approximately 70% of the material, SPOPSTM is an environmentally friendly container that can reduce fossil fuel consumption.*The world’s fi rst in terms of paper-based containers (according to our research)
*The last three characteristics are imparted according to the properties of the inorganic mineral
Eco-Friendly Barrier Packaging Material
Combination of Inorganic Mineral Particles and Pulp
SHIELDPLUS
MinerPaA Succession of
New Materials and
Containers
Characteristics of
MinerPa
❶ Recyclable and reverts back to soil❷ Makes folding or patching simple ❸ Equivalent of Class 1 fi re resistance without
containing any toxic substances❹ Eliminates more than 95% of aging odor and
excretion odors❺ Blocks radiation without the use of lead
Characteristics of
SPOPS
❶ Can be replaced in 30 seconds or less (according to our research)
❷ Liguid pools in the trough-shaped base, reducing unused waste
❸ The box-shaped cartridge enables neat, compact storage
❹ Saves water with no need to wash a bottle❺ High distribution effi ciency reduces CO2 emissions
Characteristics of
SHIELDPLUS
❶ Inhibits permeation of oxygen and water vapor
❷ Inhibits permeation of fragrances and odors
❸ Renewable resource❹ Helps to reduce CO2
emissions as a packaging material
❺ Biodegradable
From Refi ll to Replacement
SPOPS
TM
TM
22 23Nippon Paper Industries Co., Ltd. Annual Report 2017 Nippon Paper Industries Co., Ltd. Annual Report 2017

In the fi eld of packaging, plastic materials are commonly used, but SHIELDPLUSTM is an innovative, eco-friendly packaging material that endows paper, a biomass material, with the functions required in packaging.
In developing SHIELDPLUSTM, our researchers labored to come up with a technology that would give paper, a permeable material, oxygen and fl avor barrier properties. We are now developing SHIELDPLUSTM Premier, which will also provide barrier properties against vapor, one of the weak points of paper. Our goal is to make paper packages a familiar part of daily life in various settings. Through these new materials, we will contribute broadly to society.
We developed MinerPaTM, a new functional material, by densely bonding inorganic mineral particles onto the surface of cellulose fi bers, a raw material used in paper. Based on our unique pulp processing technology, this was made possible by combining our material development technology and papermaking technology. More than ordinary paper, MinerPaTM offers the various functions of inorganic mineral particles as well as the characteristics and advantages of cellulose fi bers. Development was a cross-departmental project that involved not just researchers, but the cooperation of people in planning, technology and sales departments. As a result, MinerPaTM was developed in an exceptionally short period of time. We are now working to quickly develop practical applications.
“I want to be rid of the annoyance of refi lling containers!” The idea that emerged from this sentiment of one consumer is SPOPSTM. To give shape to that idea, we employed new techniques, including the use of a 3D printer, and fi nally released a concept model. The response at the exhibition and attention from the media was even greater than expected, and indicate a promising future for SPOPSTM. There are still some technical hurdles we have to clear before bringing SPOPSTM to market, but we will continue to work toward commercialization, envisioning the day when a product created by Nippon Paper changes the way people live.
A New Paper Packaging Material
Th at Replaces Plastic
Developing Practical Applications for MinerPaTM
From Refi ll to Replacement:
Making Daily Life More Convenient
Masashi Okamoto
Research Manager Packaging Research Laboratory
Shisei Goto
Senior Research ManagerResearch Laboratory
Takaharu Noda
ManagerPackaging Communication Center
Business Section
SHIELDPLUS
MinerPa
SPOPS
Comments from Developers
The Nippon Paper Group at a Glance ...26
Pulp and Paper
Paper Business ...............................28
Paperboard Business .....................29
Household Paper Products ............30
Energy Business .............................32
Paper-Related
Paper-Pak Business .......................34
Chemical Business .........................36
Wood Products and Construction Related / Other .............38
24 Nippon Paper Industries Co., Ltd. Annual Report 2017

Business Section
The Nippon Paper Group at a Glance
Net sales ¥63.5 billion(up ¥1.3 billion year-on-year)
Operating income
¥4.8 billion(up ¥1.2 billion year-on-year)
Net sales ¥19.7 billion(down ¥8.7 billion year-on-year)
Operating income
¥3.0 billion(up ¥0.5 billion year-on-year)
Net sales ¥89.2 billion(up ¥0.3 billion year-on-year)
Operating income
¥5.2 billion(up ¥2.5 billion year-on-year)
OtherPaper-RelatedWood Products and Construction Related
Pulp and Paper
ResultsResults
FY2017/3 Operating ResultsFY2017/3 Operating Results
ResultsResults
FY2017/3 Operating ResultsFY2017/3 Operating Results
Description of Business
This segment is engaged in a variety of businesses that generate synergies with the core businesses of the Group: the sports and leisure business, which draws on the Group’s real estate assets; and the logistics business, which provides support to the pulp and paper business.
Main Products and Services
• Warehousing and transportation • Sports and leisure
Description of Business
This segment is engaged in three business domains: the lumber business that developed out of our efforts to procure wood for papermaking, the construction materials business that works lumber into value-added products, and the civil engineering and construction business that originated from the plant-maintenance units of our paper mills.
Main Products and Services
• Lumber • Construction materials • Civil engineering
Description of Business
Various paper, paperboard and household paper products in this segment lead the domestic industry in production, sales volume and quality. We are proactively developing overseas markets especially in Asia and the Pacifi c Rim.
Main Products and Services
Paper
• Newsprint • Printing and publication paper• Business communication paper • Packaging paper
Paperboard
• Containerboard • White paperboard • Chipboard • Base paper for building materials
Household paper products
• Facial tissue • Bathroom tissue • Adult diapers
Specialty and high-performance products
• Filter paper • Thin paper • Tobacco-related paper
Description of Business
In this segment, we promote two business domains: the paper processing business delivers value-added products made of paper, and the chemical products and functional materials business utilizes various technologies and expertise entailing the advanced use of wood and papermaking by-products.
Main Products and Services
Processed paper products
• Liquid-packaging cartons • Filling machines and maintenance services • Paper bags
Chemical products and functional materials
• Dissolving pulp • Chemical products • Functional films • Functional coating material
6.4 % 82.6 % 2.0 % 9.0 %
Net sales share
Net sales share
Net sales share
Net sales share
Net sales ¥820.0 billion(down ¥7.6 billion year-on-year)
Operating income
¥10.8 billion(down ¥3.0 billion year-on-year)
2015/3 2016/3 2017/3
3.6
59.25.9
7.5
62.2
4.83.62.1
63.5
■■ Net sales (¥ billion) ■■ Operating income (¥ billion)
●● Operating income margin (%)
2015/3 2016/3 2017/3
4.1
66.7
8.714.8
28.5
3.02.52.719.7
■■ Net sales (¥ billion) ■■ Operating income (¥ billion)
●● Operating income margin (%)
2015/3 2016/3 2017/3
1.8
835.5
1.71.3
827.6
10.813.815.0
820.0
■■ Net sales (¥ billion) ■■ Operating income (¥ billion)
●● Operating income margin (%)
2015/3 2016/3 2017/3
4.1
91.0
3.0
5.9
88.9
5.22.73.8
89.2
■■ Net sales (¥ billion) ■■ Operating income (¥ billion)
●● Operating income margin (%)
26 27Nippon Paper Industries Co., Ltd. Annual Report 2017 Nippon Paper Industries Co., Ltd. Annual Report 2017

Business Section
Paperboard BusinessPaper Business
Pulp and Paper
Atsushi O’HaruExecutive Offi cerGeneral Manager Printing Paper Sales Division
Satoru MutoPresidentNippon Tokai Industrial Paper Supply Co., Ltd.
By applying our technological advantage
and slashing costs, we will enhance the
competitiveness of print media.
We aim to capture the growing demand
for containerboard in Japan and Asia.
FY2017/3 Performance
In FY2017/3, domestic demand for newsprint and printing paper continued its decline from the previous year, and our domestic sales volume declined at essentially the same rate. However, while the market has weakened under this decline in demand, we have maintained the leading share of sales.
In exports, which are focused on Asia and Oceania, net sales rose with a 17.7% increase year-on-year on a volume basis, as a result of successful sales activities in local markets.
Progress of the Fifth Medium-Term Business Plan
In the second half of FY2017/3, our costs rose signifi cantly due to a weaker yen and higher prices for wastepaper and fuel. Accordingly, we announced price adjustments for printing paper and business communication paper in February 2017, and achieved a degree of success with the understanding of customers. We will make all-out efforts in sales to maintain this success.
The product management system that we began rolling out in FY2017/3 lets us see the progress of production. We are leveraging it for timely communication of production progress and delivery time to customers, while our sales and production teams collaborate closely to build stronger relationships of trust with customers.
The market environment is always subject to change. To respond promptly to change, we will work to review and strengthen our sales structure from a variety of approaches.
FY2017/3 Performance
In FY2017/3, domestic sales of containerboard base paper, our core product, increased year-on-year, as did exports to Southeast Asia and East Asia. This was due largely to growth in sales to end users who value the quality of our products and have made us their designated supplier. At the same time, the export price of wastepaper, a raw material, rose sharply from the second half of FY2017/3. Domestic prices increased accordingly, placing pressure on earnings.
In October 2016, we began a business alliance with Tokushu Tokai Paper Co., Ltd.
Progress of the Fifth Medium-Term Business Plan
Two joint ventures that we established with Tokushu Tokai Paper Co., Ltd. — the sales company Nippon Tokai Industrial Paper Supply Co., Ltd. (NTI) and the manufacturing company Shin Tokai Paper Co., Ltd. (STP) — began operating in October 2016. At NTI, we are working to streamline transportation and increase effi ciency. At STP, Nippon Paper is exchanging technologies developed by each of the partner companies and are bringing in Nippon Paper’s production expertise, resulting in synergistic effects in cost reduction.
We will work to further boost our competitiveness while we benefi t from growing containerboard demand, especially in the beverage and e-commerce industries.
❶ Strong technological capabilities with a track record of creating new products
❷ Production bases and a sales/distribution network throughout Japan
❸ A broad product lineup
Continue to pursue value in print media through an extensive product lineup and the technological expertise to create new products that anticipate needs
Accurately capture users’ needs and meet increased demand for containerboard through unique differentiated products
Our Strengths
Our Vision
Our Vision
Domestic demand for paper continues to decline. Behind this trend is Domestic demand for paper continues to decline. Behind this trend is the ongoing shift toward electronic and other non-print media in the the ongoing shift toward electronic and other non-print media in the fi elds of publishing and advertising. We have continued to create new fi elds of publishing and advertising. We have continued to create new products that meet needs including high-bulk, light weight coated paper, products that meet needs including high-bulk, light weight coated paper, matte coated paper with excellent ink drying performance, and light matte coated paper with excellent ink drying performance, and light weight coated ink-jet paper in the fi elds of publishing, printing, and weight coated ink-jet paper in the fi elds of publishing, printing, and business communication paper. Through our solid technological business communication paper. Through our solid technological capabilities and thorough cost reductions, we will enhance the capabilities and thorough cost reductions, we will enhance the competitiveness of print media and advance manufacturing that will competitiveness of print media and advance manufacturing that will entice customers to continue to choose the value of paper.entice customers to continue to choose the value of paper.
Further growth is anticipated in the containerboard fi eld. As Japan’s largest Further growth is anticipated in the containerboard fi eld. As Japan’s largest dedicated base paper manufacturer, our strength in this fi eld is the ability dedicated base paper manufacturer, our strength in this fi eld is the ability to provide a stable supply of products to containerboard manufacturers to provide a stable supply of products to containerboard manufacturers nationwide from the standpoint of business continuity planning. In sales, nationwide from the standpoint of business continuity planning. In sales, we will develop new products that meet user needs in line with market we will develop new products that meet user needs in line with market trends, and will capture growing demand for containerboard.trends, and will capture growing demand for containerboard.
In our export strategy, we will leverage our cost competitiveness, the In our export strategy, we will leverage our cost competitiveness, the locations of our mills, and our brand power to strengthen our sales to locations of our mills, and our brand power to strengthen our sales to Southeast Asia and China, where demand is growing.Southeast Asia and China, where demand is growing.
❶ Balanced deployment of mills across Japan
❷ Possession of linerboard machines through in-house manufacture of softwood Kraft pulp
❸ Substantial research and development capabilities
❹ Long-standing relationships of trust with containerboard manufacturers and end users
❺ Sales capabilities to quickly propose solutions
Our Strengths
28 29Nippon Paper Industries Co., Ltd. Annual Report 2017 Nippon Paper Industries Co., Ltd. Annual Report 2017

Business Section
Household Paper Products
Yasunori NanriPresident and Representative Director Nippon Paper Crecia Co., Ltd.
Poise® Hada Care Pad Regular
Kleenex® Premium Tissue, 3-box pack
Hada Care Acty Soft Fit Comfortable Thin Pants
Kleenex®, 5-box pack Scottie® Flower Pack Triple Length, 4 rolls
(double)
❶ Beloved and trusted brands
❷ Highly competitive mills
❸ Product development capabilities enhanced by Group synergies
❹ A group of differentiated products, the world’s fi rst to use CNF
Provide valuable products and brands that contribute to healthy and clean lifestyles
Our Strengths
Our VisionFY2017/3 Performance
In FY2017/3, our Household Paper Products business overall was stronger than in the previous year, achieving substantial growth in sales and income. The intensive restructuring of our production system and productivity improvements that we have implemented have begun to yield effects. Moreover, the market continues to benefi t from inbound tourism, with an increase in the number of hotels boosting sales of household products and professional products. Sales in e-commerce and other new areas also expanded. The stronger yen in the fi rst half was also a positive factor, restraining the costs of fuel and of raw material pulp.
In addition to these factors, the triple-length toilet paper rolls developed through our unique technology proved to be a hit with consumers. Sales were strong in healthcare products, especially adult diapers and incontinence pads, and exceeded the previous year in performance.
Progress of the Fifth Medium-Term Business Plan
In FY2017/3, we carried out planned capital investments to make the Kyoto Mill our main production facility, with the aim of achieving net sales of ¥20 billion in healthcare products. While further enhancing our production technology in the pursuit of effi ciency, we will also strengthen our product development capabilities.
In anticipation of expanding demand for household paper, in December 2016 we reached an agreement with Kasuga Paper Industry Co., Ltd., a major manufacturer of wastepaper recycled products, that resulted in the April 2014 establishment of a joint venture for household paper products. The new company, Crecia-Kasuga Co., Ltd., is scheduled to begin operation in May 2018, after the installation of new production facilities at Nippon Paper’s Fuji Mill site for products including toilet paper rolls.
In April 2017, we launched a triple-length paper towel roll. We are also undertaking a major renewal of the Kleenex brand, which has a history of over 50 years in Japan, as we work to earn the support of consumers in every generation. Our household products business will continue to emphasize a brand communication strategy while also leveraging e-commerce.
In FY2017/3, we achieved record net sales and In FY2017/3, we achieved record net sales and operating income. Going forward, we will operating income. Going forward, we will accelerate our growth by creating a stable accelerate our growth by creating a stable management foundation and promoting management foundation and promoting business restructuring. Specifi cally, we aim to business restructuring. Specifi cally, we aim to further expand our business by investing further expand our business by investing resources in areas including the following: resources in areas including the following: further strengthening of our globally recognized further strengthening of our globally recognized brands; research and development into high- brands; research and development into high- value-added products such as innovative, value-added products such as innovative, extra-length toilet paper rolls; strengthening extra-length toilet paper rolls; strengthening sales of healthcare products made with highly sales of healthcare products made with highly effi cient deodorant sheets that mark the fi rst use effi cient deodorant sheets that mark the fi rst use in the world of cellulose nanofi bers (CNF); in the world of cellulose nanofi bers (CNF); expansion of our professional products expansion of our professional products business, which boasts domestic industry-business, which boasts domestic industry-leading scale and quality; and the introduction leading scale and quality; and the introduction of cutting-edge facilities that will boost our of cutting-edge facilities that will boost our ability to supply household paper.ability to supply household paper.
Our strong brands and product value
will support steady expansion of our
household paper and healthcare
product businesses.
30 31Nippon Paper Industries Co., Ltd. Annual Report 2017 Nippon Paper Industries Co., Ltd. Annual Report 2017

Business Section
Energy Business
Suzukawa Thermal Power Generation Plant
Shoji UedaDirectorGeneral ManagerEnergy Business Division
❶ Power generation technology developed through paper manufacturing
❷ Power generation capacity of 1,800 MW
❸ Bases in favorable locations throughout Japan
❹ Global procurement network for wood resources
Generate stable earnings over the long term by expanding our business with a focus on renewable energy
Our Strengths
Our Vision
FY2017/3 Performance
Our Energy business is developing a power generation business that includes thermal power generation and other power generation such as solar, biomass and wind. In doing so, we are leveraging the on-site power generation facilities of our many production bases and our extensive expertise in fuel procurement and operating technology as resources. In September 2016, we began operation of the 13 MW expansion to the Komatsushima Solar Power Plant, bringing the power generation capacity of the plant to 34 MW.
In addition, together with Mitsubishi Corporation Power Ltd. and Chubu Electric Power Co., Inc. we established a power business venture, Suzukawa Energy Center, which began commercial operation of a new 112 MW thermal power plant in September 2016 at our Fuji Mill Suzukawa in Shizuoka Prefecture. Taking charge of operations and maintenance at Suzukawa Energy Center, Nippon Paper will play a role in the stable supply of electrical power to society.
Progress of the Fifth Medium-Term Business Plan
We have begun construction of a mixed-fuel coal and biomass power generation project (149 MW) in Ishinomaki, Miyagi Prefecture and a wind power generation project (7.5 MW) in Akita, Akita Prefecture, both of which are scheduled to go into operation in 2018. We are also considering the siting of a mixed-fuel coal and biomass power generation plant in Akita.
We have set a medium- to long-term goal of ¥50 billion in net sales for the Energy business overall, and are steadily building a structure for this under the Fifth Medium-Term Business Plan. We will establish sources of earnings that feature long-term stability and environmental merit, thereby contributing to the sustainable growth of our Group.
Making full use of the expertise in wood we have accumulated over the years since our founding, we are also developing a new woody biomass fuel in pellet form. Trial production in Thailand and mixed combustion experiments at the Kushiro Mill are taking place, with expectations for the birth of a carbon-neutral fuel.
Nippon Paper has a large number of on-site Nippon Paper has a large number of on-site power generation facilities at its production power generation facilities at its production bases throughout Japan. This provides the bases throughout Japan. This provides the company with strengths in infrastructure company with strengths in infrastructure including power grid systems and port facilities, including power grid systems and port facilities, as well as experienced operators and as well as experienced operators and operational technology. Our Energy business is operational technology. Our Energy business is taking advantage of these to expand solar- and taking advantage of these to expand solar- and wind-based power generation, as well as wind-based power generation, as well as biomass-based power generation, an area in biomass-based power generation, an area in which our company holds advantages that which our company holds advantages that include a global procurement network for wood include a global procurement network for wood resources. We will expand our businesses that resources. We will expand our businesses that leverage the renewable energy sources on leverage the renewable energy sources on which society places great expectations, and which society places great expectations, and will generate stable earnings over the long term will generate stable earnings over the long term while contributing to the reduction of COwhile contributing to the reduction of CO22 emissions.emissions.
Construction is moving forward as
planned and we are working to generate
stable earnings.
32 33Nippon Paper Industries Co., Ltd. Annual Report 2017 Nippon Paper Industries Co., Ltd. Annual Report 2017

Business Section
Paper-Pak Business
NP-PAK RockOur proprietary new-shape carton for chilled beverages.
It has a closure as a standard feature, and is 20 millimeters slimmer than conventional cartons, making it easy to hold.
NP-PAK fi lling machine (UP-F14)Multi-function AI fi lling machine, able to fi ll containers of varied designs, sizes, and closures with a single machine
Yasuhito ObayashiExecutive Offi cerGeneral ManagerPaper-Pak Sales Division
Japan’s largest total system supplier for liquid packaging cartons
Build our liquid packaging business into a world-class business
Our Strengths
Our Vision
FY2017/3 Performance
In FY2017/3, sales volume of our paper packs grew year-on-year due to expanded sales of new fi lling machines and heightened demand for fruit and vegetable drinks. During the fi scal year, we also maintained the top share in Japan of chilled liquid carton packaging. Earnings improved signifi cantly as a result of an increase in paper pack production volume and the positive impact of the stronger yen, as well as withdrawal from the unprofi table Film Packaging business at the end of September 2016.
Our new-shape carton with closure, offered under the licensing agreement that Nippon Paper signed with Elopak AS of Norway in March 2016, was adopted by major domestic beverage producers. The carton began appearing in retail shops at the end of FY2017/3, boosting sales. In addition, we brought NP-PAK Rock (left photo), our proprietary packaging carton with closure for chilled products, to the market in September 2016. NP-PAK Rock has the closure as a standard feature, and with its unique hexahedral design featuring beveled panels on both sides, we will aim for a larger share of the soft drink carton market.
Progress of the Fifth Medium-Term Business Plan
We are working to reconstruct our production structure and bring new products to market. We stopped production at Soka Paper-Pak Co., Ltd. at the end of July 2017, and will integrate production subsidiaries to establish Nippon Paper Liquid Package Product Co., Ltd. in October 2017. We aim to strengthen cost competitiveness through this integration, and plan to establish a Technical Center within the new company in November to act as a development base.
Chilled liquid carton packaging has seen little change in form or function for about 50 years, and sales have been sluggish in recent years. However, we believe we can capture new demand by developing and introducing new products that excel in design and functionality. In April 2017, we began operation of new sheet-fed offset printing presses that produce an aesthetically pleasing fi nish. We will bring to market a succession of products with design and functionality that can enhance the value of products as tools for beverage producers’ communication with consumers, and thereby achieve top-line expansion.
In FY2017/3, our new-shape carton with In FY2017/3, our new-shape carton with closure was adopted for the fi rst time by a closure was adopted for the fi rst time by a major domestic customer. We also constructed major domestic customer. We also constructed an integrated business system, spanning base an integrated business system, spanning base paper to converting and sales and maintenance paper to converting and sales and maintenance of fi lling machines, through the acquisition of the of fi lling machines, through the acquisition of the liquid packaging board business of Weyerhaeuser liquid packaging board business of Weyerhaeuser Company. At the same time, we have shut Company. At the same time, we have shut down the aging Soka Paper-Pak Co., Ltd., and down the aging Soka Paper-Pak Co., Ltd., and will achieve stable supply and cost reductions will achieve stable supply and cost reductions under a structure composed of two mills in the under a structure composed of two mills in the Kanto region and one mill in the Kansai region.Kanto region and one mill in the Kansai region.
To drive top-line growth, in April we introduced To drive top-line growth, in April we introduced the world’s fastest sheet-fed offset printing the world’s fastest sheet-fed offset printing presses. In November, we opened a Technical presses. In November, we opened a Technical Center that integrates the functions of Center that integrates the functions of development, operation, and maintenance, with development, operation, and maintenance, with the aim of speeding up new product development. the aim of speeding up new product development. We have obtained forest certifi cation and will We have obtained forest certifi cation and will strengthen our offerings of environmentally strengthen our offerings of environmentally friendly products.friendly products.
We will tackle the global beverage
packaging market with
“Made-in-Japan Quality.”
Paper-Related
34 35Nippon Paper Industries Co., Ltd. Annual Report 2017 Nippon Paper Industries Co., Ltd. Annual Report 2017

Business Section
Chemical Business
Carboxymethyl cellulose is used in baked goods Functional fi lms
❶ Proprietary soluble polyolefi n
❷ Only producer of sulfi te lignin in Japan
❸ Thin-fi lm precision coating technology
Complete use of wood through the proprietary technology of our Chemical business
Our Strengths
Our Vision
FY2017/3 Performance
The products of the Chemical business range from additives for automotive and other paints to concrete admixtures, food additives, and fi lms for computer and smartphone LCDs, making contributions to people’s daily lives in countless forms.
Sales of functional fi lms for liquid crystal displays remained weak in the fi rst half of FY2017/3, but gradually recovered from the second half. Sales of functional coating resins for automobiles were strong overall, in line with a global increase in automobile production. As a result, the Chemical business achieved increased sales and profi ts year-on-year.
Demand for dissolving pulp (DP) is expected to continue growing. We increased DP production capacity at the Gotsu Mill, completing the construction on schedule by the end of FY2017/3.
Progress of the Fifth Medium-Term Business Plan
We moved ahead with the renovation of turbines for in-house power generation to enhance infrastructure at the Gotsu Mill, with completion scheduled for the end of FY2018/3. We also began sales of new hardcoat fi lms for OLED displays, and in FY2018/3 will work to expand sales of these and DP, for which we are increasing production at the Gotsu Mill.
At the same time, we are steadily moving forward with initiatives that look even further ahead. First, at the end of FY2018/3 we plan to complete improvements for increased production of functional coating resins for automobiles, for which demand is growing. We will also continue to explore M&A while cultivating new needs in niche areas and performing research and development that will let us provide high-value-added products.
We will also strengthen our tripartite structure of research, production, and sales, as we initiate more fi nely tuned sales activities, strengthen our domestic business foundation, and develop overseas sales.
Nippon Paper uses Japan’s only sulfi te pulping Nippon Paper uses Japan’s only sulfi te pulping (SP) method to manufacture pulp that is used (SP) method to manufacture pulp that is used as a raw material for rayon and cellophane. as a raw material for rayon and cellophane. Manufactured from the pulp effl uent generated Manufactured from the pulp effl uent generated in the pulp manufacturing process, lignin in the pulp manufacturing process, lignin products have excellent binding, dispersing, products have excellent binding, dispersing, and chelating properties, and are used in a wide and chelating properties, and are used in a wide range of fi elds including construction, agriculture range of fi elds including construction, agriculture and apparel. Accordingly, our Chemical and apparel. Accordingly, our Chemical business conducts activities in the pursuit of the business conducts activities in the pursuit of the complete use of recyclable wood resources. In complete use of recyclable wood resources. In addition, the business aims to become the top addition, the business aims to become the top player in niche areas including adhesion player in niche areas including adhesion promoters for polyolefi n-based materials and promoters for polyolefi n-based materials and thin-fi lm precision coating technology.thin-fi lm precision coating technology.
We aim to pursue the complete use of
wood resources and become the top
player in niche areas.
Yozo IgarashiExecutive Offi cerGeneral Manager Chemical Sales Division
36 37Nippon Paper Industries Co., Ltd. Annual Report 2017 Nippon Paper Industries Co., Ltd. Annual Report 2017

Business Section
Sustainability Section
Promotion of CSR Activities ..................40
Corporate Governance .......................... 41
Comments from Outside Officers ......... 47
Directors and Statutory Auditors ...........48
Human Resource Initiatives ...................50
Environmental Initiatives ........................ 51
Initiatives for Communities and Society .........................................52
For further details, see the Sustainability Report.http://www.nipponpapergroup.com/english/csr/download/
Nippon Paper Industries Co., Ltd.
Nippon Paper Logistics Co., Ltd. (holding company)
Nanko Unyu Co., Ltd. Kyokushin TransportCorporation
NIPPON PAPER LOGISTICSCO., LTD.
Group Logistics Organization
Wood Products and Construction Related / Other
In FY2017/3, an increase in new housing starts from the previous year and the new consolidation of Amapa Florestal e Celulose S.A. (AMCEL) in Brazil resulted in increased sales and profi ts for the business.
In FY2018/3, we will continue to expand our handling of domestic lumber and wood chips for fuel.
Performance in the distribution business and leisure business remained robust. As a result of Shikoku Coca-Cola Bottling Co., Ltd., which runs the beverages business, being excluded from consolidation in the previous fi scal year, sales decreased and profi ts increased.
In June 2017, Nippon Paper established Nippon Paper Logistics Co., Ltd., an intermediate holding company. Through this, we aim to strengthen collaboration among NIPPON PAPER LOGISTICS CO., LTD., Nanko Unyu Co., Ltd. and Kyokushin Transport Corporation, the main logistics subsidiaries of our Group.
Wood Products and Construction Related
Other
38 Nippon Paper Industries Co., Ltd. Annual Report 2017
Sustainability Section
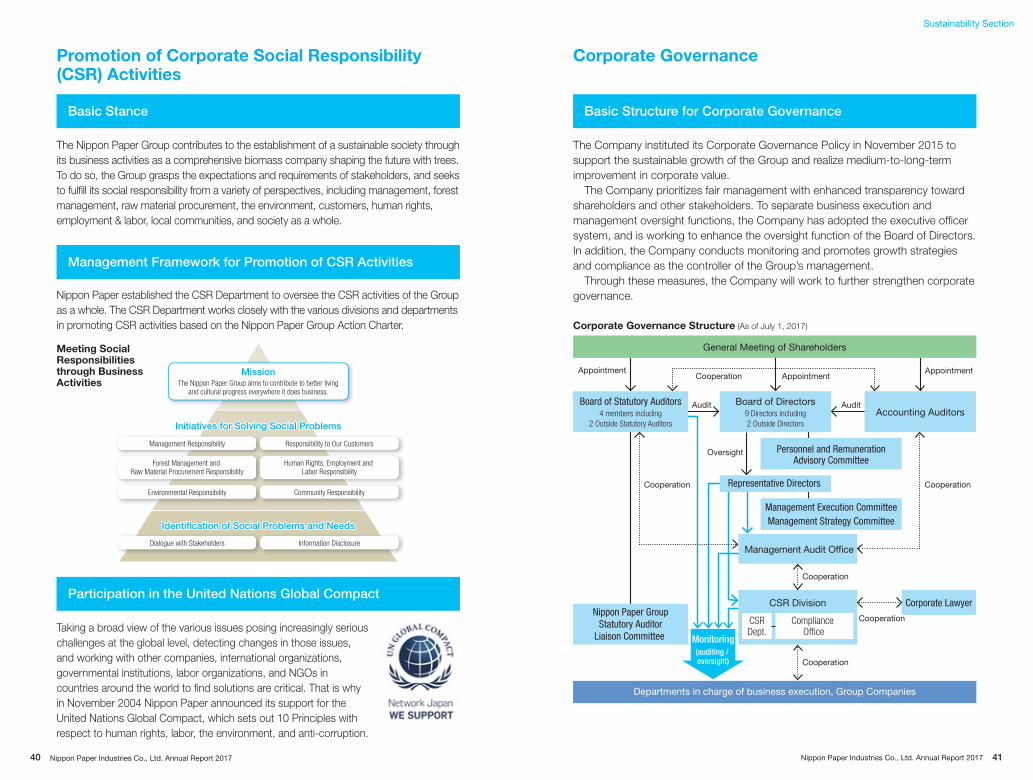
The Company instituted its Corporate Governance Policy in November 2015 to support the sustainable growth of the Group and realize medium-to-long-term improvement in corporate value.
The Company prioritizes fair management with enhanced transparency toward shareholders and other stakeholders. To separate business execution and management oversight functions, the Company has adopted the executive offi cer system, and is working to enhance the oversight function of the Board of Directors. In addition, the Company conducts monitoring and promotes growth strategies and compliance as the controller of the Group’s management.
Through these measures, the Company will work to further strengthen corporate governance.
Corporate Governance
Basic Structure for Corporate Governance
General Meeting of Shareholders
Departments in charge of business execution, Group Companies
Board of Statutory Auditors4 members including
2 Outside Statutory Auditors
Nippon Paper Group Statutory Auditor Liaison Committee
Board of Directors9 Directors including
2 Outside Directors
Management Audit Office
Corporate Lawyer
Representative Directors
Accounting Auditors
Appointment AppointmentAppointment
Oversight
Cooperation
Management Execution CommitteeManagement Strategy Committee
Personnel and Remuneration Advisory Committee
Cooperation Cooperation
Cooperation
CSR Division
CSRDept.
Compliance Office
Cooperation
Audit Audit
Monitoring(auditing / oversight) Cooperation
Corporate Governance Structure (As of July 1, 2017)
The Nippon Paper Group contributes to the establishment of a sustainable society through its business activities as a comprehensive biomass company shaping the future with trees. To do so, the Group grasps the expectations and requirements of stakeholders, and seeks to fulfi ll its social responsibility from a variety of perspectives, including management, forest management, raw material procurement, the environment, customers, human rights, employment & labor, local communities, and society as a whole.
Nippon Paper established the CSR Department to oversee the CSR activities of the Group as a whole. The CSR Department works closely with the various divisions and departments in promoting CSR activities based on the Nippon Paper Group Action Charter.
Taking a broad view of the various issues posing increasingly serious challenges at the global level, detecting changes in those issues, and working with other companies, international organizations, governmental institutions, labor organizations, and NGOs in countries around the world to fi nd solutions are critical. That is why in November 2004 Nippon Paper announced its support for the United Nations Global Compact, which sets out 10 Principles with respect to human rights, labor, the environment, and anti-corruption.
Promotion of Corporate Social Responsibility (CSR) Activities
Responsibility to Our Customers
Human Rights, Employment and Labor Responsibility
Community ResponsibilityEnvironmental Responsibility
Forest Management and Raw Material Procurement Responsibility
Management Responsibility
Dialogue with Stakeholders Information Disclosure
The Nippon Paper Group aims to contribute to better livingand cultural progress everywhere it does business.
Mission
Initiatives for Solving Social ProblemsInitiatives for Solving Social Problems
Identification of Social Problems and NeedsIdentification of Social Problems and Needs
Meeting Social Responsibilities through Business Activities
Basic Stance
Management Framework for Promotion of CSR Activities
Participation in the United Nations Global Compact
40 41Nippon Paper Industries Co., Ltd. Annual Report 2017 Nippon Paper Industries Co., Ltd. Annual Report 2017

Sustainability Section
Board of DirectorsThe Board of Directors determines basic policies for the management of the Company and the Nippon Paper Group, matters related to stipulations in laws, regulations and the Articles of Incorporation of the Company and other important managerial matters. The board also supervises the business execution of the Group.
Management Execution Committee and Management Strategy CommitteeThe Management Execution Committee meets once a week to assist the business execution of the President and deliberate on important business execution matters. The Management Strategy Committee meets as necessary to deliberate on management strategies by business segment and other important matters related to the Group.
Statutory Auditors and Board of Statutory AuditorsStatutory auditors attend important meetings such as meetings of the Board of Directors, the Management Execution Committee and the Management Strategy Committee, strictly supervise directors’ business execution and strictly audit the Company’s overall business activities to ensure their legality and fairness.
The Board of Statutory Auditors presides over the Nippon Paper Group Statutory Auditor Liaison Committee and holds meetings regularly to discuss audit policies and methods and exchange information with corporate auditors at each Group company to reinforce the alliance and audit functions of the Group.
Management Audit Offi ceThe Management Audit Offi ce, which is directly under the President’s control and consists of 13 members, conducts an internal audit of the Company and each company of the Group and a comprehensive evaluation of the internal control reporting system regarding fi nancial reporting. The internal audits are conducted in terms of legality and appropriateness from fair and independent perspectives.
Personnel and Remuneration Advisory CommitteeThe Personnel and Remuneration Advisory Committee receives inquiries from the Board of Directors on matters such as the selection process, qualifi cations and reasons for nomination of director and statutory auditor candidates, the criteria for determining the independence of independent outside offi cers, and the remuneration system for directors and statutory auditors. It replies to those inquiries after considering their appropriateness and also taking into account its assessment of the Company’s business performance and other factors.
Although the Company believes that the persons who control the decisions on the fi nancial and business policies of the Company should be the ones who contribute to ensuring and improving the Company’s corporate value and the common interests of shareholders, the fi nal decision on the ideal persons to control a company should be left to the shareholders.
However, among large-scale purchases and offers to purchase the stock of the Company, there are cases that could harm the common interests of shareholders. Some are clearly harmful to our corporate value and the common interests of shareholders in light of their purposes and post-acquisition management policies.
Some entail the risk of shareholders actually being forced to sell their stock. Some do not provide enough time and/or information for shareholders to check and assess the purchase conditions and/or the Board of Directors of the Company to present an alternative proposal to shareholders. Some require negotiation with the purchaser to make the proposed purchase conditions more favorable.
The Company judges such persons who try to conduct a harmful acquisition to be inappropriate to control the decisions on the fi nancial and business policies of the Company.
As a measure to prevent control of decisions on the fi nancial and business policies of the Company by persons judged to be inappropriate in light of the policies described above, the Company introduced a countermeasure policy (anti-takeover measures) for large-scale purchases of the Company’s stock to
Basic Policy Concerning Company Control
Corporate Governance Summary
Type of Organization Company with a Board of Statutory Auditors
Chairman of Board of Directors Yoshio Haga
Number of Directors* 9 (including 2 outside directors)
Number of Statutory Auditors* 4 (including 2 outside statutory auditors)
Appointment of Independent Offi cers*
4 (2 outside directors and 2 outside statutory auditors)
Board of Directors Meetings in FY2017/3
Number of meetings: 14Attendance rate of outside directors: 100%Attendance rate of outside statutory auditors: 97%
Board of Statutory Auditors Meetings in FY2017/3
Number of meetings: 13Attendance rate of outside statutory auditors: 100%
Remuneration, etc. of Directors Base remuneration is set according to responsibilities, with 70% paid in a fi xed amount and 30% increasing or decreasing according to the previous year’s results. Total amount of remuneration paid in FY2017/3: ¥389 million
Remuneration, etc. of Statutory Auditors
Total amount of remuneration paid in FY2017/3: ¥61 million
Independent Accounting Auditor Ernst & Young ShinNihon LLC*Information is as of July 1, 2017
42 43Nippon Paper Industries Co., Ltd. Annual Report 2017 Nippon Paper Industries Co., Ltd. Annual Report 2017
Sustainability Section
FTSE4Good Index Series
Included in June 2017
Nippon Paper has been independently assessed according to the FTSE4Good criteria, and has satisfi ed the requirements to become a constituent of the FTSE4Good Index Series. Created by the global index provider FTSE Russell, the FTSE4Good Index Series is designed to measure the performance of companies demonstrating strong Environmental, Social and Governance (ESG) practices.
Ethibel Investment Register
Inclusion renewed in May 2014
A universe of companies selected by Forum Ethibel, a Belgian organization that promotes SRI, for their outstanding performance in terms of social responsibility. In making its selections, Forum Ethibel assesses companies on criteria including human rights, human capital, environment, market ethics, good governance, and social impact.
Euronext Vigeo World 120 Index
Inclusion renewed in June 2016
This is an equity index managed by NYSE Euronext, which operates securities exchanges in Europe and the U.S., and by Vigeo Eiris, an enterprise that assesses companies. This index is comprised of the 120 companies judged to be the most advanced in environmental, social, and governance matters in Europe, North America, and the Asia-Pacifi c region.
■■ Dividend per share (¥)
■■ Net income per share* (¥)
2016/32015/3 2017/3 2018/3(Plan)
50 6072.57
60
20.95
200.27
*Profit attributable to owners of parent
60
129.60
secure the time and information necessary for shareholders to properly judge whether to accept a large-scale acquisition by a purchaser or for the Board of Directors of the Company to present an alternative proposal to shareholders.
The Company holds its annual general meeting of shareholders at Keidanren Kaikan in the Otemachi district of Tokyo. We facilitate the execution of voting rights for shareholders by sending a convocation notice in English and establishing a service that allows shareholders to exercise their rights online.
The Company strives to reinforce its management base, improve profi tability and secure the sustainable growth of its corporate value to fulfi ll the expectations of shareholders.
Our basic dividend distribution policy is to provide steady cash dividend payments when possible based on a comprehensive assessment of the Group’s performance while ensuring retained earnings and pay interim and year-end dividends, in principle. Interim dividends are determined by resolution of the Board of Directors and year-end dividends are determined at the general meeting of shareholders.
General Meeting of Shareholders
Socially Responsible Investment
Basic Policy for Profi t Distribution to Shareholders
93rd Ordinary General Meeting of Shareholders (Held on June 29, 2017)
Number of shareholders who exercised voting rights
29,253
Percentage of voting rights exercised 81.6%
ProposalsProposal 1 Appropriation of surplus Approved
Proposal 2 Election of nine directors Approved
Based on evaluation of social responsibility in our corporate activities by external entities, Nippon Paper has been selected for inclusion in socially responsible investment (SRI) indices. We expect that this will make more investors aware of our outstanding initiatives.
Major SRI Indices Incorporating Nippon Paper
44 45Nippon Paper Industries Co., Ltd. Annual Report 2017 Nippon Paper Industries Co., Ltd. Annual Report 2017

Sustainability Section
Operating results presentation
The Company promotes IR activities, aiming for fair and timely information disclosure to shareholders and other investors, in line with the Nippon Paper Group Action Charter. Through such opportunities as shareholders’ meetings, briefi ngs and media interviews, we explain fi nancial results, medium- and long-term strategies and other information directly to shareholders and investors, listen to their opinions and requests and refl ect them in our management.
With the exception of quiet periods, the Company responds positively to requests for individual meetings with institutional investors and analysts throughout the year, being cognizant of maintaining fairness in the provision of information.
IR Activities
Activities during FY2017/3
Operating results presentation 1
Operating results conference calls 3
One-on-one meetings 176
Comments from Outside Offi cers
Yoshimitsu AoyamaOutside Director
Nippon Paper began undertaking business structure transformation several years ago, setting a focus on growth areas and development of new businesses as matters of urgency. However, a diffi cult business environment continues, including declining demand in the existing paper business and rising raw material and fuel prices. At such a time in particular, I believe it is necessary to strengthen governance on the basis of medium- to long-term forecasts, to disclose information concerning management, and to make management transparent.
For the purpose of strengthening governance, in 2016 the Company established a Personnel and Remuneration Advisory Committee that has outside directors as its main members. With regard to information disclosure, the Company is making efforts to share information with shareholders and other stakeholders through its Corporate Governance Report, Sustainability Report, and timely updating of its website.
As an outside director, I will redouble my efforts to improve the Company's corporate value and to return profi ts to society. I ask for your continued understanding and support for our efforts.
Serving as a judge in the past, I worked within the Ministry of Justice for a long period and was involved in a considerable number of civil legislation bills. I was in charge of Diet deliberations on Commercial Code revisions that introduced the “company with committees” system, and was involved with the current Companies Act until shortly before the submission of the bill. How to handle the governance of companies was a major question at the time, providing many opportunities to study the issue. A number of recent cases have reaffi rmed the importance of corporate governance and made me realize even more acutely the signifi cance of auditors’ duties.
While there are diffi cult circumstances surrounding the paper manufacturing industry, Nippon Paper is now making efforts to strengthen its existing businesses and effect business structure transformation. I hope to leverage my experience with the Ministry of Justice and courts in order to calmly render decisions from a third-party standpoint and contribute to the development of the company through the achievement of sound governance.
Seiichi FusamuraOutside Statutory Auditor
Working to strengthen governance and
make management more transparent
Achieving sound governance from a third-party perspective
46 47Nippon Paper Industries Co., Ltd. Annual Report 2017 Nippon Paper Industries Co., Ltd. Annual Report 2017
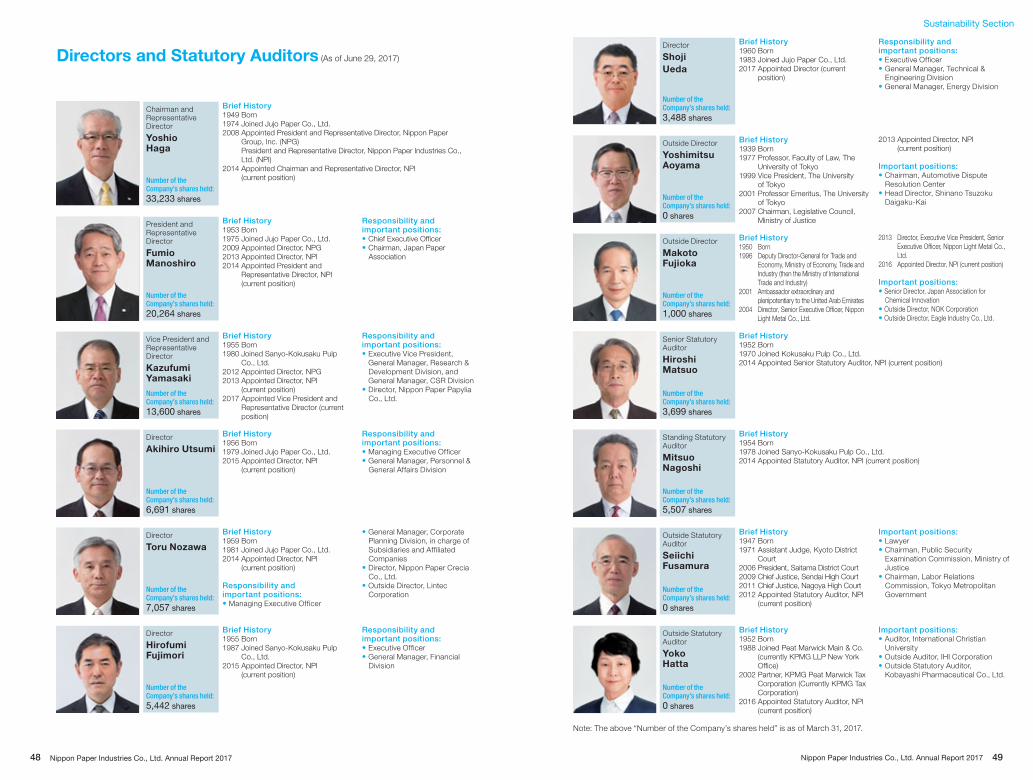
Sustainability Section
Directors and Statutory Auditors (As of June 29, 2017)
Brief History1955 Born1987 Joined Sanyo-Kokusaku Pulp
Co., Ltd.2015 Appointed Director, NPI
(current position)
Responsibility and important positions:• Executive Officer• General Manager, Financial
Division
Brief History1949 Born1974 Joined Jujo Paper Co., Ltd.2008 Appointed President and Representative Director, Nippon Paper
Group, Inc. (NPG) President and Representative Director, Nippon Paper Industries Co.,
Ltd. (NPI)2014 Appointed Chairman and Representative Director, NPI
(current position)
Brief History1952 Born1988 Joined Peat Marwick Main & Co.
(currently KPMG LLP New York Office)
2002 Partner, KPMG Peat Marwick Tax Corporation (Currently KPMG Tax Corporation)
2016 Appointed Statutory Auditor, NPI (current position)
Important positions:• Auditor, International Christian
University• Outside Auditor, IHI Corporation• Outside Statutory Auditor,
Kobayashi Pharmaceutical Co., Ltd.
Brief History1947 Born1971 Assistant Judge, Kyoto District
Court2006 President, Saitama District Court2009 Chief Justice, Sendai High Court2011 Chief Justice, Nagoya High Court2012 Appointed Statutory Auditor, NPI
(current position)
Important positions:• Lawyer• Chairman, Public Security
Examination Commission, Ministry of Justice
• Chairman, Labor Relations Commission, Tokyo Metropolitan Government
Brief History1956 Born1979 Joined Jujo Paper Co., Ltd.2015 Appointed Director, NPI
(current position)
Responsibility and important positions:• Managing Executive Officer• General Manager, Personnel &
General Affairs Division
Brief History1950 Born1996 Deputy Director-General for Trade and
Economy, Ministry of Economy, Trade and Industry (then the Ministry of International Trade and Industry)
2001 Ambassador extraordinary and plenipotentiary to the United Arab Emirates
2004 Director, Senior Executive Officer, Nippon Light Metal Co., Ltd.
2013 Director, Executive Vice President, Senior Executive Officer, Nippon Light Metal Co., Ltd.
2016 Appointed Director, NPI (current position)
Important positions:• Senior Director, Japan Association for
Chemical Innovation• Outside Director, NOK Corporation• Outside Director, Eagle Industry Co., Ltd.
Brief History1952 Born1970 Joined Kokusaku Pulp Co., Ltd.2014 Appointed Senior Statutory Auditor, NPI (current position)
Brief History1954 Born1978 Joined Sanyo-Kokusaku Pulp Co., Ltd.2014 Appointed Statutory Auditor, NPI (current position)
Brief History1955 Born1980 Joined Sanyo-Kokusaku Pulp
Co., Ltd.2012 Appointed Director, NPG2013 Appointed Director, NPI
(current position)2017 Appointed Vice President and
Representative Director (current position)
Responsibility and important positions:• Executive Vice President, General Manager, Research &
Development Division, and General Manager, CSR Division• Director, Nippon Paper Papylia
Co., Ltd.
Brief History1939 Born1977 Professor, Faculty of Law, The
University of Tokyo1999 Vice President, The University
of Tokyo2001 Professor Emeritus, The University
of Tokyo2007 Chairman, Legislative Council,
Ministry of Justice
2013 Appointed Director, NPI (current position)
Important positions:• Chairman, Automotive Dispute
Resolution Center• Head Director, Shinano Tsuzoku
Daigaku-Kai
Brief History1960 Born1983 Joined Jujo Paper Co., Ltd. 2017 Appointed Director (current
position)
Responsibility and important positions:• Executive Officer• General Manager, Technical &
Engineering Division• General Manager, Energy Division
Brief History1953 Born1975 Joined Jujo Paper Co., Ltd.2009 Appointed Director, NPG2013 Appointed Director, NPI2014 Appointed President and
Representative Director, NPI (current position)
Responsibility and important positions:• Chief Executive Officer• Chairman, Japan Paper
Association
Brief History1959 Born1981 Joined Jujo Paper Co., Ltd.2014 Appointed Director, NPI
(current position)
Responsibility and important positions:• Managing Executive Officer
• General Manager, Corporate Planning Division, in charge of Subsidiaries and Affiliated Companies
• Director, Nippon Paper Crecia Co., Ltd.
• Outside Director, Lintec Corporation
Number of theCompany’s shares held:5,442 shares
Number of the Company’s shares held:33,233 shares
Number of the Company’s shares held:6,691 shares
Number of the Company’s shares held:1,000 shares
Number of the Company’s shares held:0 shares
Number of the Company’s shares held:3,488 shares
Number of the Company’s shares held:0 shares
Number of the Company’s shares held:0 shares
Number of the Company’s shares held:13,600 shares
Number of the Company’s shares held:20,264 shares
Number of the Company’s shares held:7,057 shares
Director
Hirofumi Fujimori
Chairman and Representative Director
Yoshio Haga
Outside Statutory Auditor
Yoko Hatta
Director
Akihiro Utsumi
Outside Director
Makoto Fujioka
Senior Statutory Auditor
Hiroshi Matsuo
Standing Statutory Auditor
Mitsuo Nagoshi
Outside Statutory Auditor
Seiichi Fusamura
Vice President and Representative Director
Kazufumi Yamasaki
Outside Director
Yoshimitsu Aoyama
Director
Shoji
Ueda
President and Representative Director
Fumio Manoshiro
Director
Toru Nozawa
Note: The above “Number of the Company’s shares held” is as of March 31, 2017.
Number of the Company’s shares held:3,699 shares
Number of the Company’s shares held:5,507 shares
48 49Nippon Paper Industries Co., Ltd. Annual Report 2017 Nippon Paper Industries Co., Ltd. Annual Report 2017

Sustainability Section
Promoting the Use of Domestic WoodWith its network for wood procurement in Japan and its ability to handle a comprehensive lineup of products, Nippon Paper Lumber Co., Ltd. is actively developing its domestic wood business. In FY2016/3, the company handled approximately 770,000 m3 of domestically produced materials, and ranked second in its fi eld in Japan. The company aims to lift this fi gure to 1,000,000 m3, and, to this end, is continuing to develop new applications while working to boost exports.
Development of a New Biomass Solid Fuel Effective for Reducing CO2 EmissionsTrees absorb CO2 as they grow. When fuel made from trees (woody biomass fuel) is burned, the resulting CO2 is recognized as the CO2 that the trees absorbed and sequestered as they were growing, so there is no net impact on atmospheric CO2. Given this carbon-neutral characteristic of woody biomass fuel, the co-fi ring of woody biomass is being advanced to reduce the CO2 emissions of coal-fi red boilers. Woodchips and wood pellets, however, cannot be effi ciently ground and there are other issues, like weak water repellency when stored outdoors.
To address these challenges, we have applied torrefaction technology to carbonize woody biomass at a relatively low temperature to develop a new biomass solid fuel that has pulverization properties similar to those of coal and retains most of its energy value.
Human Resource Initiatives Environmental Initiatives
Our career development programs are aimed at fostering autonomous employees who boldly think about what needs to be done and then accomplish it. Based on that policy, we are enhancing training to develop people who will support the achievement of our medium-term business plans.
Currently we are strengthening initiatives such as development of global-minded employees, development of employees who embrace new challenges, employee coaching, which serves as the foundation for sustainable management, and diversity training to promote an inclusive workplace culture in which diverse employees can fulfi ll their potential.
We are putting in place a Group-wide environmental management system based on our Environmental Charter and engaging in environmentally friendly corporate activities. To reduce the environmental impact of our production processes, we are promoting effective initiatives to address environmental issues such as global warming, resource depletion, and air and water pollution, upholding the principles and basic stance expressed in the Nippon Paper Group Environmental Charter.
We are currently pursuing business expansion overseas, primarily in Asia, and are therefore focusing on developing globally competent employees. In addition to our existing trainee program in which young employees are dispatched to our overseas locations, we introduced a program of internships at overseas companies in 2016. This program is intended to give employees an understanding of the cultures and environments of different countries through overseas work experience, increase their desire to work abroad, and cultivate employees who can fl exibly handle international business situations.
In the fi rst year of this program, we sent 11 employees for one-month internships at startup businesses and other companies in Southeast Asia, particularly in Vietnam. The institutions accepting the interns include local chambers of commerce, temporary staffi ng agencies and others. One person who trained at a travel agency, for example, surmounted the language barrier and actively contributed to work such as proposals for improvement of tour packages and establishment of an incentive system for tour guides. Some participants who returned to Japan are already playing active roles in assignments at our overseas sites.
We will continue to conduct human resource development aligned with the expansion of our business in overseas markets.
Basic Stance Basic Stance
Nippon Paper Group InitiativesComment from the head of the Human Resources Planning Offi ce on the development of globally competent employees
We want to foster employees who can fl exibly adapt to overseas business settings.
Yuko Iijima, Senior Manager, Human
Resources Planning Offi ce, Personnel Department
Sugenuma, a Nippon Paper-owned Forest (Mt. Nikko-Shirane)
New woody biomass solid fuel made with torrefaction technology
464
562 529
632703
736
16/315/314/313/312/311/310/3
773
■ Unprocessed wood (1,000 m3)
■ Processed products (1,000 m3)
Domestic Wood Sales by Product
Type (Nippon Paper Lumber)
50 51Nippon Paper Industries Co., Ltd. Annual Report 2017 Nippon Paper Industries Co., Ltd. Annual Report 2017
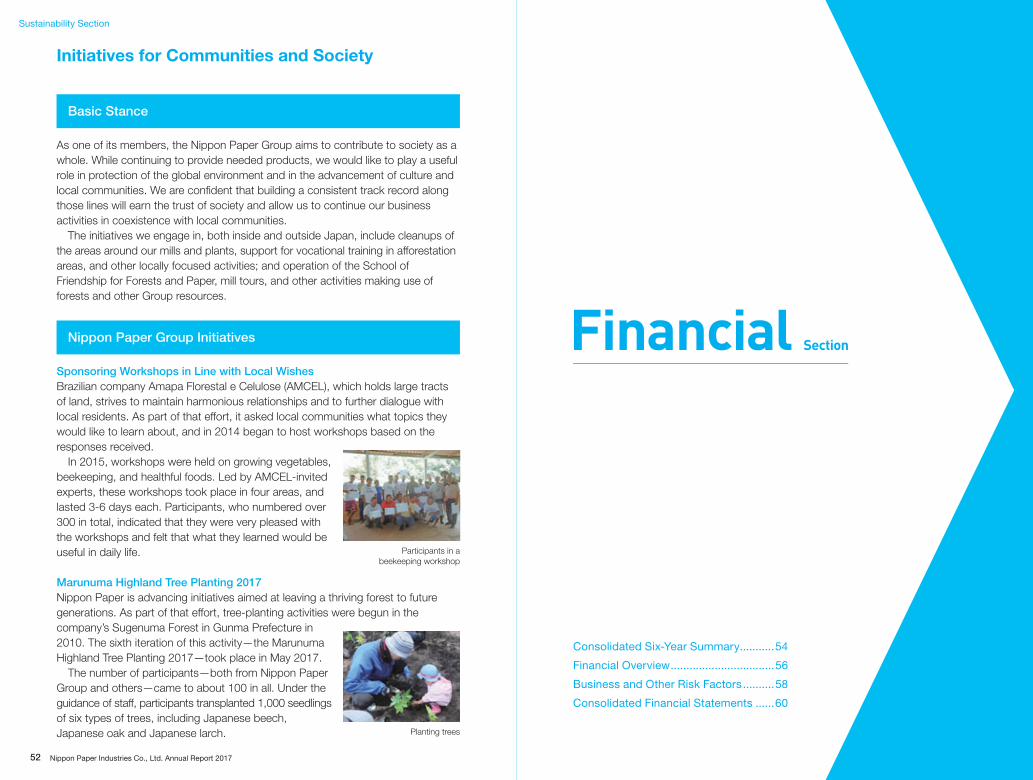
Sustainability Section
Initiatives for Communities and Society
As one of its members, the Nippon Paper Group aims to contribute to society as a whole. While continuing to provide needed products, we would like to play a useful role in protection of the global environment and in the advancement of culture and local communities. We are confi dent that building a consistent track record along those lines will earn the trust of society and allow us to continue our business activities in coexistence with local communities.
The initiatives we engage in, both inside and outside Japan, include cleanups of the areas around our mills and plants, support for vocational training in afforestation areas, and other locally focused activities; and operation of the School of Friendship for Forests and Paper, mill tours, and other activities making use of forests and other Group resources.
Sponsoring Workshops in Line with Local WishesBrazilian company Amapa Florestal e Celulose (AMCEL), which holds large tracts of land, strives to maintain harmonious relationships and to further dialogue with local residents. As part of that effort, it asked local communities what topics they would like to learn about, and in 2014 began to host workshops based on the responses received.
In 2015, workshops were held on growing vegetables, beekeeping, and healthful foods. Led by AMCEL-invited experts, these workshops took place in four areas, and lasted 3-6 days each. Participants, who numbered over 300 in total, indicated that they were very pleased with the workshops and felt that what they learned would be useful in daily life.
Marunuma Highland Tree Planting 2017Nippon Paper is advancing initiatives aimed at leaving a thriving forest to future generations. As part of that effort, tree-planting activities were begun in the company’s Sugenuma Forest in Gunma Prefecture in 2010. The sixth iteration of this activity—the Marunuma Highland Tree Planting 2017—took place in May 2017.
The number of participants—both from Nippon Paper Group and others—came to about 100 in all. Under the guidance of staff, participants transplanted 1,000 seedlings of six types of trees, including Japanese beech, Japanese oak and Japanese larch.
Basic Stance
Nippon Paper Group Initiatives
Planting trees
Participants in a beekeeping workshop
Financial Section
Consolidated Six-Year Summary ...........54
Financial Overview .................................56
Business and Other Risk Factors ..........58
Consolidated Financial Statements ......60
52 Nippon Paper Industries Co., Ltd. Annual Report 2017

Financial Section
Millions of yen
Thousands of U.S. dollars
(Note 2)
2012/3 2013/3 2014/3 2015/3 2016/3 2017/3 2017/3
Fiscal year
Net sales .......................................................................... ¥1,042,436 ¥1,025,078 ¥1,081,277 ¥1,052,491 ¥1,007,097 ¥ 992,428 $ 8,845,958
Cost of sales .................................................................... 803,653 796,411 844,603 825,576 800,185 787,464 7,019,021
Operating income ............................................................. 36,524 25,145 28,536 23,656 22,623 23,764 211,819
Ordinary income ............................................................... 6,057 23,081 28,188 23,204 17,123 26,994 240,610
Profi t (loss) attributable to owners of parent ...................... (41,675) 10,652 22,770 23,183 2,424 8,399 74,864
Capital investment ............................................................ 57,172 53,323 47,162 48,518 46,899 51,289 457,162
Depreciation ..................................................................... 74,352 64,903 63,181 61,374 57,672 55,083 490,980
Free cash fl ow .................................................................. 13,488 4,212 50,902 39,363 68,689 21,809 194,393
End of fi scal year
Total assets ...................................................................... ¥1,527,635 ¥1,497,729 ¥1,480,894 ¥1,495,622 ¥1,390,918 ¥1,388,885 $12,379,758
Total current assets........................................................... 546,344 507,335 505,417 484,498 502,912 486,205 4,333,764
Total property, plant and equipment .................................. 752,501 747,423 729,179 715,406 669,298 686,813 6,121,874
Other noncurrent assets ................................................... 228,789 242,970 246,297 295,716 218,707 215,867 1,924,120
Total liabilities .................................................................... 1,160,983 1,101,269 1,054,309 1,005,881 966,233 953,974 8,503,200
Total net assets................................................................. 366,652 396,460 426,584 489,740 424,685 434,911 3,876,558
Interest-bearing debt ........................................................ 838,285 830,220 775,597 731,834 703,831 678,504 6,047,812
Per share data Yen U.S. dollars
Profi t (loss) attributable to owners of parent ...................... ¥ (359.90) ¥ 92.00 ¥ 196.67 ¥ 200.27 ¥ 20.95 ¥ 72.57 $ 0.65
Net assets ........................................................................ 3,135.48 3,391.59 3,652.76 4,198.10 3,645.87 3,714.63 33.11
Cash dividends ................................................................. 30.00 40.00 40.00 50.00 60.00 60.00 0.53
Ratios %
Operating income margin ................................................. 3.5% 2.5% 2.6% 2.2% 2.2% 2.4%
Net profi t margin ............................................................... (4.0) 1.0 2.1 2.2 0.2 0.8
Equity ratio ....................................................................... 23.8 26.2 28.6 32.5 30.3 31.0
Return on equity (ROE) ..................................................... (10.9) 2.8 5.6 5.1 0.5 2.0
Return on invested capital (ROIC) ..................................... 1.5 2.9 3.3 2.8 2.4 3.2
Return on assets (ROA) .................................................... 1.2 2.3 2.7 2.2 2.0 2.6
Debt/equity ratio (times) .................................................... 1.9 1.9 1.7 1.6 1.5 1.5
Number of employees ...................................................... 13,407 13,052 13,107 12,771 11,741 13,057
Consolidated Six-Year Summary
Nippon Paper Industries Co., Ltd., and Consolidated Subsidiaries (Note 1)(Fiscal Years Ended March 31, 2012 to March 31, 2017)
Notes:1. Nippon Paper Group, Inc. and Nippon Paper Industries Co., Ltd. (hereinafter the “Company”), conducted an
absorption-type merger and the Company was listed on the Tokyo Stock Exchange on April 1, 2013. Therefore, the business results of the Nippon Paper Group up to the fi scal year ended March 31, 2013
appearing in this report represent those of Nippon Paper Group, Inc.2. Amounts in US dollars are included solely for convenience and are translated at a rate of ¥112 = US$1.00,
the approximate rate of exchange on March 31, 2017.
• Interest-bearing debt = Short-term borrowings + Long-term debt• Free cash fl ow = Cash fl ows from operating activities + Cash fl ows from investing activities• Return on equity (ROE) = Profi t (loss) attributable to owners of parent / [Average of beginning and end of year
(Shareholders’ equity + Accumulated other comprehensive income)] × 100• Return on invested capital (ROIC) = (Ordinary income + Interest expense) / (Year-end shareholders’ equity +
Year-end accumulated other comprehensive income + Year-end balance of interest-bearing debt) × 100• Return on assets (ROA) = (Ordinary income + Interest expense) / Total assets × 100• Debt/equity ratio = (Interest-bearing debt – Cash and deposits) / Shareholders’ equity
54 55Nippon Paper Industries Co., Ltd. Annual Report 2017 Nippon Paper Industries Co., Ltd. Annual Report 2017
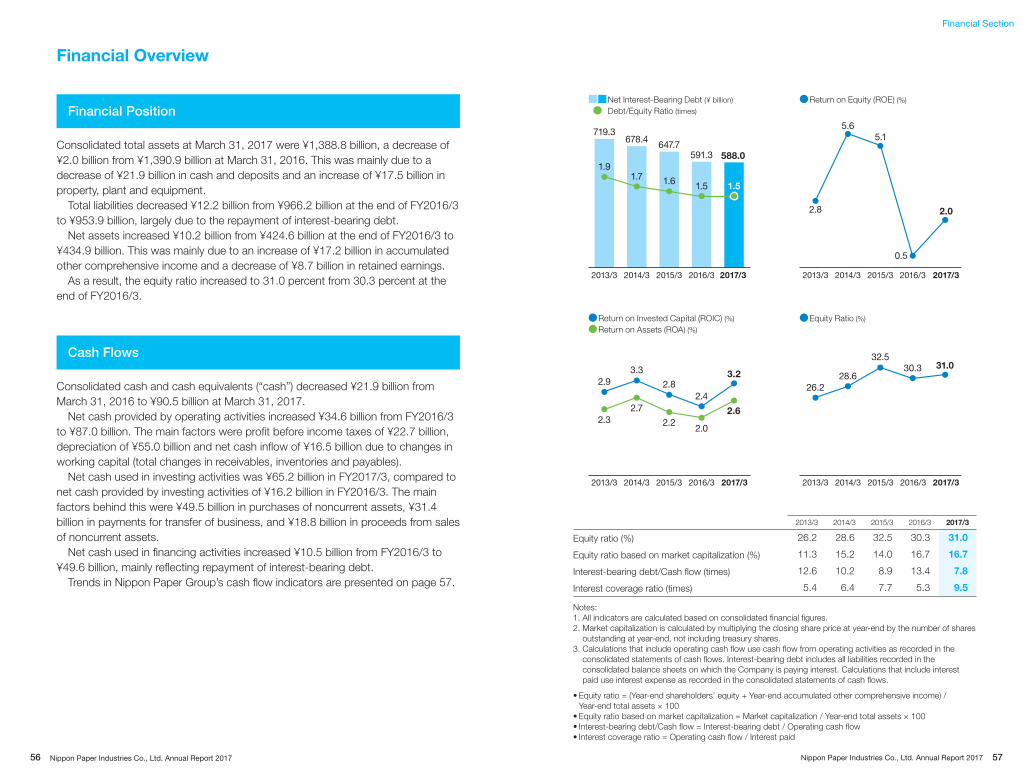
Financial Section
Consolidated total assets at March 31, 2017 were ¥1,388.8 billion, a decrease of ¥2.0 billion from ¥1,390.9 billion at March 31, 2016. This was mainly due to a decrease of ¥21.9 billion in cash and deposits and an increase of ¥17.5 billion in property, plant and equipment.
Total liabilities decreased ¥12.2 billion from ¥966.2 billion at the end of FY2016/3 to ¥953.9 billion, largely due to the repayment of interest-bearing debt.
Net assets increased ¥10.2 billion from ¥424.6 billion at the end of FY2016/3 to ¥434.9 billion. This was mainly due to an increase of ¥17.2 billion in accumulated other comprehensive income and a decrease of ¥8.7 billion in retained earnings.
As a result, the equity ratio increased to 31.0 percent from 30.3 percent at the end of FY2016/3.
Consolidated cash and cash equivalents (“cash”) decreased ¥21.9 billion from March 31, 2016 to ¥90.5 billion at March 31, 2017.
Net cash provided by operating activities increased ¥34.6 billion from FY2016/3 to ¥87.0 billion. The main factors were profi t before income taxes of ¥22.7 billion, depreciation of ¥55.0 billion and net cash infl ow of ¥16.5 billion due to changes in working capital (total changes in receivables, inventories and payables).
Net cash used in investing activities was ¥65.2 billion in FY2017/3, compared to net cash provided by investing activities of ¥16.2 billion in FY2016/3. The main factors behind this were ¥49.5 billion in purchases of noncurrent assets, ¥31.4 billion in payments for transfer of business, and ¥18.8 billion in proceeds from sales of noncurrent assets.
Net cash used in fi nancing activities increased ¥10.5 billion from FY2016/3 to ¥49.6 billion, mainly refl ecting repayment of interest-bearing debt.
Trends in Nippon Paper Group’s cash fl ow indicators are presented on page 57.
Financial Position
Cash Flows
Financial Overview
Notes:1. All indicators are calculated based on consolidated fi nancial fi gures.2. Market capitalization is calculated by multiplying the closing share price at year-end by the number of shares
outstanding at year-end, not including treasury shares.3. Calculations that include operating cash fl ow use cash fl ow from operating activities as recorded in the
consolidated statements of cash fl ows. Interest-bearing debt includes all liabilities recorded in the consolidated balance sheets on which the Company is paying interest. Calculations that include interest paid use interest expense as recorded in the consolidated statements of cash fl ows.
• Equity ratio = (Year-end shareholders’ equity + Year-end accumulated other comprehensive income) / Year-end total assets × 100
• Equity ratio based on market capitalization = Market capitalization / Year-end total assets × 100• Interest-bearing debt/Cash fl ow = Interest-bearing debt / Operating cash fl ow• Interest coverage ratio = Operating cash fl ow / Interest paid
2013/3 2014/3 2015/3 2016/3 2017/3
Equity ratio (%) 26.2 28.6 32.5 30.3 31.0
Equity ratio based on market capitalization (%) 11.3 15.2 14.0 16.7 16.7
Interest-bearing debt/Cash fl ow (times) 12.6 10.2 8.9 13.4 7.8
Interest coverage ratio (times) 5.4 6.4 7.7 5.3 9.5
0
5
2016/3 2017/32015/32014/32013/3
1.5 1.51.61.7
1.9
2016/3 2017/32015/32014/32013/3
0.5
2.0
5.15.6
2.8
2016/3 2017/32015/32014/32013/3
2.4
3.22.8
3.32.9
2.0
2.6
2.2
2.72.3
2016/3 2017/32015/32014/32013/3
30.3 31.032.5
28.626.2
591.3 588.0647.7678.4
719.3
■■ Net Interest-Bearing Debt (¥ billion)
● Debt/Equity Ratio (times)
● Return on Equity (ROE) (%)
● Return on Invested Capital (ROIC) (%)
● Return on Assets (ROA) (%)
● Equity Ratio (%)
56 57Nippon Paper Industries Co., Ltd. Annual Report 2017 Nippon Paper Industries Co., Ltd. Annual Report 2017

Financial Section
The Group has identifi ed the following factors as risks that could affect Nippon Paper Group’s business performance and fi nancial position:
(1) Product demand and market conditionsNippon Paper Group engages in the mainstay pulp and paper, paper-related, wood products and construction related, and other businesses. The Group is at risk of fl uctuations in demand for its products and product prices in the context of economic conditions and other factors. Such fl uctuations could affect the Group’s business performance and fi nancial position.
(2) Manufacturing conditionsNippon Paper Group’s production activity is based on the estimated demand and production capacity of existing facilities. The Group carries out regular preventive inspections and other maintenance checks, but is at risk of a reduction in supply capability due to fi res, accidents and other problems occurring at facilities, and interruptions in procurement, as well as the delivery of raw materials and fuel. Such fl uctuations could affect the Group’s business performance and fi nancial position.
(3) Foreign exchangeNippon Paper Group is at risk of foreign exchange rate fl uctuations associated with import and export transactions. Because the Group’s imports of raw materials and fuel (wood chips, heavy oil, coal and chemicals) exceed its product exports, yen depreciation against the U.S. dollar has a negative impact on business performance. The Group hedges against this risk by means such as forward contracts.
(4) Raw material and fuel pricesNippon Paper Group purchases raw materials and fuels such as wood chips, waste paper, heavy oil, coal and chemicals to manufacture and sell products such as paper, pulp and others. The Group is thus at risk of input price fl uctuations in domestic and international markets. Such fl uctuations could affect the Group’s business performance and fi nancial position.
(5) Stock pricesNippon Paper Group holds marketable shares in partner and affi liated companies and is thus at risk of share price fl uctuations that could affect the Group’s business performance and fi nancial position. Such fl uctuations could also affect retirement benefi t expenses because of their impact on pension assets.
Business and Other Risk Factors
(6) Interest ratesNippon Paper Group is at risk of interest rate fl uctuations affecting its interest expense regarding interest-bearing debt, etc. Such fl uctuations could affect the Group’s business performance and fi nancial position.
(7) Overseas businessNippon Paper Group manufactures pulp and paper and operates forestry plantations and other businesses overseas in North America, South America, Scandinavia, China, Southeast Asia and Australia, etc. Although the Group takes the utmost care to minimize overseas business risk, unforeseen circumstances in those locations could affect the Group’s business performance and fi nancial position.
(8) LitigationNippon Paper Group takes the utmost care to comply with laws and regulations in the course of doing business, but is nonetheless at risk of litigation associated with criminal or civil affairs, taxation, antitrust law, product liability law, intellectual property rights and environmental and labor issues. As a result, such litigation could affect the Group’s business performance and fi nancial position.
(9) Impairment of fi xed assetsNippon Paper Group owns fi xed assets such as production facilities and land and is at risk of a fall in the value of these assets, which could affect the Group’s business performance and fi nancial position.
(10) Natural disastersIn the wake of major natural disasters, including earthquakes, occurring near production and sales sites, Nippon Paper Group’s performance and fi nancial position could be negatively affected by unanticipated costs associated with repairing damage to production equipment or facilities and distribution infrastructure, as well as opportunity losses from production shutdowns and damage to products, merchandise and raw materials.
(11) Credit riskNippon Paper Group takes care to limit its credit risk, but tardy or uncollectible receivables due to deterioration in the fi nancial condition or bankruptcy of customers could affect the Group’s business performance and fi nancial position.
(12) Other risks associated with changes in business conditions, etc.Nippon Paper Group is subject to the risk of changes in business and economic conditions and other similar circumstances arising from contingencies, which could affect the Group’s business performance and fi nancial position.
58 59Nippon Paper Industries Co., Ltd. Annual Report 2017 Nippon Paper Industries Co., Ltd. Annual Report 2017

Financial Section
Millions of yen Thousands of
U.S. dollars
2016/3 2017/3 2017/3
Assets
Current assets
Cash and deposits ................................... ¥ 112,510 ¥ 90,514 $ 808,161
Notes and accounts receivable−trade ...... 192,941 200,440 1,789,643
Merchandise and fi nished goods ............. 79,529 83,357 744,259
Work in process ....................................... 18,299 17,890 159,732
Raw materials and supplies ..................... 60,244 57,432 512,786
Deferred tax assets .................................. 9,324 6,743 60,205
Other ....................................................... 30,609 30,426 271,661
Allowance for doubtful receivables ........... (547) (600) (5,357)
Total current assets ............................... 502,912 486,205 4,341,116
Noncurrent assets
Property, plant and equipment
Buildings and structures ........................ 485,784 489,397 4,369,616
Accumulated depreciation .................. (353,073) (358,767) (3,203,277)
Buildings and structures, net .............. 132,711 130,630 1,166,339
Machinery, equipment and vehicles ....... 2,161,323 2,191,073 19,563,152
Accumulated depreciation .................. (1,879,807) (1,909,252) (17,046,893)
Machinery, equipment and vehicles, net .................................... 281,515 281,820 2,516,250
Land ..................................................... 215,084 219,360 1,958,571
Mountain forests and plantations .......... 20,046 29,030 259,196
Construction in progress ....................... 14,101 20,461 182,688
Other .................................................... 45,051 45,613 407,259
Accumulated depreciation .................. (39,213) (40,103) (358,063)
Other, net ........................................... 5,838 5,509 49,188
Total property, plant and equipment .. 669,298 686,813 6,132,259
Intangible assets .................................... 15,291 15,543 138,777
Investments and other assets ...............
Investments in securities ....................... 180,782 183,591 1,639,205
Net defi ned benefi t assets ..................... 1,750 1,618 14,446
Deferred tax assets ............................... 10,730 2,217 19,795
Other .................................................... 10,743 13,449 120,080
Allowance for doubtful receivables ........ (590) (553) (4,938)
Total investments and other assets ... 203,416 200,323 1,788,598
Total noncurrent assets ......................... 888,006 902,680 8,059,643
Total assets............................................... ¥ 1,390,918 ¥ 1,388,885 $ 12,400,759
Millions of yen Thousands of
U.S. dollars
2016/3 2017/3 2017/3
Liabilities
Current liabilities
Notes and account payable−trade ........... ¥ 113,354 ¥ 128,926 $ 1,151,125
Short-term loans payable ......................... 243,366 262,391 2,342,777
Current portion of bonds .......................... 13,000 10,000 89,286
Accrued income taxes ............................. 4,147 5,369 47,938
Other ....................................................... 76,043 87,806 783,982
Total current liabilities ........................... 449,912 494,493 4,415,116
Long-term liabilities
Bonds payable ......................................... 60,000 50,000 446,429
Long-term loans payable ......................... 385,725 354,353 3,163,866
Deferred tax liability .................................. 18,877 21,889 195,438
Accrued environmental costs ................... 470 381 3,402
Net defined benefit liability ........................ 42,210 24,371 217,598
Other ....................................................... 9,036 8,484 75,750
Total long-term liabilities ....................... 516,320 459,480 4,102,500
Total liabilities ........................................... 966,233 953,974 8,517,625
Net assets
Shareholders’ equity
Common stock ........................................ 104,873 104,873 936,366
Capital surplus ......................................... 217,104 216,531 1,933,313
Retained earnings .................................... 82,215 73,479 656,063
Treasury stock, at cost ............................ (1,378) (1,398) (12,482)
Total shareholders’ equity ..................... 402,814 393,486 3,513,268
Accumulated other comprehensive income
Net unrealized holding gain on other securities ..................................... 18,974 22,249 198,652
Net deferred gain on hedges .................... (1,193) 626 5,589
Translation adjustment ............................. 15,088 20,260 180,893
Remeasurements of defi ned benefi t plans ............................. (13,683) (6,702) (59,839)
Total accumulated other comprehensive income ...................... 19,185 36,434 325,304
Non-controlling interests .......................... 2,685 4,990 44,554
Total net assets ........................................ 424,685 434,911 3,883,134
Total liabilities and net assets ..................... ¥1,390,918 ¥1,388,885 $12,400,759
Consolidated Financial Statements
Consolidated Balance Sheets As of March 31, 2016 and 2017
60 61Nippon Paper Industries Co., Ltd. Annual Report 2017 Nippon Paper Industries Co., Ltd. Annual Report 2017
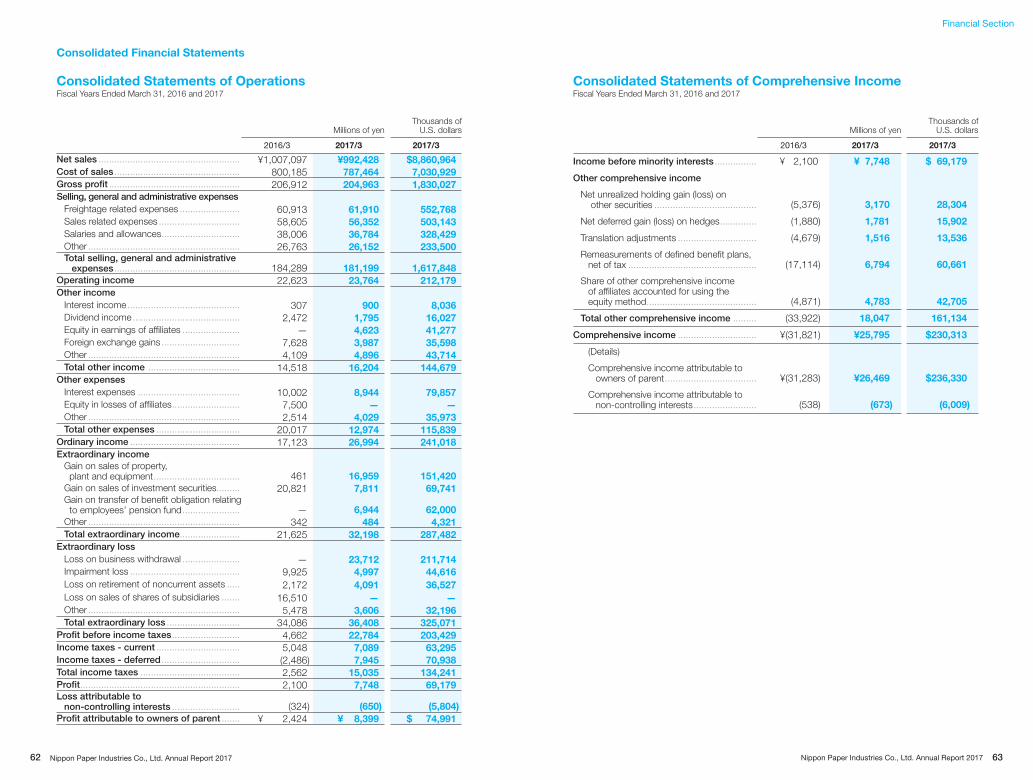
Financial Section
Millions of yen Thousands of
U.S. dollars
2016/3 2017/3 2017/3
Net sales ...................................................... ¥1,007,097 ¥992,428 $8,860,964
Cost of sales ................................................ 800,185 787,464 7,030,929
Gross profi t .................................................. 206,912 204,963 1,830,027
Selling, general and administrative expenses Freightage related expenses ....................... 60,913 61,910 552,768
Sales related expenses ............................... 58,605 56,352 503,143
Salaries and allowances .............................. 38,006 36,784 328,429
Other .......................................................... 26,763 26,152 233,500Total selling, general and administrative
expenses ................................................ 184,289 181,199 1,617,848
Operating income 22,623 23,764 212,179
Other income Interest income ........................................... 307 900 8,036
Dividend income ......................................... 2,472 1,795 16,027
Equity in earnings of affi liates ...................... — 4,623 41,277
Foreign exchange gains .............................. 7,628 3,987 35,598
Other .......................................................... 4,109 4,896 43,714
Total other income ................................... 14,518 16,204 144,679
Other expenses Interest expenses ....................................... 10,002 8,944 79,857
Equity in losses of affiliates .......................... 7,500 — —
Other .......................................................... 2,514 4,029 35,973
Total other expenses ................................ 20,017 12,974 115,839
Ordinary income .......................................... 17,123 26,994 241,018
Extraordinary income Gain on sales of property,
plant and equipment ................................. 461 16,959 151,420
Gain on sales of investment securities......... 20,821 7,811 69,741 Gain on transfer of benefi t obligation relating
to employees’ pension fund ...................... — 6,944 62,000
Other .......................................................... 342 484 4,321
Total extraordinary income ....................... 21,625 32,198 287,482
Extraordinary loss Loss on business withdrawal ...................... — 23,712 211,714
Impairment loss .......................................... 9,925 4,997 44,616
Loss on retirement of noncurrent assets ..... 2,172 4,091 36,527
Loss on sales of shares of subsidiaries ....... 16,510 — —
Other .......................................................... 5,478 3,606 32,196
Total extraordinary loss ............................ 34,086 36,408 325,071
Profi t before income taxes .......................... 4,662 22,784 203,429
Income taxes - current ................................ 5,048 7,089 63,295
Income taxes - deferred .............................. (2,486) 7,945 70,938
Total income taxes ...................................... 2,562 15,035 134,241
Profi t ............................................................. 2,100 7,748 69,179Loss attributable to
non-controlling interests .......................... (324) (650) (5,804)
Profit attributable to owners of parent ....... ¥ 2,424 ¥ 8,399 $ 74,991
Millions of yen Thousands of
U.S. dollars
2016/3 2017/3 2017/3
Income before minority interests ................ ¥ 2,100 ¥ 7,748 $ 69,179
Other comprehensive income
Net unrealized holding gain (loss) on other securities ....................................... (5,376) 3,170 28,304
Net deferred gain (loss) on hedges .............. (1,880) 1,781 15,902
Translation adjustments .............................. (4,679) 1,516 13,536
Remeasurements of defi ned benefi t plans, net of tax ................................................. (17,114) 6,794 60,661
Share of other comprehensive income of affi liates accounted for using the equity method .......................................... (4,871) 4,783 42,705
Total other comprehensive income ......... (33,922) 18,047 161,134
Comprehensive income .............................. ¥(31,821) ¥25,795 $230,313
(Details)
Comprehensive income attributable to owners of parent ................................... ¥(31,283) ¥26,469 $236,330
Comprehensive income attributable to non-controlling interests ........................ (538) (673) (6,009)
Consolidated Financial Statements
Consolidated Statements of Operations Fiscal Years Ended March 31, 2016 and 2017
Consolidated Statements of Comprehensive IncomeFiscal Years Ended March 31, 2016 and 2017
62 63Nippon Paper Industries Co., Ltd. Annual Report 2017 Nippon Paper Industries Co., Ltd. Annual Report 2017
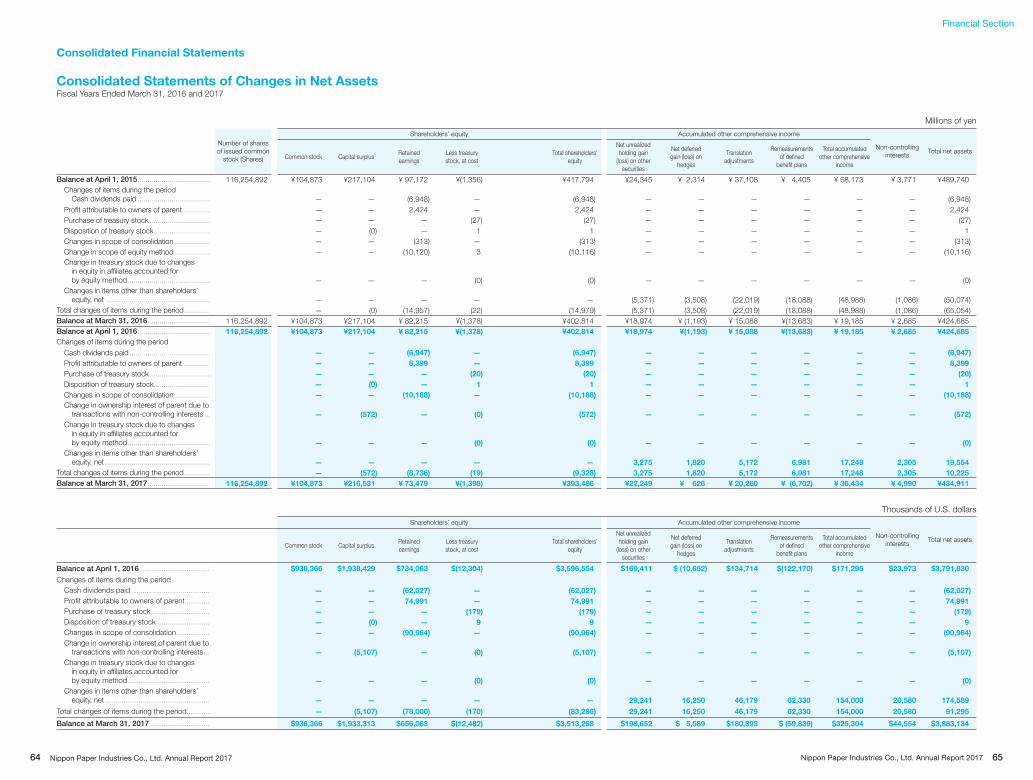
Financial Section
Millions of yen
Number of shares of issued common
stock (Shares)
Shareholders’ equity Accumulated other comprehensive income
Non-controlling interests
Total net assetsCommon stock Capital surplus
Retained earnings
Less treasury stock, at cost
Total shareholders’ equity
Net unrealized holding gain
(loss) on other securities
Net deferred gain (loss) on
hedges
Translation adjustments
Remeasurements of defined
benefit plans
Total accumulated other comprehensive
income
Balance at April 1, 2015 .................................... 116,254,892 ¥104,873 ¥217,104 ¥ 97,172 ¥(1,356) ¥417,794 ¥24,345 ¥ 2,314 ¥ 37,108 ¥ 4,405 ¥ 68,173 ¥ 3,771 ¥489,740Changes of items during the period
Cash dividends paid .................................... — — (6,948) — (6,948) — — — — — — (6,948) Profi t attributable to owners of parent .............. — — 2,424 — 2,424 — — — — — — 2,424 Purchase of treasury stock .............................. — — — (27) (27) — — — — — — (27) Disposition of treasury stock ............................ — (0) — 1 1 — — — — — — 1 Changes in scope of consolidation .................. — — (313) — (313) — — — — — — (313) Change in scope of equity method ................. — — (10,120) 3 (10,116) — — — — — — (10,116)
Change in treasury stock due to changes in equity in affi liates accounted for by equity method ......................................... — — — (0) (0) — — — — — — (0)
Changes in items other than shareholders’ equity, net ................................................... — — — — — (5,371) (3,508) (22,019) (18,088) (48,988) (1,086) (50,074)
Total changes of items during the period ............. — (0) (14,957) (22) (14,979) (5,371) (3,508) (22,019) (18,088) (48,988) (1,086) (65,054)Balance at March 31, 2016 ............................... 116,254,892 ¥104,873 ¥217,104 ¥ 82,215 ¥(1,378) ¥402,814 ¥18,974 ¥ (1,193) ¥ 15,088 ¥(13,683) ¥ 19,185 ¥ 2,685 ¥424,685Balance at April 1, 2016 .................................... 116,254,892 ¥104,873 ¥217,104 ¥ 82,215 ¥(1,378) ¥402,814 ¥18,974 ¥(1,193) ¥ 15,088 ¥(13,683) ¥ 19,185 ¥ 2,685 ¥424,685
Changes of items during the period Cash dividends paid ........................................ — — (6,947) — (6,947) — — — — — — (6,947)
Profit attributable to owners of parent.............. — — 8,399 — 8,399 — — — — — — 8,399
Purchase of treasury stock .............................. — — — (20) (20) — — — — — — (20)
Disposition of treasury stock............................ — (0) — 1 1 — — — — — — 1
Changes in scope of consolidation .................. — — (10,188) — (10,188) — — — — — — (10,188)
Change in ownership interest of parent due totransactions with non-controlling interests ... — (572) — (0) (572) — — — — — — (572)
Change in treasury stock due to changes in equity in affi liates accounted for by equity method ......................................... — — — (0) (0) — — — — — — (0)
Changes in items other than shareholders’ equity, net .................................................... — — — — — 3,275 1,820 5,172 6,981 17,248 2,305 19,554
Total changes of items during the period ............. — (572) (8,736) (19) (9,328) 3,275 1,820 5,172 6,981 17,248 2,305 10,225
Balance at March 31, 2017 ............................... 116,254,892 ¥104,873 ¥216,531 ¥ 73,479 ¥(1,398) ¥393,486 ¥22,249 ¥ 626 ¥ 20,260 ¥ (6,702) ¥ 36,434 ¥ 4,990 ¥434,911
Thousands of U.S. dollars
Shareholders’ equity Accumulated other comprehensive income
Non-controlling interests
Total net assetsCommon stock Capital surplus
Retained earnings
Less treasury stock, at cost
Total shareholders’ equity
Net unrealized holding gain
(loss) on other securities
Net deferred gain (loss) on
hedges
Translation adjustments
Remeasurements of defined
benefit plans
Total accumulated other comprehensive
income
Balance at April 1, 2016 ................................. $936,366 $1,938,429 $734,063 $(12,304) $3,596,554 $169,411 $ (10,652) $134,714 $(122,170) $171,295 $23,973 $3,791,830
Changes of items during the periodCash dividends paid...................................... — — (62,027) — (62,027) — — — — — — (62,027)
Profi t attributable to owners of parent ........... — — 74,991 — 74,991 — — — — — — 74,991
Purchase of treasury stock ............................ — — — (179) (179) — — — — — — (179)
Disposition of treasury stock ......................... — (0) — 9 9 — — — — — — 9
Changes in scope of consolidation ................ — — (90,964) — (90,964) — — — — — — (90,964)
Change in ownership interest of parent due to transactions with non-controlling interests ... — (5,107) — (0) (5,107) — — — — — — (5,107)
Change in treasury stock due to changes in equity in affi liates accounted for by equity method ....................................... — — — (0) (0) — — — — — — (0)
Changes in items other than shareholders’ equity, net .................................................. — — — — — 29,241 16,250 46,179 62,330 154,000 20,580 174,589
Total changes of items during the period........... — (5,107) (78,000) (170) (83,286) 29,241 16,250 46,179 62,330 154,000 20,580 91,295
Balance at March 31, 2017 ............................ $936,366 $1,933,313 $656,063 $(12,482) $3,513,268 $198,652 $ 5,589 $180,893 $ (59,839) $325,304 $44,554 $3,883,134
Consolidated Financial Statements
Consolidated Statements of Changes in Net AssetsFiscal Years Ended March 31, 2016 and 2017
64 65Nippon Paper Industries Co., Ltd. Annual Report 2017 Nippon Paper Industries Co., Ltd. Annual Report 2017

Financial Section
Millions of yen Thousands of
U.S. dollars
2016/3 2017/3 2017/3
Investing activities
Purchases of time deposits ......................... ¥ (3) ¥ — $ —
Withdrawals of time deposits ...................... 3 — —
Purchases of noncurrent assets .................. (44,511) (49,589) (442,759)
Proceeds from sales of noncurrent assets ..... 1,177 18,882 168,589
Purchases of investments in other securities .... (6,933) (18,210) (162,589)
Proceeds from sales of investments in other securities ........................................ 53,296 15,391 137,420
Proceeds from redemption of investments in securities .............................................. 3,000 — —
Proceeds from sales of shares of subsidiaries resulting in change in scope of consolidation ....................................... 10,111 — —
Payments for transfer of business ............... — (31,432) (280,643)
Decrease (increase) in short-term loans receivable ....................................... (250) 203 1,813
Payments of long-term loans receivable ...... (58) (70) (625)
Collection of long-term loans receivable ...... 309 103 920
Other .......................................................... 129 (555) (4,955)
Net cash provided by (used in) investing activities ................................. 16,270 (65,278) (582,839)
Financing activities
Increase (decrease) in short-term loans payable .................................................... (8,835) 10,746 95,946
Proceeds from long-term loans payable ...... 39,095 25,350 226,339
Repayment of long-term loans payable ....... (69,846) (64,920) (579,643)
Proceeds from issuance of bonds ............... 10,000 — —
Redemption of bonds ................................. — (13,000) (116,071)
Proceeds from sales of treasury stock ........ 1 0 0
Purchases of treasury stock ........................ (27) (20) (179)
Cash dividends paid ................................... (6,953) (6,941) (61,973)
Repayment to non-controlling interests ....... (1,607) (7) (63)
Finance lease principal payments................ (994) (901) (8,045)
Net cash provided by (used in) fi nancing activities ................................. (39,168) (49,694) (443,696)
Effect of exchange rate changes on cash and cash equivalents ............................... (1,046) 435 3,884
Increase (decrease) in cash and cash equivalents ....................................... 28,475 (27,450) (245,089)
Cash and cash equivalents at beginning of year ...................................... 84,002 112,510 1,004,554
Increase due to inclusion of certain subsidiaries in consolidation ................... 32 5,454 48,696
Cash and cash equivalents at end of year .... ¥112,510 ¥ 90,514 $ 808,161
Millions of yen Thousands of
U.S. dollars
2016/3 2017/3 2017/3
Operating activities
Profi t before income taxes ............................. ¥ 4,662 ¥ 22,784 $ 203,429
Depreciation ............................................... 57,672 55,083 491,813
Amortization of goodwill .............................. 2,071 2,029 18,116
Increase (decrease) in allowance for doubtful receivables .................................. (53) 34 304
Increase (decrease) in net defined benefit liability ........................................... (911) (7,356) (65,679)
Increase (decrease) in accrued environmental costs .................................. (68) (89) (795)
Interest and dividend income ...................... (2,780) (2,695) (24,063)
Interest expense ......................................... 10,002 8,944 79,857
Equity in (earnings) losses of affiliates ............. 7,500 (4,623) (41,277)
Foreign exchange losses (gains) .................... (7,155) (3,972) (35,464)
Loss (gain) on sales of property, plant and equipment ................................. (461) (16,959) (151,420)
Loss (gain) on sales of investment securities .... (20,821) (7,811) (69,741)
Loss on business withdrawal ........................ — 23,712 211,714
Impairment loss ............................................ 9,925 4,997 44,616
Net loss on disposal of noncurrent assets ... 2,172 4,091 36,527
Loss (gain) on sales of shares of subsidiaries .. 16,510 — —
Decrease (increase) in receivables ................. (2,439) (3,319) (29,634)
Decrease (increase) in inventories .................. (1,188) 5,884 52,536
Increase (decrease) in payables .................... (11,600) 13,990 124,911
Other .......................................................... 153 1,576 14,071
Subtotal ..................................................... 63,189 96,301 859,830
Interest and dividends received ................... 5,799 4,117 36,759
Interest paid ................................................ (9,981) (9,214) (82,268)
Payments for supplementary retirement benefi ts .................................................... (1,374) (178) (1,589)
Income taxes paid ...................................... (5,213) (3,938) (35,161)
Net cash provided by (used in) operating activities ................................... ¥ 52,419 ¥ 87,087 $ 777,563
Consolidated Financial Statements
Consolidated Statements of Cash FlowsFiscal Years Ended March 31, 2016 and 2017
66 67Nippon Paper Industries Co., Ltd. Annual Report 2017 Nippon Paper Industries Co., Ltd. Annual Report 2017
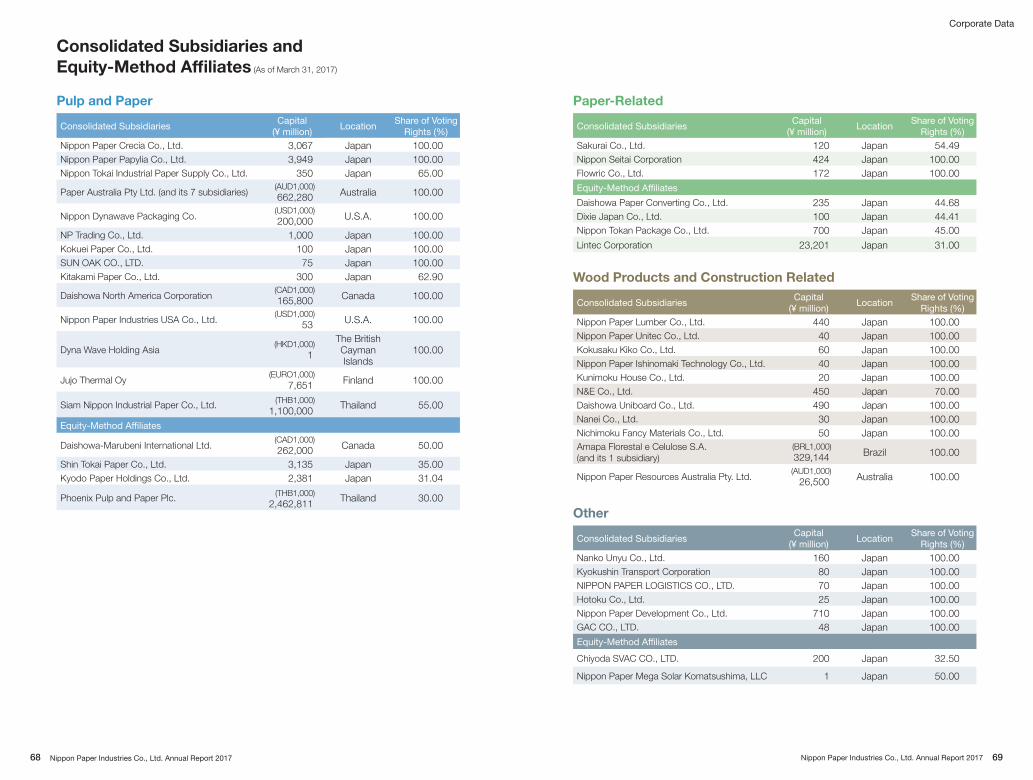
Corporate Data
Pulp and Paper
Consolidated SubsidiariesCapital
(¥ million)Location
Share of Voting Rights (%)
Nippon Paper Crecia Co., Ltd. 3,067 Japan 100.00Nippon Paper Papylia Co., Ltd. 3,949 Japan 100.00Nippon Tokai Industrial Paper Supply Co., Ltd. 350 Japan 65.00
Paper Australia Pty Ltd. (and its 7 subsidiaries)(AUD1,000)662,280 Australia 100.00
Nippon Dynawave Packaging Co.(USD1,000)200,000 U.S.A. 100.00
NP Trading Co., Ltd. 1,000 Japan 100.00Kokuei Paper Co., Ltd. 100 Japan 100.00SUN OAK CO., LTD. 75 Japan 100.00Kitakami Paper Co., Ltd. 300 Japan 62.90
Daishowa North America Corporation(CAD1,000)165,800 Canada 100.00
Nippon Paper Industries USA Co., Ltd.(USD1,000)
53 U.S.A. 100.00
Dyna Wave Holding Asia(HKD1,000)
1
The BritishCayman Islands
100.00
Jujo Thermal Oy(EURO1,000)
7,651 Finland 100.00
Siam Nippon Industrial Paper Co., Ltd. (THB1,000)1,100,000
Thailand 55.00
Equity-Method Affi liates
Daishowa-Marubeni International Ltd.(CAD1,000)262,000 Canada 50.00
Shin Tokai Paper Co., Ltd. 3,135 Japan 35.00Kyodo Paper Holdings Co., Ltd. 2,381 Japan 31.04
Phoenix Pulp and Paper Plc. (THB1,000)2,462,811
Thailand 30.00
Consolidated Subsidiaries and
Equity-Method Affi liates (As of March 31, 2017)
Other
Consolidated SubsidiariesCapital
(¥ million)Location
Share of Voting Rights (%)
Nanko Unyu Co., Ltd. 160 Japan 100.00Kyokushin Transport Corporation 80 Japan 100.00NIPPON PAPER LOGISTICS CO., LTD. 70 Japan 100.00Hotoku Co., Ltd. 25 Japan 100.00Nippon Paper Development Co., Ltd. 710 Japan 100.00GAC CO., LTD. 48 Japan 100.00Equity-Method Affi liates
Chiyoda SVAC CO., LTD. 200 Japan 32.50
Nippon Paper Mega Solar Komatsushima, LLC 1 Japan 50.00
Wood Products and Construction Related
Consolidated SubsidiariesCapital
(¥ million)Location
Share of Voting Rights (%)
Nippon Paper Lumber Co., Ltd. 440 Japan 100.00Nippon Paper Unitec Co., Ltd. 40 Japan 100.00Kokusaku Kiko Co., Ltd. 60 Japan 100.00Nippon Paper Ishinomaki Technology Co., Ltd. 40 Japan 100.00Kunimoku House Co., Ltd. 20 Japan 100.00N&E Co., Ltd. 450 Japan 70.00Daishowa Uniboard Co., Ltd. 490 Japan 100.00Nanei Co., Ltd. 30 Japan 100.00Nichimoku Fancy Materials Co., Ltd. 50 Japan 100.00Amapa Florestal e Celulose S.A. (and its 1 subsidiary)
(BRL1,000)329,144 Brazil 100.00
Nippon Paper Resources Australia Pty. Ltd.(AUD1,000)
26,500 Australia 100.00
Paper-Related
Consolidated SubsidiariesCapital
(¥ million)Location
Share of Voting Rights (%)
Sakurai Co., Ltd. 120 Japan 54.49Nippon Seitai Corporation 424 Japan 100.00Flowric Co., Ltd. 172 Japan 100.00Equity-Method Affi liates
Daishowa Paper Converting Co., Ltd. 235 Japan 44.68Dixie Japan Co., Ltd. 100 Japan 44.41Nippon Tokan Package Co., Ltd. 700 Japan 45.00Lintec Corporation 23,201 Japan 31.00
68 69Nippon Paper Industries Co., Ltd. Annual Report 2017 Nippon Paper Industries Co., Ltd. Annual Report 2017

❷
❷
Ⓐ
❷Ⓒ Ⓑ
❶
❸
❹❺
❻
❽
1110
12
13
14
16
1517
18
19
20
21
22
23
24
❾
❼
❼
Ⓐ
ⒷNippon Paper
Industries Co., Ltd.
Corporate Data
Domestic Network
Major Subsidiaries and Manufacturing Bases
(As of July 1, 2017)Pulp and Paper
Nippon Paper Industries Co., Ltd.4-6, Kanda-Surugadai, Chiyoda-ku, Tokyo101-0062, JapanTel: +81-3-6665-1111Fax: +81-3-6665-0300
❶ Kushiro Mill (Hokkaido)
❷ Hokkaido Mill (Hokkaido)
Ⓐ Asahikawa Ⓑ Yufutsu Ⓒ Shiraoi
❸ Akita Mill (Akita)
❹ Ishinomaki Mill (Miyagi)
❺ Iwanuma Mill (Miyagi)
❻ Nakoso Mill (Fukushima)
❼ Kanto Mill
(Tochigi/Saitama)
Ⓐ Ashikaga Ⓑ Soka
❽ Fuji Mill (Shizuoka)
❾ Gotsu Mill (Shimane)
10 Otake Mill (Hiroshima)
11 Iwakuni Mill (Yamaguchi)
12 Yatsushiro Mill
(Kumamoto)
Nippon Paper Crecia Co., Ltd.4-6, Kanda-Surugadai, Chiyoda-ku, Tokyo101-0062, JapanTel: +81-3-6665-5300 Fax: +81-3-6665-0370
13 Tokyo Mill (Saitama)
14 Kaisei Mill (Kanagawa)
15 Koyo Mill (Shizuoka)
16 Kyoto Mill (Kyoto)
Nippon Paper Papylia Co., Ltd.4-6, Kanda-Surugadai, Chiyoda-ku, Tokyo101-0062, JapanTel: +81-3-6665-5800 Fax: +81-3-3251-1878
17 Harada Mill (Shizuoka)
18 Suita Mill (Osaka)
19 Kochi Mill (Kochi)
NP Trading Co., Ltd.4-6, Kanda-Surugadai, Chiyoda-ku, Tokyo101-0062, JapanTel: +81-3-6665-7032
Paper-Related
Nippon Paper Industries Co., Ltd. Paper-Pak Sales Division
20 Ishioka Kako Co., Ltd. (Ibaraki)
21 Egawa Paper-Pak Co., Ltd. (Ibaraki)
22 Soka Paper-Pak Co., Ltd. (Saitama)
23 Miki Paper-Pak Co., Ltd. (Hyogo)
Nippon Paper Industries Co., Ltd. Chemical Sales Division
24 Higashimatsuyama Mill (Saitama)
Wood Products and Construction Related
Nippon Paper Lumber Co., Ltd.4-6, Kanda-Surugadai, Chiyoda-ku, Tokyo101-0062, JapanTel: +81-3-6665-7500 Fax: +81-3-6665-0390
Other
Nippon Paper Development Co., Ltd.1-1-9, Horifune, Kita-ku, Tokyo114-8555, JapanTel: +81-3-3914-6161 Fax: +81-3-3914-3706
70 71Nippon Paper Industries Co., Ltd. Annual Report 2017 Nippon Paper Industries Co., Ltd. Annual Report 2017

❶
❷ ❸
❹
❺
❻
❼❽
❾10
Corporate Data
Overseas Network
Nippon Paper Industries Co., Ltd. NP Trading Co., Ltd.
Pulp and Paper
❶ Longview Offi ceLongview, WA, U.S.A.
❷ Bangkok Representative Offi ceBangkok, Thailand
❸ Vietnam Representative Offi ceHo Chi Minh City, Vietnam
❹ China Offi ceShanghai, China
❺ Concepción Offi ceConcepción, Chile
❻ Europe Offi ceNeuss, Germany
❼ Jakarta Offi ceJakarta, Indonesia
❽ Malaysia Offi ceSelangor, Malaysia
❾ Hochiminh Offi ceHo Chi Minh City, Vietnam
10 Taiwan Offi ceTainan, Taiwan
Overseas Branches and Offi ces
(As of July 1, 2017)
72 73Nippon Paper Industries Co., Ltd. Annual Report 2017 Nippon Paper Industries Co., Ltd. Annual Report 2017

Corporate Data
ASIA NORTH AND SOUTH AMERICA
OCEANIA
EUROPE
AFRICA
❶ Everwealth Paper Industries (Shanghai) Co., Ltd.Shanghai, China
Nippon Paper Industries Trading (Shanghai) Co., Ltd.
❷ Shanghai Offi ceShanghai, China
❸ Beijing Offi ceBeijing, China
❹ Paper Products Marketing(Singapore) Pte. Ltd.Singapore
❺ Paper Products Marketing (Malaysia Branch) Pte. Ltd.Selangor, Malaysia
❻ Paper Products Marketing (Hong Kong) Ltd.Hong Kong
❼ Paper Products Marketing(Taiwan) Ltd.Taipei, Taiwan
❽ NP Trading Co., (H.K.) Ltd.Hong Kong
❶ Nippon Paper Resources Australia Pty. Ltd.Mt Waverley, Victoria, Australia
❷ Paper Australia Pty. Ltd.Mt Waverley, Victoria, Australia
❸ Paper Products Marketing Pty. Ltd.Mt Waverley, Victoria, Australia
❶ Jujo Thermal OyKauttua, Finland
❷ Paper Products Marketing Europe GmbHNeuss, Germany
❶ Nippon-SC Tree Farm S.A. (Pty) Ltd.Parklands, Republic of South Africa
Major Overseas Subsidiaries and Affi liates (As of July 1, 2017)
❾ NP Trading (Bangkok) Co., Ltd.Bangkok, Thailand
10 NP INTERNATIONAL (S) PTE. LTD.Singapore
11 Siam Nippon Industrial Paper Co., Ltd.Ban Pong, Thailand
12 Ky Vy Corporation Ho Chi Minh City, Vietnam
13 Nippon Paper Viet Hoa My JSC Ho Chi Minh City, Vietnam
14 Nippon Paper Foodpac Pvt. Ltd.Mumbai, India
❶ Nippon Dynawave Packaging Co.Longview, WA, U.S.A.
❷ Daishowa North America CorporationVancouver, B.C., Canada.
❸ Daishowa-Marubeni International Ltd.Vancouver, B.C., Canada
❹ Paper Products Marketing (USA) Inc.Portland, OR, USA
❺ Volterra S.A.Concepción, Chile
❻ Amapa Florestal e Celulose S.A.Santana, Amapá, Brazil
❶❷
❸
❹❺
❻❼❽
10
❾111213
14 ❶
❷
❺
❻
❶❹
❶❷❸
❶
74 75Nippon Paper Industries Co., Ltd. Annual Report 2017 Nippon Paper Industries Co., Ltd. Annual Report 2017

Corporate Data
Company Profi le (As of March 31, 2017) Stock Information (As of March 31, 2017)
Corporate history
February 1873 Established Shoshi Kaisha
November 1893Shoshi Kaisha changed its trade name to Oji Paper Company
June 1938 Established Kokusaku Pulp Co., Ltd.
September 1938Daishowa Paper Manufacturing Co., Ltd., started operation
November 1946 Established Sanyo Pulp Co., Ltd.
August 1949Established Jujo Paper Co., Ltd., due to dissolution of Oji Paper
March 1972Sanyo Pulp merged with Kokusaku Pulp to become Sanyo-Kokusaku Pulp Co., Ltd.
April 1993Jujo Paper merged with Sanyo-Kokusaku Pulp to become Nippon Paper Industries Co., Ltd.
March 2001Nippon Paper Industries and Daishowa Paper Manufacturing integrated management and established Nippon Unipac Holding
October 2004Nippon Unipac Holding changed its trade name to Nippon Paper Group, Inc.
April 2013Nippon Paper Group, Inc. merged with Nippon Paper Industries and started operation as Nippon Paper Industries
Major shareholders
Name Shares heldShareholding
ratio (%)*
Ichigo Trust Pte. Ltd. 10,978,600 9.47
Japan Trustee Services Bank, Ltd. (Trust Account)
8,628,100 7.44
The Master Trust Bank of Japan, Ltd. (Trust Account)
5,575,800 4.81
Mizuho Bank, Ltd 4,341,855 3.75
CHASE MANHATTAN BANK GTS. CLIENTS ACCOUNT ESCROW
3,635,293 3.14
Nippon Life Insurance Company 3,091,365 2.67
Nippon Paper Industries Co., Ltd. Employee Share Ownership
3,084,229 2.66
Rengo Co., Ltd. 2,821,241 2.43
Japan Trustee Services Bank, Ltd. (Trust Account 9)
2,358,800 2.03
Mitsui Life Insurance Company Limited 2,258,900 1.95
*The shareholding ratio was calculated after deducting 328,807 shares of treasury stock.
Company name Nippon Paper Industries Co., Ltd.
Head offi ce 4-6, Kanda-Surugadai, Chiyoda-ku, Tokyo 101-0062, Japan
Establishment August 1, 1949
Number of employees
4,999 non-consolidated13,057 consolidated
Capital ¥104,873 million
Shares
Number of shares authorized to be issued
300,000,000 shares
Number of shares issued 116,254,892 shares(Including 328,807 shares of treasury stock)
Number of shareholders 85,138
76 77Nippon Paper Industries Co., Ltd. Annual Report 2017 Nippon Paper Industries Co., Ltd. Annual Report 2017

Corporate Data
Mar.Feb.Jan.Dec.Nov.Oct.Sep.Aug.Jul.Jun.MayApr.
42.45%
43.22%
23.82%
20.87%
20.37%
22.10%
11.13%
11.25%
■ 2.28% ■ 0.02% ■ 0.26%
■ 1.94% ■ 0.02% ■ 0.27%
■ 1.78% ■ 0.02% ■ 0.28%
20172016
42.32% 24.73% 20.93% 9.94%
■ Financial institutions ■ Foreign investors ■ Individuals and others ■ Other domestic corporations
■ Securities companies ■ Government and municipalities ■ Treasury stock
March
2017
March
2016
March
2015
0
500
1,000
1,500
2,000
2,500
Stock price (¥)
0
4,000
8,000
12,000
16,000
20,000
Trading
volume
(Thousand
shares)
24,000
Share ownership by shareholder category
Stock price and trading volume trends
Investor Information
Company name Nippon Paper Industries Co., Ltd.
Securities code 3863
Listings Tokyo Stock Exchange
Fiscal year April 1 to March 31
Ordinary General Meeting of Shareholders
Within three months of the day following the fi scal year-end
Register and transfer agent
Sumitomo Mitsui Trust Bank, Limited 1-4-1, Marunouchi, Chiyoda-ku, Tokyo, Japan
Contact for inquiry and mailing address
Stock Transfer Agency DepartmentSumitomo Mitsui Trust Bank, Limited
2-8-4, Izumi, Suginami-ku, Tokyo 168-0063, JapanPhone: 0120-78-2031 (Toll free in Japan)
Independent accounting auditor
Ernst & Young ShinNihon LLC
Types of Paper Utilized in This Annual Report
• Cover: U-LITE DRY α (157.0 g/m2) produced by Nippon Paper Industries Co., Ltd.
• Contents: b7 Light (97.0 g/m2) produced by Nippon Paper Industries Co., Ltd.
Early FebruaryRelease 3Q financial results
Early NovemberRelease interim financial results
Late NovemberDispatch business reports
Mid MayRelease financial results
Early JuneDispatch Notice of the Ordinary General Meeting of Shareholders
Late JuneOrdinary General Meeting of Shareholders Dispatch business reports
Early AugustRelease 1Q financial results
Early SeptemberIssue Annual Report
Apr.
Sep.
Mar.
Oct.
Jun.
Jul.
Jan.
Dec.
First Quarter
Second Quarter
Fourth Quarter
Third Quarter
IR CalendarNote: The schedule may change without notice.
78 79Nippon Paper Industries Co., Ltd. Annual Report 2017 Nippon Paper Industries Co., Ltd. Annual Report 2017