Embed Size (px)
Citation preview

NIOBRARA OPCOM
Carrizo Oil & Gas, Inc.September 27, 2016

CRZO2 CRZO2
Niobrara Overview

CRZO3 CRZO3
Niobrara FormationPreserving Option Value
Minimal drilling obligations as acreage position is mostly held by productionStacked‐pay nature provides development potential in the Niobrara A, B, and C benchesNearby industry testing of the deeper Codell formation could add another layer of potential
Project To Date132 gross / 59 net wells drilled
2016 Operated Activity Frac’d 9 gross / 5 net wells – Aug ‘16
*Includes <1 MMboe of PUDs
Niobrara Formation OverviewNet Acres 32,100
Net Undrilled Locations ~640
EUR / Well (Mboe) 150‐350
Spacing between Laterals (Ft.) 300/450
Effective Lateral Length (Ft.) 4,200
Net Undrilled Resource Potential (MMboe)* >125

CRZO4 CRZO4
Niobrara FormationAcreage Ranking
Identified several discreet areas within Niobrara project and evaluated development potential and economics separately
Ranking criteria: Geologic / petrophysical
quality Activity level Production results
Area 1
Area 2A
Area 2B
Area 3

CRZO5
Niobrara ProjectGross Operated Production

CRZO6
Carrizo “Macro” View
$10
$30
$50
$70
$90
$110
$/Bb
l
Oil Prices
WTI Spot Price ($/Bbl) Current Strip BB Consensus BAML Natixis
Shale development has met or exceeded virtually every technical and operational expectation EURs Repeatability Well costs
Carrizo agrees with consensus that oil markets rebalance and prices rise in 2017
We have realized capital cost reductions more quickly than expected
Natural gas prices under pressure for the remainder of decade

CRZO7 CRZO7
Niobrara
OPERATIONS

CRZO8
Niobrara ProjectDrilling & Completion Design Progression
Original DesignProduction Liner
Previous DesignLiner with Tie‐
back
Current DesignLong String
Future DesignDual String
1 2
3 4

CRZO9
Niobrara ProjectCompletion Cost Improvements Over Time
2015 YTD well costs:– Average/Stg: $79K– $/Effl Lateral: $278– Completion cost reduced 56%
from 2010 to 2015 ($/Eff. Lat. Foot basis)
*Cost are based on Enertia until end of Q4 2015, WellView used for Q1 2016
$636
$756
$611
$554
$551
$278
0
1000
2000
3000
4000
5000
6000
$0
$100
$200
$300
$400
$500
$600
$700
$800
2010
2011
2012
2013
2014
2015
Average Effecitve Lateral (ft)
Average Co
st/Effectiv
e Lateral Foo
t
Completion Cost/Eff. Lat. Foot$225,558
$161,430
$158,927
$157,554
$155,497
$79,33
5
0
1000
2000
3000
4000
5000
6000
$0
$50,000
$100,000
$150,000
$200,000
$250,000
$300,000
2010
2011
2012
2013
2014
2015
Average Effective Lateral (ft)
Average Co
st/Stage
Completion Cost/STG by Year
$3,157,805
$2,748,218
$2,369,938
$2,216,854
$2,400,749
$1,150
,381
0
25
50
75
100
125
150
175
200
$0
$500,000
$1,000,000
$1,500,000
$2,000,000
$2,500,000
$3,000,000
$3,500,000
$4,000,000
2010
2011
2012
2013
2014
2015
Cummulative Well Cou
nt
Average Co
mpletion Co
st/W
ell
Completion Cost/Well by Year

CRZO10 CRZO10
Niobrara Frac ProgramFavorable Service Cost Environment – Significant Cost Reductions
Planning on fracing 9 wells in August
7 Sleeves2 Cemented
Frac Cost Per Stage2016 ‐ $21,800Oct ‘15 ‐ $29,267May ‘15 ‐ $46,1232014 ‐ $75,175
Fresh Water Savings2015 ‐ $1.95 /bbl2016 ‐ $0.45 /bbl

CRZO11
Niobrara ProjectCurrent Completions
Shull PadTesting 80 acre A‐bench wells above existing 80 acre B‐bench wells
Important for future A‐bench development in several key areas where B‐bench has already been drilled
Niobrara A bench
Niobrara B bench
Niobrara C bench
1
2
4
3
150
150
Niobrara A bench
Niobrara B bench
300
300
300
300
300
600
Pad
4
8
3
7
2
6
1
5
Ptasnik PadTesting all 3 benches
New Frac DesignUsing primarily slick water and minimizing gelSignificant increase in fluid volume ‐ 30 bbl/ftIncreased sand concentration to 1,100 pounds/ft from 760 and using primarily 40/70 sand rather than 20/40Smaller stage intervals on two “plug & perf” wells; future wells will go to smaller stage spacing

CRZO12
Timbro Ranch 1‐3 Flowback Comparison
0
5000
10000
15000
20000
25000
0 10 20 30 40 50 60 70 80 90
Cumulative BB
Ls
Days Online
Timrbo 2‐3 Oil
Timbro 1‐3 Oil
2A Type Curve
2B Type Curve
Install Jet Pump Flow
back
%Load
Recovered
Install Gas Lift

CRZO13
Timbro Ranch 1‐3 Cumulative Oil Comparison
0
5000
10000
15000
20000
25000
0 10 20 30 40 50 60 70 80 90
Cumulative Oil, BBLs
Days Online
Timrbo 2‐3 OilTimbro 1‐3 OilTimbro 1‐34 OilTimbro 2‐34 Oil2A Type Curve2B Type Curve
Install Jet Pump
Installing Gas Lift

CRZO14
Shull Cumulative Oil (Flowback)
• Wells still in flowbackperiod
• Initial indication of oil increasing as water rate declines
• Gas break through in 5‐25 significantly increased oil production
• Installation of gas lift complete; first few days show possible indication of increasing oil rates on gas lift. Still too early to make strong conclusions
0
500
1,000
1,500
2,000
2,500
3,000
3,500
4,000
4,500
0 5 10 15 20 25 30 35
Cumulative Oil Prod
uctio
n, BBLs
Days On Production
Shull 5‐25
Shull 6‐25
Shull 7‐25
Shull 8‐25
Gas Lift Install

CRZO15
Ptasnik Flowback
0
2000
4000
6000
8000
10000
12000
14000
0 5 10 15 20 25 30
Cumulative Oil Prod
uctio
n, BBLs
Days online
Ptasnik
Area 1Area 2AArea 2BPtasnik 1‐30 (B)Ptasnik 2‐30 (A)Ptasnik 3‐30 (C)Ptasnik 4‐30 (B)
• Wells still in flowbackperiod, all still on natural flow.
• Ptasnik 2‐30 & 3‐30 both gave tubing installed and will have gas lift starting today (9/27/2016)
• Expecting uplift in 2‐30 and 3‐30 once gas lift begins
• Ptasnik 1‐30 and 4‐30, trending towards are 2A type curve without Artifical Lift.
• More data is needed, but initial indications are positive for down spaced “diamond stack” drill pattern.

CRZO16
Ptasnik Flowback
• Initial rates are promising for tightened spacing and diamond stack pattern
• Wells made oil on first day of flowback
• Both B bench wells IP’d in the high 500 bopd range
• Both A and C bench wells showed spikes of up to 300 bopd
• Gas lift expected to be installed end of next week
• Both B Bench wells have began to make gas

CRZO17 CRZO17
Niobrara
LAND

CRZO
Niobrara Lease Extensions & Expirations
IOCL's Net Acreage Expiring with Extensions
IOCL's Net Acreage Expiring Without
Extensions
Potential Cost of Extensions
2016 13 5 $1,306
2017 6 28 $6,269
2018 0 179 N/A
2019 64 202 Determined by Lessor
83 415 $7,574
Extensions and Expirations per Year

CRZO
Niobrara Lease Extensions & Expirations
Lease Extensions & Expirations by Area
Leases with Extensions
IOCL’s Net Acres with Extensions
Leases Without Extensions
IOCL’s Net Acres Without Extensions
Area 1 0 0 0 0
Area 2A 3 64 6 81
Area 2B 9 6 28 155
Area 3 0 0 2 128
Not in Tier 1 13 4 47
Adams 0 0 14 4
13 83 54 415

CRZO
Niobrara Lease Extensions & Expirations
OIL's Net Acreage Expiring with Extensions
OIL's Net Acreage Expiring Without
Extensions
Potential Cost of Extensions
2016 25 10 $2,612
2017 12 57 $12,150
2018 0 295 N/A
2019 0 404 N/A
37 766 $14,762
Extensions and Expirations per Year

CRZO
Niobrara Lease Extensions & Expirations
Lease Extensions & Expirations by Area
Leases with Extensions
OIL’s Net Acres with Extensions
Leases Without Extensions
OIL’s Net Acres Without Extensions
Area 1 0 0 0 0
Area 2A 0 0 6 162
Area 2B 7 12 11 247
Area 3 0 0 2 256
Not in Tier 1 25 4 94
Adams 0 0 14 8
8 37 37 766

CRZO22
NiobraraLease Extensions and Expirations

CRZO23 CRZO23
Niobrara
DEVELOPMENT PLAN

CRZO
Operated Activity 2016 Drill Schedule
− Currently none
− Price dependent
− Negotiated month‐to‐month payment option through remainder of term for Xtreme 19 rig
2016 Completion Schedule − Completed remaining 9 gross wells in inventory in
August 2016
− Additional activity contingent on level of non‐op spending
2017: No current D&C activity scheduled− Price dependent
Non‐Op Activity Minimal non‐operated AFE in 2016, with Noble
being the only non‐op party proposing wells− Noble expected to drill 15 gross wells and complete
22 gross wells on JV properties
− September Update: Noble recently proposed 15 gross “Federal” wells w/ ~10% CRZO WI
24
Niobrara Activity OverviewDrilling and Frac Activity
Note: Assumptions are estimates and subject to change.

CRZO25 CRZO25
Identified several discreet areas within Niobrara project and evaluated development potential and economics separately
Ranking criteria Geologic /
petrophysical quality Activity level Production results
Development PlanCarrizo Acreage Ranking

CRZO26 CRZO26
Project Area40 Acre B‐bench
60 Acre B‐bench
80 Acre A‐bench
80 Acre C‐bench Total
Area 1 178 84 47 309
Area 2A 334 47 381
Area 2B Upside 228 Upside 228
Total 512 228 131 47 918
Niobrara ProjectFull Development Model ‐ JV Net Well Inventory
160‐Acre
NE Extension 316
Codell
A Bench
B Bench
C Bench
Codell

CRZO27 CRZO27
Area 1
0
20,000
40,000
60,000
80,000
100,000
120,000
140,000
0 200 400 600 800 1000 1200 1400
Cumulative Oil Prod
uctio
n (Bbls)
Days Online
Area 1: Cumulative Oil ProductionBringelson 1‐20‐11‐9‐58 CumBringelson 2‐20‐11‐9‐58 CumBringelson 3‐20‐11‐9‐58 CumBringelson 1‐32‐9‐58 CumBringelson 2‐32‐9‐58 CumBringelson 33‐21‐9‐58 CumBringelson 2‐33‐9‐58 CumBringelson 3‐33‐9‐58 CumBringelson 1‐34‐41‐9‐58 CumBringelson 2‐34‐9‐58 CumBringelson 3‐34‐9‐58 CumBringelson 4‐34‐9‐58 CumBringelson 10 20 9 58 CumBringelson 11 20 9 58 CumBringelson 12 20 9 58 CumBringelson 5 20 9 58 CumBringelson 6 20 9 58 CumBringelson 7 20 9 58 CumBringelson 8 20 9 58 CumBringelson 9 20 9 58 CumCastor 1‐36‐11‐9‐59 CumCastor 2‐36‐11‐9‐59 CumCastor 3‐36‐11‐9‐59 CumCastor 4‐36‐9‐59 CUMCastor 5‐36‐9‐59 CUMCastor 7‐36‐9‐59 CUMBringelson Ranch 5 34 9 58 CumBringelson Ranch 6 34 9 58 CumBringelson Ranch 13 20 9 58 CumBringelson Ranch 14 20 9 58 CumBringelson Ranch 15 20 9 58 CumBringelson Ranch 16 20 9 58 CumBringelson Ranch 17 20 9 58 CumAverage

CRZO28 CRZO28
Area 2A
0
20,000
40,000
60,000
80,000
100,000
120,000
140,000
0 200 400 600 800 1000 1200 1400
Cumulative Oil Prod
uctio
n (Bbls)
Days Online
Area 2A: Cumulative Oil ProductionBailey 5‐26‐8‐60 CUMBailey 6‐26‐8‐60 CUMBailey 7‐26‐8‐60 CUMBailey 8‐26‐8‐60 CUMHemberger 1‐26‐34‐8‐60 CumHemberger 2‐26‐34‐8‐60 CumShull 1‐25‐9‐60 CumShull 2‐25‐9‐60 CumShull 3‐25‐9‐60 CumShull 4‐25‐9‐60 CumShull 1 35 9 60 CumShull 2 35 9 60 CumShull 3 35 9 60 CumNelson Ranch 1‐27‐10‐59 CumNelson Ranches 1‐33‐10‐59CUMNelson Ranches 2‐27‐10‐59 CumNelson Ranches 3‐27‐10‐59 CumNelson Ranches 4‐ 27‐10‐59 CumNelson Ranches 5‐27‐10‐59 CumOhare 1‐5‐ 10‐ 57 CUMPtasnik 30‐44‐9‐59 CumSchneider 1‐14‐8‐60 CumSchneider 2‐14‐8‐60 CumOhare 1 29 11 57 CumOhare 2 29 11 57 CumTimbro Ranch 1 34 10 59 CumTimbro Ranch 2 34 10 59 CumHemberger 4 26 8 60 CumHemberger 5 26 8 60 CumHemberger 6 26 8 60 CumHemberger 3‐26‐34‐8‐60 CumTimbro Ranch 2 3 9 59 CumAverage

CRZO29 CRZO29
Area 2B
0
20,000
40,000
60,000
80,000
100,000
120,000
140,000
0 200 400 600 800 1000 1200 1400
Cumulative Oil Prod
uctio
n (Bbls)
Days Online
Area 2B: Cumulative Oil ProductionOrlando Hill 26 44 8 61 CumTimbro Ranch 1‐31‐10‐59 CumBob White 2‐36‐8‐62 CUMBob White 3‐36‐8‐62 CUMBob White 36‐44‐8‐62 CumBob White 4‐36‐8‐62 CUMGaffney 2‐29‐8‐61 CUMJones 18‐14‐10‐59 CumKonig 2‐31‐11‐59 CUMNelson 1‐20‐9‐60 CumNelson 17‐44‐9‐60 CumNelson 2‐17‐9‐60 CumNelson 3‐17‐9‐60 CumNelson 4‐17‐9‐60 CumNelson 5‐17‐9‐60 CumPergamos 1‐8‐41‐7‐60 CumPergamos 1‐4‐34‐7‐60 CumPergamos 2‐4‐34‐7‐60 CumPergamos 1‐4‐44‐7‐60 CumPergamos 2‐4‐44‐7‐60 CumPergamos 3‐44‐7‐60 CumPergamos 3‐3‐7‐60 CumPergamos 3‐11‐7‐60 CumPergamos 4‐3‐7‐60 CumState 16‐11‐9‐60 CumState 2‐16‐9‐60 CUMState 2‐36‐9‐61 CumState 3‐16‐9‐60 CumState 3‐36‐9‐61 CumState 36‐24‐9‐61 CumState 4‐16‐9‐60 CUMState 4‐36‐9‐61 CumSpeaker 1‐27‐11‐8‐61 CUMSpeaker 1‐27‐31‐8‐61 CumSpeaker 2‐27‐11‐8‐61 CumSpeaker 2‐27‐31‐8‐61 CumSpeaker 3‐27‐11‐8‐61 CUMHemberger 1 25 8 60 CumHemberger 3 25 8 60 CumHemberger 4 25 8 60 CumHemberger 5 25 8 60 CumHemberger 6 25 8 60 CumHemberger 2 25 34 8 60 CumAverage

CRZO30 CRZO30
Niobrara ProjectType Curve Economics
(1) Economics based on NYMEX prices and include $5.80/Bbl deduct for oil, $3.00/McfNYMEX gas, NGL pricing 21% of NYMEX oil price.
Type Curve Area 1 Area 2A Area 2B
Total Well Cost $2.0 MM $2.0 MM $2.0 MM
WellLife 35 Yrs. 35 Yrs. 35 Yrs.
EUR
Gross 277 Mboe 224 Mboe 168 Mboe
Oil Only 208 Mbo 162 Mbo 121 Mbo
Net 224 Mboe 181 Mboe 136 Mboe
IRR&
NPV (1)
$65 OilIRR 78% 55% 21%
NPV $2.0 MM $1.4 MM $0.4 MM
$55 OilIRR 34% 27% ‐
NPV $1.1 MM $0.7 MM ‐
$45 OilIRR 13% ‐ ‐
NPV $0.2 MM ‐ ‐
NYMEX NPV10 Breakeven $43 $46 $57

CRZO31
Niobrara weighted average break‐even cost = $48/Bbl
Niobrara ProjectPV‐10 Break‐Even Oil Price by Area
$43.00
$46.00
$57.00
$0
$10
$20
$30
$40
$50
$60
0%
10%
20%
30%
40%
50%
60%
Area 1 Area 2A Area 2B
PV10
Breakeven
Oil Price, $/BO
% of JV Net Locations

CRZO32
Geological OverviewCodell Thickness
Codell ranges between 5’‐20’ across Carrizo acreage
Whiting and Noble test locations shown
Most of JV acreage has Codell as thick as Whiting/Noble test locations

CRZO33 CRZO33
Development PlanCodell Tests
Noble JD LC26‐780

CRZO34 CRZO34
Niobrara
Lease Operating Expenses

CRZO
Rising LOE per BOE is largely a function of decline in production
Average well age went from 9 months in December 2012 to 28 months in December 2015
Spike in LOE per BOE in the end of 2015 caused by wells shut‐in for offset fracs (Hemberger 4‐26, Bringelson 13‐20 No associated LOE spend increase at this time
14 – 17 wells were shut‐in at any given time September 2015 through November 2015
Winter storm took about 50 wells offline towards the end of December 2015
35
Historical LOE Trend – Quarterly Gross 8/8 Niobrara
*Production handling fees excluded from LOE/BOE analysis
332 486
700 635 694
911 951 837 765 726 653 580 557
480
$3.86
$5.45
$4.77 $3.84
$6.49
$5.84 $5.70 $5.45
$4.53
$5.22
$6.21 $6.76
$6.33 $6.53
0
200
400
600
800
1,000
1,200
1,400
1,600
1,800
2,000
$1
$2
$3
$4
$5
$6
$7
$8
1Q13 2Q13 3Q13 4Q13 1Q14 2Q14 3Q14 4Q14 1Q15 2Q15 3Q15 4Q15 1Q16 2Q16
BOE in
Tho
usan
ds
LOE/BO
E
Quarter Svc
Niobrara Operated Quarterly LOE/BOE (Gross 8/8)

CRZO36
LOE Composition
LOE = Lifting Costs + Workover Expenses
Other includes: pumping services (field operators), contract labor, power, metering & calibration and equipment transportation
*Production handling fees excluded from LOE/BOE analysis
$0
$1
$2
$3
$4
$5
$6
$7
$8
1Q13 2Q13 3Q13 4Q13 1Q14 2Q14 3Q14 4Q14 1Q15 2Q15 3Q15 4Q15 1Q16 2Q16
LOE/BO
E
Quarter Svc
Niobrara Operated Wells LOE/BOE (Gross 8/8, Qtr Svc)
Other
180.107 ‐ Equipment Rental
180.199 ‐ Environmental Incident Response
180.109 ‐ Production Chem & Treating Expenses
180.100 ‐ COPAS Labor ‐ Producing
180.104 ‐ Compression Rental, Oil, Coolant
180.112 ‐ COPAS Overhead ‐ Producing
Workover Expense
180.108 ‐ Salt Water Disposal
180.102 ‐ Repairs & Maintenance
180.198 ‐ Environmental Expenses
Billing Category:

CRZO
Repairs & Maintenance, $0.58, 9%
Salt Water Disposal, $0.80, 13%
Equipment Rental, $0.35, 6%
Production Chem & Treating Expenses,
$0.85, 13%
COPASOverhead ‐Producing, $0.57, 9%
COPAS Labor ‐
Producing, $0.38, 6%
EnvironmentalExpenses,$0.78, 12%
Compression Rental, Oil, Coolant, $0.50, 8%
Other, $0.83, 13%
WorkoverExpense, $0.64, 10%
Niobrara Operated Gross 8/8 LOE/BOE (1Q16 svc)
180.102 ‐ Repairs & Maintenance
180.108 ‐ Salt Water Disposal
180.107 ‐ Equipment Rental
180.109 ‐ Production Chem & Treating Expenses
180.112 ‐ COPAS Overhead ‐ Producing
180.100 ‐ COPAS Labor ‐ Producing
180.198 ‐ Environmental Expenses
180.199 ‐ Environmental Incident Response
180.104 ‐ Compression Rental, Oil, Coolant
Other
Workover Expense
Total 1Q 2016 LOE/BOE on operated wells amounted to $6.33/Bbl
Production chemicals and treating expenses, saltwater disposal costs, environmental expenses, workoverexpense, repairs and maintenance and COPAS fess make up 70% of total lease operating expenses
Fixed/variable expense composition 2Q16: 55%/45% (aging wells)
Looking forward (2016):
Average age of wells will continue to rise partly offset by new Timbro Ranch and Shull wells that came online on September 2016
2016 expected savings from changing chemical provider: 1 – 1.5 $MM (gross 8/8)
2016 expected savings from changing to Select Energy for saltwater hauling: 0.5 $MM (gross 8/8)
Ongoing environmental expenses due to compliance expected to decrease to 5% ‐ 9% of LOE/BOE rate
37
LOE Composition and Targeted Improvements
Top 5 Bill Cats DescriptionRepairs & Maintenance Jet pump repairs, pressure safety tests, pressure washing tanks, equipment mobilization, site clean‐up, sanding and welding. Salt Water Disposal SWD truck hauling and disposal expenses.Production Chem & Treating Expenses Tank rental, equipment for chemical use, paraffin dispersant, friction reducers and corrosion inhibitor.Equipment Rental Varied machinery for operations such as forklifts, generators, light towers, man‐lifts. Trash haulers, trash trailers. Environmental Expenses Safety and security state compliance, emissions controls, mowing, reclamation, stormwater mgmt. expenses.
Billing Category:
*Production handling fees excluded from LOE/BOE analysis

CRZO38
Niobrara Aging Wells
0
5
10
15
20
25
30
Jan‐11 Jul‐11 Jan‐12 Jul‐12 Dec‐12 Jul‐13 Dec‐13 Jul‐14 Dec‐14 Jul‐15 Dec‐15
Well A
ge, M
onths
Average Well Age
Average well age went from 9 months in December 2012 to 28 months in December 2015
As wells age, their LOE/BBL continues to rise as not all LOE costs decrease proportionally with production
A scaled back completion program in 2015 brought fewer wells online than previous years, causing the LOE of the field to be driven in a larger part by the older well stock that exhibit higher LOE/BOE costs.

CRZO39 CRZO39
Niobrara
MARKETING & TRANSPORTATION

CRZO40
Oil Price Differentials to NYMEX Posting
(160)
(140)
(120)
(100)
(80)
(60)
(40)
(20)
0
20
40
60
80
100
120
‐$16.00
‐$14.00
‐$12.00
‐$10.00
‐$8.00
‐$6.00
‐$4.00
‐$2.00
$0.00
$2.00
$4.00
$6.00
$8.00
$10.00
$12.00
NYM
EX M
onthly Average Pric
e, $/BO
Average Differen
tial to NYM
EX, $/BO
Avg. Differential Monthly NYMEX

CRZO41
Oil Price Differentials to NYMEX Posting
July 2016
0%
5%
10%
15%
20%
25%
30%
35%
40%
45%
50%
0.00
1.00
2.00
3.00
4.00
5.00
6.00
7.00
8.00
9.00
10.00
1 2 3 4 5
Share of Produ
ction
Differen
tial, $/BO
Target – Nov 2016
0%
5%
10%
15%
20%
25%
30%
35%
40%
45%
50%
0.00
1.00
2.00
3.00
4.00
5.00
6.00
7.00
8.00
9.00
10.00
1 2 3 4 5
Share of Produ
ction
Differen
tial, $/BO
Bridger CVR CVR UET Avg.
Buyer
Bridger CVR CVR UET Avg.
Buyer

CRZO42
Carrizo Niobrara 2016 Oil Contracts
Recent 6 month term deal with CVR for their current production improving the deduct from ‐$3.75 to ‐$2.00 (Aug 2016 to Jan 2017)1 year term deal with UET for the new Ptasnik wells (1st production Sep 2016). Deduct ‐$1.70 (Aug 2016 to Aug 2017)Plans to reach an agreement with Bridger to replace the UET contract (NYMEX ‐ $8.74) starting Nov 2016. Expected 1 year contract, improving the deduct to ‐$1.75.

CRZO43
Carrizo Niobrara Oil Price Realization
May 2016 differentials: WLL ‐$24.99, NBL ‐$11.12, CRZO ‐$5.69October 2015 differentials: WLL ‐$11.77, NBL ‐$9.14, CRZO ‐$6.93Carrizo is currently working with legal and marketing to find a solution on WLL’s deficiency feesWhiting oil deducts: volume deficiency feeNoble oil deducts: oil gathering, Wattenberg pump over charge, Wattenberg pipeline tariff charge, Wattenberg trucking charge and Wattenberg unloading charge
$10
$15
$20
$25
$30
$35
$40
$45
$50
$55
Oct‐15 Nov‐15 Dec‐15 Jan‐16 Feb‐16 Mar‐16 Apr‐16 May‐16 Jun‐16
$/Bb
l
Niobrara Oil Price Realizations
CRZO Realized Price NYMEX Oil WLL after deducts NBL after deducts
0
5
10
15
20
25
30
35
40
45
Oct‐15 Nov‐15 Dec‐15 Jan‐16 Feb‐16 Mar‐16 Apr‐16 May‐16 Jun‐16
Volume (M
Bbl)
Niobrara Non‐Op Oil Sales (Net to Crzo)
WLL Oil NBL Oil

CRZO44
Carrizo Niobrara Gas Price Realization
$(6.00)
$(4.00)
$(2.00)
$‐
$2.00
$4.00
$6.00
$8.00
$10.00
1Q14 2Q14 3Q14 4Q14 1Q15 2Q15 3Q15 4Q15 1Q16
$/Mcf
Niobrara Gas Price Realizations
CRZO Net Realized Price NYMEX Gas WLL Net Realized Price NBL Net Realized Price
Qtr Svc
Noble gas deducts: gas processing, gathering, gas gathering, treating, electrical fee, % of proceeds reduction
Whiting gas deducts: no gas deducts charged by WLL

CRZO45
Carrizo Niobrara NGL Price Realization
$(10.00)
$‐
$10.00
$20.00
$30.00
$40.00
$50.00
$60.00
$70.00
$80.00
$90.00
$100.00
$110.00
1Q14 2Q14 3Q14 4Q14 1Q15 2Q15 3Q15 4Q15 1Q16
$/Bo
e
Niobrara NGL Price Realizations
CRZO Net Realized Price NYMEX Oil WLL Net Realized Price NBL Net Realized PriceQtr Svc
Gas sales revenue on NBL checks included both gas and NGL’s prior to 1Q15 and both were recorded as gas on CRZO’s books. Beginning in 1Q15, NBL charged gas and NGL sales volumes and values separately on their check and were thus recorded as gas and NGL’s individually on CRZO’s books.
Noble NGL deducts: percent of proceeds reduction
Whiting NGL deducts: gathering, fractionation
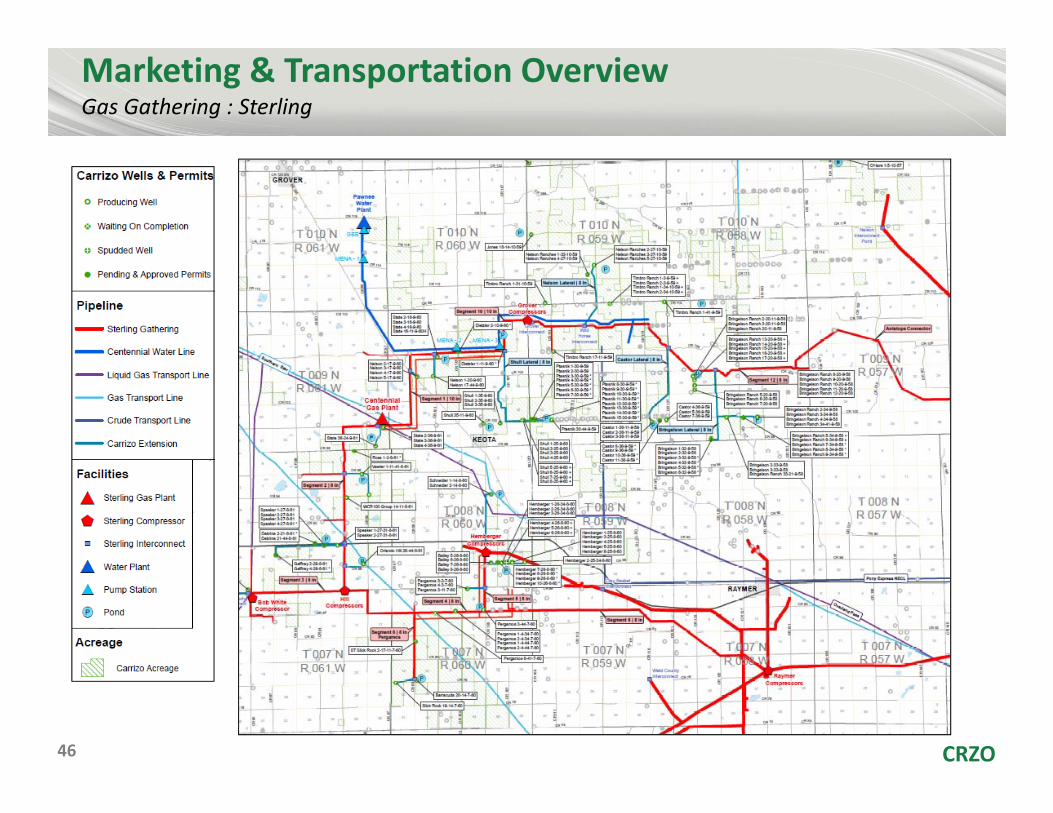
CRZO46
Marketing & Transportation OverviewGas Gathering : Sterling

CRZO47 CRZO47
Niobrara
NON‐OPERATED

CRZO48 CRZO48
Niobrara ProjectNon‐Op Activity
Noble is the only non‐op company to propose new AFEs for 2016 activity‒ Drilling: 15 gross / 1.4 net wells to Carrizo‒ Completion: 22 gross / 1.6 net wells to Carrizo‒ September Update: Noble recently proposed 15 gross wells w/ ~10% CRZO WI
‒ Drill December 2016 and Q1 2017‒ Complete 2017
Whiting has hinted at 2016 activity‒ Potentially drilling and completing: 7 gross / 0.3 net wells to Carrizo‒ September Update: Likely delayed until 2017
Carrizo plans to manage its operated activity based on the level of non‐op spending

CRZO49
Niobrara ProjectNet Non‐Operated Production
Note: Volumes shown are produced volumes, not sales volumes
(1.0)
1.0
3.0
5.0
7.0
9.0
11.0
13.0
15.0
0
200
400
600
800
1,000
1,200
1,400
1,600
1,800
2,000
1/2/20
16
1/9/20
16
1/16
/201
6
1/23
/201
6
1/30
/201
6
2/6/20
16
2/13
/201
6
2/20
/201
6
2/27
/201
6
3/5/20
16
3/12
/201
6
3/19
/201
6
3/26
/201
6
4/2/20
16
4/9/20
16
4/16
/201
6
4/23
/201
6
4/30
/201
6
5/7/20
16
5/14
/201
6
5/21
/201
6
5/28
/201
6
6/4/20
16
6/11
/201
6
6/18
/201
6
6/25
/201
6
7/2/20
16
7/9/20
16
7/16
/201
6
7/23
/201
6
7/30
/201
6
8/6/20
16
8/13
/201
6
8/20
/201
6
Well C
ount
BBLS / Day
Whiting Noble Synergy Net Well Ct.

CRZO50 CRZO50
Niobrara
Q&A