Embed Size (px)
Citation preview
Copyright 2011 IHS Herold Inc. Herold Regional Play Assessment 1
Key Implications
Successful horizontal development of Niobrara oil limited to handful of E&Ps and fields
Early entry and development of the Niobrara introduces risks, as time is needed to delineate the play
Established producers with access to pre-existing seismic and well data, will have an advantage
Well performance to date is variable, and has yet to demonstrate resource play predictability
Despite this variability, some are citing the play’s best wells as indicative of future results
E&Ps anticipate experience will enhance both well performance and predictability
Acreage should be heavily risked, and low-cost entry into large acreage plots is the key to success
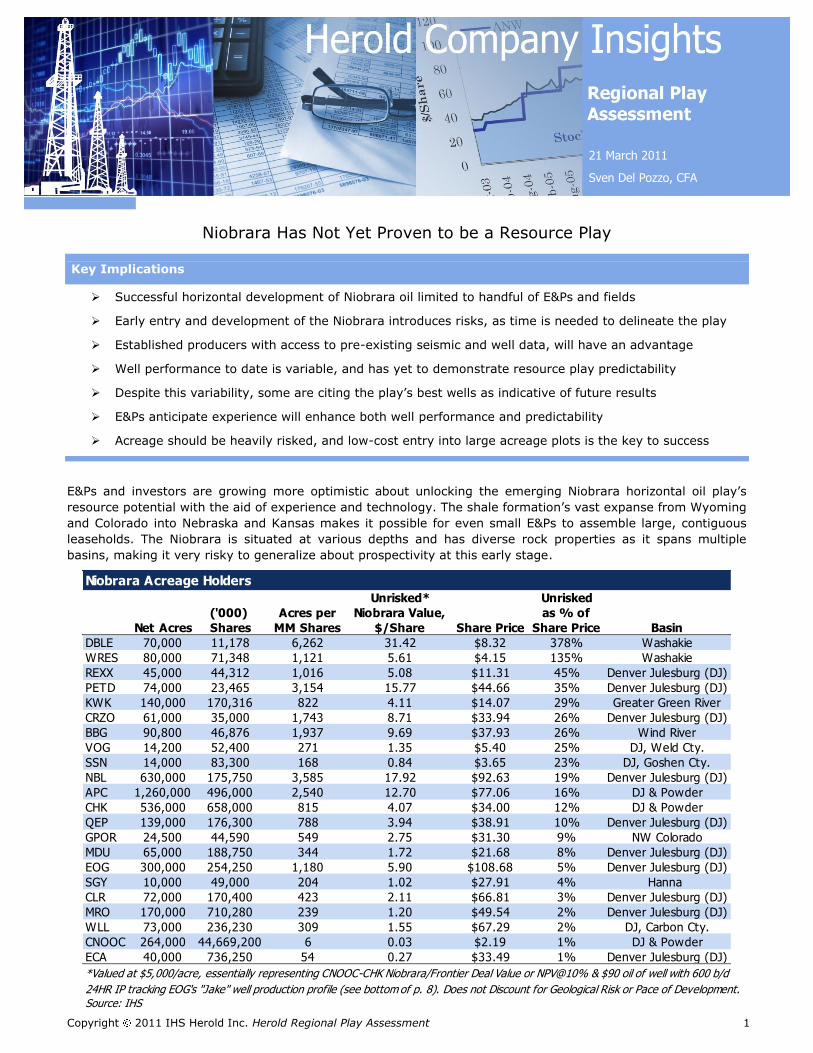
E&Ps and investors are growing more optimistic about unlocking the emerging Niobrara horizontal oil play’s
resource potential with the aid of experience and technology. The shale formation’s vast expanse from Wyoming
and Colorado into Nebraska and Kansas makes it possible for even small E&Ps to assemble large, contiguous
leaseholds. The Niobrara is situated at various depths and has diverse rock properties as it spans multiple
basins, making it very risky to generalize about prospectivity at this early stage.
Niobrara Has Not Yet Proven to be a Resource Play
21 March 2011
Sven Del Pozzo, CFA
Source: IHS
Niobrara Acreage Holders
Unrisked* Unrisked
('000)
Net Acres Shares Share Price Basin
DBLE 70,000 11,178 6,262 31.42 $8.32 378% Washakie
WRES 80,000 71,348 1,121 5.61 $4.15 135% Washakie
REXX 45,000 44,312 1,016 5.08 $11.31 45% Denver Julesburg (DJ)
PETD 74,000 23,465 3,154 15.77 $44.66 35% Denver Julesburg (DJ)
KWK 140,000 170,316 822 4.11 $14.07 29% Greater Green River
CRZO 61,000 35,000 1,743 8.71 $33.94 26% Denver Julesburg (DJ)
BBG 90,800 46,876 1,937 9.69 $37.93 26% Wind River
VOG 14,200 52,400 271 1.35 $5.40 25% DJ, Weld Cty.
SSN 14,000 83,300 168 0.84 $3.65 23% DJ, Goshen Cty.
NBL 630,000 175,750 3,585 17.92 $92.63 19% Denver Julesburg (DJ)
APC 1,260,000 496,000 2,540 12.70 $77.06 16% DJ & Powder
CHK 536,000 658,000 815 4.07 $34.00 12% DJ & Powder
QEP 139,000 176,300 788 3.94 $38.91 10% Denver Julesburg (DJ)
GPOR 24,500 44,590 549 2.75 $31.30 9% NW Colorado
MDU 65,000 188,750 344 1.72 $21.68 8% Denver Julesburg (DJ)
EOG 300,000 254,250 1,180 5.90 $108.68 5% Denver Julesburg (DJ)
SGY 10,000 49,000 204 1.02 $27.91 4% Hanna
CLR 72,000 170,400 423 2.11 $66.81 3% Denver Julesburg (DJ)
MRO 170,000 710,280 239 1.20 $49.54 2% Denver Julesburg (DJ)
WLL 73,000 236,230 309 1.55 $67.29 2% DJ, Carbon Cty.
CNOOC 264,000 44,669,200 6 0.03 $2.19 1% DJ & Powder
ECA 40,000 736,250 54 0.27 $33.49 1% Denver Julesburg (DJ)
*Valued at $5,000/acre, essentially representing CNOOC-CHK Niobrara/Frontier Deal Value or NPV@10% & $90 oil of well with 600 b/d
24HR IP tracking EOG's "Jake" well production profile (see bottom of p. 8). Does not Discount for Geological Risk or Pace of Development.
Acres per
MM Shares
Niobrara Value,
$/Share
as % of
Share Price
Copyright 2011 IHS Herold Inc. Herold Regional Play Assessment 2
0
100
200
300
400
500
600
CORE BAKKEN SINCE 2009 ALL NIOBRARA Since 2008 Top 5 Niobrara
Bb
l of O
il P
er
Da
y
Horizontal Niobrara Oil Declines Faster (Outside of Silo) Than Core Bakken
60 Day Avg. 180 Day Avg. 365 Day Avg. Avg. in Month 6 Avg. in Month 12
0
150
300
450
600
750
JAK
E
(2
4-O
ct-0
9)
ELM
ER
(23-M
ar-
10)
PO
LL R
ED
(2
5-M
ar-
10)
GA
RD
EN
CR
EEK 6
-11H
(30-J
un-1
0)
CR
ITTER
CR
EEK
4-0
9H
(7-J
ul-
10)
Lo
ng
horn
B 3
-36H
(2-S
ep
-10
Cri
tter C
reek
6-1
2H
(8-S
ep
-10)
Cri
tter C
reek
08-1
4H
(10-O
ct-1
0)
Cri
tter C
reek
13-7
H
(24-O
ct-1
0)
Gard
en C
reek
09-1
6H
(25-O
ct-1
0)
Cri
tter C
reek
09-1
5H
(28-O
ct-1
0)
Cri
tter C
reek
1-0
2H
(13-N
ov-1
0)
Els
ie 7
-34H
*
(6-D
ec-
10)
Cri
tter C
reek
17-2
1H
(26-D
ec-
10)
bb
ls o
il/d
EOG-Hereford Ranch-First 30 Days vs. Latest Month
Oldest to Newest Completions (Oct-09 to Dec-10)
Latest 30 days First 30 days
Note: () denotes completion date
Critter Creek 2-03H confidential status
*Elsie may be confidential status
Oil resource play optimism is likely driven by repeated success in discovering new, US gas resource plays.
Extrapolating success with oil resource plays from gas resource plays may prove an improper assumption. Oil
flows with greater difficulty than gas, and often needs artificial lift to produce, raising operating costs. EOG
Resources (EOG) has recently alluded to this, citing higher downtime in oil wells than in gas wells. Neither do
we have long-term production histories for oilier, “liquids-rich” plays, so the larger the estimated ultimate
recovery (EUR) per well, the riskier the estimate, since it likely depends on lengthy well-life. For our analysis,
we have limited our investment return analysis to a 20-year well life, which may seem short compared with
some E&P estimates, but captures the lion’s share of a well’s present value.
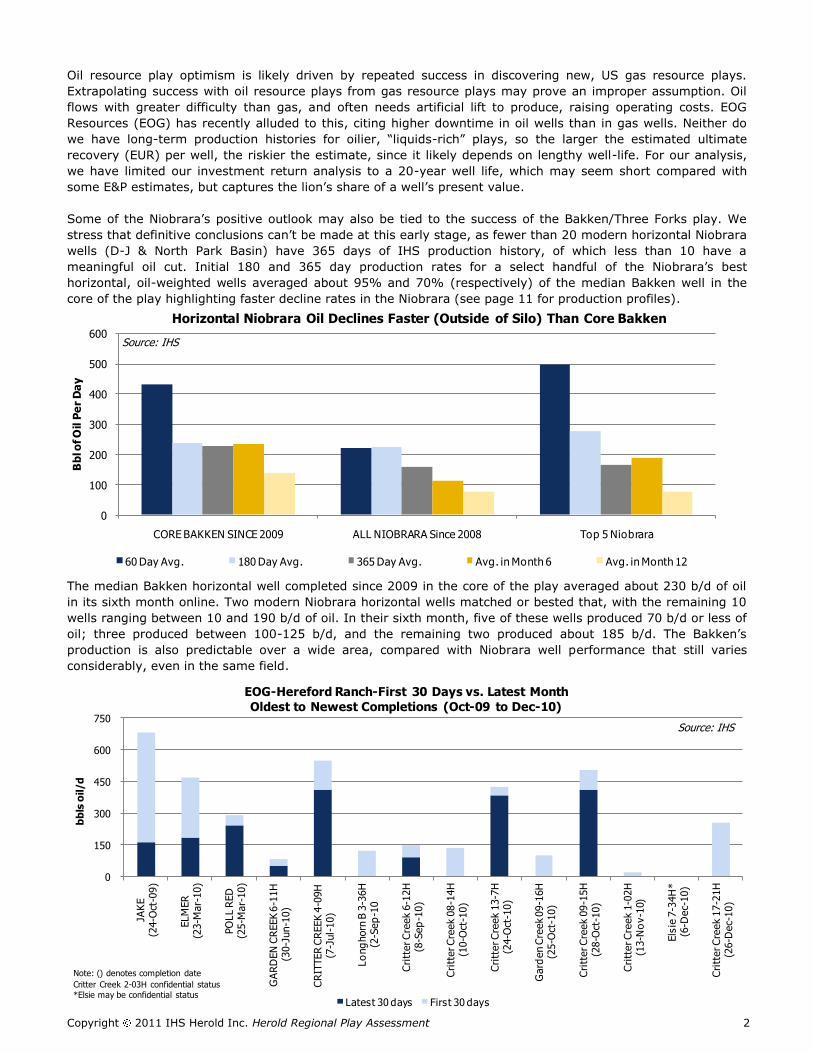
Some of the Niobrara’s positive outlook may also be tied to the success of the Bakken/Three Forks play. We
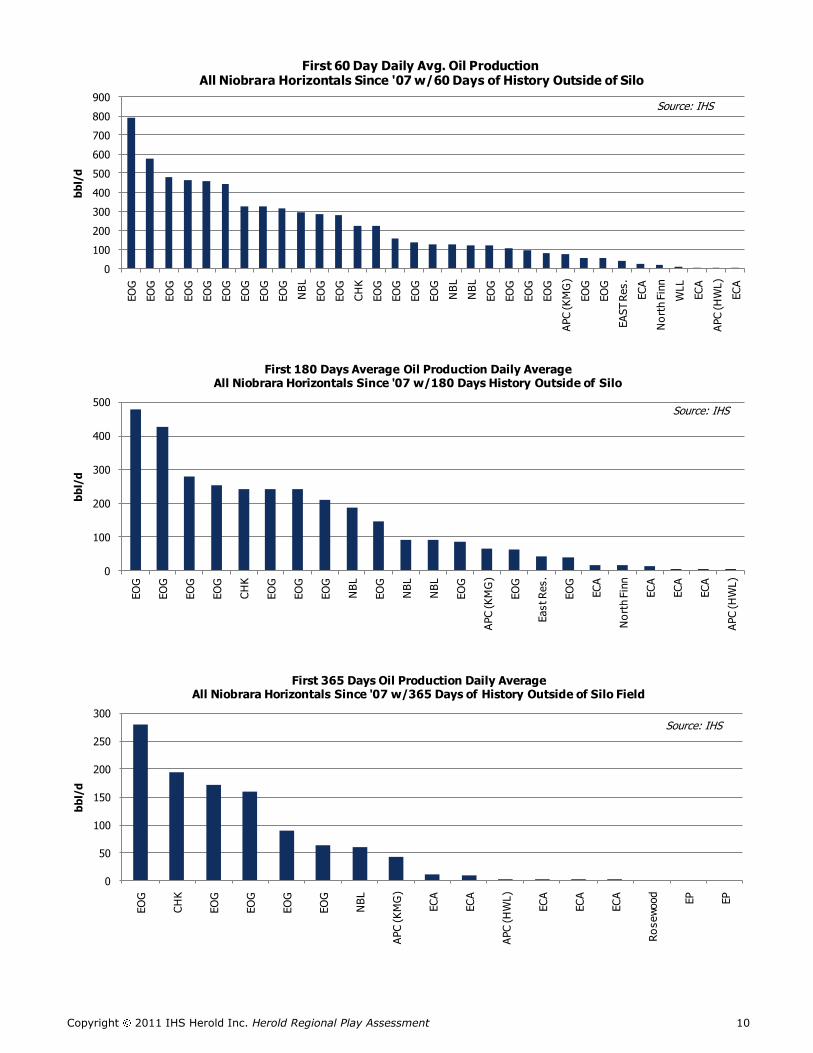
stress that definitive conclusions can’t be made at this early stage, as fewer than 20 modern horizontal Niobrara
wells (D-J & North Park Basin) have 365 days of IHS production history, of which less than 10 have a
meaningful oil cut. Initial 180 and 365 day production rates for a select handful of the Niobrara’s best
horizontal, oil-weighted wells averaged about 95% and 70% (respectively) of the median Bakken well in the
core of the play highlighting faster decline rates in the Niobrara (see page 11 for production profiles).
The median Bakken horizontal well completed since 2009 in the core of the play averaged about 230 b/d of oil
in its sixth month online. Two modern Niobrara horizontal wells matched or bested that, with the remaining 10
wells ranging between 10 and 190 b/d of oil. In their sixth month, five of these wells produced 70 b/d or less of
oil; three produced between 100-125 b/d, and the remaining two produced about 185 b/d. The Bakken’s
production is also predictable over a wide area, compared with Niobrara well performance that still varies
considerably, even in the same field.
Source: IHS
Source: IHS
Copyright 2011 IHS Herold Inc. Herold Regional Play Assessment 3
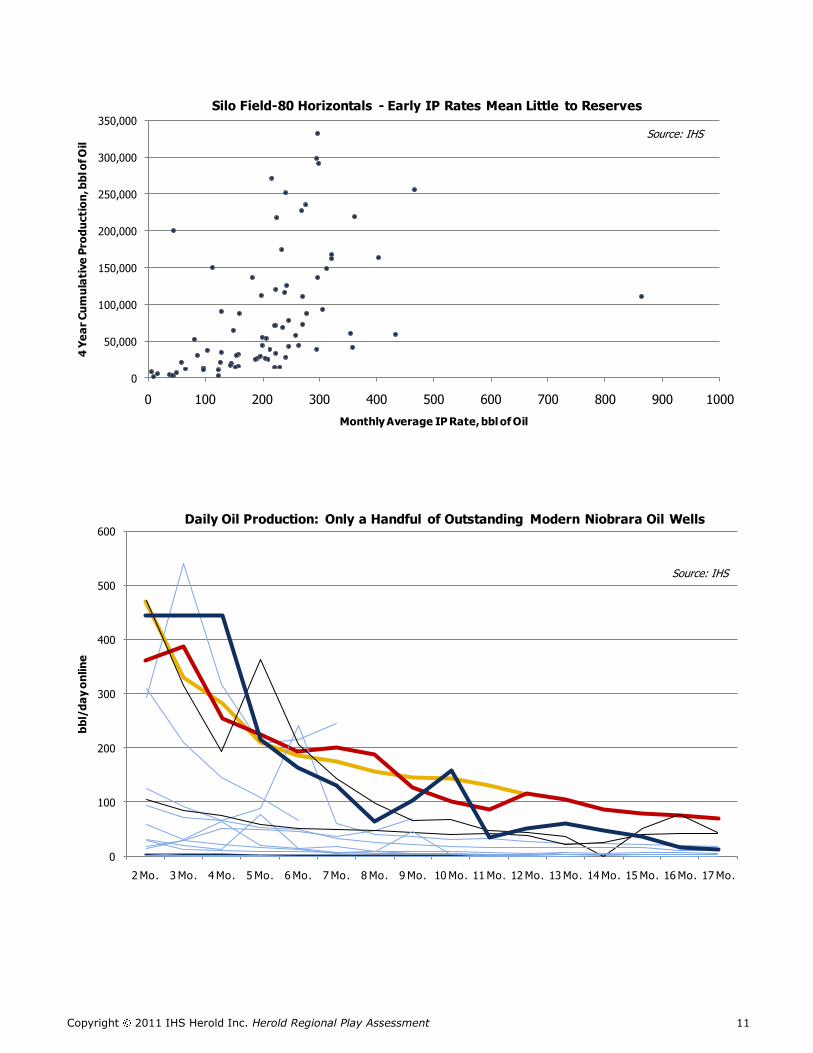
The Niobrara’s strong, early-month IPs that decline relatively rapidly, beg the questions of whether it is mainly
induced fractures that contribute to IP rates, and whether the horizontal oil play can evolve into a resource play
like the Bakken. In the large, horizontally developed Niobrara Silo field, notice that early-month IP rates have
little if any correlation to EUR (see page 12, Silo chart). The answer to the “resource play debate” depends upon
the potential contribution of matrix porosity to production, which if present would increase production and
reserves, slow decline rates, and enhance the possibility of down-spacing from a typical 640 acres. E&Ps are
confident early on, but if matrix contribution is not material, then successful Niobrara development will continue
to be limited to fractured and faulted fields.
Most E&Ps are in the early stages of shooting and analyzing 3D seismic to better identify faulting and fracturing.
When establishing leaseholds, E&Ps have consulted existing vertical well data, formation thickness, and
resistivity, among other factors, and may target anticlinal structures in the hope of encountering natural
fractures. We believe patience is a virtue for investors seeking profit as this early-stage play evolves. Operators
with the most experience and data to consult will have a leg up on the competition and produce more consistent
results earlier in the play’s evolution.
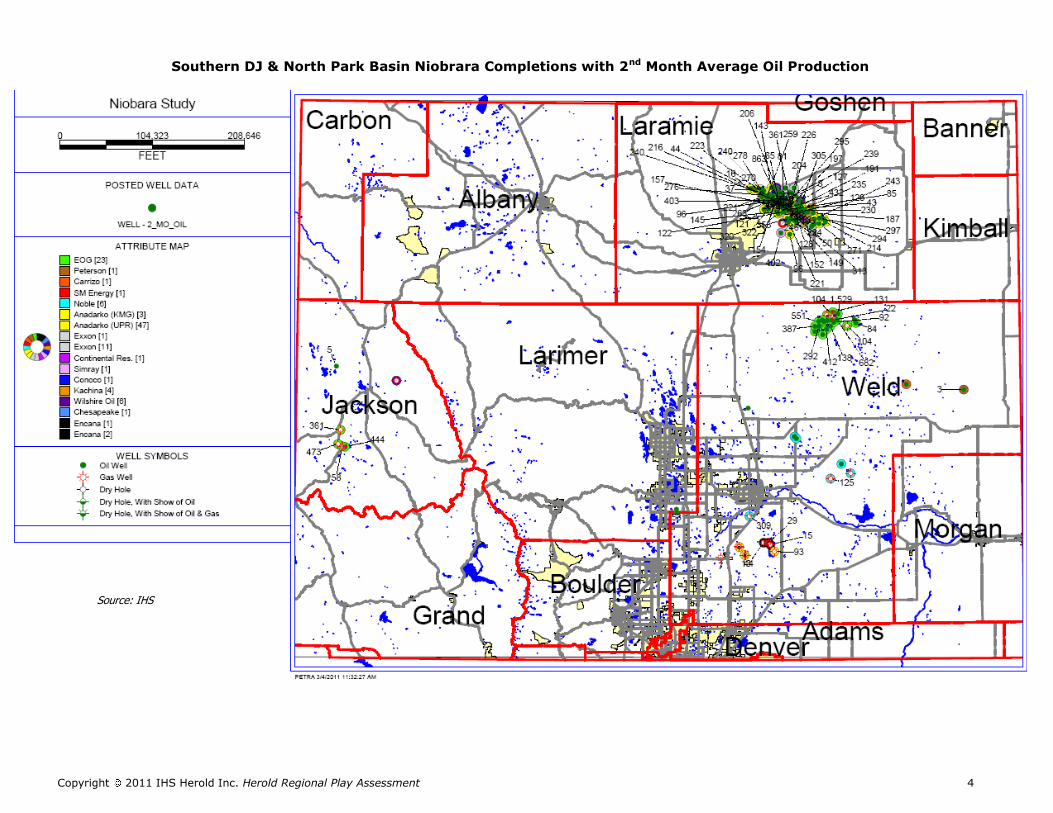
DJ Basin: To date, successful horizontal development of Niobrara oil has mainly been limited to the DJ Basin in
several naturally fractured fields east and north of Denver, Colorado. These include Wattenberg, just north of
Denver in southern Weld County, Colorado; Silo (see page 4, yellow well spots with second-month average oil
production enumerated) in Laramie County, southeastern Wyoming; and Hereford Ranch (see page 4, lime
green well spots), about 30 miles south of Silo in northern Weld County, on Wyoming’s southeastern border.
The Niobrara is situated at 7,500-8,800 feet of depth at Silo, compared with 7,000-7,500 feet deep at Hereford
Ranch, where the Jake and the Critter Creek 4-09H and 9-15H wells were drilled. These are some of the best
wells in the field with a reliable production history.
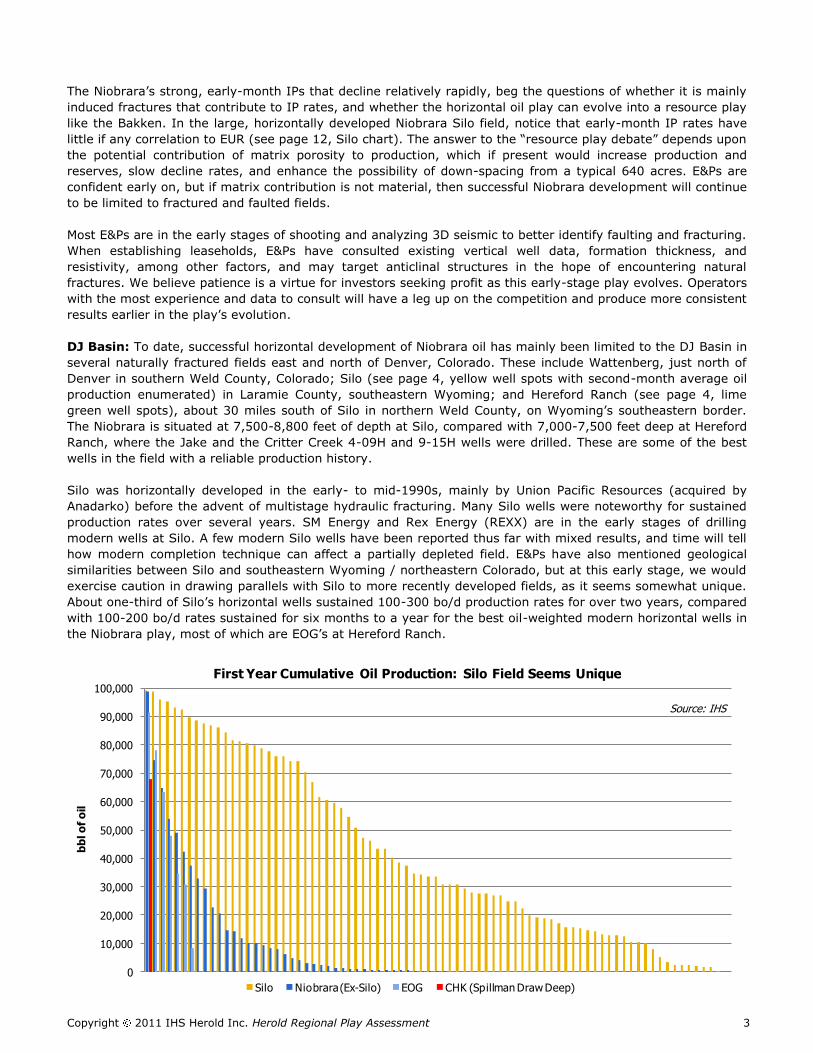
Silo was horizontally developed in the early- to mid-1990s, mainly by Union Pacific Resources (acquired by
Anadarko) before the advent of multistage hydraulic fracturing. Many Silo wells were noteworthy for sustained
production rates over several years. SM Energy and Rex Energy (REXX) are in the early stages of drilling
modern wells at Silo. A few modern Silo wells have been reported thus far with mixed results, and time will tell
how modern completion technique can affect a partially depleted field. E&Ps have also mentioned geological
similarities between Silo and southeastern Wyoming / northeastern Colorado, but at this early stage, we would
exercise caution in drawing parallels with Silo to more recently developed fields, as it seems somewhat unique.
About one-third of Silo’s horizontal wells sustained 100-300 bo/d production rates for over two years, compared
with 100-200 bo/d rates sustained for six months to a year for the best oil-weighted modern horizontal wells in
the Niobrara play, most of which are EOG’s at Hereford Ranch.
0
10,000
20,000
30,000
40,000
50,000
60,000
70,000
80,000
90,000
100,000
bb
l o
f o
il
First Year Cumulative Oil Production: Silo Field Seems Unique
Silo Niobrara (Ex-Silo) EOG CHK (Spillman Draw Deep)
Source: IHS
Copyright 2011 IHS Herold Inc. Herold Regional Play Assessment 4
Source: IHS
Southern DJ & North Park Basin Niobrara Completions with 2nd Month Average Oil Production
Copyright 2011 IHS Herold Inc. Herold Regional Play Assessment 5
EOG’s early success at Hereford Ranch late in 2009 likely spurred a nearby land grab by E&Ps, including Carrizo
Oil and Gas (CRZO), REXX, Continental Resources (CLR), Whiting Petroleum (WLL) and QEP Resources (QEP).
Continental already has experience developing the Niobrara at the Silo field, and will be drilling the play’s first
long lateral on 1,280-acre spacing as it transfers its knowledge as one of the Bakken’s most efficient operators
to the Niobrara in northeast Colorado. Notwithstanding what appears to be a lengthening trend of variability in
well performance at Hereford Ranch based on recent one-month average IP rates (see page 2, chart), EOG
recently expressed increasing confidence about the possibility of matrix porosity contributing to production.
EOG is experimenting with restricted choke sizes to enhance EUR (Elsie 7- 34H and Critter Creek 13-17H),
which could make early-month IP rates even less meaningful, and future decline rates and EUR more relevant,
to valuation.
Noble, another premier Rockies operator, is focusing on its Wattenberg leasehold (see page 5, sky blue well
spots), and suggested possible matrix contributions based on the few modern wells it has drilled north of
Wattenberg. Potential contribution from matrix porosity would increase reserves per well and expand the play
beyond naturally fractured fields and convert it into a true resource play. However, widespread matrix
contribution is far from proven, despite some early optimism in the industry.
EOG is also responsible for the only horizontally developed Niobrara oil field to date west of the Front Range,
developed in 2007-2008, in the North Park Basin in northwestern Colorado, where the Niobrara is also naturally
fractured and situated at approximately 7,000 feet. We would imagine such fields to be somewhat unique,
considering the geological complexity of the region.
About 12 miles to the southeast of Chugwater, Wyoming, is EOG’s next region of Niobrara exploration, dubbed Silvertip. This is in the northern DJ Basin (north of Silo), where the northern border of Laramie County meets the southern border of Wyoming’s Platte and Goshen counties. Results of EOG’s first well, Silvertip 5-34H in Goshen County, are highly anticipated, as EOG has been actively permitting and drilling in the area. In this
region, logs indicate the Niobrara’s depth is similar to that at Silo.
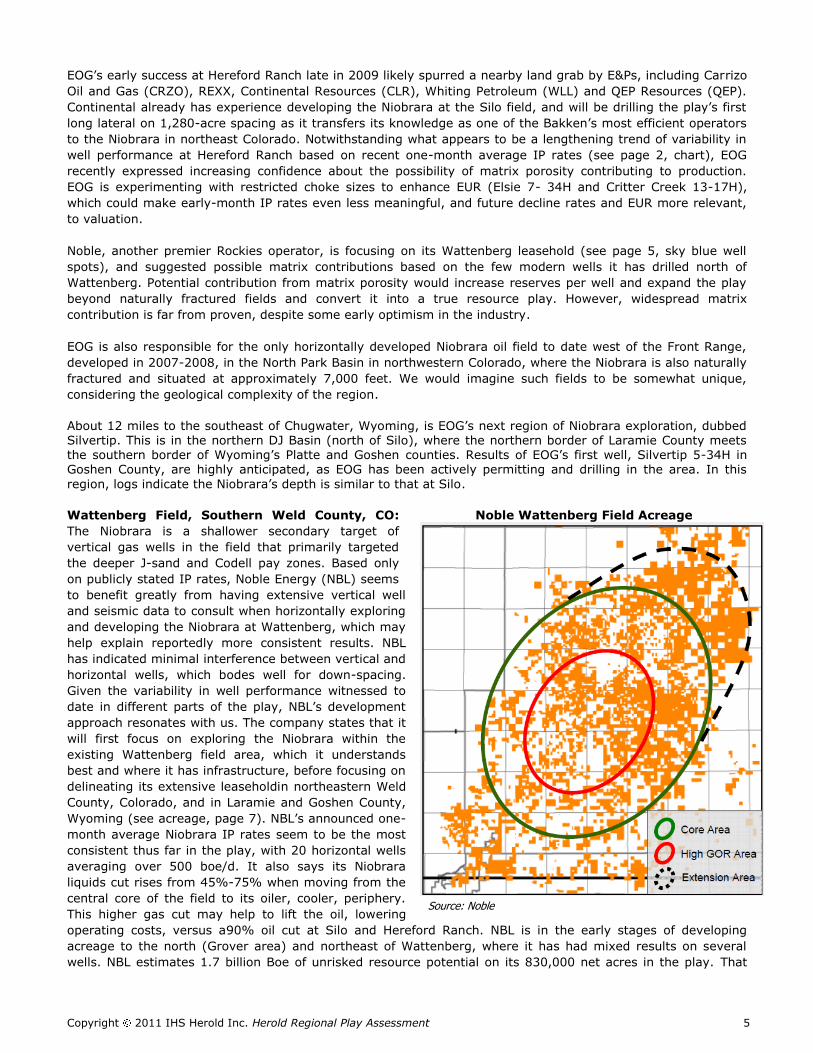
Wattenberg Field, Southern Weld County, CO:
The Niobrara is a shallower secondary target of
vertical gas wells in the field that primarily targeted
the deeper J-sand and Codell pay zones. Based only
on publicly stated IP rates, Noble Energy (NBL) seems
to benefit greatly from having extensive vertical well
and seismic data to consult when horizontally exploring
and developing the Niobrara at Wattenberg, which may
help explain reportedly more consistent results. NBL
has indicated minimal interference between vertical and
horizontal wells, which bodes well for down-spacing.
Given the variability in well performance witnessed to
date in different parts of the play, NBL’s development
approach resonates with us. The company states that it
will first focus on exploring the Niobrara within the
existing Wattenberg field area, which it understands
best and where it has infrastructure, before focusing on
delineating its extensive leaseholdin northeastern Weld
County, Colorado, and in Laramie and Goshen County,
Wyoming (see acreage, page 7). NBL’s announced one-
month average Niobrara IP rates seem to be the most
consistent thus far in the play, with 20 horizontal wells
averaging over 500 boe/d. It also says its Niobrara
liquids cut rises from 45%-75% when moving from the
central core of the field to its oiler, cooler, periphery.
This higher gas cut may help to lift the oil, lowering
operating costs, versus a90% oil cut at Silo and Hereford Ranch. NBL is in the early stages of developing
acreage to the north (Grover area) and northeast of Wattenberg, where it has had mixed results on several
wells. NBL estimates 1.7 billion Boe of unrisked resource potential on its 830,000 net acres in the play. That
Noble Wattenberg Field Acreage
Source: Noble
Copyright 2011 IHS Herold Inc. Herold Regional Play Assessment 6
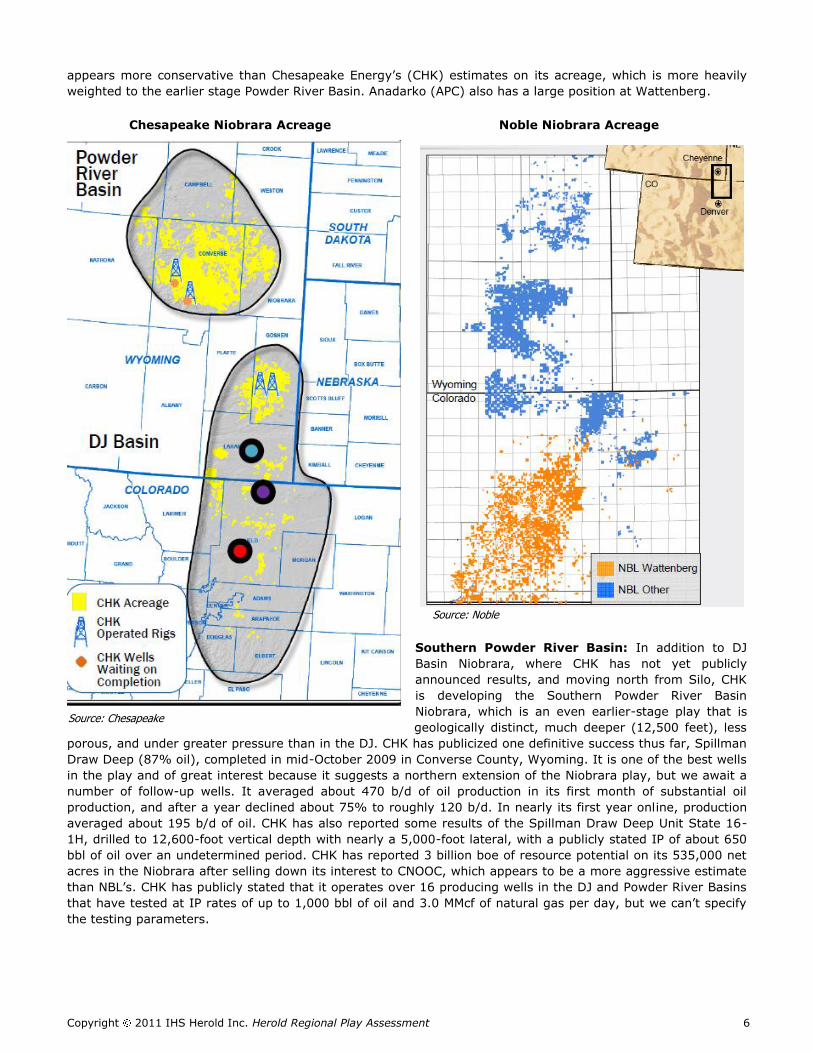
appears more conservative than Chesapeake Energy’s (CHK) estimates on its acreage, which is more heavily
weighted to the earlier stage Powder River Basin. Anadarko (APC) also has a large position at Wattenberg.
Southern Powder River Basin: In addition to DJ
Basin Niobrara, where CHK has not yet publicly
announced results, and moving north from Silo, CHK
is developing the Southern Powder River Basin
Niobrara, which is an even earlier-stage play that is
geologically distinct, much deeper (12,500 feet), less
porous, and under greater pressure than in the DJ. CHK has publicized one definitive success thus far, Spillman
Draw Deep (87% oil), completed in mid-October 2009 in Converse County, Wyoming. It is one of the best wells
in the play and of great interest because it suggests a northern extension of the Niobrara play, but we await a
number of follow-up wells. It averaged about 470 b/d of oil production in its first month of substantial oil
production, and after a year declined about 75% to roughly 120 b/d. In nearly its first year online, production
averaged about 195 b/d of oil. CHK has also reported some results of the Spillman Draw Deep Unit State 16-
1H, drilled to 12,600-foot vertical depth with nearly a 5,000-foot lateral, with a publicly stated IP of about 650
bbl of oil over an undetermined period. CHK has reported 3 billion boe of resource potential on its 535,000 net
acres in the Niobrara after selling down its interest to CNOOC, which appears to be a more aggressive estimate
than NBL’s. CHK has publicly stated that it operates over 16 producing wells in the DJ and Powder River Basins
that have tested at IP rates of up to 1,000 bbl of oil and 3.0 MMcf of natural gas per day, but we can’t specify
the testing parameters.
Chesapeake Niobrara Acreage Noble Niobrara Acreage
Source: Noble
Source: Chesapeake
Copyright 2011 IHS Herold Inc. Herold Regional Play Assessment 7
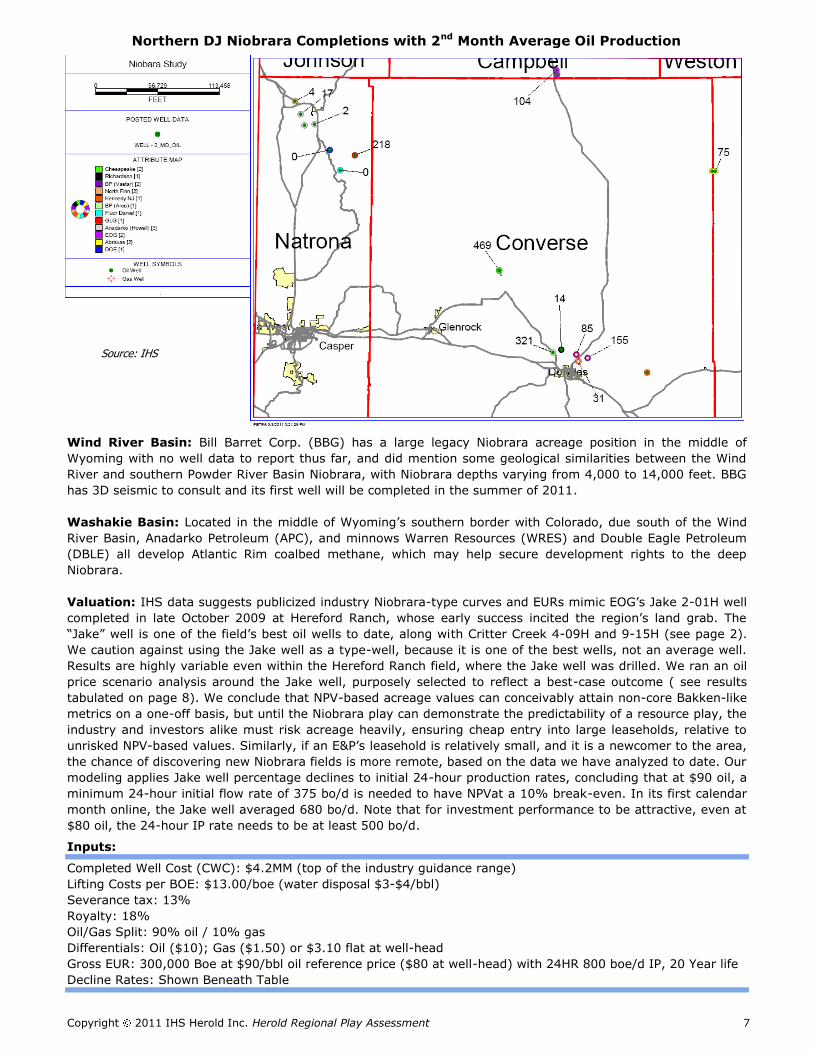
Wind River Basin: Bill Barret Corp. (BBG) has a large legacy Niobrara acreage position in the middle of
Wyoming with no well data to report thus far, and did mention some geological similarities between the Wind
River and southern Powder River Basin Niobrara, with Niobrara depths varying from 4,000 to 14,000 feet. BBG
has 3D seismic to consult and its first well will be completed in the summer of 2011.
Washakie Basin: Located in the middle of Wyoming’s southern border with Colorado, due south of the Wind
River Basin, Anadarko Petroleum (APC), and minnows Warren Resources (WRES) and Double Eagle Petroleum
(DBLE) all develop Atlantic Rim coalbed methane, which may help secure development rights to the deep
Niobrara.
Valuation: IHS data suggests publicized industry Niobrara-type curves and EURs mimic EOG’s Jake 2-01H well
completed in late October 2009 at Hereford Ranch, whose early success incited the region’s land grab. The
“Jake” well is one of the field’s best oil wells to date, along with Critter Creek 4-09H and 9-15H (see page 2).
We caution against using the Jake well as a type-well, because it is one of the best wells, not an average well.
Results are highly variable even within the Hereford Ranch field, where the Jake well was drilled. We ran an oil
price scenario analysis around the Jake well, purposely selected to reflect a best-case outcome ( see results
tabulated on page 8). We conclude that NPV-based acreage values can conceivably attain non-core Bakken-like
metrics on a one-off basis, but until the Niobrara play can demonstrate the predictability of a resource play, the
industry and investors alike must risk acreage heavily, ensuring cheap entry into large leaseholds, relative to
unrisked NPV-based values. Similarly, if an E&P’s leasehold is relatively small, and it is a newcomer to the area,
the chance of discovering new Niobrara fields is more remote, based on the data we have analyzed to date. Our
modeling applies Jake well percentage declines to initial 24-hour production rates, concluding that at $90 oil, a
minimum 24-hour initial flow rate of 375 bo/d is needed to have NPVat a 10% break-even. In its first calendar
month online, the Jake well averaged 680 bo/d. Note that for investment performance to be attractive, even at
$80 oil, the 24-hour IP rate needs to be at least 500 bo/d. Inputs: Completed Well Cost (CWC): $4.2MM (top of the industry guidance range)
Lifting Costs per BOE: $13.00/boe (water disposal $3-$4/bbl)
Severance tax: 13%
Royalty: 18%
Oil/Gas Split: 90% oil / 10% gas
Differentials: Oil ($10); Gas ($1.50) or $3.10 flat at well-head
Gross EUR: 300,000 Boe at $90/bbl oil reference price ($80 at well-head) with 24HR 800 boe/d IP, 20 Year life
Decline Rates: Shown Beneath Table
Source: IHS
Northern DJ Niobrara Completions with 2nd Month Average Oil Production
Copyright 2011 IHS Herold Inc. Herold Regional Play Assessment 8
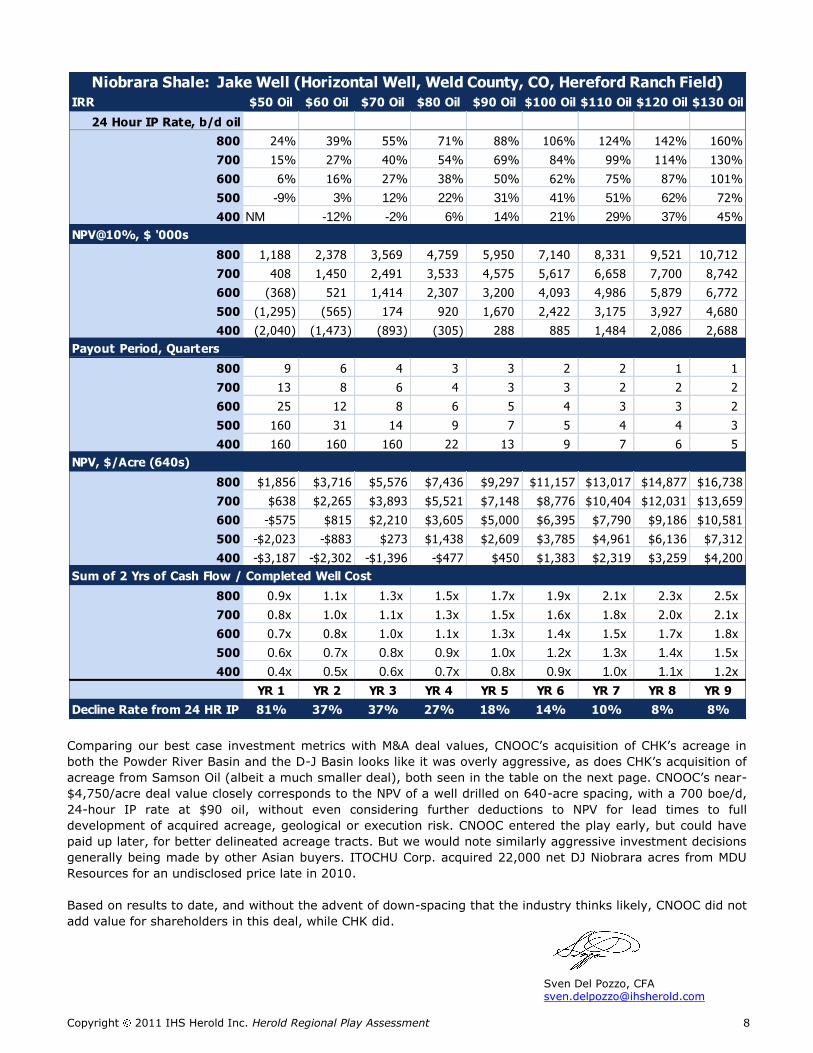
Comparing our best case investment metrics with M&A deal values, CNOOC’s acquisition of CHK’s acreage in
both the Powder River Basin and the D-J Basin looks like it was overly aggressive, as does CHK’s acquisition of
acreage from Samson Oil (albeit a much smaller deal), both seen in the table on the next page. CNOOC’s near-
$4,750/acre deal value closely corresponds to the NPV of a well drilled on 640-acre spacing, with a 700 boe/d,
24-hour IP rate at $90 oil, without even considering further deductions to NPV for lead times to full
development of acquired acreage, geological or execution risk. CNOOC entered the play early, but could have
paid up later, for better delineated acreage tracts. But we would note similarly aggressive investment decisions
generally being made by other Asian buyers. ITOCHU Corp. acquired 22,000 net DJ Niobrara acres from MDU
Resources for an undisclosed price late in 2010.
Based on results to date, and without the advent of down-spacing that the industry thinks likely, CNOOC did not
add value for shareholders in this deal, while CHK did.
Sven Del Pozzo, CFA [email protected]
IRR $50 Oil $60 Oil $70 Oil $80 Oil $90 Oil $100 Oil $110 Oil $120 Oil $130 Oil
24 Hour IP Rate, b/d oil
800 24% 39% 55% 71% 88% 106% 124% 142% 160%
700 15% 27% 40% 54% 69% 84% 99% 114% 130%
600 6% 16% 27% 38% 50% 62% 75% 87% 101%
500 -9% 3% 12% 22% 31% 41% 51% 62% 72%
400 NM -12% -2% 6% 14% 21% 29% 37% 45%
NPV@10%, $ '000s
800 1,188 2,378 3,569 4,759 5,950 7,140 8,331 9,521 10,712
700 408 1,450 2,491 3,533 4,575 5,617 6,658 7,700 8,742
600 (368) 521 1,414 2,307 3,200 4,093 4,986 5,879 6,772
500 (1,295) (565) 174 920 1,670 2,422 3,175 3,927 4,680
400 (2,040) (1,473) (893) (305) 288 885 1,484 2,086 2,688
Payout Period, Quarters
800 9 6 4 3 3 2 2 1 1
700 13 8 6 4 3 3 2 2 2
600 25 12 8 6 5 4 3 3 2
500 160 31 14 9 7 5 4 4 3
400 160 160 160 22 13 9 7 6 5
NPV, $/Acre (640s)
800 $1,856 $3,716 $5,576 $7,436 $9,297 $11,157 $13,017 $14,877 $16,738
700 $638 $2,265 $3,893 $5,521 $7,148 $8,776 $10,404 $12,031 $13,659
600 -$575 $815 $2,210 $3,605 $5,000 $6,395 $7,790 $9,186 $10,581
500 -$2,023 -$883 $273 $1,438 $2,609 $3,785 $4,961 $6,136 $7,312
400 -$3,187 -$2,302 -$1,396 -$477 $450 $1,383 $2,319 $3,259 $4,200
Sum of 2 Yrs of Cash Flow / Completed Well Cost
800 0.9x 1.1x 1.3x 1.5x 1.7x 1.9x 2.1x 2.3x 2.5x
700 0.8x 1.0x 1.1x 1.3x 1.5x 1.6x 1.8x 2.0x 2.1x
600 0.7x 0.8x 1.0x 1.1x 1.3x 1.4x 1.5x 1.7x 1.8x
500 0.6x 0.7x 0.8x 0.9x 1.0x 1.2x 1.3x 1.4x 1.5x
400 0.4x 0.5x 0.6x 0.7x 0.8x 0.9x 1.0x 1.1x 1.2x
YR 1 YR 2 YR 3 YR 4 YR 5 YR 6 YR 7 YR 8 YR 9
Decline Rate from 24 HR IP 81% 37% 37% 27% 18% 14% 10% 8% 8%
Niobrara Shale: Jake Well (Horizontal Well, Weld County, CO, Hereford Ranch Field)
Copyright 2011 IHS Herold Inc. Herold Regional Play Assessment 9
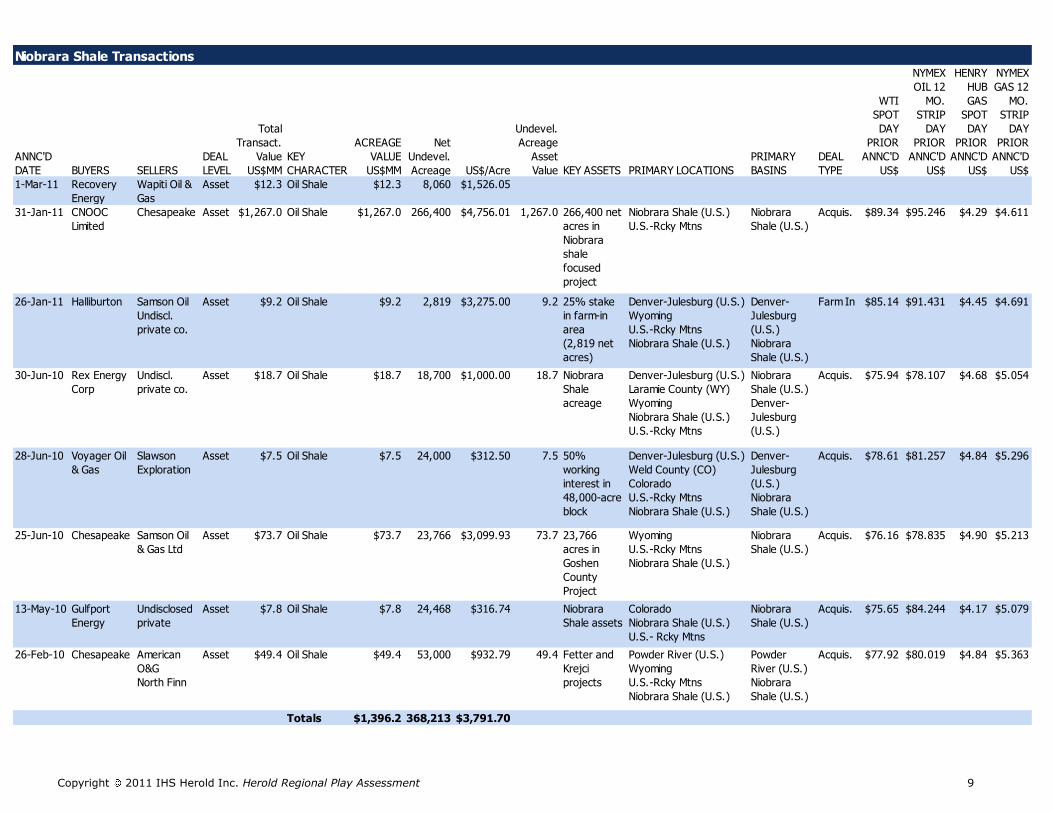
Niobrara Shale Transactions
ANNC'D
DATE BUYERS SELLERS
DEAL
LEVEL
Total
Transact.
Value
US$MM
KEY
CHARACTER
ACREAGE
VALUE
US$MM
Net
Undevel.
Acreage US$/Acre
Undevel.
Acreage
Asset
Value KEY ASSETS PRIMARY LOCATIONS
PRIMARY
BASINS
DEAL
TYPE
WTI
SPOT
DAY
PRIOR
ANNC'D
US$
NYMEX
OIL 12
MO.
STRIP
DAY
PRIOR
ANNC'D
US$
HENRY
HUB
GAS
SPOT
DAY
PRIOR
ANNC'D
US$
NYMEX
GAS 12
MO.
STRIP
DAY
PRIOR
ANNC'D
US$
1-Mar-11 Recovery
Energy
Wapiti Oil &
Gas
Asset $12.3 Oil Shale $12.3 8,060 $1,526.05
31-Jan-11 CNOOC
Limited
Chesapeake Asset $1,267.0 Oil Shale $1,267.0 266,400 $4,756.01 1,267.0 266,400 net
acres in
Niobrara
shale
focused
project
Niobrara Shale (U.S.)
U.S.-Rcky Mtns
Niobrara
Shale (U.S.)
Acquis. $89.34 $95.246 $4.29 $4.611
26-Jan-11 Halliburton Samson Oil
Undiscl.
private co.
Asset $9.2 Oil Shale $9.2 2,819 $3,275.00 9.2 25% stake
in farm-in
area
(2,819 net
acres)
Denver-Julesburg (U.S.)
Wyoming
U.S.-Rcky Mtns
Niobrara Shale (U.S.)
Denver-
Julesburg
(U.S.)
Niobrara
Shale (U.S.)
Farm In $85.14 $91.431 $4.45 $4.691
30-Jun-10 Rex Energy
Corp
Undiscl.
private co.
Asset $18.7 Oil Shale $18.7 18,700 $1,000.00 18.7 Niobrara
Shale
acreage
Denver-Julesburg (U.S.)
Laramie County (WY)
Wyoming
Niobrara Shale (U.S.)
U.S.-Rcky Mtns
Niobrara
Shale (U.S.)
Denver-
Julesburg
(U.S.)
Acquis. $75.94 $78.107 $4.68 $5.054
28-Jun-10 Voyager Oil
& Gas
Slawson
Exploration
Asset $7.5 Oil Shale $7.5 24,000 $312.50 7.5 50%
working
interest in
48,000-acre
block
Denver-Julesburg (U.S.)
Weld County (CO)
Colorado
U.S.-Rcky Mtns
Niobrara Shale (U.S.)
Denver-
Julesburg
(U.S.)
Niobrara
Shale (U.S.)
Acquis. $78.61 $81.257 $4.84 $5.296
25-Jun-10 Chesapeake Samson Oil
& Gas Ltd
Asset $73.7 Oil Shale $73.7 23,766 $3,099.93 73.7 23,766
acres in
Goshen
County
Project
Wyoming
U.S.-Rcky Mtns
Niobrara Shale (U.S.)
Niobrara
Shale (U.S.)
Acquis. $76.16 $78.835 $4.90 $5.213
13-May-10 Gulfport
Energy
Undisclosed
private
Asset $7.8 Oil Shale $7.8 24,468 $316.74 Niobrara
Shale assets
Colorado
Niobrara Shale (U.S.)
U.S.- Rcky Mtns
Niobrara
Shale (U.S.)
Acquis. $75.65 $84.244 $4.17 $5.079
26-Feb-10 Chesapeake American
O&G
North Finn
Asset $49.4 Oil Shale $49.4 53,000 $932.79 49.4 Fetter and
Krejci
projects
Powder River (U.S.)
Wyoming
U.S.-Rcky Mtns
Niobrara Shale (U.S.)
Powder
River (U.S.)
Niobrara
Shale (U.S.)
Acquis. $77.92 $80.019 $4.84 $5.363
Totals $1,396.2 368,213 $3,791.70
Copyright 2011 IHS Herold Inc. Herold Regional Play Assessment 10
0
100
200
300
400
500
EO
G
EO
G
EO
G
EO
G
CH
K
EO
G
EO
G
EO
G
NB
L
EO
G
NB
L
NB
L
EO
G
APC
(K
MG
)
EO
G
East R
es.
EO
G
EC
A
No
rth F
inn
EC
A
EC
A
EC
A
APC
(H
WL)
bb
l/d
First 180 Days Average Oil Production Daily AverageAll Niobrara Horizontals Since '07 w/180 Days History Outside of Silo
0
50
100
150
200
250
300
EO
G
CH
K
EO
G
EO
G
EO
G
EO
G
NB
L
APC
(K
MG
)
EC
A
EC
A
APC
(H
WL)
EC
A
EC
A
EC
A
Ro
sew
ood
EP
EP
bb
l/d
First 365 Days Oil Production Daily AverageAll Niobrara Horizontals Since '07 w/365 Days of History Outside of Silo Field
Source: IHS
Source: IHS
0
100
200
300
400
500
600
700
800
900
EO
G
EO
G
EO
G
EO
G
EO
G
EO
G
EO
G
EO
G
EO
G
NB
L
EO
G
EO
G
CH
K
EO
G
EO
G
EO
G
EO
G
NB
L
NB
L
EO
G
EO
G
EO
G
EO
G
APC
(K
MG
)
EO
G
EO
G
EA
ST R
es.
EC
A
No
rth F
inn
WLL
EC
A
APC
(H
WL)
EC
A
bb
l/d
First 60 Day Daily Avg. Oil ProductionAll Niobrara Horizontals Since '07 w/60 Days of History Outside of Silo
Source: IHS
Copyright 2011 IHS Herold Inc. Herold Regional Play Assessment 11
0
100
200
300
400
500
600
2 Mo. 3 Mo. 4 Mo. 5 Mo. 6 Mo. 7 Mo. 8 Mo. 9 Mo. 10 Mo. 11 Mo. 12 Mo. 13 Mo. 14 Mo. 15 Mo. 16 Mo. 17 Mo.
bb
l/d
ay o
nlin
e
Daily Oil Production: Only a Handful of Outstanding Modern Niobrara Oil Wells
0
50,000
100,000
150,000
200,000
250,000
300,000
350,000
0 100 200 300 400 500 600 700 800 900 1000
4 Y
ea
r C
um
ula
tive
Pro
du
cti
on
, bb
l of O
il
Monthly Average IP Rate, bbl of Oil
Silo Field-80 Horizontals - Early IP Rates Mean Little to Reserves
Source: IHS
Source: IHS
Copyright 2011 IHS Herold Inc. Herold Regional Play Assessment 12
0
100,000
200,000
300,000
400,000
500,000
600,000
700,000
0% 20% 40% 60% 80% 100% 120%
Cu
mu
lati
ve
bo
e
% Oil
Niobrara Horiz. Wells-Cumulative BOE vs. % Oil
The analyst that prepared this report has a long position in the securities of Stone Energy Corporation mentioned in this report. This analyst is contractually prohibited from purchasing or selling the securities of this company during the blackout period implemented by IHS Herold for this type of report.
The research analysts who prepared this report certify that the views expressed herein accurately reflect their professional opinions, are consistent with established Herold methodologies and standards and that no part of their compensation was, is or will be directly or indirectly related to specific views contained in this report. Copyright © 2011 IHS Herold Inc. All rights reserved. Herold Regional Play Assessment is published by IHS Herold Inc., 200 Connecticut Avenue, Suite 3A, Norwalk, CT 06854, USA for the exclusive use of IHS Herold clients. Reproduction of this report, even for internal distribution, is strictly prohibited. The information contained herein has been obtained from sources believed to be reliable, but IHS Herold does not guarantee their accuracy or completeness. No information or opinions contained herein constitutes a representation or solicitation for the purchase of any securities of the companies mentioned herein. From time to time, IHS Herold and/or its officers and employees may have long or short positions in the securities mentioned herein or during the past year may have transacted in securities of the companies mentioned.
Source: IHS