Embed Size (px)
Citation preview

1
Niobium-based Semiconductor Electrodes for
Hydrogen Evolution Reaction
Esteban A. Franceschini*a,b, Andrew Hainera, Anabel E. Lanterna*a
aDepartment of Chemistry and Biomolecular Sciences and Centre for Advanced Materials
Research (CAMaR), University of Ottawa, Ottawa, Canada.
bINFIQC, CONICET and Departamento de Físico-Química, Facultad de Ciencias Químicas,
Universidad Nacional de Córdoba, Córdoba, Argentina.
AUTHOR INFORMATION
Corresponding Authors
*A.E.L.: [email protected]
*E.A.F.: [email protected]

2
ABSTRACT. This contribution focusses on the use of Nb-based materials for the preparation of
hybrid nickel-semiconductor electrodes for use in the electrochemical generation of hydrogen. The
Nb-based semiconductors (i.e., Nb2O5 and Nb3(PO4)5) show good performance for the H2
evolution reaction (HER) using a non-toxic electrolyte (K2CO3) under true water-splitting
conditions. In particularly, Nb2O5 shows HER efficiency two-orders-of-magnitude higher than its
TiO2 counterparts. Tafel analysis suggests the HER mechanism is the same for all type of
electrodes studied and electrochemical impedance spectroscopy indicates these hybrid Ni-Nb-
semiconductor electrodes are sensitive to light exposure, unlike TiO2. We propose that the
differences in impedance upon irradiation are due to the band structure of these hybrid electrodes,
which have lower Schottky barrier heights and show smaller work function values.
KEYWORDS. Hybrid-nickel electrodes, niobium oxide, hydrogen evolution reaction, renewable
energy.

3
1. INTRODUCTION
The production of hydrogen as a fuel is an attractive approach to store clean energy from
renewable resources, such as water. One of the main limitations of using water splitting to generate
H2 is that the process is rather inefficient as the simultaneous reduction and oxidation of water is
an uphill reaction involving multiple steps.[1] In order to overcome this problem, sacrificial
electron donors (SED) are often used to improve the efficiency of both photochemical or
photoelectrochemical processes.[2] We have recently demonstrated that, although the use of SED
greatly improve the H2 formation efficiency, this cannot help to determine the efficiency of the
materials towards true water splitting (i.e., H2 formation from water in the absence of SEDs).[3]
Electrochemical splitting of water is a promising technology for production of H2 from renewable
resources and, depending on the electrical source used, under green conditions (no green-house-
gas generation).[4, 5] Platinum electrodes – typically used in acid electrolysers – have excellent
electrocatalytic properties; however, their high price is one of the major disadvantages that
prevents their wide use for this application. In contrast, alkaline electrolysers employing nickel
electrodes are the preferred method for massive production of H2.[6, 7] However, Ni electrodes
present low catalytic activity and experience fast deactivation processes such as formation of
hydroxides, hydrides and other oxygenated species.[8, 9] Different strategies have been developed
in order to enhance the catalytic efficiency of these electrodes; such as increasing electrode surface
–i.e., increase porosity,[10] preparing metal alloys,[11] bifunctional materials, [12] or developing
metal-semiconductor hybrid electrodes –specially using TiO2, which can greatly enhance the HER
efficiencies in electrochemical systems. [13-18] The use of hybrid Ni-semiconductor (Ni-SC) type
of electrodes opens the possibility to use a photo-electrochemical process in addition to
conventional electrochemistry.[19] Thus, the formation of semiconductor-metal heterojunctions is

4
a very promising strategy that can broaden the light harvesting properties, improve chemical
stability, and enhance the photoexcited charge separation of the SC.[20] Moreover, several reports
account for the protective role of TiO2 films on photocathodes, where, in addition to the TiO2 high
stability and good conductivity, the favorable position of the TiO2 conduction band can increase
the HER efficiencies. [21-25]
Here, we select Ni-TiO2 as the reference electrocatalyst and introduce the use of Nb-based SC,
as alternatives to TiO2, to construct hybrid Ni-SC electrodes for generation of H2. Niobium has
been extensively used in the metallurgic industry due to the multiple properties it can incorporate
to the material, such as malleability, ductility, and high resistance to corrosion. More recently, few
reports are based on the use of Nb in Li-ion batteries,[26-29] as it has demonstrated to increase the
materials conductivity properties enhancing performance whereas extending the materials lifetime.
Furthermore, Nb-based semiconductors are also used as photocatalysts for water splitting and fuel
cells [30-36]. Although Nb-based SC have shown similar photocatalytic properties compared to
titania,[37] including good chemical stability and acidity properties,[38] they have different optical
band gap and crystalline structure (vide infra). This can drastically change the properties of the
heterojunctions involving Nb-based semiconductors, giving, for instance, better electronic
interactions.[39, 40] Here we show the preparation of two different hybrid Ni electrodes based on
Nb-SC (i.e., Nb2O5 and Nb3(PO4)5) and explore their reaction mechanism and electrochemical
activity compared to commercial P25 TiO2 under true water splitting conditions (no SED added).
Thus, using an industrially optimized technique to prepare the electrodes,[41, 42] we are able to
obtain reproducible results for the (photo)electrochemical production of H2 in the presence of
potassium carbonate as electrolyte.
2. EXPERIMENTAL
5
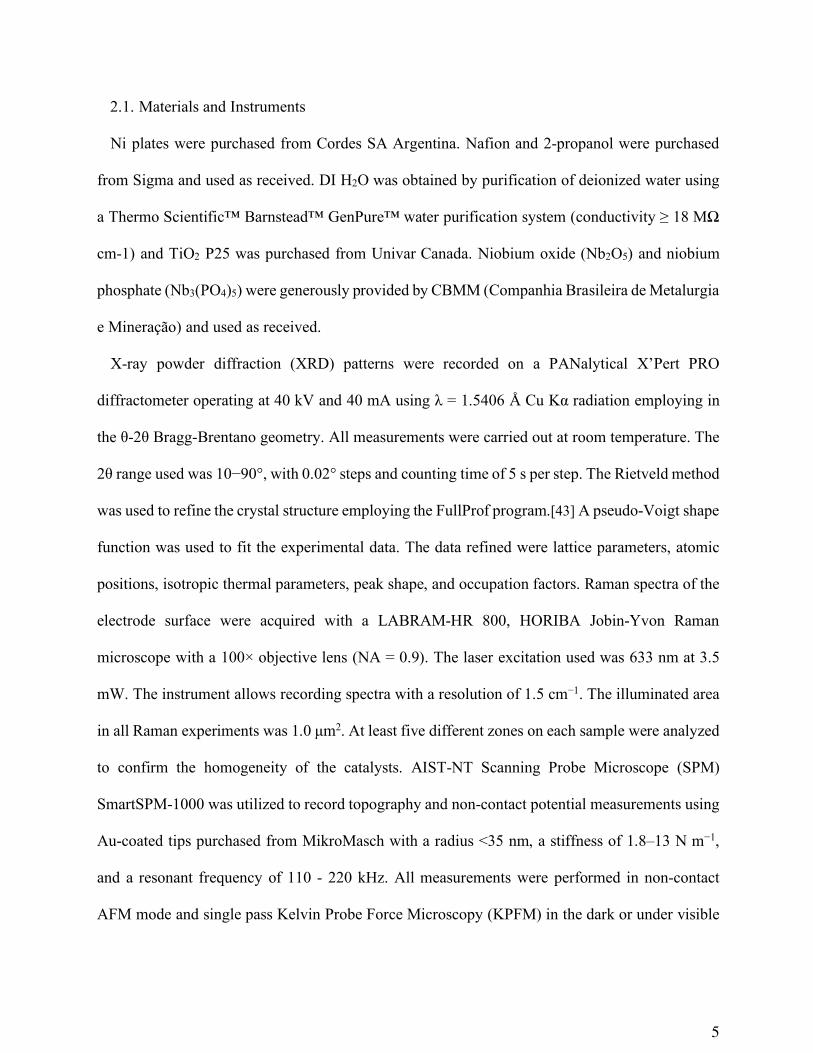
2.1. Materials and Instruments
Ni plates were purchased from Cordes SA Argentina. Nafion and 2-propanol were purchased
from Sigma and used as received. DI H2O was obtained by purification of deionized water using
a Thermo Scientific™ Barnstead™ GenPure™ water purification system (conductivity ≥ 18 MΩ
cm-1) and TiO2 P25 was purchased from Univar Canada. Niobium oxide (Nb2O5) and niobium
phosphate (Nb3(PO4)5) were generously provided by CBMM (Companhia Brasileira de Metalurgia
e Mineração) and used as received.
X-ray powder diffraction (XRD) patterns were recorded on a PANalytical X’Pert PRO
diffractometer operating at 40 kV and 40 mA using λ = 1.5406 Å Cu Kα radiation employing in
the θ-2θ Bragg-Brentano geometry. All measurements were carried out at room temperature. The
2θ range used was 10−90°, with 0.02° steps and counting time of 5 s per step. The Rietveld method
was used to refine the crystal structure employing the FullProf program.[43] A pseudo-Voigt shape
function was used to fit the experimental data. The data refined were lattice parameters, atomic
positions, isotropic thermal parameters, peak shape, and occupation factors. Raman spectra of the
electrode surface were acquired with a LABRAM-HR 800, HORIBA Jobin-Yvon Raman
microscope with a 100× objective lens (NA = 0.9). The laser excitation used was 633 nm at 3.5
mW. The instrument allows recording spectra with a resolution of 1.5 cm−1. The illuminated area
in all Raman experiments was 1.0 µm2. At least five different zones on each sample were analyzed
to confirm the homogeneity of the catalysts. AIST-NT Scanning Probe Microscope (SPM)
SmartSPM-1000 was utilized to record topography and non-contact potential measurements using
Au-coated tips purchased from MikroMasch with a radius <35 nm, a stiffness of 1.8–13 N m−1,
and a resonant frequency of 110 - 220 kHz. All measurements were performed in non-contact
AFM mode and single pass Kelvin Probe Force Microscopy (KPFM) in the dark or under visible

6
light irradiation. The 5 x 5 µm area of study was scanned at 1 µm s–1. For each scan line, the height
profile was recorded in the first pass and then the tip was lifted 10 nm away from the surface and
the potential offset was measured. Scanning electron microscopy (SEM) images were obtained
using a JEOL JSM-1600 SE microscope working at an accelerating voltage of 2 kV.
Electrochemical measurements were carried out using the Parstat 2273 advanced electrochemical
system in a conventional three-electrode electrochemical cell. A Pt wire was used as counter
electrode and saturated calomel electrode (SCE) as reference electrode (0.243 V vs. RHE).
2.2. Preparation of materials
2.2.1. Preparation of the electrodes
The electrodes were prepared by the painting method.[42] In brief, the standard Nafion-based
inks were prepared by mixing 5 mg of the semiconductor catalysts – unless otherwise stated – with
30 mg of DI H2O, 300 mg of 2-propanol and 15 mg of a 5 wt% Nafion solution; and sonicated for
30 min. Subsequently, 350 µL aliquots of the inks were pipetted onto a square-shaped Ni electrode
of ~1 cm2 (surface previously polished with #600 sandpaper) and air-dried at room temperature
for 2 h. The Ni-SC electrodes were electrochemically tested in a conventional three-electrodes
electrochemical cell as is showed in Figure 1.
7
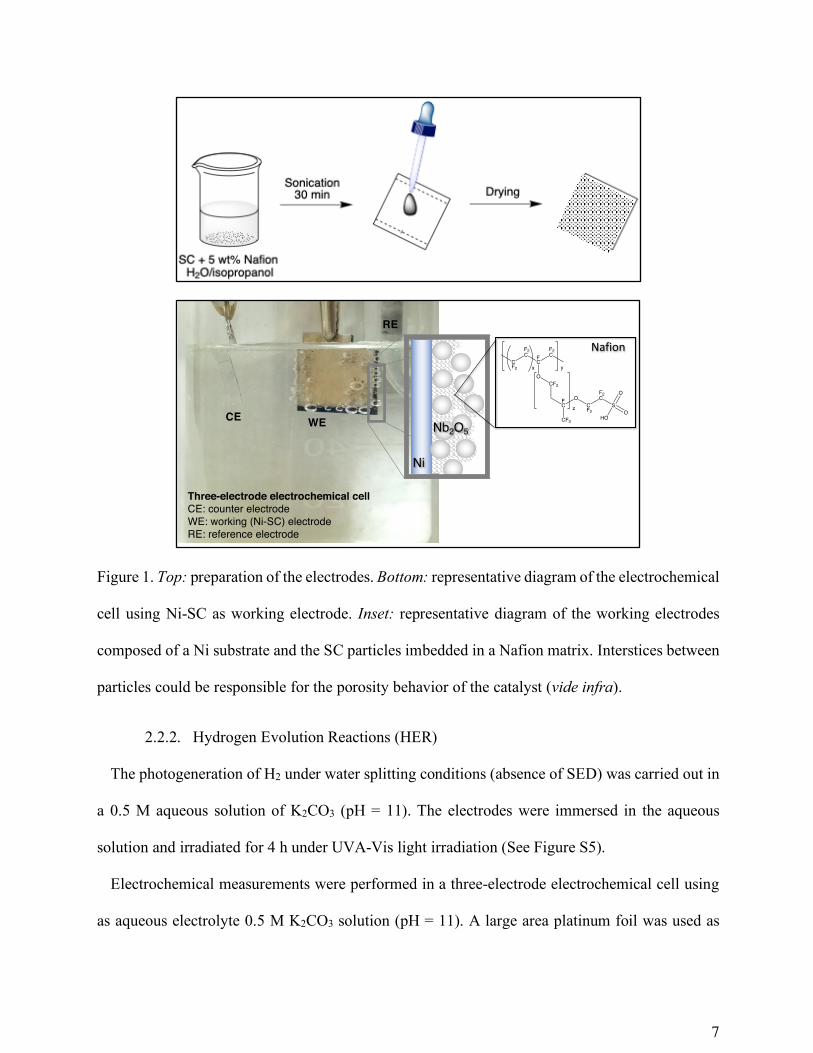
Figure 1. Top: preparation of the electrodes. Bottom: representative diagram of the electrochemical
cell using Ni-SC as working electrode. Inset: representative diagram of the working electrodes
composed of a Ni substrate and the SC particles imbedded in a Nafion matrix. Interstices between
particles could be responsible for the porosity behavior of the catalyst (vide infra).
2.2.2. Hydrogen Evolution Reactions (HER)
The photogeneration of H2 under water splitting conditions (absence of SED) was carried out in
a 0.5 M aqueous solution of K2CO3 (pH = 11). The electrodes were immersed in the aqueous
solution and irradiated for 4 h under UVA-Vis light irradiation (See Figure S5).
Electrochemical measurements were performed in a three-electrode electrochemical cell using
as aqueous electrolyte 0.5 M K2CO3 solution (pH = 11). A large area platinum foil was used as
Ni
Nb2O5
Three-electrode electrochemical cellCE: counter electrodeWE: working (Ni-SC) electrodeRE: reference electrode
WECE
RE
CF2
F2C F
C
F2C
OCF2
FC
CF3
OCF2
F2C
S
O
HOO
yx
z
Nafion

8
counter electrode and a saturated calomel electrode (SCE) as reference electrode (0.243 V vs.
RHE). The system was place inside of a homemade-photoreactor setup (Figure S6) in order to
perform photoelectrochemical measurements. The electrochemical experiments were carried out
employing a Parstat 2273 potentiostat/galvanostat with a FRA2 module.
2.2.3. Cyclic voltammetry
Cyclic voltammograms (CVs) of all catalysts were recorded between -1.5 V and 0.1 V (vs. SCE)
at a scan rate of 5 mV/s until stabilization. The CVs were performed in the dark and under UVA-
Vis light irradiation. The CVs were used to construct Tafel curves and get mechanistic information
of HER using the three different electrodes and under different conditions. The onset potential
(OP) is determined as the potential at which current starts to increase, indicating the starting point
of a process –i.e., H2 generation.
2.2.4. Open Circuit Potential (OCP).
Measurements were performed using a pre-built method consisting on applying a close-to-zero
current and measure the potential transient with time in the same three electrodes configuration.
The OCP experiments were performed in the dark and under UVA, Vis, or a combination of UVA
and Vis light irradiation.
2.2.5. Electrochemical Impedance Spectroscopy (EIS).
EIS experiments were performed at frequencies between 10 mHz and 200 kHz using a 10 mV
bias potential at different electrode potentials: Ni open-circuit potential (OCP, -0.36 V), HER onset
potential over pure Ni (OP, -1.1 V),[44] -1.2 V, and -1.4 V (vs SCE) in order to cover the potential
range where the HER occurs.[43] The ZView 3.3 software (Scribner Associates, Inc.) was used to
fit the measured data with different equivalent circuit models.
3. RESULTS AND DISCUSSION

9
3.1. Characterization of the semiconductors (SC)
Hybrid Ni electrodes based on SC are explored for Nb2O5 and Nb3(PO4)5, and their catalytic
activities are compared to P25 TiO2. Before preparation of the electrodes, we characterize the SC
used by means of UV-Vis diffuse reflectance (DR) spectroscopy and Raman spectroscopy, XRD,
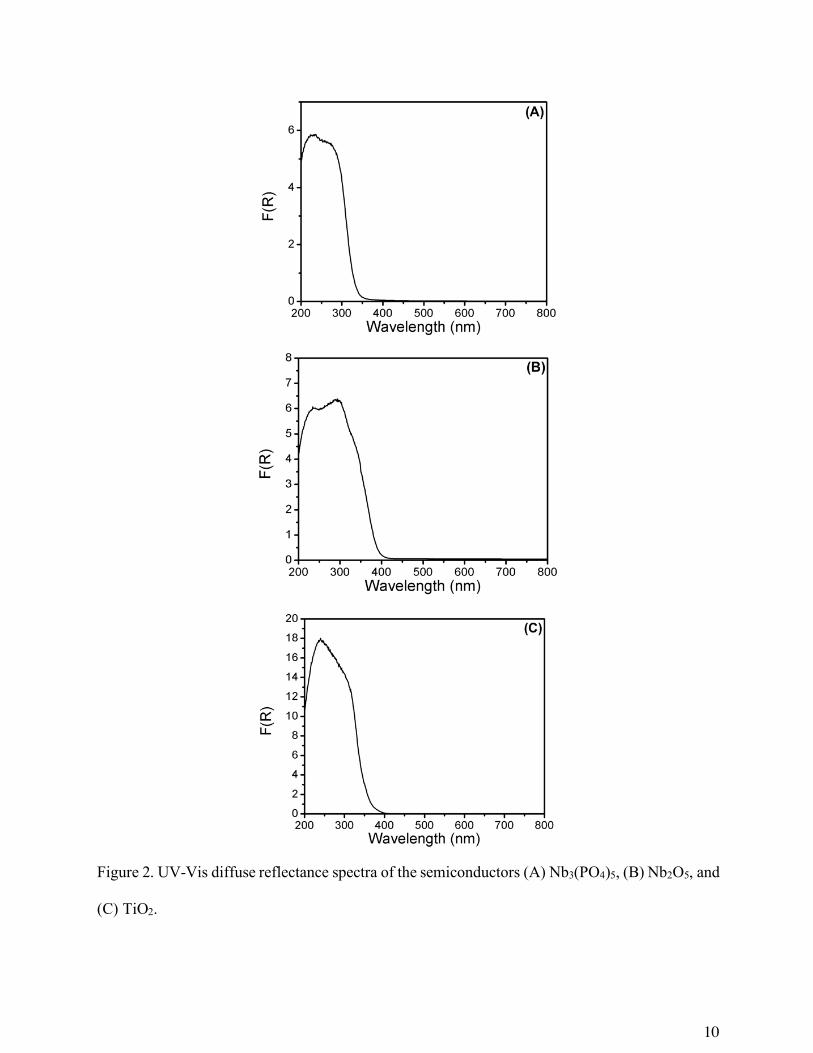
and SEM. DR spectra (Figure 2) show the absorption profile of the SC and are used to estimate
their optical band gap (OBG) shown in Table 1. Briefly, Tauc plots are generated from Figure 2
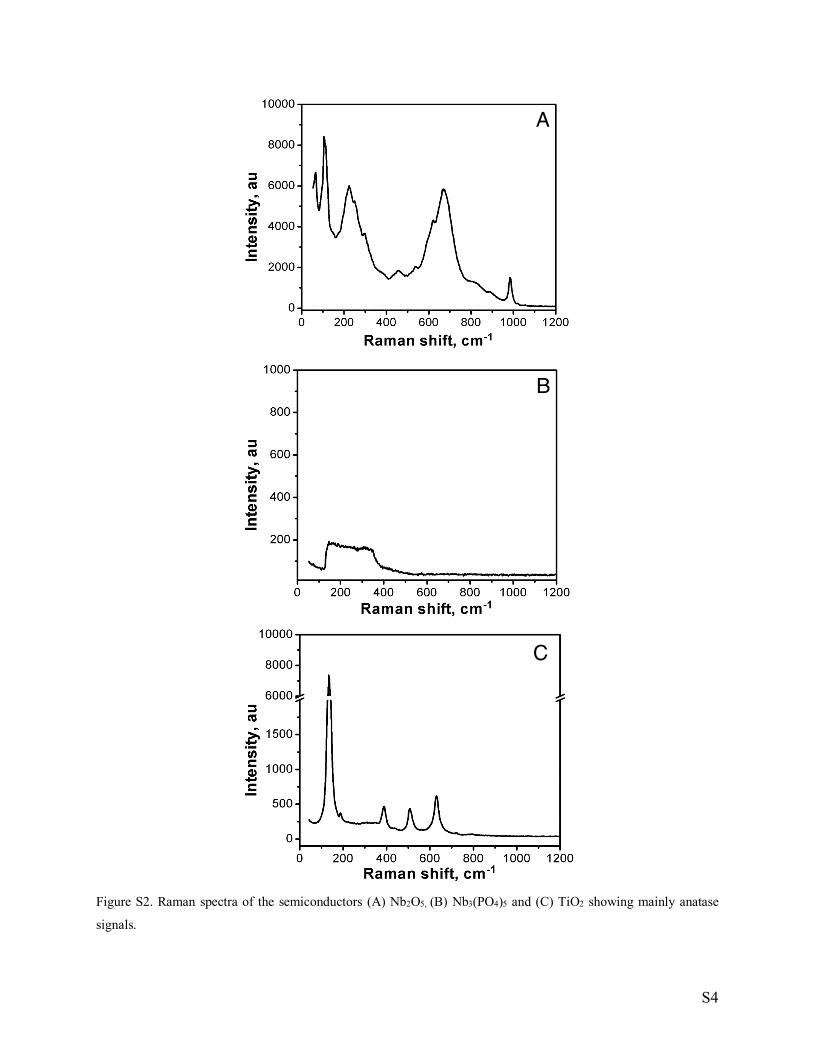
and the OBG is obtained by linear extrapolations as shown in Figure S1[46]. Raman spectra
(Figure S2) show the characteristic peaks for Nb2O5[45] and TiO2 anatase form[46], whilst no
signals are detected for Nb3(PO4)5. Specifically, for Nb2O5 the Raman spectrum (Figure S2A) has
peaks between 80 – 300 cm-1 attributed to bending modes of Nb–O–Nb linkages as well as to the
vibrations of the NbO6 octahedra in Nb2O5.[45]. Additionally, Raman signals located in the region
between 400 – 800 cm-1 are usually assigned to the symmetric and antisymmetric stretching mode
of the Nb-O-Nb group. Similarly, TiO2 Raman spectrum (Figure S2C) shows signals located at
190, 390, 512 and 636 cm−1 typically assigned to the anatase phase [13, 47, 48].
The XRD analyses (Figure S3) of the materials show Nb2O5 as a mixture of monoclinic and
orthorhombic crystalline structures, TiO2 P25 as a mixture of anatase and rutile, whereas
Nb3(PO4)5 is in its amorphous form. All diffraction parameters are summarized in Table S1.
Especially, we observe the Nb2O5 crystal size — calculated using the Scherrer equation — is
bigger than in TiO2, which agrees with the particle size observed by SEM (vide infra).
Lastly, SEM imaging (Figure S4) shows that all semiconductors used have granular structure
and, particularly, both Nb-based SC particle sizes are within the micrometer scale; thus, several
orders of magnitude bigger than TiO2 P25 particle size. Different particle sizes are directly related
to the electrode porosity and exposed area.
10
Figure 2. UV-Vis diffuse reflectance spectra of the semiconductors (A) Nb3(PO4)5, (B) Nb2O5, and
(C) TiO2.

11
3.2. Hydrogen Evolution Reaction (HER)
Using the SC described above, we prepare the electrodes as described in section 2.2.1 by means
of a painting method previously reported.[42] Figure 1 shows a graphic representation of the
obtained electrodes. The selection of Nafion –a sulfonated-tetrafluoroethylene-based
fluoropolymer-copolymer– for the preparation of the electrodes is based on its excellent thermal
and mechanical stability as well as its proton conduction properties.[49] After the electrodes
preparation, we carry out a series of electrochemical measurements in order to establish the
thermodynamic parameters that affect the mechanism of the hydrogen evolution reaction (HER)
during water splitting. Thus, we first analyzed the cyclic voltammograms (CV) for the Ni electrode
before and after modification with the SC (Figure 3) in the dark and under a combination of UV-
vis light irradiation conditions (Figure S5) using the instrument setup shown in Figure S6. It is
important to highlight, that the HER at the Ni electrode is not affected by the presence of Nafion,
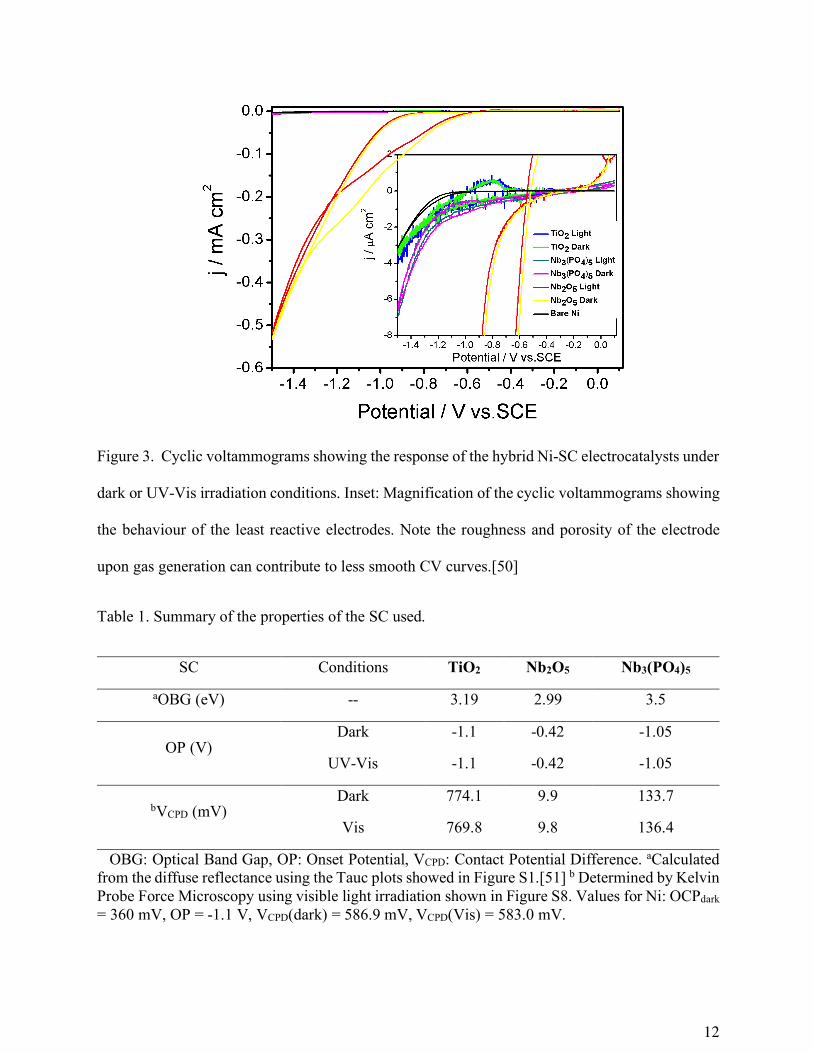
according to our control experiments. Notably, Ni-Nb2O5 catalyst presents a great decrease of the
onset potential (OP) –ca. -0.42 V vs SCE– compared to those found in the bare Ni (ca. -1.1 V vs
SCE[9]), Ni-TiO2 or Ni-Nb3(PO4)5 catalysts (Table 1). These results indicate the HER is greatly
favored by the Ni/Nb2O5 heterojunction. This is further supported by the values of current density
(j) obtained at -1.5 V (vs SCE), where j increases as follows: Ni < Ni-TiO2 < Ni-Nb3(PO4)5 << Ni-
Nb2O5 (Table 2). In general, Nb-based semiconductors (Nb2O5 and Nb3(PO4)5) perform better than
TiO2; with Ni-Nb2O5 system showing a two-order-of-magnitude enhancement in the HER
compared to its TiO2 or Nb3(PO4)5 counterparts.
12
Figure 3. Cyclic voltammograms showing the response of the hybrid Ni-SC electrocatalysts under
dark or UV-Vis irradiation conditions. Inset: Magnification of the cyclic voltammograms showing
the behaviour of the least reactive electrodes. Note the roughness and porosity of the electrode
upon gas generation can contribute to less smooth CV curves.[50]
Table 1. Summary of the properties of the SC used.
SC Conditions TiO2 Nb2O5 Nb3(PO4)5
aOBG (eV) -- 3.19 2.99 3.5
OP (V) Dark -1.1 -0.42 -1.05
UV-Vis -1.1 -0.42 -1.05
bVCPD (mV) Dark 774.1 9.9 133.7
Vis 769.8 9.8 136.4
OBG: Optical Band Gap, OP: Onset Potential, VCPD: Contact Potential Difference. aCalculated from the diffuse reflectance using the Tauc plots showed in Figure S1.[51] b Determined by Kelvin Probe Force Microscopy using visible light irradiation shown in Figure S8. Values for Ni: OCPdark = 360 mV, OP = -1.1 V, VCPD(dark) = 586.9 mV, VCPD(Vis) = 583.0 mV.

13
Table 2. Electrochemical and photoelectrochemical hydrogen generation using hybrid Ni-SC
electrocatalysts.
SC j (µA) aH2 (µmol g-1 h-1)
Dark UV-Vis Dark UV-Vis
TiO2 1.02 1.01 6 6
Nb2O5 520 521 298 299
Nb3(PO4)5 7.02 7.00 40 40
aHER rate (ℑ) calculated as ℑ = 𝑗𝑡/2𝑒𝑚; where j corresponds to the current density, t is time, e is the electron charge (96,485 C) and m is the mass of catalyst.
3.3. Mechanistic studies
3.3.1. Tafel analysis
In order to explore the mechanisms in place we evaluate the Tafel plots obtained for each
electrocatalyst. It is well known that the HER mechanism can involve at least two of the following
steps:
which constitute the activation barrier of the reaction.[52] Therefore, we use the CV presented in
Figure 3 to construct the Tafel plots for each electrocatalyst under different irradiation conditions
and evaluated their slopes (Figure S9). The Tafel slope values are similar to that reported for
conventional Ni electrodes in alkaline medium (-0.13 V dec−1),[9, 53] and are consistent with the
Volmer step reaction as the rate-determining step. This corresponds to 1 electron transfer with a
Ni H2O e– Ni Had HO–+ + + (1)(Volmer Reaction)
kV
k-V
2Ni H2+ (2)(Tafel Reaction)
kT
k-VT2Ni Had
H2O e– Ni HO–+ + + (3)(Heyrovsky Reaction)
kH
k-HH2+Ni Had
14
theoretical Tafel slope of ∼-0.12 V dec −1,[53] indicating that the presence of the different SC
does not affect the reaction mechanism compared to bare Ni electrodes. Additionally, we found no
substantial changes in the values of equilibrium potential (Er) or in the exchange current (j0) in the
dark or under irradiation conditions, as it has been also seen for OP values under different
conditions (Table S1).
3.3.2. Electrochemical Impedance Spectroscopy (EIS)
We perform a series of Electrochemical Impedance Spectroscopy (EIS) measurements under
dark –or under light– conditions, at four different electrode potentials (vs SCE): i) the pure Ni open
circuit potential (OCP) reported as -0.36 V,6 ii) pure Ni HER OP reported as -1.1 V,6 iii) -1.2 V,
and iv) -1.4 V. The potentials selected are the same as those commonly used in pure Ni electrodes,
normally used in alkaline electrolysis.[54, 55] Figure 4 shows the impedance spectra obtained for
each three catalysts under dark –or under light– conditions at -1.2 V. The Ni-Nb2O5 impedance
spectra show two semicircles, describing at least two processes occurring over the surface of the
electrodes, as predicted by the impedance theory for HER. [56, 57] One of the processes occurs at
high frequencies (Figure 4A), corresponding to the capacitive processes occurring at the surface
of the catalyst; and another one at low frequencies, associated with the HER –which clearly
depends on the applied potential (cf. Figure S10). The impedance spectra obtained for Ni-
Nb3(PO4)5 and Ni-TiO2 shows only one semicircle (Figure 4B-C), although the EIS theory
indicates that a second semicircle should be observed. This effect is commonly founded in systems
where the charge transfer resistance (Rct) values are high (Table 3), and the HER kinetics prevails
over other superficial processes.[56] The obtained data are adjusted by two equivalent circuit
models (Scheme S1), the Randles model[57] and the Armstrong & Henderson equivalent circuit
(AHEC), [58, 59] both modified with a constant phase element (CPE) to account for the electrode
15
porosity (Randles-CPE and AHEC1CPE, respectively).[60] The first one describes only one slow
faradaic process, whereas the second model adjusts the HER to two processes –the high frequency
semicircle related to the porosity, and the low-frequency semicircle related to the charge-transfer
process.[13] Figure 4 shows both models fit the experimental data for each electrode obtaining in
all cases fittings with errors less than 1%. Additionally, it can be seeing the porosity of the
electrodes is different in the case of Ni-Nb2O5. Table 3 shows the values corresponding to the
fittings with both models of the data measured at -1.2 V (vs. SCE). Note that all catalysts have
markedly flattened semicircles, indicating high porosity, more likely originated by the interstices
between the SC particles, as suggested in Figure 1. Noticeably, irradiation with UV-Vis light
provokes a considerable decrease in the Rct, particularly under potentials where the HER can take
place (lower than -1.1 V vs. SCE). This confirms that there is a considerable positive effect of the
SC on the catalytic activity of the hybrid Ni-SC electrodes, originated by the modification in the
band structure of the catalysts, affecting the Fermi level of the electrodes and, therefore, the work
function.
3.3.3. Kelvin Prove Force Microscopy (KPFM)
We use Kelvin Prove Force Microscopy (KPFM) to determine the changes in the work function
of the materials. The KPFM technique proves to be an efficient way to determine the work function
values of electrode surfaces by analyzing the contact potential difference (CPD) which is related
to the concentration of electron-hole pairs. In particular, the study of illumination effects on
various kinds of structures show that CPD can reflect the surface band structure of the sample.[61,
62] As it is shown in Table 1, there are large differences between the CPD values found among
the three SC used and compared to bare Ni electrode. The Nb-based catalysts have a much lower
CPD than would be observed in the Ni-TiO2, indicating different work functions for each electrode.

16
This is could explain the differences found in the catalytic activity of the Nb catalysts with respect
to Ni-TiO2.[62]
Figure 4. Electrochemical impedance spectra (EIS) under dark (black) or UV-Vis irradiation (red)
conditions measured at 25 °C and −1.2 V (vs. SCE) adjusted with the equivalent circuit models
AHEC1CPE (left) and Randles-CPE (right). (A) Nb2O5, (B) Nb3(PO4)5, and (C) TiO2.

17
Table 3. AHEC1CPE and Randles-CPE models’ parameters obtained for the HER in 0.5 M K2CO3
at 298 K for each electrode at −1.2 V (vs. SCE).
Ni-SC Ni-TiO2 Ni-Nb3(PO4)5 Ni-Nb2O5
Condition dark light dark light Dark light
AHEC1CPE
Rs 6.515 15.55 28.65 51.73 19.72 13.32
Cdl1 5.53 10-8 4.47 10-7 4.37 10-8 2.38 10-7 5.27 10-7 1.62 10-7
Rp 5.21 71.4 47.3 154 6.91 5.90
CPE1 2.09 10-5 1.14 10-5 8.51 10-6 2.67 10-5 6.26 10-4 9.15 10-4
Rct 374410 237860 240540 101780 74.04 67.69
Randles-CPE
Rs 9.535 12.32 24.12 17.99 26.96 19.88
CPE1 2.08 10-5 1.18 10-5 8.61 10-6 2.86 10-5 5.81 10-4 8.02 10-4
Rct 343490 235400 255150 130860 72.97 65.44
3.3.4. Theoretical band gap
In order to understand the outstanding performance of Nb2O5 over the other SC, we also evaluate
their theoretical band gap structures. Table S2 shows the conduction band (CB) and valence band
(VB) potentials of the SC calculated as described in the SI.[63] The presence of the fundamental SC
band gap in the metal-semiconductor (MS) heterojunction originates that the lowest-lying states
of the SC conduction band interact with electrons in the metal Fermi level. For the electronic
transport across the MS interface, this energy offset, known as the Schottky barrier height (SBH),
manifests as a potential energy barrier that leads to rectifying behaviour between the metal and the
SC by which the electrons flux from the SC to the metal is favoured.[64] Therefore, it is desirable
that the SC used have an SBH barrier corresponding to the conduction band close to the Ni Fermi
18
level to facilitate the transfer of electrons to the metal mediated by an external potential (or light)
favouring the reduction of water into H2. The results in table S2 show CB energy levels for both
Nb-SC are closer to the Ni Fermi level compared to TiO2. Although this simplified theory
overlooks the crystal surface of the SC and the interface chemistry, can explain the outstanding
catalytic activity of Nb2O5 compared to TiO2.
4. CONCLUSIONS
In summary, we describe the use of hybrid Ni-SC electrodes for HER in the absence of SED,
using Nb-based semiconductors as a superior alternative to TiO2. This is, to the best of our
knowledge, the first use of Nb-based semiconductors as cathodes or photocathodes for hydrogen
generation. These materials present better electrocatalytic activity than their TiO2 counterpart,
showing two-order-of-magnitude enhancement of the HER in the case of Nb2O5. Additionally, we
demonstrate the HER can be carried out using a non-toxic electrolyte (K2CO3); which increases
the application span of the materials towards home and industrial uses.
Characterization of the SC — by DR spectroscopy — shows their OBG values are 2.99, 3.19
and 3.5 eV for Nb2O5, Nb3(PO4)5 and TiO2, respectively. XRD analysis displays the conventional
crystal structure observed for TiO2 and Nb2O5, while the Nb3(PO4)5 is clearly amorphous, also
confirmed by Raman spectroscopy. Further, differences in the crystal size obtained from XRD
diffractograms are in good agreement with the particle size seen by SEM, which suggest Nb-based
SC are several orders of magnitude bigger than TiO2.
The complete electrochemical characterization of the systems reveals the same HER mechanism
found for bare Ni electrodes. Electrochemical impedance spectroscopy proves to be much more
sensitive to irradiation effects than CV or KPFM; notably, a very powerful tool for the study of
photosensitive systems. The results reveal that these SC, in particular Nb2O5, could have promising

19
photocatalytic properties towards hydrogen generation and slight modifications to their electronic
structure can furnish enhanced photoelectrochemical activity. Particularly, Nb2O5 semiconductor
shows a superior catalytic activity with respect to the other semiconductors analyzed, even in
comparison with TiO2, a SC normally used for HER. These Nb-based materials would allow
obtaining very simple and economical photocathodes with minimal modifications to the methods
currently used for the production of catalysts for electrolysers. We envision that the use of these
alternative semiconductors could open new ways to efficiently produce H2.
ASSOCIATED CONTENT
Supporting Information. Experimental details and additional results can be found in the
Supporting Information.
Notes
The authors declare no competing financial interest.
ACKNOWLEDGMENTS
This work was supported by the Natural Sciences and Engineering Research Council of Canada,
the Canada Foundation for Innovation, the Canada Research Chairs Program, the MINCyT-
uOttawa bilateral agreement (project OT 17 02). The authors acknowledge financial support from
FON-CyT PICT-2017-0250. E.A.F. is a grateful recipient of the External fellowship for young
researchers from CONICET (National Research Council, Argentina). The authors thank Prof. Juan
Scaiano for his valuable support.
REFERENCES
[1] H. Pan, Renew. Sust. Energ. Rev., 57 (2016) 584-601. DOI: 10.1016/j.rser.2015.12.117 [2] A. Fujishima, K. Honda, Nature, 238 (1972) 37. DOI: 10.1038/238037a0

20
[3] A.S. Hainer, J.S. Hodgins, V. Sandre, M. Vallieres, A.E. Lanterna, J.C. Scaiano, ACS Energy Lett., 3 (2018) 542-545. DOI: 10.1021/acsenergylett.8b00152
[4] S.Z. Baykara, Int. J. Hydrogen Energy, 43 (2018) 10605-10614. DOI: 10.1016/j.ijhydene.2018.02.022
[5] C.C.L. McCrory, S. Jung, I.M. Ferrer, S.M. Chatman, J.C. Peters, T.F. Jaramillo, J. Am. Chem. Soc., 137 (2015) 4347-4357. DOI: 10.1021/ja510442p
[6] M. Schalenbach, G. Tjarks, M. Carmo, W. Lueke, M. Mueller, D. Stolten, J. Electrochem. Soc., 163 (2016) F3197-F3208. DOI: 10.1149/2.0271611jes
[7] M.Y. Wang, Z. Wang, X.Z. Gong, Z.C. Guo, Renew. Sust. Energ. Rev., 29 (2014) 573-588. DOI: 10.1016/j.rser.2013.08.090
[8] D.S. Hall, D.J. Lockwood, S. Poirier, C. Bock, B.R. MacDougall, J. Phys. Chem. A, 116 (2012) 6771-6784. DOI: 10.1021/jp303546r
[9] E.A. Franceschini, G.I. Lacconi, H.R. Corti, Electrochim. Acta, 159 (2015) 210-218. DOI: 10.1016/j.electacta.2015.01.110
[10] J.H. Kim, J.N. Lee, C.Y. Yoo, K.B. Lee, W.M. Lee, Int. J. Hydrogen Energy, 40 (2015) 10720-10725. DOI: 10.1016/j.ijhydene.2015.07.025
[11] M. Gong, D.Y. Wang, C.C. Chen, B.J. Hwang, H.J. Dai, Nano Res., 9 (2016) 28-46. DOI: 10.1007/s12274-015-0965-x
[12] X. Xiao, D.K. Huang, X.Q. Fu, M. Wen, X.X. Jiang, X.W. Lv, M. Li, L. Gao, S.S. Liu, M.K. Wang, C. Zhao, Y. Shen, ACS Appl. Mater. Inter., 10 (2018) 4689-4696. DOI: 10.1021/acsami.7b16430
[13] E.A. Franceschini, M.J. Gomez, G.I. Lacconi, J. Energy Chem., 29 (2019) 79-87. 10.1016/j.jechem.2018.02.005
[14] X.B. Chen, S.H. Shen, L.J. Guo, S.S. Mao, Chem. Rev., 110 (2010) 6503-6570. DOI: 10.1021/cr1001645
[15] J.H. Yang, D.G. Wang, H.X. Han, C. Li, Acc. Chem. Res., 46 (2013) 1900-1909. DOI: 10.1021/ar300227e
[16] L. Elias, A.C. Hegde, RSC Adv., 6 (2016) 66204-66214. DOI: 10.1039/c6ra09497j [17] B. Losiewicz, A. Budniok, E. Rowinski, E. Lagiewka, A. Lasia, Int. J. Hydrogen Energy,
29 (2004) 145-157. DOI: 10.1016/S0360-3199(03)00096-X [18] H.H. Sun, Z. Ma, Y.F. Qiu, H. Liu, G.G. Gao, Small, 14 (2018). DOI:
10.1002/smll.201800294 [19] J. Joy, J. Mathew, S.C. George, Int. J. Hydrogen Energy, 43 (2018) 4804-4817. DOI:
10.1016/j.ijhydene.2018.01.099 [20] S.U.M. Khan, M. Al-Shahry, W.B. Ingler, Science, 297 (2002) 2243-2245. DOI:
10.1126/science.1075035 [21] J. Gu, Y. Yan, J.L. Young, K.X. Steirer, N.R. Neale, J.A. Turner, Nat. Mater., 15 (2016)
456-460. 10.1038/Nmat4511 [22] S. Masudy-Panah, Y.J.K. Eugene, N.D. Khiavi, R. Katal, X. Gong, J. Mater. Chem. A, 6
(2018) 11951-11965. 10.1039/c8ta03027h [23] B. Seger, T. Pedersen, A.B. Laursen, P.C.K. Vesborg, O. Hansen, I. Chorkendorff, J. Am.
Chem. Soc., 135 (2013) 1057-1064. 10.1021/ja309523t [24] W. Cui, W.Z. Niu, R. Wick-Joliat, T. Moehl, S.D. Tilley, Chem. Sci., 9 (2018) 6062-6067.
10.1039/c8sc01453a [25] H.V. Le, T.L. Le, U.T.D. Thuy, P.D. Tran, Adv. Nat. Sci.: Nanosci. Nanotechnol., 9 (2018)
023001.
21
[26] K.J. Griffith, A.C. Forse, J.M. Griffin, C.P. Grey, J. Am. Chem. Soc., 138 (2016) 8888-8899. DOI: 10.1021/jacs.6b04345
[27] B.B. Tian, H.F. Xiang, L. Zhang, Z. Li, H.H. Wang, Electrochim. Acta, 55 (2010) 5453-5458. 10.1016/j.electacta.2010.04.068
[28] V. Thangadurai, S. Narayanan, D. Pinzaru, Chem. Soc. Rev., 43 (2014) 4714-4727. 10.1039/c4cs00020j
[29] W.W. Wang, J.K. Meng, X.Y. Yue, Q.C. Wang, X.X. Wang, Y.N. Zhou, X.Q. Yang, Z. Shadike, Z.W. Fu, Chem. Commun., 54 (2018) 13809-13812. 10.1039/c8cc07660j
[30] Y.H. Pai, S.Y. Fang, J. Power Sources, 230 (2013) 321-326. 10.1016/j.jpowsour.2012.12.078
[31] T. Sreethawong, S. Ngamsinlapasathian, S.H. Lim, S. Yoshikawa, Chem. Eng. J., 215 (2013) 322-330. 10.1016/j.cej.2012.11.023
[32] X.Y. Chen, T. Yu, X.X. Fan, H.T. Zhang, Z.S. Li, J.H. Ye, Z.G. Zou, Appl. Surf. Sci., 253 (2007) 8500-8506. 10.1016/j.apsusc.2007.04.035
[33] A.K. Kulkarni, R.P. Panmand, Y.A. Sethi, S.R. Kadam, S.P. Tekale, G.H. Baeg, A.V. Ghule, B.B. Kale, Int. J. Hydrogen Energy, 43 (2018) 19873-19884. 10.1016/j.ijhydene.2018.09.013
[34] J.Y. Huot, M. Trudeau, L. Brossard, R. Schulz, Int. J. Hydrogen Energy, 14 (1989) 319-322. DOI: 10.1016/0360-3199(89)90132-8
[35] K. Kadakia, M.K. Datta, O.I. Velikokhatnyi, P. Jampani, S.K. Park, P. Saha, J.A. Poston, A. Manivannan, P.N. Kumta, Int. J. Hydrogen Energy, 37 (2012) 3001-3013. DOI: 10.1016/j.ijhydene.2011.11.055
[36] F.S. da Silva, T.M. de Souza, Int. J. Hydrogen Energy, 42 (2017) 26020-26036. DOI: 10.1016/j.ijhydene.2017.08.105
[37] B. Wang, J. Durantini, J. Nie, A.E. Lanterna, J.C. Scaiano, J. Am. Chem. Soc., 138 (2016) 13127-13130. DOI: 10.1021/jacs.6b06922
[38] M.L. Marin, G.L. Hallett-Tapley, S. Impellizzeri, C. Fasciani, S. Simoncelli, J.C. Netto-Ferreira, J.C. Scaiano, Catal. Sci. Technol., 4 (2014) 3044-3052. DOI: 10.1039/c4cy00238e
[39] B.J. Skromme, G.K. Sujan, Semiconductor heterojunctions, Reference Module in Materials Science and Materials Engineering, Elsevier2018.
[40] Y.T. Zhang, L.J. Pei, Z.F. Zheng, Y. Yuan, T.F. Xie, J. Yang, S. Chen, J.W. Wang, E.R. Waclawik, H.Y. Zhu, J. Mater. Chem. A, 3 (2015) 18045-18052. DOI: 10.1039/c5ta03214h
[41] R.H. Jones, G.J. Thomas, Materials for the hydrogen economy, Boca Raton, 2008. [42] R.D. Morgan, J.L. Haan, R.I. Masel, J. Power Sources, 195 (2010) 6405-6410. DOI:
10.1016/j.jpowsour.2010.04.001 [43] J. Rodriguez-Carvajal, Physica B, 192 (1993) 55-69. DOI: 10.1016/0921-4526(93)90108-I [44] I. Bianchi, E. Guerrini, S. Trasatti, Chem. Phys., 319 (2005) 192-199.
DOI:10.1016/j.chemphys.2005.06.042 [45] C. Cao, D. Ford, S. Bishnoi, T. Proslier, B. Albee, E. Hommerding, A. Korczakowski, L.
Cooley, G. Ciovati, J.F. Zasadzinski, Phys. Rev. Spec. Top.-Accet. Beams, 16 (2013). DOI: 10.1103/PhysRevSTAB.16.064701
[46] P. Mazzolini, V. Russo, C.S. Casari, T. Hitosugi, S. Nakao, T. Hasegawa, A.L. Bassi, J. Phys. Chem. C, 120 (2016) 18878-18886. DOI: 10.1021/acs.jpcc.6b05282
[47] F. Maroni, G. Carbonari, F. Croce, R. Tossici, F. Nobili, ChemSusChem, 10 (2017) 4771-4777. DOI: 10.1002/cssc.201701431

22
[48] W.L. Zhao, W. Zhao, G.L. Zhu, T.Q. Lin, F.F. Xu, F.Q. Huang, Dalton T., 45 (2016) 3888-3894. DOI: 10.1039/c5dt04578a
[49] M. Rikukawa, K. Sanui, Prog. Polym. Sci., 25 (2000) 1463-1502. DOI: 10.1016/S0079-6700(00)00032-0
[50] M. Chhetri, S. Sultan, C.N.R. Rao, Proc. Natl. Acad. Sci. U.S.A., 114 (2017) 8986-8990. 10.1073/pnas.1710443114
[51] D.L. Wood, J. Tauc, Phys. Rev. B, 5 (1972) 3144-3151. DOI: 10.1103/PhysRevB.5.3144 [52] Q. Tang, D.E. Jiang, ACS Catal., 6 (2016) 4953-4961. DOI: 10.1021/acscatal.6b01211 [53] G. Kreysa, B. Hakansson, P. Ekdunge, Electrochim. Acta, 33 (1988) 1351-1357.
DOI:10.1016/0013-4686(88)80125-7 [54] L. Bai, D.A. Harrington, B.E. Conway, Electrochim. Acta, 32 (1987) 1713-1731. DOI:
10.1016/0013-4686(87)80006-3 [55] M.J. Gomez, A. Loiacono, L.A. Perez, E.A. Franceschini, G.I. Lacconi, ACS Omega, 4
(2019) 2206-2216. DOI: 10.1021/acsomega.8b02895 [56] C. Hitz, A. Lasia, J. Electroanal. Chem., 500 (2001) 213-222. DOI: 10.1016/S0022-
0728(00)00317-X [57] E. Daftsis, N. Pagalos, A. Jannakoudakis, P. Jannakoudakis, E. Theodoridou, R. Rashkov,
M. Loukaytsheva, N. Atanassov, J. Electrochem. Soc., 150 (2003) C787-C793. DOI: 10.1149/1.1611492
[58] R.D. Armstrong, M. Henderson, J. Electroanal. Chem., 39 (1972) 81-90. DOI: 10.1016/S0022-0728(72)80477-7
[59] E.A. Franceschini, G.I. Lacconi, H.R. Corti, J. Energy Chem., 26 (2017) 466-475. 10.1016/j.jechem.2016.10.009
[60] Z. Kerner, T. Pajkossy, Electrochim. Acta, 46 (2000) 207-211. Doi 10.1016/S0013-4686(00)00574-0
[61] M. Tanimoto, O. Vatel, J. Vac. Sci. Technol., B, 14 (1996) 1547-1551. DOI: 10.1116/1.589136
[62] S. Ye, C.M. Ding, R.T. Chen, F.T. Fan, P. Fu, H. Yin, X.L. Wang, Z.L. Wang, P.W. Du, C. Li, J. Am. Chem. Soc., 140 (2018) 3250-3256. DOI: 10.1021/jacs.7b10662
[63] N. Tian, H.W. Huang, Y. He, Y.X. Guo, T.R. Zhang, Y.H. Zhang, Dalton T., 44 (2015) 4297-4307. DOI: 10.1039/c4dt03905j
[64] R.T. Tung, Appl. Phys. Rev., 1 (2014) 011304. DOI: 10.1063/1.4858400
23
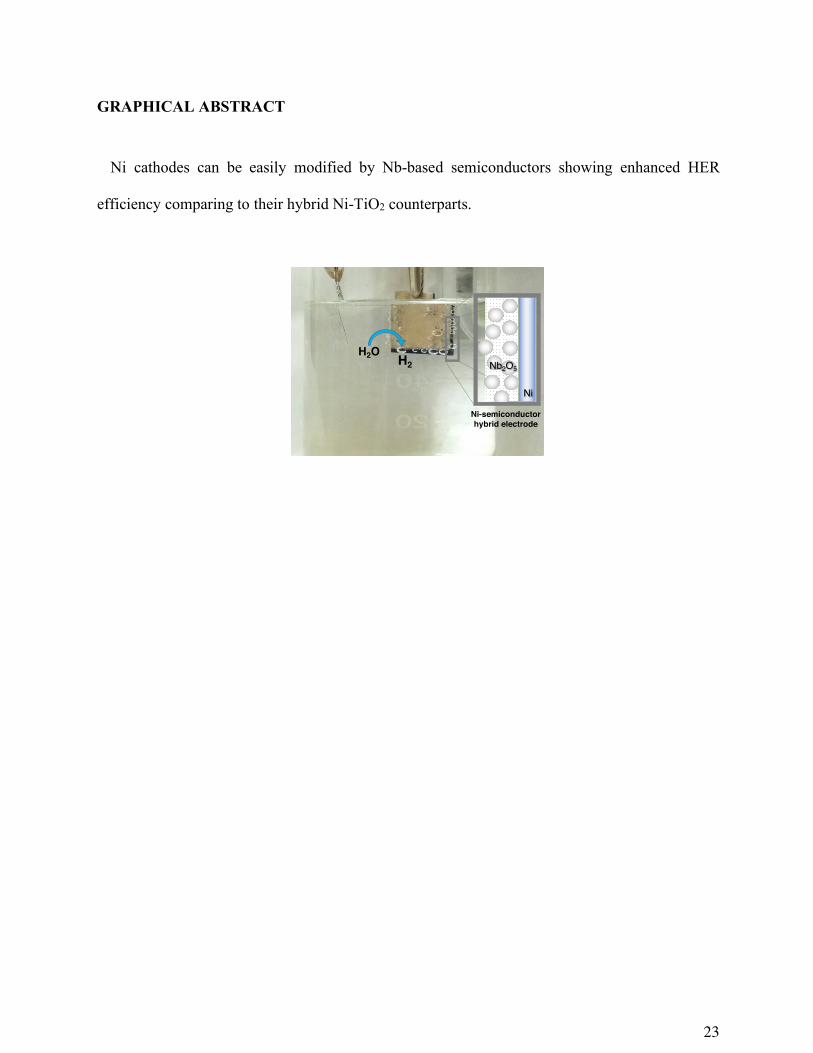
GRAPHICAL ABSTRACT
Ni cathodes can be easily modified by Nb-based semiconductors showing enhanced HER
efficiency comparing to their hybrid Ni-TiO2 counterparts.
Ni
Nb2O5
H2O H2
Ni-semiconductor hybrid electrode

S1
Niobium-based Semiconductor Electrodes for Hydrogen Evolution Reaction
Esteban A. Franceschini*a,b, Andrew Hainera, Anabel E. Lanterna*a
aDepartment of Chemistry and Biomolecular Sciences and Centre for Advanced Materials Research (CAMaR), University of Ottawa, Ottawa, Canada K1N 6N5
b INFIQC, CONICET and Departamento de Físico-Química-Facultad de Ciencias Químicas, Universidad Nacional de Córdoba, Córdoba, Argentina.
Table of Contents
Figure S1. Tauc plot constructed from Figure 2 for semiconductor (A) Nb3(PO4)5, (B) Nb2O5, and (C)
TiO2. Dash-pink line shows the typical extrapolation of the linear Tauc region to the photon energy
abscissa used to determine the optical band gap value. .......................................................................... 3
Figure S2. Raman spectra of the semiconductors (A) Nb2O5, (B) Nb3(PO4)5 and (C) TiO2 showing mainly
anatase signals. ..................................................................................................................................... 4
Figure S3. XRD patterns of the semiconductors (A) Nb3(PO4)5 showing amorphous structure, (B) Nb2O5
showing orthorhombic (O) [00-027-1313]; and monoclinic crystalline structure (M) [00-016-0053], and
(C) TiO2 showing the anatase (A) [00-064-0863] and rutile (R) [01-078-4189] crystalline structure. ..... 5
Figure S4. SEM images of Nb3(PO4)5 (top), Nb2O5 (middle), and TiO2 (bottom). Note higher particle size
for Nb-SC and the crystalline nature of the Nb2O5 as opposed to Nb3(PO4)5. Scale bar: 100µm (left), 1µm
(middle), 100 nm (right)........................................................................................................................ 6
Figure S5. Emission spectra of the light sources used for the photochemical and photoelectrochemical
experiences. (A) 4 UVA lamps working at 733 Wm-2, (B) 2 visible lamps working at 714 Wm-2, and (C)
combination of the 6 lamps working at 1023 Wm-2................................................................................ 7
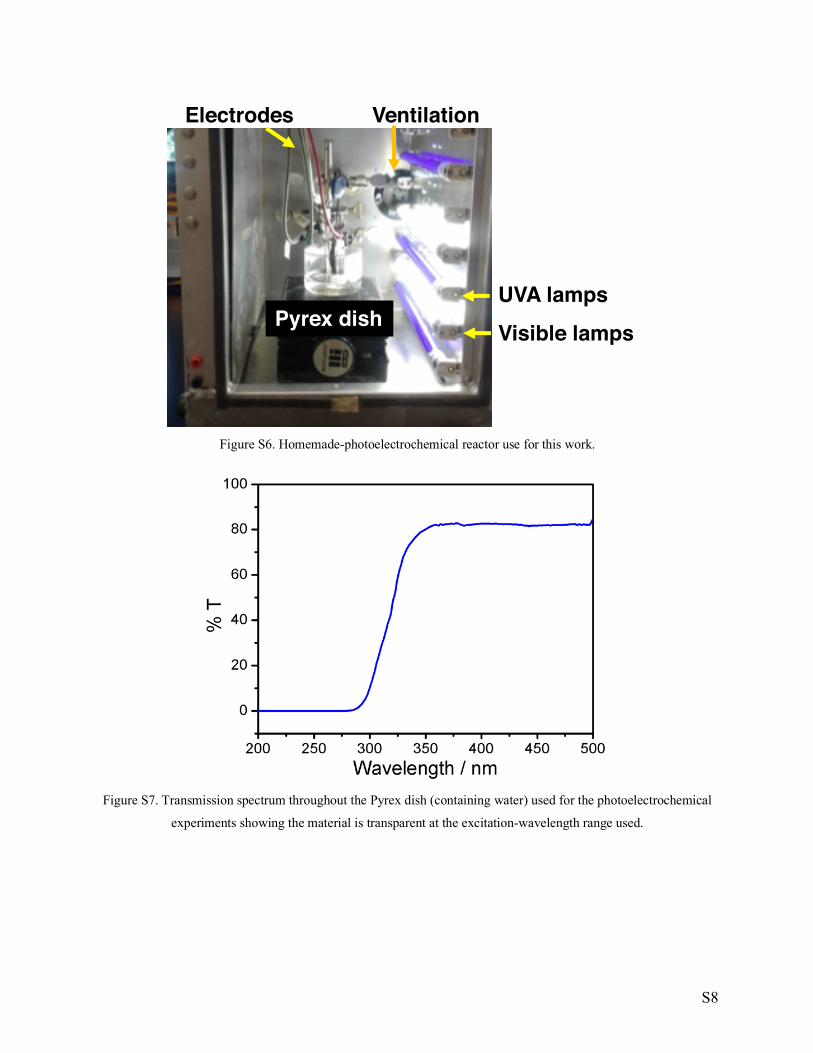
Figure S6. Homemade-photoelectrochemical reactor use for this work. ................................................. 8
Figure S7. Transmission spectrum throughout the Pyrex dish (containing water) used for the
photoelectrochemical experiments showing the material is transparent at the excitation-wavelength range
used. ..................................................................................................................................................... 8
Figure S8. Emission spectrum of light excitation source used during KPFM experiments. ..................... 9
Cyclic voltammetry and Tafel analysis ...................................................................................... 10
Table S1. Electrochemical and kinetic parameters for the HER in 0.5 M K2CO3 for each electrode (vs
SCE)................................................................................................................................................... 10

S2
Figure S9. Tafel plots for the HER on Ni-TiO2, Ni-Nb2O5 and Ni-Nb3(PO4)5 catalysts measured at 293 K
in the dark and under UVA-Vis irradiation. Scan rate = 5 mV s−1. Electrolyte: K2CO3 0.5 M. .............. 11
Electrochemical Impedance Spectroscopy (EIS)........................................................................ 12
Scheme S1. Top: Randles-CPE model. Bottom: AHEC1CPE. ............................................................. 12
Figure S10. Electrochemical impedance spectra of all the catalysts at the different potentials used. ..... 12
Theoretical band gap structures ................................................................................................. 13
Table S2. Calculated VB and CB potentials for the materials studied (eV). ......................................... 13
REFERENCES ......................................................................................................................... 14

S3
Figure S1. Tauc plot constructed from Figure 2 for semiconductor (A) Nb3(PO4)5, (B) Nb2O5, and (C) TiO2. Dash-
pink line shows the typical extrapolation of the linear Tauc region to the photon energy abscissa used to determine the
optical band gap value.
S4
Figure S2. Raman spectra of the semiconductors (A) Nb2O5, (B) Nb3(PO4)5 and (C) TiO2 showing mainly anatase
signals.
A
B
C

S5
Figure S3. XRD patterns of the semiconductors (A) Nb3(PO4)5 showing amorphous structure, (B) Nb2O5 showing
orthorhombic (O) [00-027-1313]; and monoclinic crystalline structure (M) [00-016-0053], and (C) TiO2 showing the
anatase (A) [00-064-0863] and rutile (R) [01-078-4189] crystalline structure.

S6
Figure S4. SEM images of Nb3(PO4)5 (top), Nb2O5 (middle), and TiO2 (bottom). Note higher particle size for Nb-SC
and the crystalline nature of the Nb2O5 as opposed to Nb3(PO4)5. Scale bar: 100µm (left), 1µm (middle), 100 nm
(right).
Nb3(PO4)5
Nb2O5
TiO2

S7
Figure S5. Emission spectra of the light sources used for the photochemical and photoelectrochemical experiences.
(A) 4 UVA lamps working at 733 Wm-2, (B) 2 visible lamps working at 714 Wm-2, and (C) combination of the 6 lamps
working at 1023 Wm-2.
S8
Figure S6. Homemade-photoelectrochemical reactor use for this work.
Figure S7. Transmission spectrum throughout the Pyrex dish (containing water) used for the photoelectrochemical
experiments showing the material is transparent at the excitation-wavelength range used.
Electrodes
Pyrex dishUVA lamps
Visible lamps
Ventilation

S9
Figure S8. Emission spectrum of light excitation source used during KPFM experiments.

S10
Cyclic voltammetry and Tafel analysis Table S1. Electrochemical and kinetic parameters for the HER in 0.5 M K2CO3 for each electrode (vs SCE).
SC b / (mVdec−1) j0 / (mAcm−2 ) OCP / mV Er / V j at −1.5 V / mAcm−2 Dark TiO2 -0.14 6.79 10-8 -82 -1.08 1.02 10-6
Nb2O5 -0.13 3.61 10-6 -109 -0.42 5.20 10-4 Nb3(PO4)5 -0.13 8.04 10-8 -148 -1.09 7.02 10-6
Light TiO2 -0.13 5.75 10-8 -90 -1.05 1.01 10-6 Nb2O5 -0.12 5.61 10-6 -123 -0.46 5.21 10-4 Np3(PO4)5 -0.13 2.18 10-8 -143 -0.82 7.00 10-6
Tafel Slope (b), Exchange Current Density (j0), Open-circuit Potential (OCP), Equilibrium potential (Er) and Current Density (j).

S11
Figure S9. Tafel plots for the HER on Ni-TiO2, Ni-Nb2O5 and Ni-Nb3(PO4)5 catalysts measured at 293 K in the dark
and under UVA-Vis irradiation. Scan rate = 5 mV s−1. Electrolyte: K2CO3 0.5 M.
-1.5 -1.0 -0.5
-8
-7
-6
log
(j / A
cm-2)
Potential / V vs SCE
Dark Light
Ni-TiO2
-1.5 -1.0 -0.5
-8
-7
-6
Ni-Nb3(PO4)5
log
(j / A
cm-2)
Potential / V vs SCE
Dark Light
-1.4 -1.2 -1.0 -0.8 -0.6 -0.4 -0.2 0.0
-7
-6
-5
-4
-3
-2
Ni-Nb2O5
log
(j / A
cm-2)
Potential / V vs SCE
Dark Light
S12
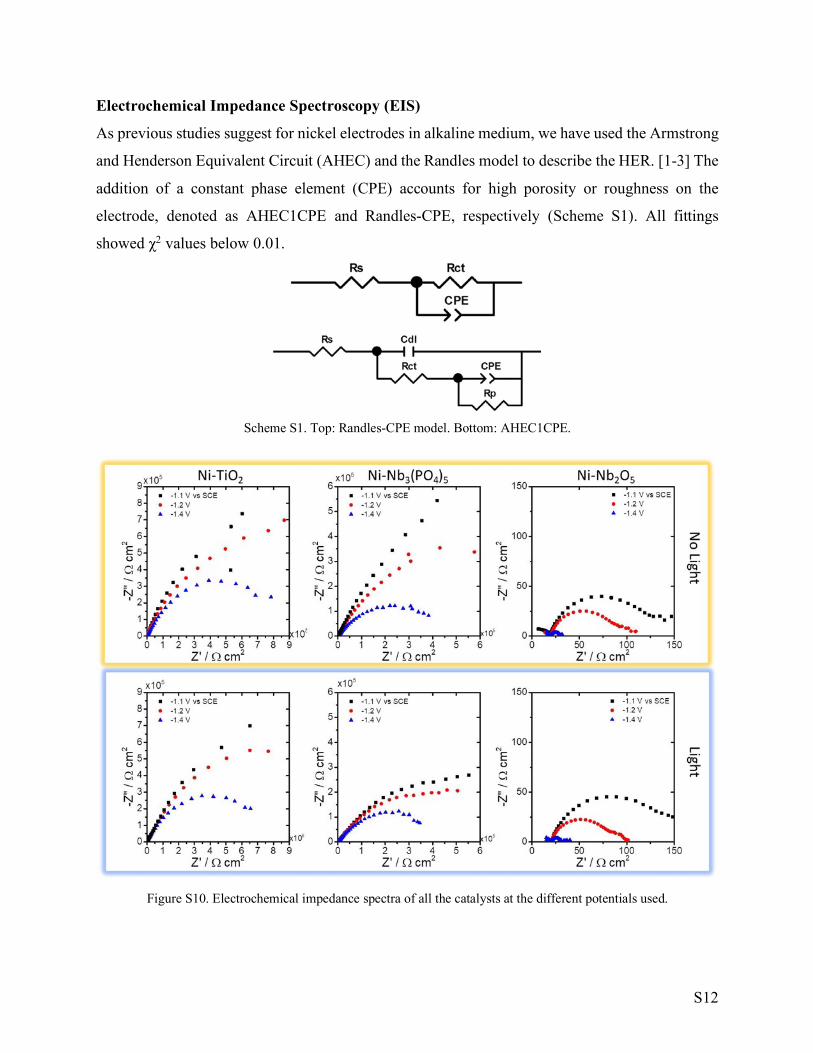
Electrochemical Impedance Spectroscopy (EIS)
As previous studies suggest for nickel electrodes in alkaline medium, we have used the Armstrong
and Henderson Equivalent Circuit (AHEC) and the Randles model to describe the HER. [1-3] The
addition of a constant phase element (CPE) accounts for high porosity or roughness on the
electrode, denoted as AHEC1CPE and Randles-CPE, respectively (Scheme S1). All fittings
showed χ2 values below 0.01.
Scheme S1. Top: Randles-CPE model. Bottom: AHEC1CPE.
Figure S10. Electrochemical impedance spectra of all the catalysts at the different potentials used.

S13
Theoretical band gap structures
The CB and VB of the SC were calculated using equations (1) and (2):
EVB=χ – Ee+0.5Eg (1)
ECB=EVB–Eg (2)
where EVB is the VB edge potential; c is the electronegativity of the SC, which is the geometric
average of the absolute electronegativity of the constituent atoms, Ee is the energy of free electrons
on the hydrogen scale (Ee ≈ 4.5eV); and Eg is the band gap energy of the SC (Table 1).
Table S2. Calculated VB and CB potentials for the materials studied (eV).
Support Optical BG cSC EVB ECB
TiO2 3.19 5.81 2.91 -0.28
Nb2O5 2.99 6.29 3.29 0.30
Nb3(PO4)5 3.5 6.68 3.93 0.43
Electronegativity of the semiconductors (cSC) calculated as the geometric average of the absolute electronegativity of the
constituent atoms using the electronegativity of each element from reference.[4] Theoretical Ni Fermi level: 0.85 V vs NHE (Work
Function of Ni(111): 5.35 eV.[5])

S14
REFERENCES [1] R.D. Armstrong, M. Henderson, J. Electroanal. Chem., 39 (1972) 81-90. DOI: 10.1016/S0022-
0728(72)80477-7
[2] C. Hitz, A. Lasia, J. Electroanal. Chem., 500 (2001) 213-222. DOI: 10.1016/S0022-0728(00)00317-X
[3] E. Daftsis, N. Pagalos, A. Jannakoudakis, P. Jannakoudakis, E. Theodoridou, R. Rashkov, M.
Loukaytsheva, N. Atanassov, J. Electrochem. Soc., 150 (2003) C787-C793. DOI: 10.1149/1.1611492
[4] R.G. Pearson, Inorg. Chem., 27 (1988) 734-740. DOI 10.1021/ic00277a030
[5] CRC Handbook of Chemistry and Physics, Cleveland, Ohio: CRC Press, Boca Raton, FL : Taylor and
Francis Group, LLC.