Embed Size (px)
Citation preview
Nintex Analytics 2010 Help
Last updated: Friday, 20 July 2012
1 Using Nintex Analytics 2010
1.1 Importing and Exporting Reports
1.2 Watch Reports
1.3 Manage Subscriptions
1.4 Report Viewer
1.5 Team Site Reporting
1.6 Report Designer
1.7 Create a New Dashboard
1.8 Getting Started With Nintex Analytics
1.9 Create a New Report
1.10 Subscribe to a Report
1.11 oData Export
1.12 Select Data
1.13 Drill Down
1.14 Drill Down - Select Report
1.15 Drill Down Parameter Settings
1.16 Filters
1.17 Parameters
1.18 Report Properties
1.19 Chart Designer
1.20 Table Designer
1.21 Scheduling a Report
1.22 Workflow
1.23 Report Listing
1.24 Display Definition Type
1.25 Subscribe to a Dashboard
1.26 Dashboard Viewer
1.27 Report Permissions
1.28 Permissions
1.29 Sorting
1.30 Nintex Analytics Web Parts
1.31 Web Part Select Report
1.32 Web Part Filters
1.33 Dashboard Properties
1.34 Watch Feature
1.35 View All Subscriptions
1.36 Tokens and Functions
1.37 Subscription Email 1.38 Dashboard Export
1.39 Watch a Document
1.40 Watch a Site
1.41 Scheduling a Watch Report
1.42 Create a Watch Report
1.43 Nintex Analytics Permission Levels
2 Using Nintex Analytics 2010 Central Administration
2.1 Manage Services
2.2 Licensing
2.3 Database Maintenance
2.4 Manage Active Directory Settings
2.5 Manage Audit Settings
2.6 Manage File Types
2.7 Manage Subscription Message Template
2.8 Manage System Accounts
2.9 Manage User Filters
2.10 Global Settings
2.11 System Status
2.12 Edit User Profile Mapping
2.13 Manage Data Sets
2.14 Manage Data Sets Add
2.15 Manage Data Sets Properties
2.16 Manage Data Sets Settings
2.17 Manage Data Sets Permissions
2.18 Manage Data Sets Columns
2.19 Manage Data Sets Parameters
2.20 Manage Data Sets Clone
2.21 Data Sets Using Auditing
2.22 Manage Installed Data Set Templates
2.23 Upload Data Set
2.24 Import Reports
2.25 Export Reports
2.26 Crawl Exclusion Rule Management
2.27 Create a Crawl Exclusion Rule
2.28 View Report Templates
2.29 Manage Report Categories
1 Using Nintex Analytics 2010
1.1 Importing and Exporting Reports
Export a report definition
The Export Report button saves the complete definition of the current report to a local folder, in XML
format. The exported file can then be kept as a backup, re-imported to restore the report settings, imported
into another SharePoint environment or Report Center, or into a new report to create variations of similar
reports.
To export a report definition:
1. Navigate to the desired report.
2. Select Design in the Nintex Analytics Ribbon.
3. Click Export Report in the Ribbon.
4. Click Save on the File download to save the report to a local drive.
5. Click Close.
Import a report definition
The Import Report button will import a saved export file and overwrite the configuration of the current
report.
Note: To import a report as a new report, first create a new report, and then import the file into the new
report. The name of the report in the export file is not used.
To import a report definition:
1. Navigate to the desired report to overwrite.
2. Select Design in the Nintex Analytics Ribbon.
3. Click Import Report in the Ribbon.
4. Locate the exported report file with Browse.
5. Check the Delete existing data box to remove any previously collected report data from the import.
This is recommended when importing between report centers.
6. Click OK.
1.2 Watch Reports
The Nintex Analytics Watch feature can be activated on the site to enable users to subscribe to emailed
reports on site or document activity. Refer to Watch Report Feature.
Watch Document
To receive an email about the audit activity on a document:
1. Navigate to a document in a document library.
2. Click the drop-down next to the document name and select Watch this document from the menu.
3. Select Watch this document in the Report field.
4. Select the desired Email Format and click OK to confirm the subscription.
If the current user selects Watch this document and is already subscribed, the dialog will display the
message "You are already watching this document". To stop watching this document refer to Manage
Subscriptions.
Watch Site
To receive an email about the activity in a site:
1. Navigate to the site in SharePoint.
2. Click on the SharePoint Site Actions drop-down menu.
3. Select Nintex Analytics and click on Watch Site.
4. Select Watch This Site in the Report field.
5. Select the desired Email Format and click OK to confirm the subscription.
If the current user selects Watch this site and is already subscribed, the dialog will display the
message "You are already watching this site". To stop watching this site refer to Manage Subscriptions.
Unsubscribing to a watch subscription
To unsubscribe to a watch subscription:
1. Use the My Subscriptions button on the Nintex Analytics home page or report page, or use the
SharePoint current user menu and select Manage Subscriptions.
2. Select the report that you want to unsubscribe from.
3. Click the Unsubscribe button in the Ribbon.
4. Click OK.
Related topics
Manage Subscriptions
1.3 Manage Subscriptions
The Manage Subscriptions page can be used to change or remove subscriptions.
The Manage Subscriptions page is accessed either from a report page, using the Manage
Subscriptions button in the Ribbon, or from the SharePoint current user menu.
The Ribbon menu
View Report: Select a report from the list and click to view the report.
Unsubscribe: Select a report from the list and click to remove the subscription to this report.
Details: Select a report from the list and click to view or change the subscription settings.
Related Topics
Subscribe to a Report
Subscribe to a Dashboard
Watch a Document
Watch a Site
1.4 Report Viewer
The Nintex Analytics Report Viewer runs and displays the report, which may include a chart, a table, or
both; and provides access to the Parameters panel, the Report Catalog, Related Reports, and the report
viewer menu ribbon.
Chart
When the mouse hovers over a data point in a bar or column chart, a tooltip will appear showing the data
value. In a pie chart segment, the tooltip will show the data points label, value and percentage of the
section. If a Drill Down has been configured, the mouse cursor will change to a hand icon to indicate that
drill down is available.
Table
If the report has been configured to allow sorting on table columns, clicking on a table column header will
sort the data based on that column, in ascending order. Click the header again to sort in descending order.
If the report contains more than one page of data, use the table page controls in the bottom right corner of
the table object to scroll through the available pages.
Parameters panel
The Parameters panel appears on the right hand side of the page. The Parameters panel is
initially hidden, showing only a tab in the top right corner. Hover over the tab to display the Parameters
Panel. Selections may be made from the panel in this mode, and the panel will revert to hidden when the
mouse is moved away from the panel area. To dock the panel so that it is always visible, click the pin icon
in the top right corner. The docked or hidden setting is saved in a browser cookie.
Snapshot: Use the Snapshot selector to retrieve previous scheduled executions of the report from
the snapshot database if the report has been run on a schedule. If no snapshots are available, the
Snapshot selector will display only the current date (the date when the report was run).
Parameter Selectors: The Parameters panel may contain one or more parameter selectors. This will
depend on the report configuration.
Note: If the selector has been configured to be visible but not changeable, it will have a disabled
appearance and is displayed to inform the user of the parameters that were used to create the
resulting data.
Note: If the selector has been set to visible and changeable, the user may select from the available
options and re-run the report with the desired selections.
Run: Click Run to re-run the report with the selected options once the desired parameter selections
have been made.
Related Reports
The Related Reports section is located beneath the Parameters panel. This section displays all the
available reports that contain the same keyword as the current report. Click the desired report title link
to run the report.
Report Catalog
The Report Catalog appears on the left-hand side of the Report Viewer page. Use the Search box to locate
the desired report. To locate a report, type the name or partial name of the report required and select from
the options.
Alternatively, click on a category heading to expand that category and select a report. The current report
being viewed is highlighted in the catalog. If a description field has been completed for the report, a
description of the report will appear.
The Ribbon menu
The menu ribbon is security trimmed. The following options are available according to the current user's
permissions. Refer to Permissions.
New: Refer to New Report or New Dashboard.
Design: Refer to Report Designer.
Subscribe: Refer to Subscribe to a Report.
Unsubscribe: When this button is active, it indicates that the current user has a subscription to the
report being viewed. Click the Unsubscribe button to remove the subscription.
My Subscriptions: Refer to Manage Subscriptions.
Export to PDF: Click the export to PDF button to open or save a report in PDF format.
Note: Only page one of the table will be exported.
Export to Excel: The Export to Excel button has two options: export to XML Format or oData
Format. The XML Format will create an XML file in a format that can be opened in Excel. oData
Format creates a link that can be used by Open Data Protocol readers, such as PowerPivot for Excel
2010. Refer to oData Export.
Related Topics
Permissions
1.5 Team Site Reporting
The Nintex Analytics Site Report Center feature creates a Report Center with reports targeted to a
specific Site.
Note: In SharePoint 2010 Claims Authentication environments, login as a non-system account user when
activating the Nintex Analytics Site Report Center feature to prevent an error.
Activate Site Report Center
Activating a site report center will populate the Report Center with Site Reports and create a Nintex Site
Analytics link in the left-hand navigation of the SharePoint site. Site report options will also be added to the
Nintex Analytics menu option in SharePoint Site Actions.
To activate the Site Report Center feature:
1. Navigate to the desired SharePoint Site.
2. Select Site Actions and click Site Settings.
3. Click Manage site features in the Site Actions section.
4. Locate Nintex Analytics Site Report Center and select Activate.
Deactivate Site Report Center
Deactivating the Nintex Analytics Site Report Center feature will delete all the reports in the Site Report
Center.
To deactivate the Site Report Center feature:
1. Navigate to the desired SharePoint Site.
2. Select Site Actions and click Site Settings.
3. Click Manage site features in the Site Actions section.
4. Locate Nintex Analytics Site Report Center and click Deactivate.
Related Topics
Getting Started With Nintex Analytics
Report Designer
1.6 Report Designer
The Nintex Analytics Report Designer is used to create new reports or customize existing reports.
To open the Report Designer click Design in the Nintex Analytics Ribbon or Create a New Report.
Design the Chart or Table
To design either the chart or the table, hover over the area and double click in any of the grey areas or
click on the button in the center.
Design Chart: Refer to Chart Designer.
Design Table: Refer to Table Designer.
The Ribbon menu
Save & Close: Use the Save & Close button to save the current configuration of the report or select
Save and Keep Editing or Stop Editing. The Stop Editing button will not commit any changes
since the last Save. If there have been changes, a warning prompt will display. Click OK to exit
without saving or Cancel to return and save the changes. To notify subscribers of any changes that
have been made to a report refer to Subscription Email.
New: Use the New button to create a new report or dashboard. Refer to New Report or New
Dashboard.
Import Report: Use the Import Report button to replace the existing report with an exported report
definition. Refer to Importing and Exporting Reports.
Export Report: Use the Export Report button to save the current report definition to a local file. This
file can then be used to import into the same report center or to a different report center. Refer to
Importing and Exporting Reports.
Select Data: Use the Select Data button to open the data set used for the report. Refer to Select
Data.
Drill Down: Use the Drill Down button to navigate from one report to another report by clicking on a
data point in a chart. Refer to Drill Down.
Filters: Use Filters to limit the data returned from the data set based on column values. Refer to
Filters.
Sorting: Use the Sorting button to apply a default sort order to the report. Refer to Sorting.
Parameters: Use the Parameters button to limit the data returned by the data set based on defaults
or user selections. Refer to Parameters.
Page size: Use Page size to enter the number of rows to return for each page. This could match a
time period. For Example: If you have an hourly report over a day set the page size to 24.
Max rows: Setting Max rows to a reasonable number will improve report execution time. Each data
set has a maximum number of rows that can be returned in the Data Set Configuration. If a number is
entered that is greater than allowed by the Data Set, a message dialog will display the
maximum. Click OK and enter a valid number.
Edit Properties: Use the Edit Properties button to configure the report properties. Configure the
display name, description, report catalog category, the report icon, navigation and the keywords for
related reports. Refer to Properties.
Permissions: Use the Permissions button to configure the users who can view or design the report.
By default the report inherits from the Report Center permissions. Refer to Report Permissions.
Delete: Use the Delete button to delete the current report. To notify subscribers that a report has
been deleted refer to Subscription Email.
Scheduling: Use the Schedule button to automatically run the report at chosen intervals. Results
from a scheduled report are added to the Snapshot database. Refer to Scheduling a Report.
Workflow: Use the Workflow button to report data in a workflow. Refer to Workflow.
1.7 Create a New Dashboard
The Nintex Analytics Dashboard is a page that contains multiple reports and summary statistics, providing
an at-a-glance view of SharePoint activity.
Creating a New Dashboard
To create a new dashboard:
1. Click on the New drop-down menu in the Nintex Analytics Ribbon and select New Dashboard.
2. Type a name into the Dashboard Name box and click Create.
3. Navigate to the Page tab Ribbon.
4. Click Edit Page.
5. Click Add a Web Part. Refer to Nintex Analytics Web Parts for information on adding Web Parts.
6. Edit and configure the Web Part as desired.
7. Click Stop Editing in the Ribbon.
Note: In addition to creating a regular dashboard, a watch dashboard can be created to enable users to
subscribe to reports on site activity. Refer to the Watch Report Feature for more information.
Related Topics
Nintex Analytics Web Parts
Web Part Select Report
Web Part Filters
Create a Watch Report
Watch Report Feature
1.8 Getting Started With Nintex Analytics
The Nintex Analytics Report Center home page includes a welcome page with introductory information
and help links, a Nintex Analytics Ribbon and the Reports Catalog in the left-hand panel.
Note: The welcome page is a customizable SharePoint Web Part page. Questions regarding custom
content should be directed to your system administrator.
Reports
The Reports Catalog can be found in the left-hand side panel and is divided into report categories.
Click on a category heading to expand the section and then click on a report icon to run and view the
report.
Report Categories
Dashboards: Contains the Content and Collaboration report, and the System Usage report.
Sites and pages: Contains the Fastest Growing Sites report, Most Popular Pages report, Most
Popular Sites report, Site Collection by Size report, and Total Activity per Month report.
Users: Contains the Actions per User report, Active Users per Month report, Content Creators report,
and Contributors report.
Content: Contains the Documents Added per Month, Documents Downloaded per Month,
Documents in Draft, File Types, Popular Documents, Publication, and the Unpublished Documents
per Site report.
Collaboration: Contains the Shared Document Updates per Month, Shared Document Views per
Month, and Views vs. Updates report.
Lists & Discussions: Contains the Discussion Board, List Creators, Lists Created per Month, and
Lists per Site Compared to Previous Month report.
Storage & Capacity: Contains the Content Database Size, Content Storage by Site, and Content
Storage Trend report.
System Performance: Contains the CPU Usage, and Total Memory Usage report.
Search Activity: Contains the Monthly Search Activity, Monthly Search Users, Most Active Search
Users, Most Popular Query, and Search Scopes report.
Workflow Definitions: Contains the List Workflow Creators report.
The Nintex Analytics Ribbon
New: Allows users with report designer permission to create new reports or dashboards within
the report center. The button will be disabled if the current user does not have report designer
permissions. Refer to
Create a New Report or Create a New Dashboard.
My Subscriptions: Allows users to view and manage their subscriptions to receive reports via email.
Refer to Manage Subscriptions.
Permissions: Allows users with Full Control permission to administer user permissions within the
report center. The button will be disabled if the current user does not have Full Control permission.
Refer to Permissions.
Related Topics
Report Viewer
Report Designer
Dashboard Viewer
Create a New Dashboard
Create a New Report
Manage Subscriptions
Permissions
Watch Report Feature
1.9 Create a New Report
The Create a New Report page allows the user to create a new report that can be customised with a chart,
a table, or both. Once a new report has been created, the report designer will open to allow the user to
configure the new report.
Create a New Report
To create a new report:
1. Click on New in the Nintex Analytics 2010 Ribbon.
2. Select from the report layouts provided.
3. Enter the Report Name.
4. Click OK.
5. The Report Designer will now open.
Note: In addition to creating a regular report, a watch report can be created to enable users to subscribe to
reports on document activity. Refer to the Watch Report Feature for more information.
Related Topics
Report Designer
Create a Watch Report
Watch Report Feature
Watch a Document
Watch a Site
1.10 Subscribe to a Report
Nintex Analytics can email reports on a regular basis to subscribed users. Each report has a pre-defined
report schedule. Refer to Scheduling a Report for more details.
Subscribe to a Report
Navigate to the report you want to subscribe to and click on the Subscribe button in the Nintex Analytics
Ribbon. The subscription dialog displays the following details:
Report: The title of the report and the frequency the report will be emailed.
Email Format: Use the Format drop-down to select the desired format you want the report emailed
in. Choose from embedded HTML, PDF attachment or Excel attachment.
Note: The PDF and Excel attachments will contain table data only.
Users: The Users input box will only be active if the current user has permission to subscribe other
users. Additional users can be entered or selected using the address book icon. By default, once you
click on Subscribe, your user details will be added to the Users input box automatically.
Note: To be able to subscribe to a report, the report must be scheduled to run. If the report it not scheduled
to run, the Subscribe button will be greyed out. Refer to Scheduling a Report for more details.
Unsubscribe from a Report
Click on the Unsubscribe button to remove the subscription. The unsubscribe button will only become
active if the current user has a subscription to the current report.
Related topics
Manage Subscriptions
Watch Reports
Scheduling a Report
1.11 oData Export
The oData Format export option creates a link that can be used by Open Data Protocol readers, such as
PowerPivot for Excel 2010. For more information on PowerPivot see www.powerpivot.com.
Export to oData
The oData Format dialog box contains two links (URLs):
The Live Data link will run the report each time it is called by an application.
The Static Data link will retrieve the particular execution that was current when the link was created.
To export to oData:
1. Click the Export to Excel drop-down in the Nintex Analytics Ribbon.
2. Select oData Format.
3. Click View to view either link in the browser window.
4. Click Copy to copy either link and paste into Excel PowerPivot or other oData compatible
applications.
1.12 Select Data
Data Sets are configured in Central Administration and are pre-defined data frameworks (containing
columns, parameters and filters) used to query the data warehouse and provide data for the reports. The
Select Data dialog will only display the data sets the current user has permission to access.
Selecting a Data Set
1. Select Design in the Nintex Analytics Ribbon and click Select Data in the Ribbon.
2. Browse the available data sets or search using the search box above the Data Set listing.
3. Once a Data Set has been selected, a chart and table preview will be shown with sample data. Click
the Apply button.
Data sets can be changed after designing a report. Parameters, Filters, Drill Through, Columns
displayed will have to be reconfigured to reflect the new Data Set selection.
Related Topics
Report Designer
Manage Data Sets
1.13 Drill Down
Drill down provides the ability to navigate from one report to another report by clicking on a data point in a
chart. This is often done in order to provide more detail about the particular data point. For example, one
report may display a list of sites and the count of documents within each site. In that report, Site A has a
value of 20 documents. It would be convenient to be able to click on the number 20 and see a list of the
twenty documents. This can be achieved by configuring a “Sites by documents” report to Drill Down to a
“Document details” report.
Configure a Drill Down
1. Select Design in the Nintex Analytics Ribbon.
2. Click on Drill Down in the Ribbon.
3. Click the link under Destination Report to select the report to drill down to.
4. Select the report from the Select Report dialog and click Apply.
Note: The Select Report dialog will close and return to the Drill Down dialog. The link under
Destination Report will contain the selected report’s name.
Change the Destination Report by clicking on the link or remove the Destination Report by clicking
on the delete icon next to the link. If the Destination Report is changed or deleted, any
configurations of the previously selected Destination Report will be lost. To revert back, cancel out
of the Drill Down dialog rather than saving.
Find the selected reports available parameters in a table under the heading Parameter.
5. Click on a Parameter and click Edit in the Ribbon to configure the parameter settings. Refer to Drill
Down Parameter Settings.
The Drill Down Ribbon
Save: Click to save the drill down configuration.
Cancel: Click to cancel the current sessions configurations.
Edit: Click to configure the selected Destination Report parameters.
Clear: Click to remove the parameter configuration of the Destination Report.
Related Topics
Drill Down Parameter Settings
1.14 Drill Down - Select Report
The Select Report dialog displays a list of reports the current user has design permissions to in the current
report center.
Select Report
To select a report for a drill down:
1. Browse the list of reports or use the search bar at the top left corner. Selecting a report will display a
preview of the chart and table with sample data.
2. Once the report has been selected, click Apply.
1.15 Drill Down Parameter Settings
Once a Destination Report has been selected, the data values to pass to the Destination Report can be
configured. Depending on the desired outcome, the Drill Down should be configured to pass data to one or
more of the parameters in the Destination Report.
The data value may be based on the data point clicked on, a manually set value or the current value of one
of the parameters within the current report.
Edit drill down parameter settings
Parameter
The internal name and a brief description of the parameter from the Destination Report.
Source and Settings
Data Point: The value will be based on the data point clicked in the chart. The data point refers to the
entire “record” in the returned data set. The value passed may be from a different column than the
one displayed in the chart.
Settings: Choose from the list of available columns in the Data Set.
Parameter: The value of a parameter in the current report at the time the Drill Down is clicked.
Settings: Choose from the list of available parameters from the current report.
Manual: Specify a value manually. Depending on the type of parameter selected, the appropriate
data selector will be displayed.
Settings: Use the data selector to set the desired value.
Related Topics
Drill Down - Select Report
Drill Down
Parameters
1.16 Filters
Filters can be used to limit the data returned from the data set based on column values.
Configure a filter
1. Click Design in the Nintex Analytics Ribbon.
2. Select Filters.
3. Click on Click here to add filter rule.
4. Select the column to filter with the drop-down menu.
5. Select an argument: equal to, not equal to, greater than, greater than or equal to, less than, or less
than or equal to, with the drop-down.
6. Enter the value to compare the data to in the box.
Note: Multiple filter rules can be added and combined with and/or statements.
Note: To edit or delete a filter rule, click the link next to the filter rule.
1.17 Parameters
Parameters can be added to limit the data returned by the data set when the report is run or scheduled.
The available parameters are dependent on the data set selected for the report. Parameters can be
displayed in the parameters panel to enable user selection at run time.
Display
The parameters display name that is shown in the parameters panel at run time.
Display Name: Enter the desired display name in the text box.
Default
The default value of the parameter can be a set value or a calculated value.
The calculated parameters value will be calculated at the time the report is run.
Options
Allow this parameter to be displayed in the report: Display the parameter in the panel at run time.
Allow report viewers to change this parameter: Allow the report viewer to change this parameter
and rerun the report.
Note: If a parameter is set to display but not allowed to change, it will display "disabled" in the
parameters panel. These can be used on their own or with inline functions: Refer to Tokens and Functions
for additional information.
Image and System Files
Some reports include system and image file parameters. By default, the following file types will be included
in reports.
Image File Types
GIF
JPG
PNG
TIFF
BMP
System File Types
ASPX
DWP
MASTER
RULES
THMX
VDW
WEBPART
XML
XOML
XSL
SXN
If additional filtering is desired or to change the file types above, please refer to Manage File Types. You
must have full permission to make this change.
Related Topics
Tokens and Functions
Manage File Types
1.18 Report Properties
Use the Edit Properties dialog to configure the display name, description, catalog category, icon and
visibility of the report in the Report Catalog.
Edit Properties Dialog
To open the Edit Properties dialog, click on the Edit Properties button in the Nintex Analytics Ribbon.
Name: The Report name that will display in the Report Catalog.
Note: Changing the Report name after the Report was created will only change the display name in
the Report Catalog. The actual page name in the SharePoint Document Library and the URL will
remain as the originally created Report name.
Description: An optional section where a report description can be entered.
Category: The category where the Report should be displayed in the Report Catalog.
Note: The Watch category is used when configuring watch reports. This category will only appear when
the Watch Report Feature is activated. Please refer to Watch Report Feature for more information.
Icon: The Report icon displayed in the Report Catalog. Click on the image to select a default or
custom image. The default images include a bar, line, pie or table chart. Alternatively, enter a custom
image URL. Note: Only png or jpg images will be supported.
Navigation: Tick on the Visible box to display the Report in the Report Catalog at run time. If Visible
is not ticked, the Report will still be visible in the Report Catalog in design mode and via the Report
Listing page. See Report Listing.
Snapshot: Tick the Visible box to display the Snapshot selector in the Parameters panel.
Keywords: The keywords are used to display links to related reports in the Parameters
panel. Related reports are reports that have the same keywords as the report that is currently being
viewed.
Related Topics
Report Designer
Watch Report Feature]
Dashboard Properties
1.19 Chart Designer
To use the Chart Designer, either double-click on the chart in design mode or click the Design Chart
button that appears when the mouse hovers over the chart area.
Note: When creating a New Report, a Data Set must be selected before the Chart can be designed.
General Tab
Title
Displays the title of the report above the chart. This can be constructed from text, parameter tokens and/or
inline functions.
The parameter tokens that can be used are:
SharePoint Site
To display the selected SharePoint Farm, Web Application, Site Collection or Site name use the following
parameter token:
For the parameter WebID: {ReportParameter:WebID}
For the parameter WebApplicationID: {ReportParameter:WebApplicationID}
For the parameter SiteID: {ReportParameter:SiteID}
Start and End Dates
To display the start and end date, use the following parameter tokens:
For the StartDate parameter: {ReportParameter:StartDate:[DateFormat]}
For the EndDate parameter: {ReportParameter:EndDate:[DateFormat]}
The possible DateFormat values are:
D - Long Date format eg. Monday, 1 June 2010
f - Full date/time format (short time) eg. Monday, 1 June 2010 8:45 PM
F - Full date/time format (long time) eg. Monday, 1 June 2010 8:45:23 PM
t - Short time format eg. 8:45 PM
Error Messages
If the report is unable to render the parameter in the title, the title will contain the error
message: ##{ReportParameter:[ParameterName]:[ErrorCode]}##.
The possible ErrorCode values are:
01 - Incorrect parameter
02 - Invalid variable format
03 - No execution
Sub Title
Displays the sub title of the report below the title of the chart. The sub title can be constructed from text,
parameter tokens and/or inline functions.
Height and Width
Set the required height of the chart. Select either Adjust width to fit zone, or set a fixed width.
Data Settings Tab
The Data Settings tab sets the columns to display on the X and Y axes, and the axis label to display.
Columns to display in chart
To set the column to display in the chart on the X or Y axis:
1. Select the column.
2. Use the arrows to move the columns in or out of the X or Y axis.
Note: Only columns that are numeric types can be used on the Y axis.
Column display names
To set the column display name:
1. Select the column.
2. Enter the new display name in the Display Name field in the Properties section.
Column display types
Changing the column display type or format:
1. Select the column.
2. Click on Display type.
3. Use the Display Type drop-down to select the new format.
For more information see Display Definitions
Chart Style Tab
The chart style tab configures the appearance of the chart.
Chart type: Select Column, Bar, Line or Pie.
Show Animations: Tick the Show Animations box to animate the column or pie charts when they
load in the report viewer.
Series Color Set: The series color sets are ten predefined color sets that are used in the chart
series.
To select a color set:
1. Click the Series Color Set drop-down.
2. Select the color in the color set to use as a starting point for the series.
3. This series will now reorder in the color set picker with the selected color first.
Note: The selected series color set will be available in the Chart Background and Plot Area color pickers.
Chart Background: The Chart Background is the area surrounding the Plot Area.
Legend: Tick to show the legend on the right hand side of the Plot Area. The Legend font matches
the Axis Label font.
Plot Area: The Plot Area is the area within the X and Y axes. To hide the Axis Lines, set the size to
0.
1.20 Table Designer
The Table Designer allows the user to configure the table in a report, including the title, columns and table
style. To open the table designer, click design in the Ribbon and select the Click to Design button which
appears when the mouse hovers over the table area.
Note: When creating a New Report, a Data Set must be selected before the Table can be designed.
General
Title
Displays the title of the report above the chart. This can be constructed from text, parameter tokens and/or
inline functions.
The parameter tokens that can be used are:
SharePoint Site
To display the selected SharePoint Farm, Web Application, Site Collection or Site name use the following
parameter token:
For the parameter WebID: {ReportParameter:WebID}
For the parameter WebApplicationID: {ReportParameter:WebApplicationID}
For the parameter SiteID: {ReportParameter:SiteID}
Start and End Dates
To display the start and end date, use the following parameter tokens:
For the StartDate parameter: {ReportParameter:StartDate:[DateFormat]}
For the EndDate parameter: {ReportParameter:EndDate:[DateFormat]}
The possible DateFormat values are:
D - Long Date format eg. Monday, 1 June 2010
f - Full date/time format (short time) eg. Monday, 1 June 2010 8:45 PM
F - Full date/time format (long time) eg. Monday, 1 June 2010 8:45:23 PM
t - Short time format eg. 8:45 PM
Error Messages
If the report is unable to render the parameter in the title, the title will contain the error
message: ##{ReportParameter:[ParameterName]:[ErrorCode]}##.
The possible ErrorCode values are:
01 - Incorrect parameter
02 - Invalid variable format
03 - No execution
Sub Title
Displays the sub title of the report below the title of the chart. The sub title can be constructed from text,
parameter tokens and/or inline functions.
Height and Width
Set the required height and width for the table. Select either Adjust width to fit zone or set a fixed width.
Note: The height and width pixels should be set between 250 and 5000.
Show Grid Lines
Select the Show Grid Lines box to display grid lines on the table.
Columns
The Columns Tab in the Table Designer configures the columns displayed in the table.
To select a column to display in the table:
1. Select the column in the columns list.
2. Tick the Display box in the Properties section.
Tip: After selecting the column, pressing 'd' on the keyboard will activate the Display check box.
Changing a column display name:
1. Select the column in the columns list.
2. Enter the display name in the Display Name field in the Properties section.
Changing the column display type (format)
1. Select the column in the columns list.
2. Click on the Display Type button (the Select Display Definition Type dialog will open)
3. Use the Display Type drop-down to select the new format.
4. Complete the options in the Display Definition Type dialog.
For more information on display types refer to Display Definitions.
Column Headings
Set the font family, size and color of the column headings.
Table Area
Set the font family, size and color of the table data.
Set the background color of the table area, the fill color of the primary and alternating table rows.
Table Style
Configure the fonts or colors of the table.
1.21 Scheduling a Report
Reports can be scheduled to run at a selected time or regular intervals. When the report runs, the results
are stored in the Snapshot database for fast retrieval. Use the Snapshot selector in the Parameters panel
to view available Snapshots.
The scheduler also runs the subscription facility, so the report will be emailed to all subscribers when
the schedule runs.
Setting a Schedule
In the Report Designer, click the Scheduling button in the Ribbon.
Note: A warning message will appear the first time a scheduling change is made. Any subsequent changes
made during the same session will not produce a warning message.
Configure the following settings in the Schedule dialog:
Next Run: Select the date and the time to begin running the schedule. A past date cannot be
selected, however, if a time is selected that has already passed when the report is saved, the
scheduler will execute immediately. For example, if the scheduled time is four hours in the past and
the schedule is set to hourly intervals, when the report is saved the scheduler will run four times in
succession.
Repeat: A schedule can be configured to execute only once, or at regular intervals.
Execute only once
Select Execute only once from the drop-down to run the report one time only.
Repeat execution
Select Repeat execution from the drop-down. The interval to repeat options will appear. Enter the
number to execute every (x) intervals, and select the interval:- Hours, Days, Weeks, Months or
Years. Select the "Run until" option:- Indefinite, or Until this date. If Until this date is selected, a
date selector will appear to set the end date.
Number of report results to keep: The number of report results to keep sets the maximum
number of completed executions to archive. Once this number is reached, the oldest execution will
be removed from the Snapshot database when a new one is added.
Status: The report will only run if the Active box is checked. To stop a schedule from running,
uncheck the Active box.
Related Topics
Report Designer
1.22 Workflow
The Workflow integration feature can be used to execute a SharePoint site workflow as part of
the report schedule.

To open the Workflow dialog:
1. Select Design in the Nintex Analytics Ribbon.
2. Click on Workflow.
3. Configure the workflow with the following settings:
Enabled: Tick to enable the workflow integration.
Site Workflows: Use the drop-down to select the Site Workflow to be attached. Note: Any
SharePoint site workflow may be attached, not only those created with Nintex Workflow 2010.
Run: Select one of the run options.
Once Per Schedule: The workflow will be executed once at the end of the report execution.
For Each Result: The workflow will be executed once for each record returned by the data set.
1.23 Report Listing
The Report Listing page lists all the reports available in the Report Center, including information about the
schedule, next run date, visibility in the Report Catalog and if the report is available as a watch report.
To access the Report Listing page:
1. Click on Site Actions and select the Nintex Analytics drop-down.
2. Click on List Global Reports to open the available global reports. Alternatively click on List Site
Reports to open the available site reports.
The Ribbon menu
New: Refer to New Report.
New Dashboard: Refer to New Dashboard.
Delete: Select to delete a report from the Report Center.
View Report: Select a report and click to view in the Report Center.
Create: To subscribe to a report or a dashboard refer to Subscribe to a Report or Subscribe a
Dashboard.
View: To view all subscriptions for a report or a dashboard refer to View All Subscriptions.
1.24 Display Definition Type
The Display Definitions page configures how the data is formatted in the chart and table.
Chart designer options
To format the data displayed in the chart:
1. Click on Design in the Nintex Analytics Ribbon. Hover over the chart area and click on Click to
Design.
2. Click the Data Settings tab.
3. Select the column that the format is to be applied to.
4. In the Properties section, click the Display Type button to open the Select Display Definition Type
dialog.
Select from the following options:
Date and Time: Display as Date and Time.
Duration: Display as Days, Hours, Minutes and Seconds.
File Size: Display in Bytes, KB, MB, GB or TB.
Number: Display as a number. Select the desired number format from the drop-down menu.
Text: Display as text. Use the Format String input box to add advanced string manipulation using C#
formatting syntax.
Table designer options
To format data displayed in the table:
1. Click on Design in the Nintex Analytics Ribbon. Hover over the table area and click on Click to
Design.
2. Click the Columns tab.
3. Select the column that the format is to be applied to.
4. In the Properties field, click the Display Type button to open the Select Display Definition Type
dialog.
Select from the following options:
Check Box: Select Boolean to display a check box, or Text to display yes or no.
Date and Time: Display as Date and Time.
Duration: Display as Days, Hours, Minutes and Seconds.
File Size: Display in Bytes, KB, MB, GB or TB.
Number: Display as a number. Select the desired number format from the drop-down menu.
Text: Display as text. Use the Format String input box to add advanced string manipulation
using C# formatting syntax.
Hyperlink: Use the Label Column Name input box to set the column information to display
as the hyperlink text. Use the URL Column Name to set the column containing the URL.
Person: Display as login account information. Set the following login account fields:
Email Column Name: Specify the column that contains the details to be shown in the
user presence display as the user's email address.
User Name Column Name: Specify the column that contains the details to be shown in
the user presence display as the user's name.
Display Name Column Name: Specify the column that contains the details to be
displayed in the table.
1.25 Subscribe to a Dashboard
The Nintex Analytics subscription service emails dashboard reports to subscribed users according to the
schedule specified in the dashboard subscription.
Subscribe to a Dashboard
Click on the Subscribe button in the Nintex Analytics Ribbon to subscribe to a report. The Subscription
dialog will display the following details and options:
Dashboard: The section displays the title of the Dashboard being subscribed to.
Email Format: Only embedded HTML format is available for Dashboards.
Users: By default the subscription will be for the current user. If the current user has permission to
subscribe other users, the Users input box will be active and additional users can be entered or
selected using the address book icon.
Next Run: Select the date and the time to begin running the schedule. A past date cannot be
selected, however, if a time is selected that has already passed when the subscription is saved, the
scheduler will execute immediately. For example, if the scheduled time is four hours in the past and
the schedule is set to hourly intervals, when the subscription is saved the scheduler will run four times
in succession.
Repeat: Enter the number to execute every (x) intervals, and select the interval - Hours, Days,
Weeks, Months or Years.
Unsubscribe from a Dashboard
Click on the Unsubscribe button to remove the subscription. The Unsubscribe button will only become
active if the current user has a subscription to the current dashboard.
Related Topics
Manage Subscriptions
Watch Reports
1.26 Dashboard Viewer
The Dashboard Viewer allows a user to view the Dashboard report, edit the properties and subscribe or
unsubscribe to receive the Dashboard report via email.
A Nintex Analytics Dashboard report is a page containing multiple reports and summary statistics, providing
an at-a-glance view of SharePoint activity.
Report Catalog
The Report Catalog appears on the left-hand side of the Report Viewer page. Use the Search box to locate
the desired report. To locate a report, type the name or partial name of the report required and select from
the options.
Alternatively, click on a category heading to expand that category and select a report. The current report
being viewed is highlighted in the catalog. If a description field has been completed for the report, a
description of the report will appear.
The Ribbon menu
New: The New button will be active if the current user has Report Center design permissions. A drop-
down menu can be used to select between a New Report or New Dashboard. Please refer to New
Report or New Dashboard.
Edit Properties: The Edit Properties button will be active if the current user has Report Center
design permissions. Please refer to Dashboard Properties.
Subscribe: The Subscribe button will appear active to indicate that the current user does not have a
subscription to the current dashboard. Click the button to receive the dashboard report via email.
Please refer to Subscribe to a Dashboard.
Unsubscribe: The Unsubscribe button will appear active to indicate that the current user has a
subscription to the current dashboard. Click the button to remove the subscription.
My Subscriptions: Please refer to Manage Subscriptions.
Related Topics
Create a New Dashboard
Create a New Report
Dashboard Properties
Subscribe to a Dashboard
Manage Subscriptions
Nintex Analytics Web Parts
1.27 Report Permissions
The Report Permissions feature assigns users permissions to the report. For more information about
Nintex Analytics and report permissions, please refer to Nintex Analytics Permission Levels.
Inherit Permissions
The default setting is for the report to inherit permissions from the Report Center Permissions.
If individual permissions have been assigned after clicking Stop Inheriting Permissions, clicking Inherit
Permissions will remove all individual permissions and revert back to inherited permissions.
Stop Inheriting Permissions
Click this button to display the User Picker and permissions selector to enable individual permissions to be
applied to this report.
Granting permissions
1. Click Permissions in the Nintex Analytics Ribbon.
2. Enter a User name. Note: If multiple User names are required, separate each name with a semi-
colon.
3. Click on the Check Names icon to validate names and select the desired login name from the
displayed matches. Alternatively, click Browse to use the SharePoint address book lookup function.
4. Click the Add button.
Note: By default the newly added users will not have any permissions.
5. For each user, or group of users, set the required permissions. These are detailed below:
Full Control: Access to all the following functions, plus the ability to set permissions for other
users.
Subscription Management: The ability to share report subscriptions with other people and
manage subscriptions from the report listing page.
Design: Access to create and design reports using the Report Designer.
View reports: Access to view the reports in the Report Center.
6. Click OK.
Removing permissions
1. Click the name to highlight the user or group.
2. Click Remove.
3. Click OK.
Related Topics
Permissions
Nintex Analytics Permission Levels
1.28 Permissions
The Report Permissions page assigns users permissions to the Report Center. The user will have
permissions to all reports in the Report Center, except for reports that have individual permissions. For
more information about Nintex Analytics and report permissions, please refer to Nintex Analytics
Permission Levels.
Granting permissions
1. Click Permissions in the Page Ribbon.
2. Enter a User name. Note: If multiple User names are required, separate each name with a semi-
colon.
3. Click on the Check Names icon to validate names and select the desired login name from the
displayed matches. Alternatively, click Browse to use the SharePoint address book lookup function.
4. Click the Add button.
Note: By default the newly added users will not have any permissions.
5. For each user, or group of users, set the required permissions. These are detailed below:
Full Control: Access to all the following functions, plus the ability to set permissions for other
users.
Subscription Management: The ability to share report subscriptions with other people and
manage subscriptions from the report listing page.
Design: Access to create and design reports using the Report Designer.
View reports: Access to view the reports in the Report Center.
6. Click OK.
Removing permissions
1. Click the name to highlight the user or group.
2. Click Remove.
3. Click OK.
Related Topics
Report Permissions
Nintex Analytics Permission Levels
1.29 Sorting
Use the Sorting button to arrange the sort order of the data returned by the Data Set.
Configuring Sort Order
1. Click on Design in the Nintex Analytics Ribbon.
2. Click Sorting.
3. The available columns in the Data Set will display in the Sorting dialog.
4. Select the sort order for the column to be sorted, in ascending or descending order using the drop-
down.
5. Adjust the position of the columns to the desired order using the up and down arrows. The top-most
column is the primary sort column. Each subsequent sorted column is a nested sort within the
preceding sort.
6. Click OK.
Note: Some Data Sets do not support different sort directions on individual columns. If this is the case, a
message will display. Changing the sort direction on any sorted columns will change the direction on all
other sorted columns.
Related Topics
Web Part Filters
1.30 Nintex Analytics Web Parts
Nintex Analytics Web Parts can be added to dashboard pages or other SharePoint Web Part pages.
The following Nintex Analytics Web Parts are available:
Chart Viewer: Displays a view of the selected report.
Summary Viewer: Displays a summary report.
Table Viewer: Displays a table view of the selected report.
Chart Viewer
The Chart Viewer Web Part displays the data from the report as a chart. If the source report is configured
with a chart, the settings from the reports' chart will be copied to the Chart Viewer Web Part. The Web Part
chart settings can then be configured to display different title, size, axis and style elements.
To add the Chart Viewer Web Part:
1. Navigate to the Dashboard report or SharePoint page the Web Part is to appear on.
2. Select the Page tab in the Ribbon. Click Edit Page. The Insert tab will appear, click the Insert tab and
select Web Part.
3. Select Nintex Analytics from the Categories section.
4. Select Chart Viewer from the Web Parts catalog.
5. Click Add. Select the Web Part and the Nintex Analytics - Nintex Report Viewer tab will appear.
6. Select Report in the Nintex Report Viewer Ribbon. Refer to Web Part Select Report for help selecting
a report.
7. Select the desired report and click Apply.
Once the report has been selected, configure the following settings as desired:
Filters: Apply a filter to the Web Part. Refer to Web Part Filters.
Page Size: The page size defaults to the reports' page size. This can be adjusted to suit the
size of the Web Part.
Max Rows: Max Rows defaults to the reports' maximum number of rows. This can be
adjusted to suit the size of the Web Part.
8. To view the Web Part data once the Web Parts configuration is completed, click the Page tab and
select Stop Editing.
Summary Viewer
The Summary Viewer Web Part can display the reports that are based on the following summary statistics
data sets; SharePoint Implementation Summary Statistics, IT Manager Summary Statistics, Organizational
Collaboration Summary Statistics, Document Usage Summary Statistics, Search Usage Summary
Statistics, Key System Measures Summary Statistics and Usage for Specified Site Summary Statistics.
To add the Summary Viewer Web Part:
1. Navigate to the Dashboard report or SharePoint page the Web Part is to appear on.
2. Select the Page tab in the Ribbon. Click Edit Page. The Insert page will appear, click the Inset
tab and select Web Part.
3. Select Nintex Analytics from the Categories section.
4. Select Summary Viewer from the Web Parts catalog.
5. Click Add. Select the Web Part and the Nintex Analytics - Nintex Report Viewer tab will appear.
6. Select Report in the Nintex Report Viewer Ribbon. Refer to Web Part Select Report for help selecting
a report.
7. Select a report based on a summary statistics Data Set and click Apply.
8. To view the Web Part data once the Web Parts configuration is completed, click the Page tab and
select Stop Editing.
Note: Filters, Page Size, Max Rows do not apply to this type of report.
Table Viewer
The Table Viewer Web Part displays the data from the report as a table. If the source report is configured
with a table, the settings from the reports' table will be copied to the Web Part table. The Web Part table
settings can then be reconfigured.
To add the Table Viewer Web Part:
1. Navigate to the Dashboard report or SharePoint page the Web Part is to appear on.
2. Select the Page tab in the Ribbon. Click Edit Page. The Insert tab will appear, click the Insert tab and
select Web Part.
3. Select Nintex Analytics from the Categories section.
4. Select Table Viewer from the Web Parts catalog.
5. Click Add. Select the Web Part and the Nintex Analytics - Nintex Report Viewer tab will appear.
6. Select Report in the Nintex Report Viewer Ribbon. Refer to Web Part Select Report for help selecting
a report.
7. Select the desired report and click Apply.
Once the report has been selected, configure the following settings as desired:
Filters: Apply a filter to the Web Part. Refer to Web Part Filters.
Page Size: The page size defaults to the reports' page size. This can be adjusted to suit the
size of the Web Part.
Max Rows: Max Rows defaults to the reports' maximum number of rows. This can be
adjusted to suit the size of the Web Part.
8. To view the Web Part once the Web Parts configuration is completed, click the Page tab and
select Stop Editing.
Related Topics
Watch Feature
1.31 Web Part Select Report
Use the Select Report function to configure the report that will be displayed in a Chart, Table, or Summary
Viewer Web Part. The Select Report dialog displays all saved reports within the SharePoint farm for which
the current user has Viewer permissions or greater.
Select Report
To select a report for a Web Part:
1. Browse the list of reports or use the search bar at the top left corner. Selecting a report will display a
preview of the chart and table with sample data.
2. Once the report has been selected, click Apply.
1.32 Web Part Filters
Filters can be used to limit the data returned from the Data Set based on column values.
Configure a Filter in a Report Viewer Web Part
1. Navigate to a SharePoint page that has a Nintex Analytics web part.
2. Open Site Actions and click on Edit Page.
3. Click Web Part in the Editing Tools - Insert Ribbon.
4. In SharePoint page edit mode, click on the web part title.
5. Click on Filters in the Nintex Report Viewer Ribbon.
6. Click on the link Click here to add filter rule.
7. Use the drop-down menu to select the column to filter.
8. Select an argument: equal to, not equal to, greater than, greater than or equal to, less than, or less
than or equal to.
9. Enter the value to compare the data to.
Note: Multiple filter rules can be added and combined with and/or statements.
10. To edit or delete a filter rule, click the link next to the filter rule. Click Stop Editing in the SharePoint
page menu Ribbon.
Related Reports
Nintex Analytics Web Parts
1.33 Dashboard Properties
Use the Edit Properties dialog to configure the display name, description, catalog category, icon and
visibility of a dashboard in the Report Catalog.
Edit Properties Dialog
To open the Edit Properties dialog, click on Edit Properties in the Nintex Analytics Ribbon. The Edit
Properties button will only display if the current user has design permissions to the report center.
Name: The Dashboard name that will display in the Report Catalog.
Note: Changing the Dashboard name after the Dashboard was created will only change the display
name in the Report Catalog. The actual page name in the SharePoint Document Library and the URL
will remain as the originally created Dashboard name.
Description: An optional section where a dashboard description can be entered.
Category: The category in which to display the Dashboard in the Report Catalog.
Note: The Watch category is used when configuring watch reports. This category will only appear when
the Watch Report Feature is activated. Please refer to Watch Report Feature for more information.
Icon: The Dashboard icon displayed in the Report Catalog. Click on the image to select a default or
custom image. The default images include a bar, line, pie or table chart. Alternatively, enter a custom
image URL. Note: Only png or jpg images will be supported.
Navigation: Tick the Visible box to display the Dashboard in the Report Catalog at run time. If
Visible is not ticked, the Dashboard will still be visible in the Report Catalog in design mode and via
the Report Listing page. See Report Listing.
Related Topics
Watch Report Feature
Report Listing
Report Properties
1.34 Watch Feature
The Nintex Analytics Watch feature allows users to watch a document or sites' activity and receive a
report on that activity. Follow the steps below to activate the Nintex Analytics Watch feature.
Note: An error will occur when activating the Nintex Analytics Watch Feature, if you are in a SharePoint
2010 Claims Authentication environment, on a sub site and logged in as the system account. To remedy
this login as a non-system account user.
Activate Watch Feature
To activate the watch report feature:
1. Navigate to the desired SharePoint Site.
2. Select Site Actions and click Site Settings.
3. Click Manage site features in the Site Actions section.
4. Locate the Nintex Analytics Watch heading and click Activate.
Note: Nintex Analytics provides two watch reports out-of-the box; Watch this Site and Watch this
Document. These are only visible when the report center is in design mode or when accessed from the Site
Report Center Listing. To create a new watch report refer to Create a Watch Report.
Deactivate Watch Feature
Warning: Deactivating the Watch feature on a site deletes all of the current watch subscriptions on the site.
To deactivate the watch report feature:
1. Navigate to the desired SharePoint Site.
2. Select Site Actions and click Site Settings.
3. Click Manage site features in the Site Actions section.
4. Locate the Nintex Analytics Watch heading and click Deactivate.
Related Topics
Create a Watch Report
Scheduling a Watch Report
Watch a Document
Watch a Site
Table Designer
Dashboard Viewer
Display Definition Type
1.35 View All Subscriptions
The View All Subscriptions dialog lists all of the users subscribed to the selected report or
dashboard, and the email format of the subscription.
Unsubscribe a user
To unsubscribe a user from a report or dashboard:
1. Open Site Actions. Select Nintex Analytics and click on List Global Reports.
2. Highlight the report where the user is to be unsubscribed from.
3. Click on View in the Subscriptions group.
4. Select the user subscription from the list.
5. Click Unsubscribe in the Ribbon.
6. Click OK.
7. Click Close.
Related Topics
Subscribe to a Report
Subscribe to a Dashboard
1.36 Tokens and Functions
Tokens and functions can be used to create dynamic elements within a report title, or as default values for
Parameters.
Tokens
Tokens are a simplified function syntax designed to make inserting common Nintex Analytics system
elements easier.
Dates
Time Period Description Token
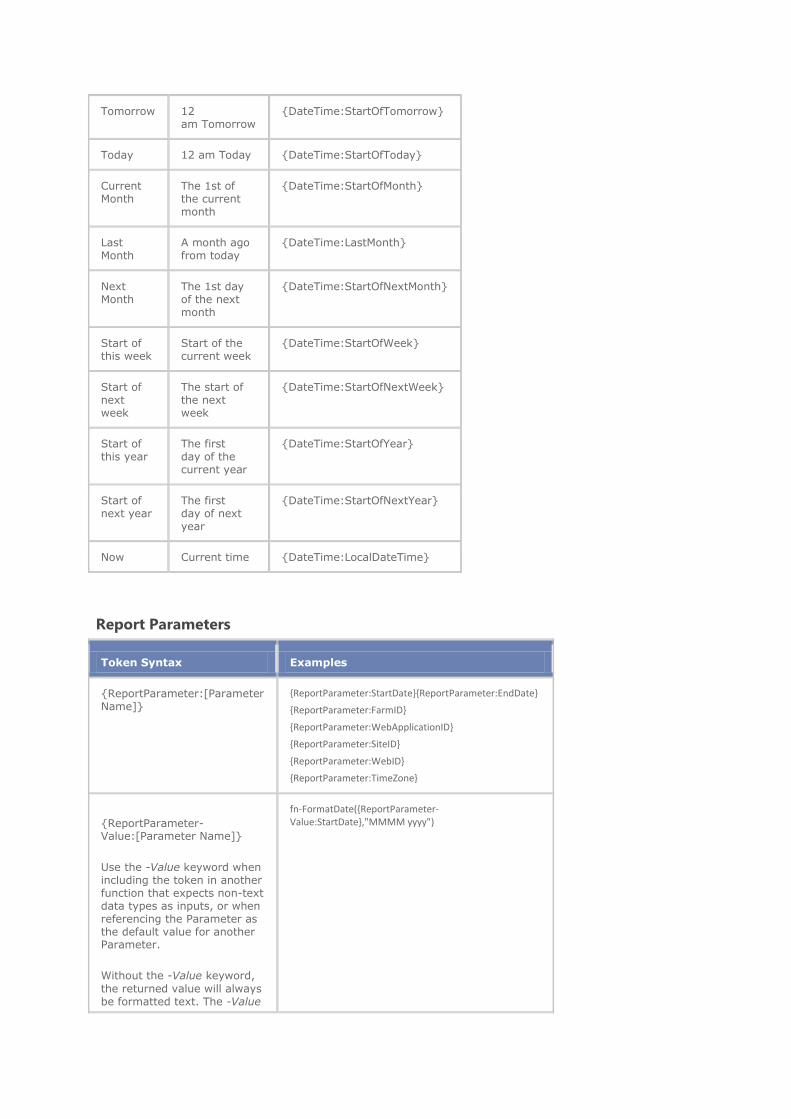
Tomorrow 12 am Tomorrow
{DateTime:StartOfTomorrow}
Today 12 am Today {DateTime:StartOfToday}
Current Month
The 1st of the current month
{DateTime:StartOfMonth}
Last Month
A month ago from today
{DateTime:LastMonth}
Next Month
The 1st day of the next month
{DateTime:StartOfNextMonth}
Start of this week
Start of the current week
{DateTime:StartOfWeek}
Start of next week
The start of the next week
{DateTime:StartOfNextWeek}
Start of this year
The first day of the current year
{DateTime:StartOfYear}
Start of next year
The first day of next year
{DateTime:StartOfNextYear}
Now Current time {DateTime:LocalDateTime}
Report Parameters
Token Syntax Examples
{ReportParameter:[Parameter Name]}
{ReportParameter:StartDate}{ReportParameter:EndDate}
{ReportParameter:FarmID}
{ReportParameter:WebApplicationID}
{ReportParameter:SiteID}
{ReportParameter:WebID}
{ReportParameter:TimeZone}
{ReportParameter-Value:[Parameter Name]}
Use the -Value keyword when including the token in another function that expects non-text data types as inputs, or when referencing the Parameter as the default value for another Parameter.
Without the -Value keyword,
the returned value will always be formatted text. The -Value
fn-FormatDate({ReportParameter-Value:StartDate},"MMMM yyyy")
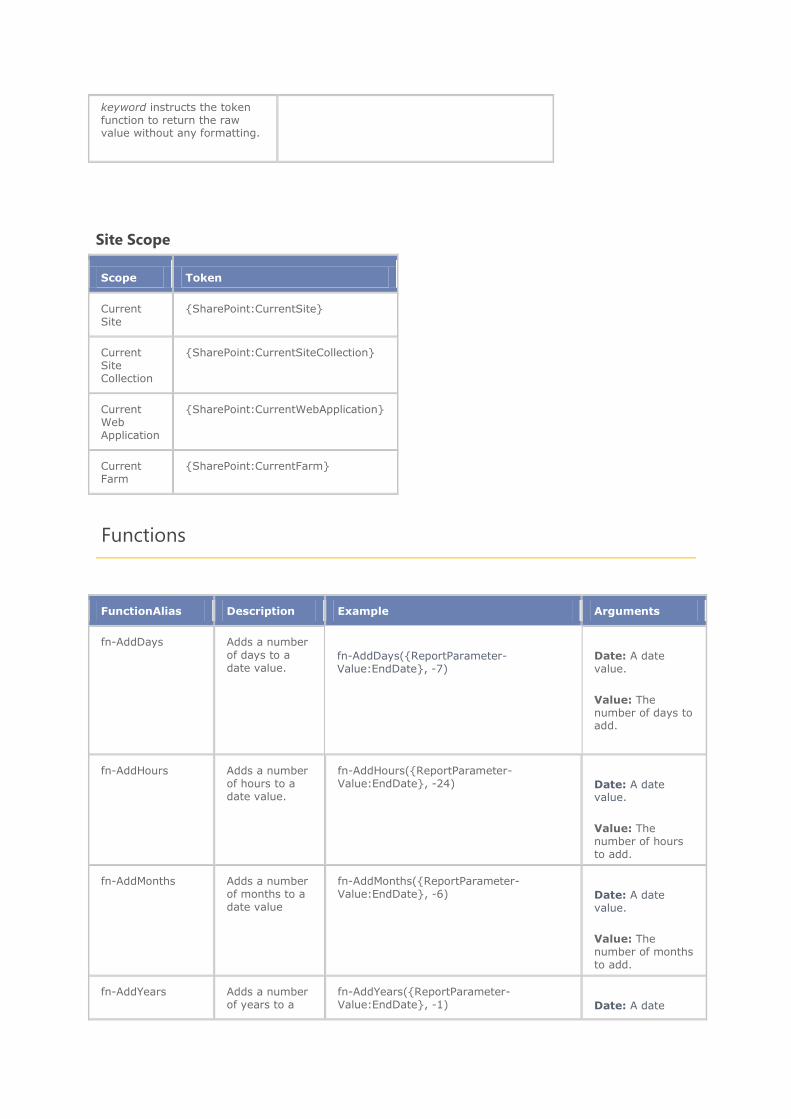
keyword instructs the token function to return the raw value without any formatting.
Site Scope
Scope Token
Current Site
{SharePoint:CurrentSite}
Current Site Collection
{SharePoint:CurrentSiteCollection}
Current Web Application
{SharePoint:CurrentWebApplication}
Current Farm
{SharePoint:CurrentFarm}
Functions
FunctionAlias Description Example Arguments
fn-AddDays Adds a number
of days to a date value.
fn-AddDays({ReportParameter-Value:EndDate}, -7)
Date: A date value.
Value: The number of days to add.
fn-AddHours Adds a number of hours to a date value.
fn-AddHours({ReportParameter-Value:EndDate}, -24) Date: A date
value.
Value: The number of hours to add.
fn-AddMonths Adds a number of months to a date value
fn-AddMonths({ReportParameter-Value:EndDate}, -6) Date: A date
value.
Value: The number of months to add.
fn-AddYears Adds a number of years to a
fn-AddYears({ReportParameter-Value:EndDate}, -1) Date: A date
date value value.
Value: The number of years to add.
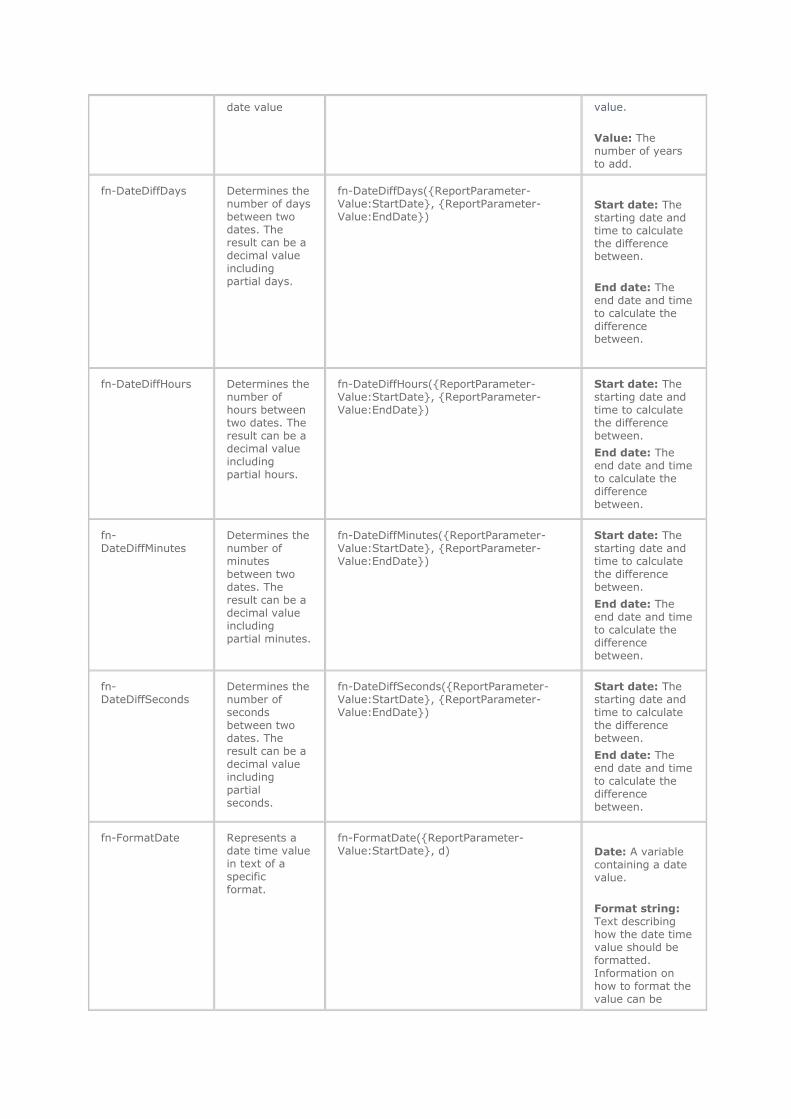
fn-DateDiffDays Determines the number of days between two dates. The result can be a decimal value including partial days.
fn-DateDiffDays({ReportParameter-Value:StartDate}, {ReportParameter-Value:EndDate})
Start date: The starting date and time to calculate the difference between.
End date: The end date and time to calculate the difference between.
fn-DateDiffHours Determines the number of hours between two dates. The result can be a decimal value including partial hours.
fn-DateDiffHours({ReportParameter-Value:StartDate}, {ReportParameter-Value:EndDate})
Start date: The starting date and time to calculate the difference between.
End date: The end date and time to calculate the difference between.
fn-DateDiffMinutes
Determines the number of minutes between two dates. The result can be a decimal value including partial minutes.
fn-DateDiffMinutes({ReportParameter-Value:StartDate}, {ReportParameter-Value:EndDate})
Start date: The starting date and time to calculate the difference between.
End date: The end date and time to calculate the difference between.
fn-DateDiffSeconds
Determines the number of seconds between two dates. The result can be a decimal value including partial seconds.
fn-DateDiffSeconds({ReportParameter-Value:StartDate}, {ReportParameter-Value:EndDate})
Start date: The starting date and time to calculate the difference between.
End date: The end date and time to calculate the difference between.
fn-FormatDate Represents a date time value in text of a specific format.
fn-FormatDate({ReportParameter-Value:StartDate}, d) Date: A variable
containing a date value.
Format string: Text describing how the date time value should be formatted. Information on how to format the value can be
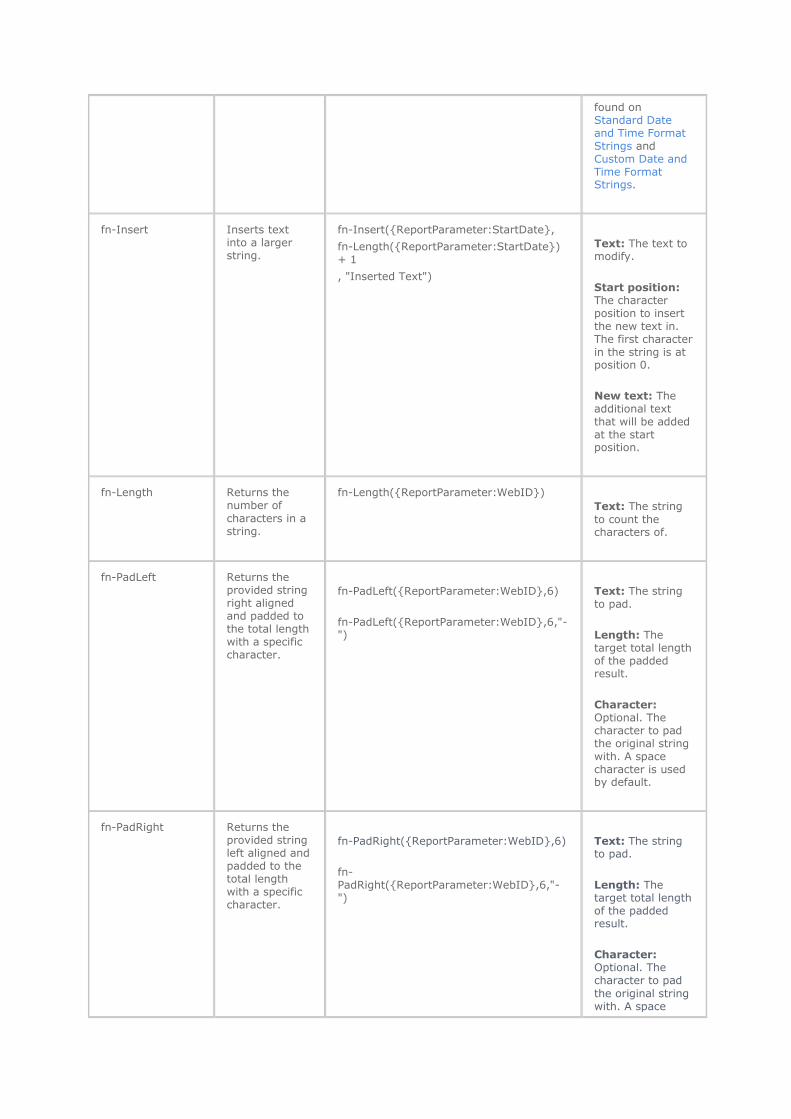
found on Standard Date and Time Format Strings and Custom Date and Time Format Strings.
fn-Insert Inserts text into a larger string.
fn-Insert({ReportParameter:StartDate},
fn-Length({ReportParameter:StartDate}) + 1
, "Inserted Text")
Text: The text to modify.
Start position: The character position to insert the new text in. The first character in the string is at position 0.
New text: The additional text that will be added at the start position.
fn-Length Returns the number of
characters in a string.
fn-Length({ReportParameter:WebID})
Text: The string
to count the characters of.
fn-PadLeft Returns the provided string right aligned and padded to the total length with a specific character.
fn-PadLeft({ReportParameter:WebID},6)
fn-PadLeft({ReportParameter:WebID},6,"-")
Text: The string to pad.
Length: The target total length of the padded result.
Character: Optional. The character to pad the original string with. A space character is used by default.
fn-PadRight Returns the provided string left aligned and padded to the total length with a specific character.
fn-PadRight({ReportParameter:WebID},6)
fn-PadRight({ReportParameter:WebID},6,"-")
Text: The string to pad.
Length: The target total length of the padded result.
Character: Optional. The character to pad
the original string with. A space
character is used by default.
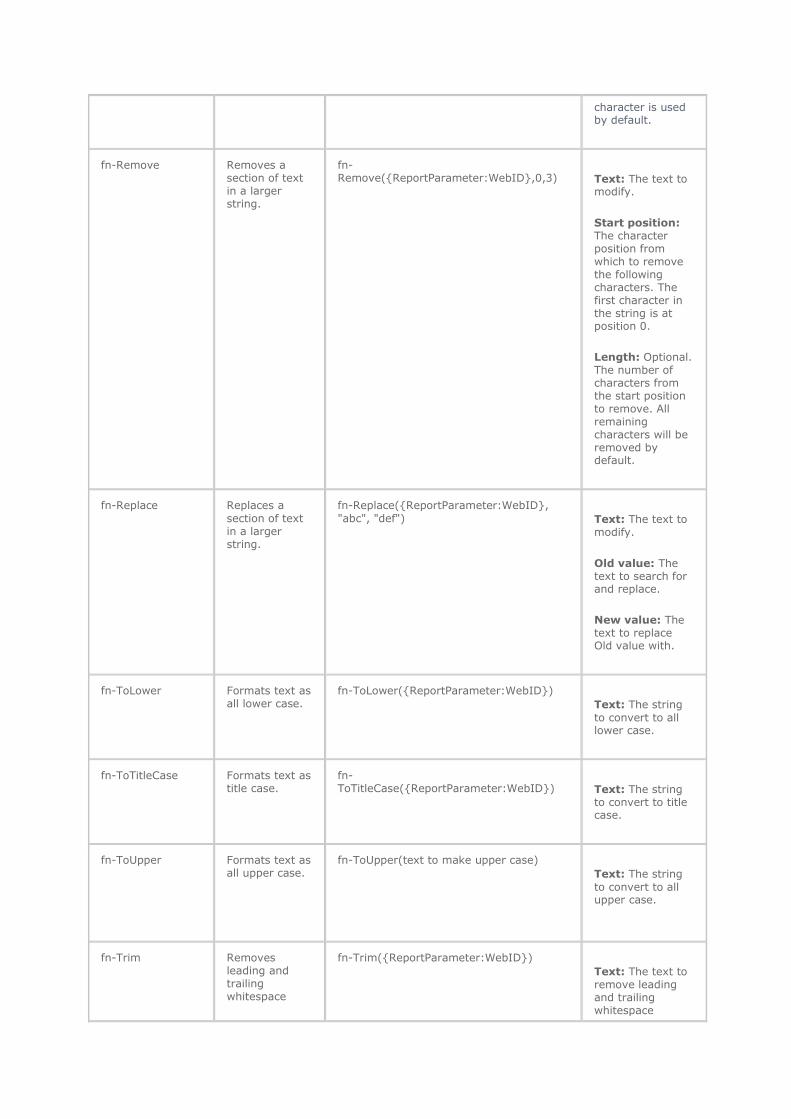
fn-Remove Removes a section of text in a larger string.
fn-Remove({ReportParameter:WebID},0,3) Text: The text to
modify.
Start position: The character position from which to remove the following characters. The first character in the string is at position 0.
Length: Optional. The number of characters from the start position to remove. All remaining characters will be removed by default.
fn-Replace Replaces a
section of text in a larger string.
fn-Replace({ReportParameter:WebID},
"abc", "def") Text: The text to modify.
Old value: The text to search for and replace.
New value: The text to replace Old value with.
fn-ToLower Formats text as all lower case.
fn-ToLower({ReportParameter:WebID})
Text: The string
to convert to all lower case.
fn-ToTitleCase Formats text as title case.
fn-ToTitleCase({ReportParameter:WebID}) Text: The string
to convert to title case.
fn-ToUpper Formats text as all upper case.
fn-ToUpper(text to make upper case)
Text: The string
to convert to all upper case.
fn-Trim Removes leading and trailing whitespace
fn-Trim({ReportParameter:WebID})
Text: The text to remove leading and trailing whitespace
from a string. characters from.
1.37 Subscription Email
Notification emails can be sent to report subscribers when changes are made that effect the frequency
of the report schedule or if the report has been deleted.
Report Schedule Change Notification
To send an email to notify subscribers of a report schedule change:
1. Check the Send email to notify all subscribers of changes box.
2. Edit the email message in the text box. The title of the email will be acquired from the subscription
template.
Report Delete Confirmation
To send an email to notify subscribers that a report has been deleted:
1. Check the Send email to notify all subscribers of changes box.
2. Edit the email message in the text box. The title of the email will be acquired from the subscription
template.
1.38 Dashboard Export
Export a Web Parts report data into PDF, Excel or oData format.
To export a Web Parts report data
1. Navigate to a Dashboards report page.
2. Click on a Web Part.
3. The Nintex Analytics Export Ribbon tab will appear.
4. Select either Export to Excel or Export to PDF in the Ribbon.
Export to Excel: The data will be exported in either XML or oData Format.
Export to PDF: The data will be exported in PDF format. Note: When exporting a Web Parts data to
PDF, the graph will not be exported.
Related Topics
oData Export
1.39 Watch a Document
The Nintex Analytics Watch feature allows users to watch a document or sites' activity and receive a
report on that activity. Follow the steps below to watch a document.
Watch a Document
To receive an email about the audit activity on a document:
1. Navigate to a document in a document library.
2. Click the drop-down next to the document name and select Watch this document from the menu.
3. Select the desired watch report in the Report field. Note: If a description of the watch report is
available, it will located under the Report field.
4. Select the desired Email Format and click OK to confirm the subscription.
If a document is selected that the user is already subscribed to, the dialog will display the message "You
are already watching this document". To unsubscribe from watching this document refer to Manage
Subscriptions. If a different watch report is desired, you must unsubscribe from the current subscription and
repeat the steps above to watch a document.
Note: If the available watch reports are not suitable, please contact your administrator.
Unsubscribe to a Watch Subscription
To unsubscribe to a watch subscription:
1. Click on the My Subscriptions button on the Nintex Analytics home page or report page, or use the
SharePoint current user menu and select Manage Subscriptions.
2. Select the report that you want to unsubscribe from.
3. Click the Unsubscribe button in the Ribbon.
4. Click OK.
Related Topics
Watch Feature
Create a Watch Report
Manage Subscriptions
Watch a Site
Scheduling a Watch Report
1.40 Watch a Site
The Nintex Analytics Watch feature allows users to watch a document or sites' activity and receive a
report on that activity. Follow the steps below to watch a site.
Watch a Site
To receive an email about the activity in a site:
1. Navigate to the site in SharePoint.
2. Click on the SharePoint Site Actions drop-down menu.
3. Select Nintex Analytics and click on Watch Site.
4. Select the desired report in the Report field. Note: If a description of the watch report is available,
it will be located under the Report field.
5. Select the desired Email Format and click OK to confirm the subscription.
If a site is selected that the user is already subscribed to, the dialog will display the message "You are
already watching this site". To unsubscribe from watching this site refer to Manage Subscriptions. If a
different watch report is desired, you must unsubscribe from the current subscription and repeat the steps
above to watch a site.
Note: If the available reports are not suitable, please contact your administrator.
Unsubscribe to a Watch Subscription
To unsubscribe to a watch subscription:
1. Click on the My Subscriptions button on the Nintex Analytics home page or report page, or use the
SharePoint current user menu and select Manage Subscriptions.
2. Select the report that you want to unsubscribe from.
3. Click the Unsubscribe button in the Ribbon.
4. Click OK.
Related Topics
Watch Feature
Create a Watch Report
Manage Subscriptions
Watch a Document
Scheduling a Watch Report
1.41 Scheduling a Watch Report
The Nintex Analytics Watch feature allows users to watch a document or sites' activity and receive a
report on that activity.
Watch reports can be scheduled to run at hourly, daily, weekly or monthly intervals. An email will be sent to
subscribers every time the watched report is run.
Scheduling a Watch Report
To schedule a watch report:
1. Open any report and click on Design in the Nintex Analytics 2010 Ribbon to display the Watch Category
in the Report Catalog.
2. Select the desired watch report. Note: Once selected, the watch report will automatically revert back to
view mode, click on Design again to edit the watch report schedule.
3. Click on the Scheduling button in the Ribbon.
4. Select one of the following options.
Hours: An email will be sent each hour that the report is set to run.
Days: An email will be sent at 12am each day.
Weeks: The timing of the weekly email is dependent on the culture of your SharePoint settings.
Months: An email will be sent at 12am on the first day of each month.
5. Click OK.
Note: When scheduling a watch report, it is recommended that the watch report title includes the settings of
the watch report, such as the report schedule. Use the Edit Properties button in the Nintex Analytics 2010
Ribbon to edit the name and description of the watch report.
Related Topics
Watch Feature
Watch a Site
Watch a Document
1.42 Create a Watch Report
The Nintex Analytics Watch feature allows users to watch a document or sites' activity and receive a
report on that activity. Follow the steps below to create a new watch report which users can then subscribe
to in order to watch a Site or a Document. The Watch Feature must be activated before a new watch
report is created.
Watch reports can only be configured in the Site Report Center, which must be activated. If the Site Report
Center is not activated on your environment, the default Site Report Center watch reports will be used.
Creating a New Watch Report
A new watch report can only be created using the Audit Events Data Set. Once the Audit Events data set
has been selected, the watch report can be configured to return different columns, as well as to run on a
daily, weekly or monthly schedule.
To create a new report for watching a document:
1. Select New in the Nintex Analytics 2010 Ribbon and then click New in the drop-down menu.
2. Select the Table Only Layout from the layouts provided and enter the Report Name.
Note: The report name will display in the subscriptions drop-down when a user selects "Watch this
document".
3. Select the Design button in the Ribbon.
4. Click the Select Data button in the Ribbon and select Audit Events. Click Apply.
5. Click the Edit Properties button in the Ribbon. Select Watch in the Category field.
6. Click the Schedule button to configure how frequently the watch report should be run. Select hours,
days, weeks or months.
Note: To configure the table columns and display configurations, place the mouse over the table in design
mode and select Click to design. This will open the table designer.
To create a new report for watching a site:
1. Select New in the Nintex Analytics 2010 Ribbon and then click New Dashboard in the drop-down
menu.
2. Type in a Dashboard name and click OK.
3. Click the Edit Properties button in the Ribbon and select Watch in the Category field.
4. Add Web Parts to the dashboard report as required. Refer to Nintex Analytics Web Parts for more
information on designing a dashboard.
Note: The watch reports are only visible when the report center is in design mode or when accessed from
the Site Report Center Listing.
Once the Watch Report Feature has been activated, the Watch category will appear in the Report Catalog
in design mode. However, when a Watch report is selected from the Report Catalog the screen will return
to view mode. To edit the properties or view the Watch report, click on Design in the Nintex Analytics
Ribbon.
When creating a new watch report, it is recommended that the watch report title includes the settings of the
watch report, such as the report schedule. Use the Edit Properties button in the Nintex Analytics 2010
Ribbon to edit the name and description of the watch report.
Editing a Watch Report
Edit a watch reports' schedule, parameters, available columns and table style.
To edit a watch report:
1. Click on the Site Actions menu. Select Nintex Analytics and click on List site reports.
2. Select the watch report that is to be edited and click View Report in the Nintex Analytics 2010
Ribbon.
3. Click on Design in the Ribbon.
4. Edit the report as required.
Related Topics
Watch a Document
Watch a Site
Watch Feature
Scheduling a Watch Report
1.43 Nintex Analytics Permission Levels
The Nintex Analytics Permission Level page provides more detailed information on how Nintex Analytics
permissions operate.
Understanding how permissions work in Nintex Analytics
The Nintex Analytics security model is based on SharePoint and uses SharePoint permission levels for
permission management.
Note: To read about SharePoint security, refer to Security and Authentication for SharePoint Server 2010
on Microsoft TechNet.
When a Report Center (either Global or Site) is activated, Nintex Analytics will create (if not already
present) a set of predefined permission levels at the site collection which are used to manage all
permissions. The permissions levels are shared between all Report Centers within the site collection.
When a Report Center is activated, Nintex Analytics creates a SharePoint document library which stores
the reports and dashboards, and is also used to store permissions. On creation of the library, permissions
are inherited from the parent site. This allows Nintex Analytics to manage the Report Center’s permissions
independently of the site and allows access to the Report Center or individual reports without impacting the
site’s existing permissions.
On activation of a Report Center, only the current user is granted Full Control over the Report Center. The
user can then modify the Report Center’s permission and grant other users access.
Note: Site Collection administrators are granted Full Control automatically through web application user
policies.
Access granted to these accounts is in line with standard SharePoint security.
Important:
It is strongly recommended that the permission levels created by Nintex Analytics are not modified. Any
changes to these permission levels may result in unexpected behavior for all Report Centers with their
scope.
Note:
If you have broken permission level inheritance within a site collection, Nintex Analytics will detect this and
create the permission levels at the site where the permission levels were created.
SharePoint Group Limitations
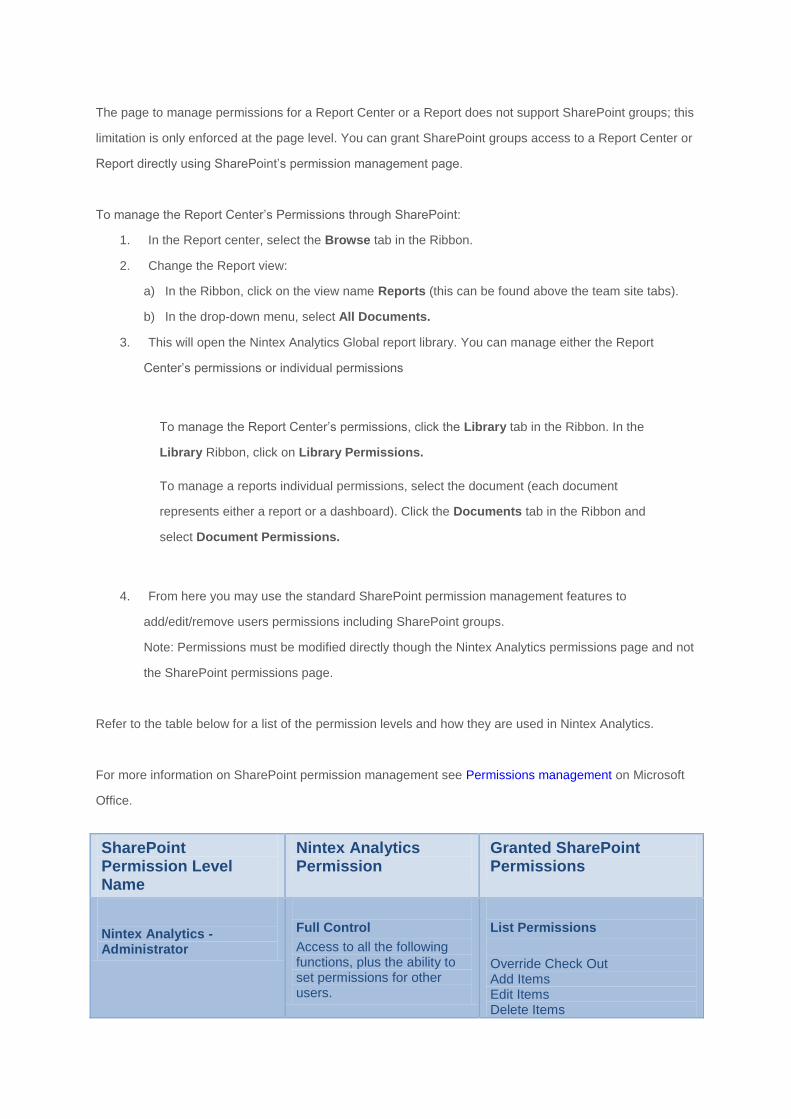
The page to manage permissions for a Report Center or a Report does not support SharePoint groups; this
limitation is only enforced at the page level. You can grant SharePoint groups access to a Report Center or
Report directly using SharePoint’s permission management page.
To manage the Report Center’s Permissions through SharePoint:
1. In the Report center, select the Browse tab in the Ribbon.
2. Change the Report view:
a) In the Ribbon, click on the view name Reports (this can be found above the team site tabs).
b) In the drop-down menu, select All Documents.
3. This will open the Nintex Analytics Global report library. You can manage either the Report
Center’s permissions or individual permissions
To manage the Report Center’s permissions, click the Library tab in the Ribbon. In the
Library Ribbon, click on Library Permissions.
To manage a reports individual permissions, select the document (each document
represents either a report or a dashboard). Click the Documents tab in the Ribbon and
select Document Permissions.
4. From here you may use the standard SharePoint permission management features to
add/edit/remove users permissions including SharePoint groups.
Note: Permissions must be modified directly though the Nintex Analytics permissions page and not
the SharePoint permissions page.
Refer to the table below for a list of the permission levels and how they are used in Nintex Analytics.
For more information on SharePoint permission management see Permissions management on Microsoft
Office.
SharePoint Permission Level Name
Nintex Analytics Permission
Granted SharePoint Permissions
Nintex Analytics - Administrator
Full Control
Access to all the following functions, plus the ability to set permissions for other users.
List Permissions
Override Check Out Add Items
Edit Items
Delete Items
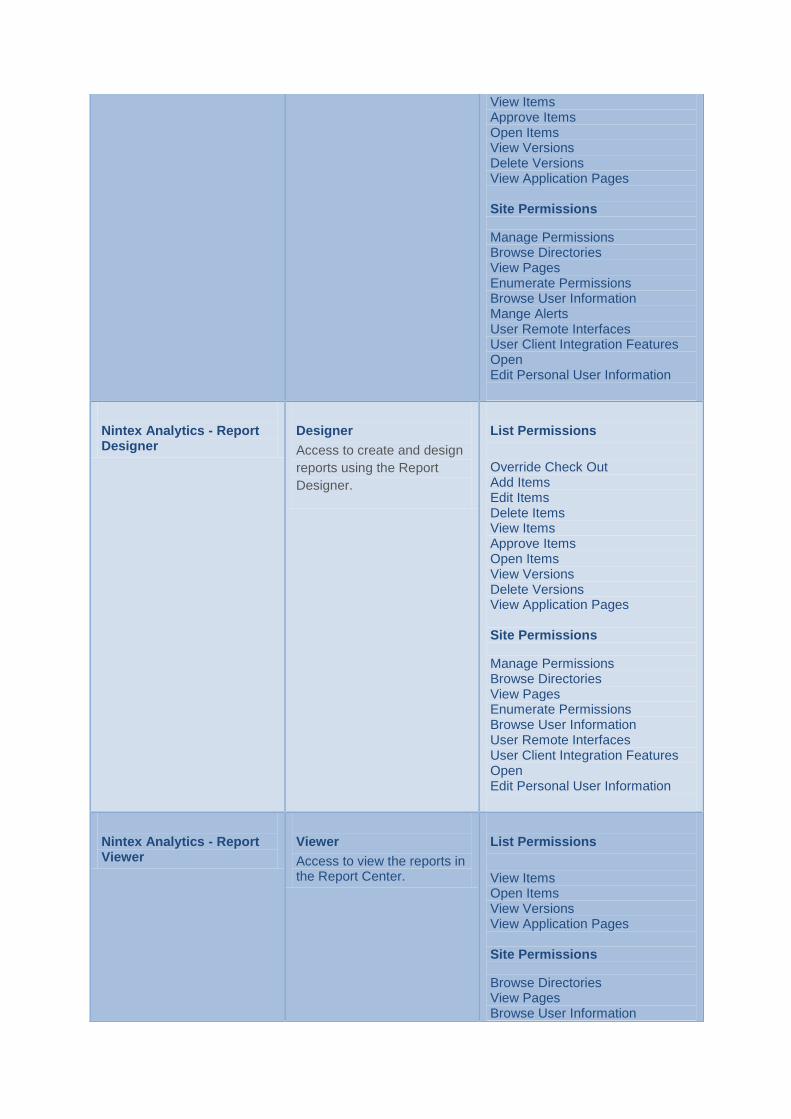
View Items Approve Items
Open Items
View Versions
Delete Versions
View Application Pages
Site Permissions
Manage Permissions
Browse Directories
View Pages
Enumerate Permissions
Browse User Information
Mange Alerts
User Remote Interfaces
User Client Integration Features
Open
Edit Personal User Information
Nintex Analytics - Report Designer
Designer
Access to create and design
reports using the Report
Designer.
List Permissions
Override Check Out Add Items
Edit Items
Delete Items View Items Approve Items
Open Items
View Versions
Delete Versions
View Application Pages
Site Permissions
Manage Permissions
Browse Directories
View Pages
Enumerate Permissions
Browse User Information
User Remote Interfaces
User Client Integration Features
Open
Edit Personal User Information
Nintex Analytics - Report Viewer
Viewer
Access to view the reports in the Report Center.
List Permissions
View Items Open Items
View Versions
View Application Pages
Site Permissions
Browse Directories
View Pages
Browse User Information
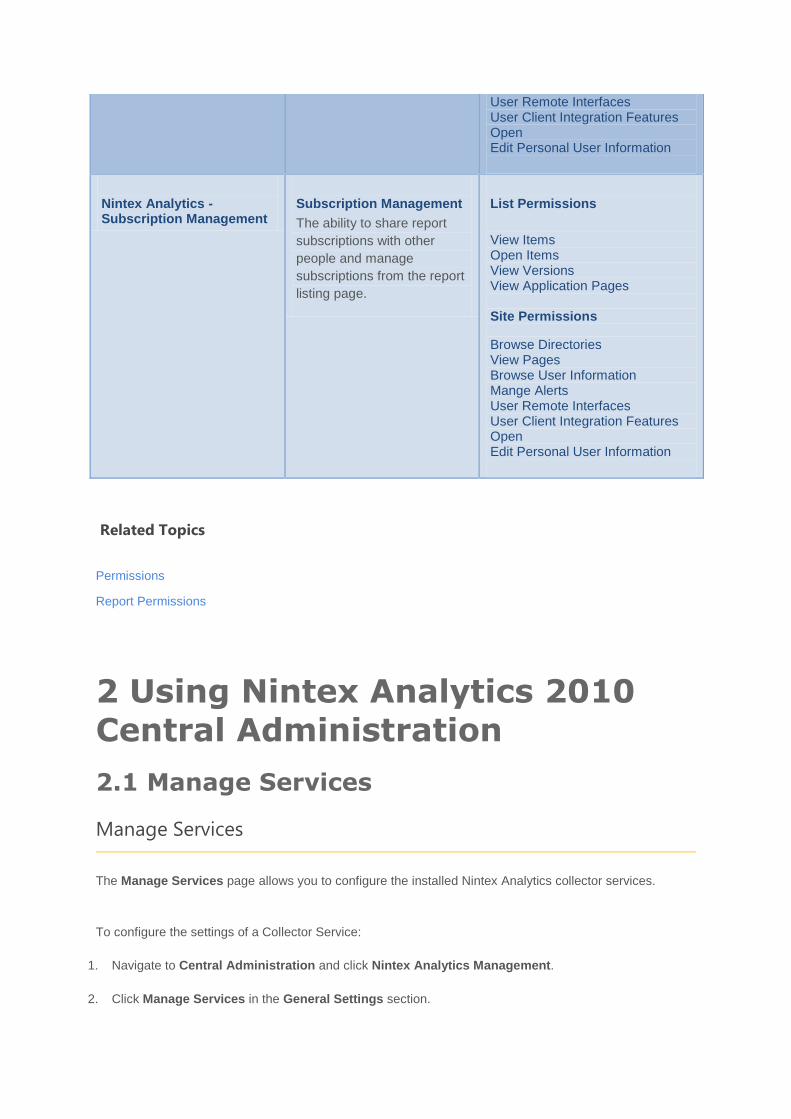
User Remote Interfaces
User Client Integration Features
Open
Edit Personal User Information
Nintex Analytics - Subscription Management
Subscription Management
The ability to share report
subscriptions with other
people and manage
subscriptions from the report
listing page.
List Permissions
View Items Open Items
View Versions
View Application Pages
Site Permissions
Browse Directories
View Pages
Browse User Information
Mange Alerts
User Remote Interfaces
User Client Integration Features
Open
Edit Personal User Information
Related Topics
Permissions
Report Permissions
2 Using Nintex Analytics 2010 Central Administration
2.1 Manage Services
Manage Services
The Manage Services page allows you to configure the installed Nintex Analytics collector services.
To configure the settings of a Collector Service:
1. Navigate to Central Administration and click Nintex Analytics Management.
2. Click Manage Services in the General Settings section.
3. Select the Service from the list.
4. Click Settings in the Management Ribbon.
Note: There are no Settings available for the Data Management Service.
Configuring an Active Directory Collector Service
If the Active Directory Collector Service is installed, then in the SharePoint Server Collector
Service settings, the Enable User Profile Collector should be unticked. Active Directory is
completely scanned by this service - there is no change log that can be scanned to reduce this task.
Run indexing every x hours: The frequency to check Active Directory for changes. 24 hours is the
default. If your organization experiences lots of user account changes on an average day, increasing this
frequency may be desirable.
Process x users per batch: The number of user changes to process at a time. 5 is the default. If you have
a large number of user accounts, you may want to increase the batch size to 100 or 200.
Configuring a Data Management Service
There are no settings available for the Data Management Service.
Configuring a Performance Collector Service
The Performance Collector Service configuration lists the configured Performance Monitor counters.
To add a performance counter:
1. Provide a Watch name for the performance counter, this will display a selection for the Performance
Watch Counter parameters.
2. Select a performance category from the drop down. These have been populated from the server.
3. Depending on the category selected, select the instance to monitor and the related counter.
Categories without instances cannot be processed by the performance collector service.
4. Enter the sample rate in seconds to record the performance counter. This must be greater than 30
seconds.
5. Enter the number of seconds to record an average of the performance counter. This must be greater
than 30 seconds.
6. Click Add Counter.
7. Click Close.
To delete a performance counter:
1. Click the delete link next to the counter.
2. Click OK.
3. Click Close.
Configuring a SharePoint Foundation Collector Service
Common settings
The SharePoint Foundation Collector Service can be scheduled to run between a start time and an end
time, or it can run continuously.
Choose the Run continuously option to keep the report data current.
Note: If performance is a concern it is recommended that the service is run outside of business hours.
SharePoint Crawler Settings
Maximum threads: The number of processes used for the SharePoint Crawler. To use the maximum
number of processes available less one, enter -1. This has a similar effect to installing multiple SharePoint
Foundation Collector services for more processing, but increases the load without load-balancing.
Record Changes: This is used as a diagnostic tool and is turned off by default for performance due to
extra logging. Turning it on will maintain a history of dimension attributes.
Batch Change Size: The number of records to process at a time. Increase this value if the System Status
page shows that the Collection date is not current.
Sleep Time Span (milliseconds): Number of milliseconds to wait after the batch has been processed
before starting again. This allows some processing time to send the information to the database.
Enable file version crawling: Select no to disable crawling the file version history data. By default, this
feature is enabled. Note: This feature can only be applied globally and is not site specific.
Enable list item version crawling: Select no to disable crawling the list item version history data. By
default, this feature is enabled. Note: This feature can only be applied globally and is not site specific.
Enable crawler status logging: Enabling the crawler status log will log entries from each collector run. By
default, this feature is disabled. When the crawler status logging is enabled, the following entries will be
logged; Crawler Job Created, Crawler Job Started, Crawler Job Cancelled, Crawler Job Full Crawl
Complete; and Crawler Job Deleted. Note: This feature is applicable to the System Administrator and
support. The status log can only be viewed by accessing the database.
SharePoint Audit Log Settings
Clear SharePoint Audit log after processing: This setting instructs the Nintex Analytics SharePoint
Collector service to purge the SharePoint audit log after it has been collected. All audit entries for a given
site collection that occurred prior to the current collection window will be removed. This can be used to
reduce the size of the SharePoint content database and increase the efficiency of the Nintex Analytics
SharePoint Collector.
Please note: Before using this option ensure that the farm does not use SharePoint Auditing for any other
purpose.
WARNING: If SharePoint auditing was previously enabled prior to the setting of this option, there
may be a large number of audit entries to delete. Deleting a large number of records from
SharePoint’s content database in one batch can cause performance problems for SQL Server and
SharePoint. In particular, this can cause row locking and rapid SQL Server log file growth.
For that reason, Audit Settings in SharePoint are now controlled at the Site Collection level. To
purge previous data:
1. Navigate to a SharePoint team site.
2. Click Site Actions and select Site Settings.
3. Click Site collection audit settings in the Site Collection Administration section. Follow
the information provided there.
Collect System Activity: To exclude System User account activity from being collected uncheck this
option.
Number of minutes to delay before collecting Audit entries: The number of minutes to delay after each
batch of audit entries is processed before starting again.
Audit processing batch size: The number of minutes worth of audit entries to process in each batch.
Usage
Number of minutes to delay before collecting usage data: The number of minutes to delay after each
batch is processed before starting again.
Process batch size: The number of minutes worth of data to process in each batch.
Display Errors
Display file version errors
If set to Yes (default), the collector will log any file version related errors to the event and trace log.
Note: See Logging errors to the event and trace log below to ensure errors will be logged.
If set to No, the collector will only log file version related errors to the trace log.
Note: See Logging errors to the trace log below to ensure errors will be logged.
Display folder errors
If set to Yes (default), the collector will log any folder related errors to the event and trace log.
Note: See Logging errors to the event and trace log below to ensure errors will be logged.
If set to No, the collector will only log folder related errors to the trace log.
Note: See Logging errors to the trace log below to ensure errors will be logged.
Display site processing errors
If set to Yes (default), the collector will log any site processing errors to the event and trace log.
Note: See Logging errors to the event and trace log below to ensure errors will be logged.
If set to No, the collector will only log site processing errors to the trace log.
Note: See Logging errors to the trace log below to ensure errors will be logged.
Display content database processing errors
If set to Yes (default), the collector will log any content database processing errors to the event and
trace log.
Note: See Logging errors to the event and trace log below to ensure errors will be logged.
If set to No, the collector will only log content database processing errors to the trace log.
Note: See Logging errors to the trace log below to ensure errors will be logged.
Logging errors to the event and trace log
1. Navigate to Central Administration and click on Monitoring.
2. In the Reporting heading, click on Configure diagnostic logging.
3. In the Category column, click on the Nintex Analytics navigation tree and select the SharePoint
Foundation Collector Service - Crawler box.
4. In the Least critical event to report to the event log field, select Error.
5. Click OK.
Logging errors to the trace log
1. Navigate to Central Administration and click on Monitoring.
2. In the Reporting heading, click on Configure diagnostic logging.
3. In the Category column, click on the Nintex Analytics navigation tree and select the SharePoint
Foundation Collector Service - Crawler box.
4. In the Least critical event to report to the trace log field, select Verbose.
5. Click OK.
Configuring a SharePoint Server Collector Service
User Profile Collection Settings
The SharePoint Server collector service collects the SharePoint user profile information.
Enable User Profile Collector: If the site is configured to use SharePoint User Profile information
enable the user profile collector. Uncheck if the site is configured to use Active Directory.
Process Batch Size: The number of users to process at a time.
Web Application URL: The web application URL that is hosting the SharePoint user profiles.
Sleep Time Span (minutes): The amount of time to wait between processing the user profile
changes.
Web Analytics Settings
How many days to go back: Set the number of days for the service to attempt to collect missing
historic web analytics data. This will be used when the service is first installed or if the service is
offline for a period of time.
Sleep Time Span (minutes): The amount of time to wait before processing changed data.
Deleting the database entry of a Service
To delete the service’s configuration:
Highlight the service and click Delete in the Management Ribbon. This operation is useful when you
have an orphan service configuration.
Please note this will only remove the configuration for the service.
To restart the service:
Navigate to Central Administration >System Settings> Services on this server page to relist the
service with the default configuration.
2.2 Licensing
The licensing page is used to import or export a license file.
Import a license
To import a new license:
1. Navigate to Central Administration and click Nintex Analytics Management.
2. Click Licensing in the General Settings section.
3. Click Import in the Managment Ribbon.
4. Click Browse to locate the license file.
5. Click Upload once the file is located.
6. The new license will be displayed.
Export a license
To export a license:
1. Navigate to Central Administration and click Nintex Analytics Management.
2. Click Licensing in the General Settings section.
3. Click Export in the Management Ribbon.
4. Click Save in the File download dialog to save the report to a local drive.
5. Click Close.
Related Topics
Global Settings
Database Maintenance
2.3 Database Maintenance
The Database Maintenance page provides the ability to schedule index maintenance on all tables in both of
the Nintex Analytics databases.
The index maintentance is disabled by default.
It is recommended to schedule a weekly maintenance outside of any SQL Server scheduled maintenance.
To enable the index maintenance:
1. Navigate to Central Administration and click on Nintex Analytics Management.
2. Click on Database maintenance in the General Settings section.
3. Select the check box next to Maintain indexes.
4. The schedule can be set to run each day at the same time by specifying "Daily", or on particular days
by specifying "Weekly".
5. Use the dropdown list of times to specify when the process is to run.
The process uses:
the ALTER INDEX command for all indexes fragmented by at least 10%, on all tables.
the REBUILD keyword is used for indexes which are fragmented by more than 30%.
the REORGANIZE keyword is used for indexes which are fragmented between 10% and
30%.
2.4 Manage Active Directory Settings
The Manage Active Directory Settings page provides the ability to specify LDAP domain and mapping
settings for the Nintex Analytics Active Directory Service.

The collector will iterate through all entries and collect information from each domain specified, using the
LDAP Path, Netbios Name, Search Filter and Subtree settings, connecting to each domain using the
credentials provided.
Add a Domain
To add an LDAP domain:
1. Navigate to Central Administration and click on Nintex Analytics Management.
2. Click Manage Active Directory Settings in the General Settings section.
3. Click Add Domain.
4. Enter the Domain details.
Note: A valid LDAP Path must be specified. The AD Username and AD Password specified will be
used by the Nintex Analytics Active Directory Collector to connect to the Domain and collect user details.
5. Select the appropriate search filter. Check the Custom search filter to customize the search.
6. Tick Enabled in the Search AD Subtree. This ensures the Nintex Analytics Active Directory Collector
traverses the entire tree below your specified LDAP Path.
Note: Leaving this unchecked configures the collector to search only the immediate child objects in the
specified LDAP Path.
7. Click OK.
Edit a Domain
1. Navigate to Central Administration and click Nintex Analytics Management.
2. Click Manage Active Directory settings in the General Settings section.
3. Click the Netbios Name to open the edit page.
4. Make any changes and click OK.
Edit a Domain Mapping
Once a Domain has been created, a domain mappings link will appear at the bottom of the Edit Domain
page. Domain Mappings specify column mappings from the source attribute name in the Active Directory to
an entity in the Nintex Analytics database.
It is recommended to map only Active directory attributes which are common amongst a large number of
Active Directory users. The Nintex Reporting Active Directory Collector can group users within a
report based on a common value, such as Department, Location or Manager.
To create a domain mapping:
1. Navigate to Central Administration and click Nintex Analytics Management.
2. Under the General Settings heading, click the Manage Active Directory Settings link.
3. Click the Netbios Name to open the edit page.
4. Click Domain Mappings.
5. Enter the Active Directory attribute name in the Source Column next to the Destination Column in
the Nintex Analytics database to map to.
Note: Only single-value attributes are valid. For example, mapping a multi-value attribute such as
memberOf is not supported.
The LoginName or Manager Destination Column entries cannot be remapped. These are required
by the collector.
Delete a Domain entry
To delete a domain entry:
1. Navigate to Central Administration and click Nintex Analytics Management.
2. Click Manage Active Directory Settings in the General Settings section.
3. Click the cross icon in the Remove column.
4. Click OK.
2.5 Manage Audit Settings
SharePoint Audit data is used to populate usage data in some Nintex Analytics reports. Refer to Data
Sets Using Auditing. Nintex Analytics provides a configuration facility to enable or disable SharePoint
auditing with the SharePoint environment.
Configure for the Web Application
To configure:
1. Navigate to Central Administration and click Nintex Analytics Management.
2. Click Manage Audit Settings in the General Settings section.
3. Click on the required Web Application.
4. Select either All events or the individual audit events to be collected. This will apply to all the sites.
5. Click OK.
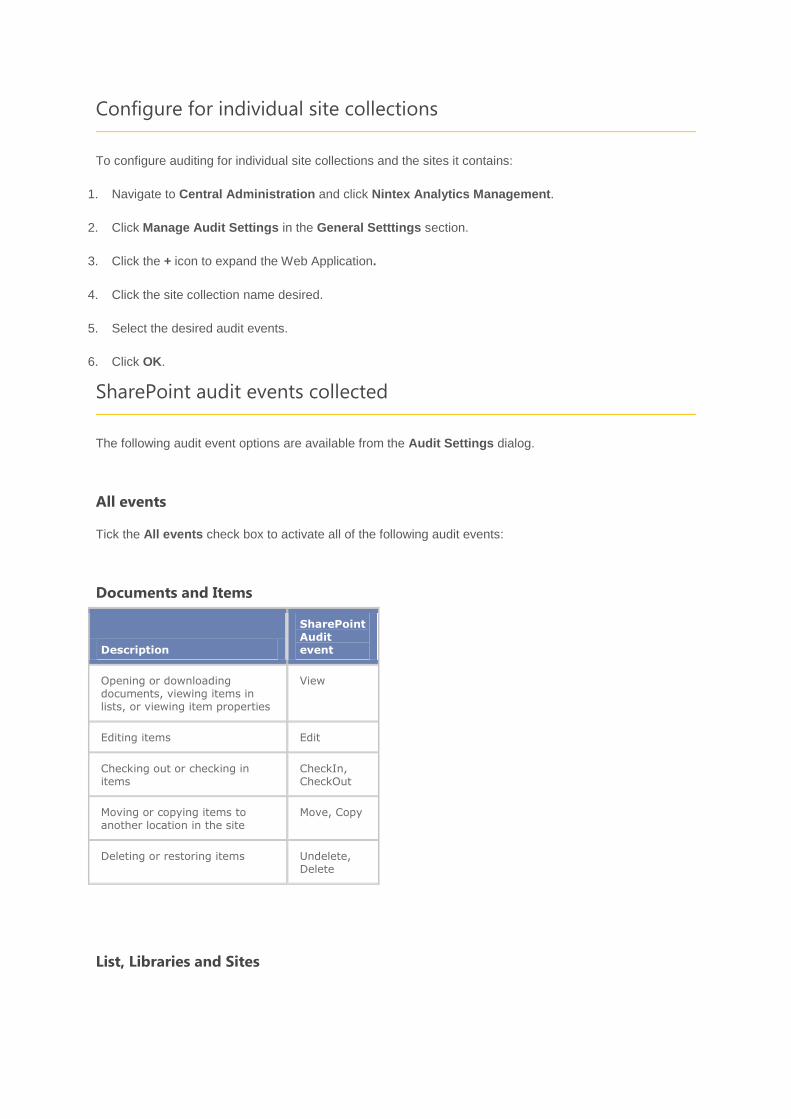
Configure for individual site collections
To configure auditing for individual site collections and the sites it contains:
1. Navigate to Central Administration and click Nintex Analytics Management.
2. Click Manage Audit Settings in the General Setttings section.
3. Click the + icon to expand the Web Application.
4. Click the site collection name desired.
5. Select the desired audit events.
6. Click OK.
SharePoint audit events collected
The following audit event options are available from the Audit Settings dialog.
All events
Tick the All events check box to activate all of the following audit events:
Documents and Items
Description
SharePoint Audit event
Opening or downloading documents, viewing items in lists, or viewing item properties
View
Editing items Edit
Checking out or checking in items
CheckIn, CheckOut
Moving or copying items to another location in the site
Move, Copy
Deleting or restoring items Undelete, Delete
List, Libraries and Sites
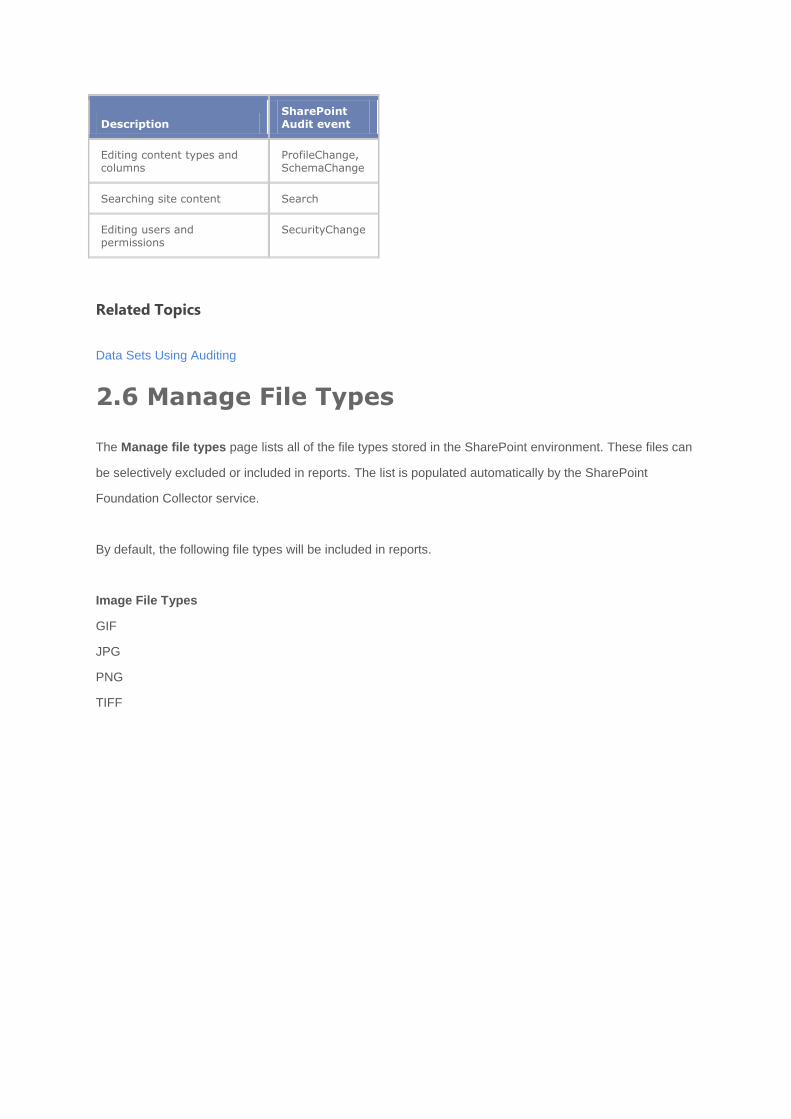
Description SharePoint Audit event
Editing content types and columns
ProfileChange, SchemaChange
Searching site content Search
Editing users and permissions
SecurityChange
Related Topics
Data Sets Using Auditing
2.6 Manage File Types
The Manage file types page lists all of the file types stored in the SharePoint environment. These files can
be selectively excluded or included in reports. The list is populated automatically by the SharePoint
Foundation Collector service.
By default, the following file types will be included in reports.
Image File Types
GIF
JPG
PNG
TIFF
BMP
System File Types
ASPX
DWP
MASTER
RULES
THMX
VDW
WEBPART
XML
XOML
XSL
SXN
Note: When the SharePoint Foundation Collector service locates a file type that it has not encountered
before, it will populate the list on this page. If the file type is not yet listed it may be a file that is new to the
system and has not yet been crawled.
Modify File Types
To modify the file types included in reports:
1. Navigate to Central Administration and click Nintex Analytics Management.
2. Click Manage file types in the General Settings section.
3. Use the checkbox to select the Image or System Files to be included in reports.
4. Click OK.
Related Topics
Parameters
2.7 Manage Subscription Message Template
Subscription message templates are used to create the email message sent to report subscribers. The
email message consists of a header, body and footer.
There are three subscription message templates:
Standard Template: Sent to users that have subscribed themselves to the report.
Shared Template: Sent to users who have had someone else subscribe the report for them.
Watch Template: Sent with the Watch Site or Watch Document reports.
Editing a subscription message template
To edit a Standard, Shared or Watch template:
1. Click on Nintex Analytics Management in Central Administration.
2. Under the General Settings heading, click either the Subscription standard template, Subscription
shared template or Subscription watch template link.
3. Use the buttons on the Ribbon to format text and insert other content, such as pictures, tables and
hyperlinks.
Subscription message template structure
Notification Header
The notification header is the top of the email.
Notification Body
The subject line of the email. The body content is the text before the embedded report, or the text of the
email if the report is an attachment.
Notification Footer
The notification footer forms the end of the email.
Notification for Invalid subscription
Tick the check box to remove invalid subscriptions if the report or dashboard page has been removed from
the report center.
Insert references
Use the Insert Reference button to add reference tokens. Alternatively, you can also insert a link by
selecting the Links button in the Editing Tools Ribbon The following reference tokens are available:
Creator's Name: The name of the user who created the subscription. This can be used to
inform the recipient of a shared subscription who the subscription creator was.
Manage Subscriptions Link: Links the user to the Nintex Analytics Manage Subscriptions page
within SharePoint. To change the Hyperlink text to display, select the Link button in the Editing
Tools Ribbon.
Report Link: Displays the link to the report page in the report center.
Tip: To display the Report Title as the hyperlink text, click on the Link Ribbon. In the Address field, enter
the report link. In the Hyperlink text to display field, enter the Subscription Page Title text.
Report Title: Displays the report title from the properties of the related subscriptions.
Unsubscribe Link: Links the user to the Manage Subscriptions page with a confirmation message to
unsubscribe to the report. To change the text to display, use the Link button in the Insert Ribbon.
Watch Item URL: Provides the URL of the item being watched.
Watch Site Name: Provides the name of the site being watched.
2.8 Manage System Accounts
The Manage System Accounts page can be used to nominate system accounts to exclude from report
results. These settings will not apply if the Collect System Activity option is checked in the SharePoint
Foundation Collector Service settings. Refer to Manage Services.
To add an account to the exclude list
1. Navigate to Central Administration and click Nintex Analytics Management.
2. Click Manage system accounts in the General Settings section.
3. Click the Add button in the Management Ribbon.
4. Type a user name into the textbox. Click on the Check Names icon to validate names and select the
desired login name from the displayed matches. Alternatively, click the Browse icon to use the
SharePoint address book lookup function.
Note: If multiple users are to be entered, separate user names with semi-colons.
5. Click OK.
To remove an account from the exclude list
1. Navigate to Central Administration and click Nintex Analytics Management.
2. Click Manage system accounts in the General Settings section.
3. Select the account name to be removed.
4. Click the Delete button in the Ribbon.
5. Click OK.
Related Topics
Manage Services
2.9 Manage User Filters
User Filters are used limit the report results to data related to a defined grouping of users. For example, an
organizational department, a country or a location within a country. The Nintex Analytics Active Directory
Collector or the Nintex Analytics SharePoint Server Collector must be installed in order to create User
Filters.
The Manage User Filters page allows for the creation of grouping rules based on user attributes that
are collected by either the Nintex Analytics Active Directory Collector or the Nintex Analytics SharePoint
Server Collector.
User Filters encapsulate complex rules such as Company=acme and Department=SALES and
(Country=USA or Country=Germany) into a single named filter, like USA and Germany Sales Groups.
The named filter can then be used when running reports to return results only for user data that fits the
rules specified in the filter.
Add a User Filter
To Add a User Filter:
1. Navigate to Central Administration and click Nintex Analytics Management.
2. Click Manage user filters in the General Settings section.
3. Click Add Filter.
4. Name the Filter. This name will display in the User Filter Parameter selector.
5. The field drop-down shows all the available filter columns.
6. Use Insert reference to add a filter rule.
Note: The fields available in the Insert reference dialog are configured in the Manage Active
Directory Settings page or the User Profile Mapping page. Refer to Manage Active Directory Settings or
Edit User Profile Mapping
7. Add multiple conditions using And and Or logical operators.
8. Click OK.
To edit an existing User Filter, click on the User Filter name.
Using User Filters in Reports
Applicable reports include a User Filter parameter. By default this will include the item All. Once User
Filters are created, they will appear in the User Filter parameter selector. After the report is run, the
selected User Filter is displayed in the Report Parameters selector.
Related Topics
Manage Active Directory Settings
Edit User Profile Mapping
2.10 Global Settings
Nintex Report Center
The Nintex Report Center is created during the installation of Nintex Analytics 2010.
If the Nintex Report Center is deleted, all reports and subscriptions to the report center are removed. To
export individual reports before deleting the report center, use the Export button in the report designer.
To delete the Nintex Report Center:
1. Navigate to Central Administration and click Nintex Analytics Management.
2. Click Global settings in the General Settings section.
3. Click Delete in the Create Nintex Report Center section.
4. Click OK.
To create a Nintex Report Center:
1. Enter a new site URL. This can be done by one of two ways:
Type in the site URL or
Click on the All Site Collection link to select a site from the site picker.
2. Enter a Document library name, for example: Nintex Analytics.
3. Click Create.
Note: It may take several minutes to create the Nintex Report Center. Once completed, there will be a link
to the created Nintex Report Center. Click this link to navigate to the Nintex Report Center.
Data Management Service Configuration
This setting is automatically configured by Nintex Reporting Configuration Wizard.
To change the length of time the data is maintained in the data warehouse:
1. Select the desired time period in the drop down.
2. Click Save.
Enable Team Site Reporting
This setting can be used to allow the Team Site Reporting feature to be activated on a particular web
application or all content web applications.
2.11 System Status
The System Status page provides a high level overview of the different components of Nintex Analytics.
Nintex Analytics Databases: The size and names of the configuration, cache and data warehouse
databases.
Collectors: This provides a snapshot of how much data has been collected by both the SharePoint
and Performance services. The "Collection Date" should be within a day or two of the current date,
except in a very new installation. If there is a time lag between the collection date and the current
date, the SharePoint Foundation Collector service settings may need to be adjusted. Please refer to
the Manage Services help page for more information.
Data Management Service: This section provides a snapshot of the number of schedules that exist
and the number of executions that have taken place, as well as the next schedule to be executed.
Note: If the Report Processing Usage percentage is 80% or above, installing another Data
Management Service is recommended to help balance the load.
Note: The Next report to run should be recent.
Related Topics
Manage Services
2.12 Edit User Profile Mapping
The Manage User Profile Settings page provides the ability to map the SharePoint User Profile information
to the Nintex Analytics Database.
Source Column: Refers to an attribute name in the User Profile.
Destination Column: Refers to an entity in the Nintex Analytics database.
Edit User Profile Mappings
To change the user profile mappings:
1. Navigate to Central Administration and click Nintex Analytics Management.
2. Click Manage user profile settings in the General Settings section.
3. Enter the SharePoint User Profile property name in the Source Column.
Note: Only single-value attributes are valid. For example: Mapping a multi-value attribute such as
memberOf is not supported.
Note: The LoginName or Manager Destination Column entries cannot be remapped. These are required by
the collector.
2.13 Manage Data Sets
Data Sets are configured for the Global and Site Report Centers. Managing Data Sets configures the
properties, settings, permissions, columns and parameters available to the report designer.
Manage Data Sets
To edit a Data Set:
1. Navigate to Central Administration and click Nintex Analytics Management.
2. Click Manage Data Sets in the Data Set Management section.
3. Select a Data Set and configure using the Management Ribbon.
The Ribbon Menu
Add: Adds a new default Data Set configuration for a Global or Site report center. Refer to Manage
Data Sets Add.
Delete: Click Delete, to delete a Data Set configuration. The confirmation message will list
any related reports that will be deleted from the report center.
Properties: Change the name and description of the Data Set. Refer to Manage Data Sets
Properties.
Settings: Set the maximum number of rows for the report designer and the artwork for the Data Set
icon. Refer to Manage Data Sets Settings.
Permissions: Set the permissions for report designer and report viewer. Refer to Manage Data Sets
Permissions.
Columns: Configure the column display names and the privacy settings. Refer to Manage Data Sets
Columns.
Parameters: Configure the display name, if the parameter is visible or editable by the report
designer, and the default values of each Parameter. Refer to Manage Data Sets Parameters.
Clone: Copies the current configuration of the Data Set to the same report center type. Refer to
Manage Data Sets Clone.
Related Topics
Manage Data Sets Add
Manage Data Sets Properties
Manage Data Sets Settings
Manage Data Sets Permissions
Manage Data Sets Columns
Manage Data Sets Parameters
Manage Data Sets Clone
2.14 Manage Data Sets Add
The Add Data Set function creates a particular configuration of a Data Set Template for use in a Global or
Site Report Center.
To add a Data Set to a Nintex Analytics 2010 Report Center:
1. Navigate to Central Administration and click Nintex Analytics Management.
2. Click Manage Data Sets in the Data Set Management section.
3. Click Add in the Management Ribbon.
4. Browse the available Data Set Templates.
5. Once a Data Set Template has been selected, type the Data Set configuration Name and select a
Report Center type. A Data Set name does not have to be unique.
6. Click Create.
The new Data Set will now be available within the specified Report Center.
Related Topics
Manage Data Sets Settings
Manage Data Sets
Upload Data Set
2.15 Manage Data Sets Properties
The Data Set Properties dialog can be used to change the name and description of the Data Set.
To edit the name and description of the Data Set:
1. Navigate to Central Administration and click on Nintex Analytics Management.
2. Click Manage Data Sets in the Data Set Management section.
3. Select a Data Set. Click the Properties button in the Management Ribbon.
Properties Dialog
Report Center Type: Displays the Report Center type the Data Set is configured for. The Global
Report Center is the main report center for the SharePoint Farm. Site Report Centers may be
activated on selected sites in the Farm.
Name and Description: Enter the name and description of the selected Data Set.
2.16 Manage Data Sets Settings
Data Set Settings configures the maximum number of rows returned by the data set and the display
icon image of the Data Set configuration.
Maximum number of rows
To edit the maximum number of rows:
1. Navigate to Central Administration and click Nintex Analytics Management.
2. Click Manage Data Sets in the Data Set Management section.
3. Select a Data Set and click Settings in the Management Ribbon.
4. Set the Maximum number of rows.
Artwork
Specify the icon to display when browsing the Select Data Set dialog.
The following are the default icons delivered with Nintex Analytics:
Line Graph: /_layouts/images/nintexanalytics/NA2010_48x48_linegraph.png
Bar Graph: /_layouts/images/nintexanalytics/NA2010_48x48_bargraph.png
Pie Graph: /_layouts/images/nintexanalytics/NA2010_48x48_piegraph.png
Dashboard page: /_layouts/images/nintexanalytics/NA2010_48x48_dashboard.png
Table: /_layouts/images/nintexanalytics/NA2010_48x48_tablegraph.png
Nintex Analytics Logo: /_layouts/images/nintexanalytics/NA2010_48x48_NA.png
Related Topics
Manage Data Sets
Manage Installed Data Set Templates
2.17 Manage Data Sets Permissions
Data Set Permissions is used to assign users permissions to design and view reports based on the Data
Set. By default this is set to All authenticated users. This can be set at the Report Center and report level.
Refer to Permissions and Report Permissions.
Granting permissions
To grant Data Set permissions:
1. Navigate to Central Administration and click Nintex Analytics Management.
2. Click Data Set Management in the Manage Data Sets section.
3. Select a Data Set and click Permissions in the Management Ribbon.
4. Type a Usermame in the textbox. Click on the Check Names icon to validate names and select the
desired login name from the displayed matches. Alternatively, click the Browse icon to use the
SharePoint address book lookup function.
Note: If entering mulitple users, separate user names with semi-colons.
5. Click the Add button.
Note: by default, the newly added users will not have any permissions.
6. For each user, or group of users, set the required permissions as detailed below:
Report Viewer: Permission to view the reports in the Report Center.
Report Designer: Permission to create and design reports using the Report Designer.
7. Click OK.
Removing permissions
In the Data Set Permissions dialog:
1. Click the name of the user or group of users where permissions are to be removed.
2. Click the Remove button.
3. Click OK.
Related Topics
Permissions
Report Permissions
2.18 Manage Data Sets Columns
Configure Data Set Columns to set the display name and the column privacy. Column Privacy is used to
restrict the display of sensitive information.
Configuring Data Set Columns
To edit a Data Set:
1. Navigate to Central Administration and click Nintex Analytics Management.
2. Click Manage Data Sets in the Data Set Management section.
3. Select a Data Set and click Columns in the Management Ribbon.
4. Select the column to change.
Display: Type a Display name and optional Description for the column.
Tip: If setting Privacy settings, the display name and description can be used to make the report designer
or viewer aware that the data is being substituted.
Privacy
When Column privacy is Off, the data in this column will be displayed normally.
When Column privacy is On, the data returned to reports will be replaced with the specified value.
Either enter the substitute data and/or use the regular expression input box to create advanced text
replacement.
Example of a regular expression:
For a User ID column, to replace the login ID with [domain name]\UNKNOWN:
1. Type \\UNKNOWN in the Substitute returned data for this column with field
2. Type \\[\w\.=-]+$ in the Use regular expression field.
3. The final report data will display the domain name followed by UNKNOWN.
More regular expression can be found on sites such as http://regexlib.com/ and
http://gskinner.com/RegExr/.
2.19 Manage Data Sets Parameters
Parameters can be added to limit the data returned by the Data Set when the report is run or scheduled.
The available parameters are dependent on the Data Set selected for the report. Parameters can be
displayed in the Parameters panel to enable user selection at run time.
Display
The parameter's display name that is shown in the Parameters panel at run time. Enter the desired Display
Name in the text box.
Options
Allow this parameter to be displayed in the report
Choose if this parameter is displayed in the parameter panel at run time.
Allow report designer to edit this parameter
Choose if this parameter is available to the report designer to change.
Note: If a parameter is set to display but not allowed to change, it will display disabled in the Report
Designer and the Parameters panel.
Default
The default value of the parameter can be a set value or a calculated value. Refer to Tokens and
Functions.
The calculated parameters value will be calculated at the time the report is run, either when the run button
is clicked or when the schedule runs.
2.20 Manage Data Sets Clone
Cloning a Data Set copies the configuration to the same report center type.
Clone a Data Set
To clone a Data Set:
1. Navigate to Central Administration and click Nintex Analytics Management.
2. Click Manage Data Sets in the Data Set Management section.
3. Select a Data Set and click Clone in the Management Ribbon.
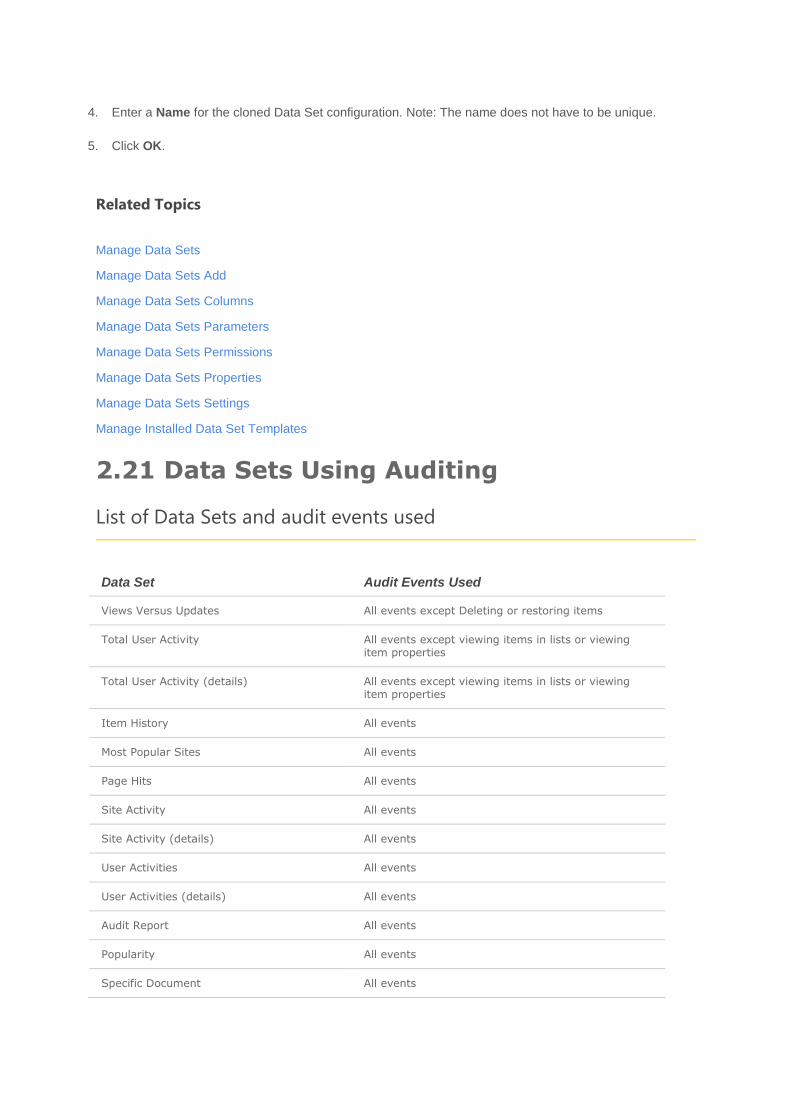
4. Enter a Name for the cloned Data Set configuration. Note: The name does not have to be unique.
5. Click OK.
Related Topics
Manage Data Sets
Manage Data Sets Add
Manage Data Sets Columns
Manage Data Sets Parameters
Manage Data Sets Permissions
Manage Data Sets Properties
Manage Data Sets Settings
Manage Installed Data Set Templates
2.21 Data Sets Using Auditing
List of Data Sets and audit events used
Data Set Audit Events Used
Views Versus Updates All events except Deleting or restoring items
Total User Activity All events except viewing items in lists or viewing item properties
Total User Activity (details) All events except viewing items in lists or viewing item properties
Item History All events
Most Popular Sites All events
Page Hits All events
Site Activity All events
Site Activity (details) All events
User Activities All events
User Activities (details) All events
Audit Report All events
Popularity All events
Specific Document All events
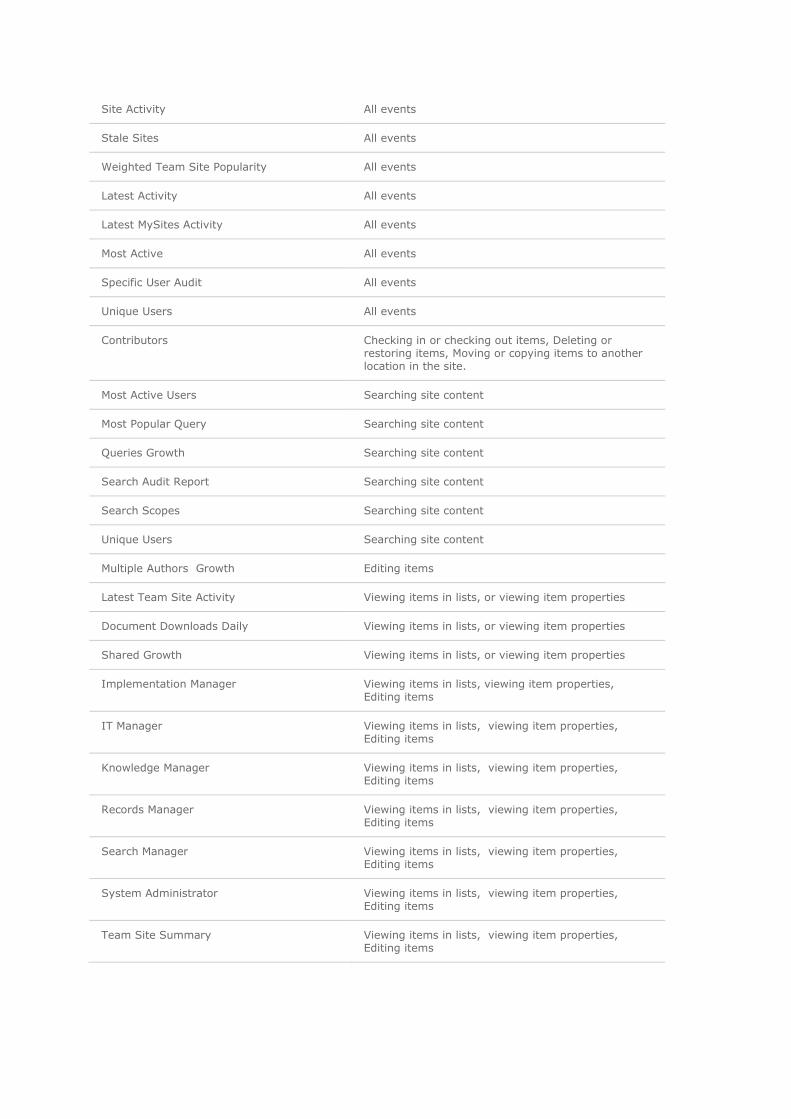
Site Activity All events
Stale Sites All events
Weighted Team Site Popularity All events
Latest Activity All events
Latest MySites Activity All events
Most Active All events
Specific User Audit All events
Unique Users All events
Contributors Checking in or checking out items, Deleting or restoring items, Moving or copying items to another location in the site.
Most Active Users Searching site content
Most Popular Query Searching site content
Queries Growth Searching site content
Search Audit Report Searching site content
Search Scopes Searching site content
Unique Users Searching site content
Multiple Authors Growth Editing items
Latest Team Site Activity Viewing items in lists, or viewing item properties
Document Downloads Daily Viewing items in lists, or viewing item properties
Shared Growth Viewing items in lists, or viewing item properties
Implementation Manager Viewing items in lists, viewing item properties, Editing items
IT Manager Viewing items in lists, viewing item properties, Editing items
Knowledge Manager Viewing items in lists, viewing item properties, Editing items
Records Manager Viewing items in lists, viewing item properties, Editing items
Search Manager Viewing items in lists, viewing item properties, Editing items
System Administrator Viewing items in lists, viewing item properties, Editing items
Team Site Summary Viewing items in lists, viewing item properties, Editing items
Related Topics
Manage Data Sets
Manage Data Sets Add
Manage Data Sets Clone
Manage Data Sets Clone
Manage Data Sets Columns
Manage Data Sets Parameters
Manage Data Sets Permissions
Manage Data Sets Properties
Manage Data Sets Settings
Manage Installed Data Set Templates
2.22 Manage Installed Data Set Templates
A Data Set Template creates and manages the connections to the data sources for reports.
Each Data Set Template can have one or more Data Set configurations for use within Report Centers. The
Data Set configuration can control parameter defaults, permissions, and data privacy settings. To configure
a Data Set for use in a Report Center refer to Manage Data Sets
Data Set Template Properties
The Data set template properties dialog provides an overview of the Data Set Template. This includes
the Name, Description, Assembly, Type and the Unique ID of the Data Set Template.
Enabled Drop-down
True: Selecting True adds the Data Set to the list of available data sets for use in a Global or Site
Report Center. For more information on how to configure the data set for use in a Report Center refer
to Add Data Sets.
False: Selecting False results in the Data Set being unavailable for use.
Add a Data Set Template
To upload a new Data Set Template:
1. Navigate to Central Administration and click on Nintex Analytics Management.
2. Click Manage installed Data Set templates in the Data Set Management section.
3. Click Add in the Management Ribbon.
4. Locate the Data Set Template file using the Browse button.
5. Click Verify to check for errors, warnings and other information.
6. Click OK.
7. Once the Data Set Template has been verified, the Data Set Upload dialog will reopen.
8. Locate the Data Set Template file using the Browse button.
Note: Tick the Upgrade the data set if it already exists check box to replace an existing Data Set
Template with the new template.
9. Click Upload.
10. Click on the uploaded Data Set Template in the list and then click Properties in the
Management Ribbon.
11. Select True in the Enabled property drop-down.
12. Click OK.
Delete a Data Set Template
To delete a Data Set template:
1. Navigate to Central Administration and click on Nintex Analytics Management.
2. Click Manage installed Data Set templates in the Data Set Management section.
3. Select the Data Set Template to delete.
4. Click Delete in the Ribbon.
5. Click OK.
Related Topics
Manage Data Sets Add
Upload Data Set
2.23 Upload Data Set
A Data Set Template creates and manages the connections to the data sources for reports.
Each Data Set Template can have one or more Data Set configurations for use within Report Centers. The
Data Set configuration can control parameter defaults, permissions and data privacy settings. To configure
a Data Set for use in a Report Center, Refer to Manage Data Sets
Add Data Set Templates
To upload a new Data Set Template:
1. Navigate to Central Administration and click Nintex Analytics Management.
2. Click Upload Data Set template in the Data Set Management section.
3. Locate the Data Set Template file with the Browse button.
4. Click Verify to check for errors, warnings and other information.
5. Click OK.
6. Once the Data Set Template has been verified, the Data Set Template dialog will reopen.
7. Locate the Data Set Template file with the Browse button.
Note: Tick the Upgrade the data set if it already exists check box to replace an existing Data Set
Template with the new template.
8. Click Upload
9. Navigate to Central Administration and click Nintex Analytics Management.
10. Click Manage installed Data Set templates in the Data Set Management section.
11. Click on the uploaded Data Set Template in the list. Click on Properties in the Management Ribbon.
12. Select True in the Enabled property drop-down.
13. Click OK.
Once the above steps are complete, the Data Set can be added and configured for use in one or more
Nintex Analytics 2010 Report Centers.
Related Topics
Manage Data Sets Add
Manage Data Sets
2.24 Import Reports
Import Reports
The Import Reports page is used to import the Global Report Center and Site Report Center reports,
including their data set configurations into the target Global Report Center. It can also be used to update
the report center templates. The import file may be sourced from a previously exported file or from a third
party supplier.
To prevent losing any data or in case of error, it is advised to back-up the current Site Report Center
prior to importing the reports. Refer to Export for information.
During the import process:
A report is identified by either a unique ID or name, if an existing report with the same ID is imported,
it will be replaced by the matching report in the import file. If there is no unique ID but the name
matches an existing report, the report will be replaced. If a report is imported with a unique ID or
name which does not match an existing report, a new report will be completed. Each site will contain
all of the imported site reports as well as any site reports that were not overridden by the import
process.
Data set configurations with the same name will be replaced by the matching data set configuration in
the import file.
Any reports that do not contain data set templates will not be imported.
If you select Update and Import or Update only during the import process, the imported Site Report
Center reports will replace all current site activations and become the template for all future site
activations.
Note: An imported report will not override the permissions, active subscriptions or scheduling report
settings.
If a report or data set configuration has been deleted and is not available, contact [email protected] for
information on how to restore the default report or data set that were first installed with Nintex Analytics.
How to import the reports
Follow the steps below to import the reports:
1. Navigate to Central Administration.
2. Select Nintex Analytics Management and click on Import Reports.
3. In the Upload Report Pack field, select Browse and locate the file that is to be imported.
4. In the Options field, select the upload option. Choose from Update and Import, Import only or Update
only.
5. Click Next.
6. Click OK to confirm the import.
Upload Options
Select the desired upload option from the drop down menu.
Update and Import
Select this option to update the report templates and then import the report pack. Updating the report
pack will update all of the report center templates and import all the data sets. During import, the
current report centers will be updated with the contents of the report pack. Note: The reports
and dashboards used in the update and import cannot be changed.
Import only
Directly import into existing report centers. During import, the current report centers will be updated
with the contents of the report pack. By default, all reports and dashboards will be imported, however
you can select which reports and dashboards are imported. Selecting this option will not impact your
existing report center templates and only imports the data sets used by the imported reports.
Update only
Updating the report pack will update the report center templates and import all of the data sets
contained in the report pack. Selecting this option will not impact your existing report centers and only
applies to new report centers. Note: The reports and dashboards used in the update cannot be
changed.
Related Topics
Export Reports
2.25 Export Reports
The Export Reports page is used to export the Global Report Center and Site Report Centers reports,
including their data set configurations.
Exporting Reports
To export the Global Report Center and Site Report Centers reports:
1. Navigate to Central Administration.
2. Select Nintex Analytics Management and click on Export Reports.
3. Optionally select the URL for the Site Report Center to export.
Note: The URL for the Global Report Center is automatically selected.
4. Click Next. This will open the Report Pack Edit section.
5. Use the checkboxes to select the desired global and site reports to be exported.
6. Click Export.
Note:
If the selected Site Report Center is used for the import process, it will become the template for all
future site report activations when you select the upload option Update and Import or Update only.
Exported reports should be used as a back-up in case an error occurs during the import process.
Related Topics
Import Reports
2.26 Crawl Exclusion Rule Management
Crawl Exclusion Rule Management
The Nintex Analytics crawl exclusion rule management page gives you the ability to set the behaviour of a
collector crawl by excluding sites and content from a crawl. Excluding sites from a collector crawl will
reduce the time it takes to crawl through your SharePoint environment.
To set a rule:
1. Click New Crawl Exclusion Rule below the Test button.
2. Enter the Exclusion Rule in the Rule field.
3. Enter a description of the rule.
4. Click OK.
5. The new rule should appear in the rule list.
Note: Rules are case insensitive.
Note: A path will only be excluded if it matches the rule exactly. For example: If the exclusion rule is
/mysites/123, only URLs with this exact phrasing will be excluded. If a URL contained just /mysites without
the /123 it would not be excluded from the crawl.
The crawler recognises the path of the SharePoint item. In some cases, the path of the SharePoint item
can be different to the URL visible in the browser in SharePoint. For example: We want to exclude the
folder "Employment Contracts" inside the document library "Shared Documents" - the browser appears as:
https://contoso/site1/default.aspx?RootFolder=%2Fsite1%2FShared%20Documents%2FEmploym
ent%20Contracts&FolderCTID=...
However, the crawler sees the path:
https://contoso/site1/Shared Documents/Employment Contracts
The rule needs to be defined to match the path seen by the crawler. This path can be found by viewing the
item in a webdav session i.e. view the path in Internet Explorer.
Note: There is no URL encoding in the paths seen by the crawler. Real space characters rather than %20
etc must be used.
To test the exclusion rule on a URL:
Enter the URL to be tested in the textbox and click on Test. If the URL matches a rule, the rule will be
highlighted in the rule list.
Note: All rules are created in the inactive state. This allows them to be verified with the Test button before
putting them into action. Once a rule is activated it is immediately available and will be picked up by the
next site collection crawl.
Please note: Rules are matched with the URLs using regular expressions.
Columns
Status - The current status of the rule. A rule can be either active or inactive. To activate a rule, select the
Activate button on the right-hand side. To deactivate an active rule, select the Inactive button on the right-
hand side.
Exclusion Rule - The rule defining excluded items. If the rule is activated, any URLS containing this
word/phrase will be excluded from the crawl.
Description - The description of the rule.
Edit - Select to modify the rule.
Delete - Select to remove the rule from the list.
Note: To place the exclusion rules in priority order, use the arrows on the right hand side. If a URL matches
more than one rule, the matching rule at the top of the list will be applied first while the content is being
crawled.
Related Topics
Create a Crawl Exclusion Rule
2.27 Create a Crawl Exclusion Rule
Create a Crawl Exclusion Rule
The crawl exclusion rule page allows you to create a new rule or edit a current rule. When the rule is
activated, the collector crawler will exclude the SharePoint object path/s containing this word from the
crawl.
Exclusion Rule - The rule defining the excluded items. Enter the word or phrase which will appear in the
path/s the collector crawler is to exclude.
Description - Enter a description of the rule.
Once a rule has been created and saved, it will appear in the columns list on the Nintex Analytics Crawl
Exclusion Management page as inactive. You will need to select the Activate button in the list to activate
the rule.
Creating Crawler Exclusion Rules Samples
SharePoint Foundation Crawler rules
Default AAM
The crawler will always see the path starting with the Default AAM (Alternate Access Mapping). To simplify
the rule, remove the http(s) portion of the path.
For example: Create the rule "://mywebapplication/my/sites" instead of "http://mywebapplication/my/sites/"
or "https://mywebapplication/my/sites/". This will match the desired web applications and sites more
consistently.
Crawler Paths
The crawler will identify the path of the SharePoint object as opposed to the object's URL shown in
the browser.
For example: A document library is shown in the URL
as "https://mywebapp/finance/salaries/Shared%20Documents/Forms/AllItems.aspx" but the path in the
webdav is "http://mywebapp/finace/salaries/Shared Documents". The best rule to match this SharePoint
path would be "://mywebapp/finance/salaries/Shared Documents".
Note: In this example, the SharePoint object path is not URL encoded. Removing the http or https is
optional.
Regular Expressions considerations
The crawler exclusion rules are in regular expression format. We have defined some relevant aspects
below.
Reserved Characters
The "." character is a reserved character for regular expressions. If the rule is required to match a "." (dot),
the regular expression format is "\.". For example: The regular expression "\.jpg" will match any path
containing ".jpg".
The "$" character defines "ends with". To match all the .jpg files, you would use the rule
"\.jpg$". This regular expression means that all paths ending in ".jpg" would be excluded.
Wildcards
If a wildcard is required, the regular expression format is ".*". The dot defines "any character" and the
asterisk defines "zero or more of the preceding character". Therefore, .* means the wildcard "zero or more
of any character".
Regular expressions implicitly have a wildcard match before and after the search string.
For example: If a rule is defined as just "site", it will match the following paths:
http://webapp/site1/default.aspx
https://webapp/site2/blogs/index.htm
http://webapp/my/personal/test/prerequisites.aspx
Therefore, the rule must be defined to match only the desired paths. If the aim is to match only paths
containing /site/, /site1/, /site2/, etc, the rule would be defined as "/site.*/". This would match:
http://webapp/site/default.aspx
http://webapp/site1/default.aspx
https://webapp/site2/blogs/index.htm
Note: This rule will not match http://webapp/my/personal/test/prerequisites.aspx
Related Topics
Crawl Exclusion Rule Management
2.28 View Report Templates
View Report Templates
The view report templates page allows you to view the contents of the current report templates. The
Global Report Center and Site Report Center reports from the existing report template are displayed. The
reports are listed by name and description.
Please note: The report template cannot be edited on this page. To change the report template, please use
the Import Reports page and select either the Update and Import or Update only option.
Related Topics
Import Reports
Export Reports
Manage Data Sets
2.29 Manage Report Categories
Manage Report Categories
The manage report categories page allows you to view and manage the report categories which are
displayed on the Nintex Analytics home page. Report categories are shown for the global report center and
site report centers.
Name: The name of the report category
Visibility: Use the checkbox to select whether the report category should appear on the Nintex Analytics
home page.
Note: If visibility is not selected, reports associated to this category will be visible in design mode but not in
view mode.
Sort: Use the arrows to rearrange the order the report categories appear on the Nintex Analytics home
page.
Related Topics
Report Designer
Report Listing
Report Properties