Embed Size (px)
Citation preview

Disclaimer: The information contained in this document is intended only for use during the presentation and should not be disseminated or
distributed to parties outside the presentation. DBS Bank accepts no liability whatsoever with respect to the use of this document or its contents.
Nine-month earnings at record
DBS Group Holdings
3Q 2012 financial results
November 1, 2012

2
Nine-month earnings at record
Sustained earnings momentum
Hong Kong profitability improves
Balance sheet remains robust
3
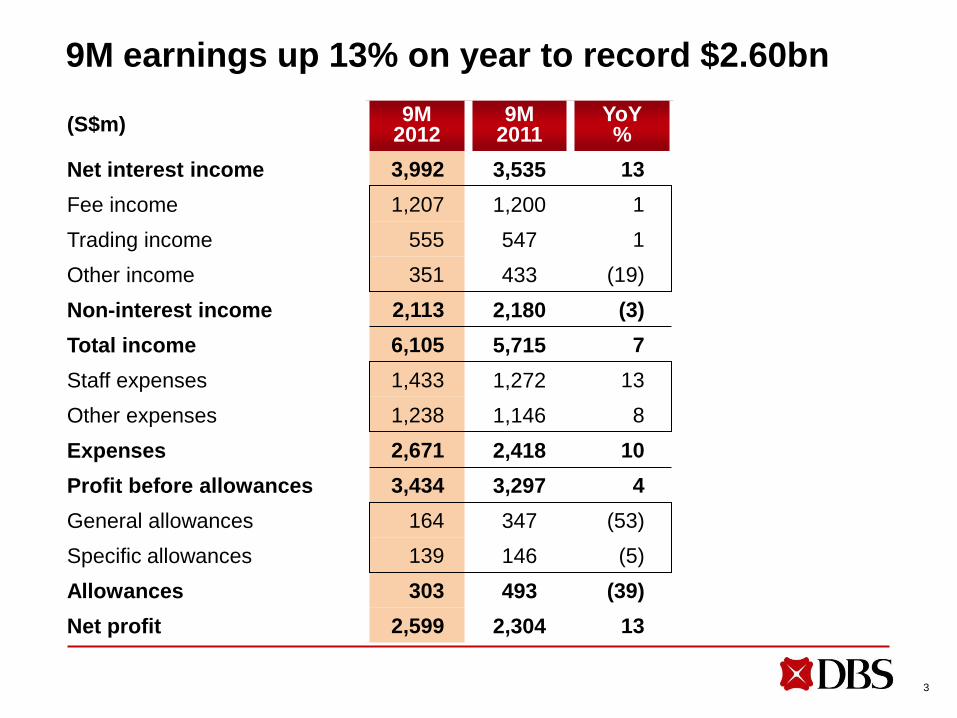
(S$m) 9M
2012 9M
2011 YoY %
Net interest income 3,992 3,535 13
Fee income 1,207 1,200 1
Trading income 555 547 1
Other income 351 433 (19)
Non-interest income 2,113 2,180 (3)
Total income 6,105 5,715 7
Staff expenses 1,433 1,272 13
Other expenses 1,238 1,146 8
Expenses 2,671 2,418 10
Profit before allowances 3,434 3,297 4
General allowances 164 347 (53)
Specific allowances 139 146 (5)
Allowances 303 493 (39)
Net profit 2,599 2,304 13
9M earnings up 13% on year to record $2.60bn

4
(S$m) 3Q
2012 3Q
2011 YoY %
2Q 2012
QoQ %
Net interest income 1,332 1,214 10 1,324 1
Fee income 422 397 6 379 11
Trading income 130 143 (9) 133 (2)
Other income 120 214 (44) 109 10
Non-interest income 672 754 (11) 621 8
Total income 2,004 1,968 2 1,945 3
Staff expenses 482 444 9 466 3
Other expenses 419 403 4 406 3
Expenses 901 847 6 872 3
Profit before allowances 1,103 1,121 (2) 1,073 3
General allowances 15 187 (92) 64 (77)
Specific allowances 40 44 (9) 40 0
Allowances 55 231 (76) 104 (47)
Net profit 856 762 12 810 6
3Q earnings up 12% on year and 6% on quarter

(%) 3Q
2012 3Q
2011 2Q
2012 9M
2012 9M
2011
Net interest margin 1.67 1.73 1.72 1.72 1.78
Fee income/total income 21 20 19 20 21
Non-interest income/total
income 34 38 32 35 38
Cost/income 45 43 45 44 42
ROE 11.2 10.8 10.9 11.7 11.3
Loan/deposit 84 84 89 84 84
SP/average loans (bp) 7 9 8 8 8
NPL ratio 1.3 1.3 1.3 1.3 1.3
9M ROE improves to 11.7%
5

6
3Q net interest income up 10% on year
(S$m)
2009 2011 2010
Net interest margin (%)
2011
1,122 1,199 1,214 1,290 1,336 1,324 1,332
1.80 1.80 1.73 1.73 1.77 1.72 1.67
3Q 4Q 2Q 1Q 3Q
1.84 2.02
1.77
1Q
2012
2Q
4,455 4,318
4,825
2.02 1.84 1.77

7
Loans up 1%, deposits up 5% on quarter excluding currency effects
Sep 12 (S$bn)
Jun 12 (S$bn)
Reported QoQ (%)
Underlying QoQ (%)
Loans
SGD 87.6 84.2 4 4
HKD 29.2 30.3 (4) (0)
USD 62.3 65.7 (5) (2)
Others 26.7 28.2 (5) (4)
Total 205.7 208.5 (1) 1
Deposits
SGD 129.2 124.1 4 4
HKD 22.7 21.4 6 10
USD 48.4 43.6 11 15
Others 39.9 41.5 (4) (2)
Total 240.2 230.6 4 5
Underlying excludes currency translation effects

8
Loan-deposit ratio moderates to 84%
(S$bn)
SGD and Non-SGD loan/deposit ratios are based on gross loans. Other funding comprises institutional funding, medium-term notes, commercial papers, certificates of deposit and other debt securities in issue
Other funding
Deposits Loans
195
28
186
23 29
225 231
205 232
198
20
220
260 248
260 240
Sep 11 Dec 11 Sep 12 Mar 12
Group
Loan/deposit (%)
SGD
Non-SGD
86
64
116
84
68
106
85
65
113
84
62
115
Jun 12
28
240
202
268
89
68
117
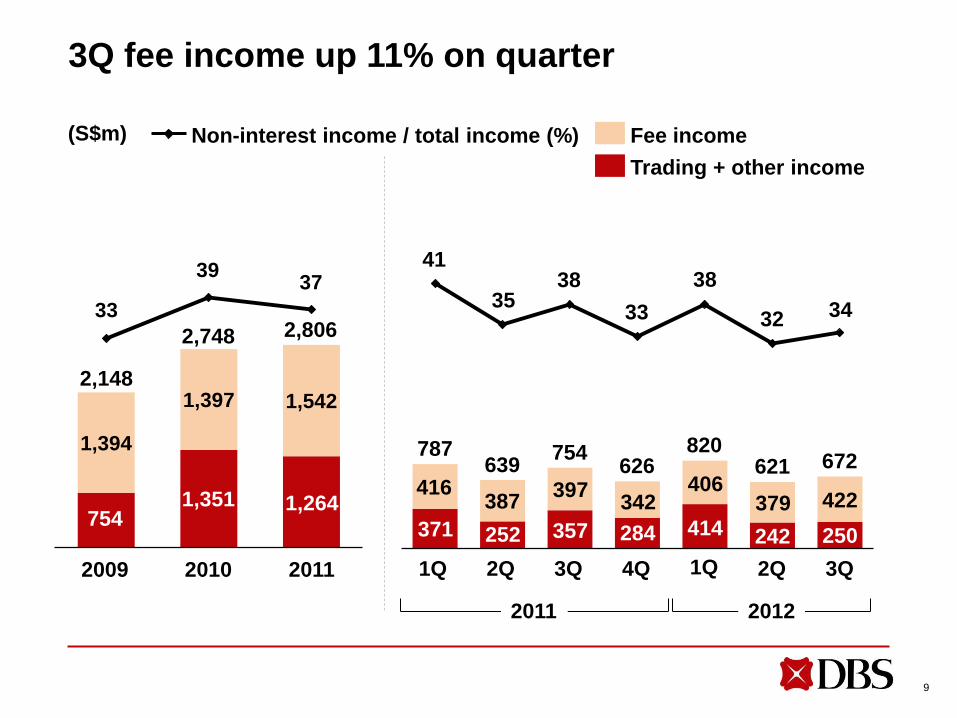
416 387
397 342
406 379 422
41
35 38
33
38
32 34
9
3Q fee income up 11% on quarter
(S$m)
1,394
1,397 1,542
33
39 37
2011
2,806
1,264
2010
2,748
1,351
2009
2,148
754
639 754 787
Trading + other income
Fee income Non-interest income / total income (%)
252 371 357 414
820
284
626
250
672
2011
3Q 4Q 2Q 1Q 3Q 1Q
2012
2Q
242
621

10
9M Treasury customer income up 7% on year, accounting for 46% of total Treasury income
(S$m) 9M
2012 9M
2011 YoY %
Customer income 719 672 7
Other income, principally from
balance sheet management,
market-making and
warehousing
828 843 (2)
Total Treasury income 1,547 1,515 2
Customer income as % of
total Treasury income 46 44 2 pt

11
Continued investments to support higher business volumes and build capacity for growth
(S$m)
11
1,292 1,422
1,712
39 41 43
1,312 1,503
2010 2011 2009
2,925 2,604
3,303
1,591 405 423 444 440 485 466 482
40 43 43
46
42 45 45
798
375 368
773
Cost / income (%)
Other expenses
Staff expenses
847
403 445
885
413
898
419
901
406
872
2011
3Q 4Q 2Q 1Q 3Q 1Q
2012
2Q

12
9M regional earnings up 10% on year
(S$m) 9M
2012 9M
2011 YoY %
Net interest income 923 817 13
Non-interest income 277 258 7
Total income 1,200 1,075 12
Expenses 594 498 19
Profit before allowances 606 577 5
Allowances 49 74 (34)
Net profit 501 456 10
Figures for operations outside of Singapore and Hong Kong

Sustained earnings momentum
Hong Kong profitability improves
Balance sheet remains robust
Nine-month earnings at record
13

14
(S$m) 9M
2012 9M
2011 YoY %
YoY %
Net interest income 665 578 15 14
Non-interest income 472 513 (8) (9)
Total income 1,137 1,091 4 3
Expenses 491 462 6 5
Profit before
allowances 646 629 3 1
General allowances (31) 75 NM NM
Specific allowances 17 31 (45) (45)
Allowances (14) 106 NM NM
Net profit 554 441 26 24
Net interest margin (%) 1.47 1.40
Loan growth (%) (8)
Deposit growth (%) 6
Hong Kong’s 9M earnings up 26% on year
Constant-currency terms

15
(S$m) 3Q
2012 3Q
2011 YoY %
YoY %
2Q 2012
QoQ %
QoQ %
Net interest income 228 189 21 20 228 0 2
Non-interest income 145 136 7 4 151 (4) (3)
Total income 373 325 15 13 379 (2) 0
Expenses 168 153 10 9 168 0 2
Profit before
allowances 205 172 19 16 211 (3) (1)
General allowances (28) 30 NM NM (4) NM NM
Specific allowances 7 13 (44) (44) 8 (11) (9)
Allowances (20) 43 NM NM 4 NM NM
Net profit 187 108 73 69 177 6 8
Net interest margin (%) 1.54 1.25 1.52
Loan growth (%) (8) (8)
Deposit growth (%) 6 8
Hong Kong’s 3Q earnings up 73% on year on better net-interest income and allowances
Constant-currency terms

Sustained earnings momentum
Hong Kong profitability improves
Balance sheet remains robust
Nine-month earnings at record
16
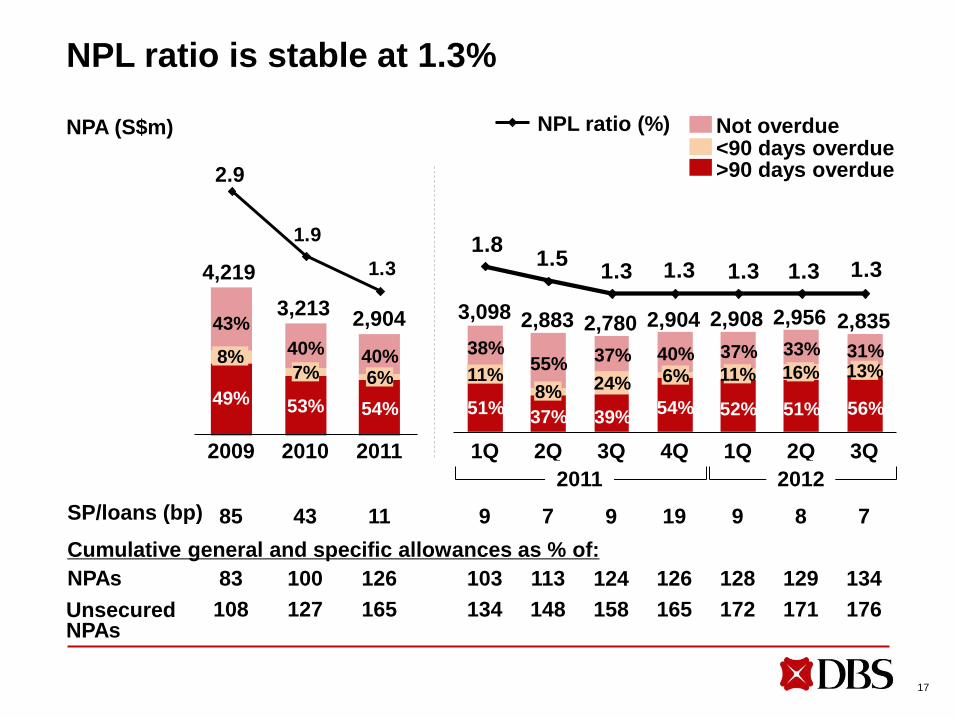
NPL ratio is stable at 1.3% NPA (S$m)
Cumulative general and specific allowances as % of:
NPAs
Unsecured NPAs
83
108
100
127
126
165
103
134
113
148
SP/loans (bp) 85 43 11 9 7
17
1.9
1.3
2011
2,904
2010
3,213
53%
7%
54%
6%
40%
2009
4,219
40%
49%
8%
43%
2.9
NPL ratio (%)
1.81.5
1.3 1.3 1.3 1.3 1.3
11%
38%
3,098
4Q 2Q
51%
3Q 2Q 1Q
2,883
55%
8%
37%
124
158
9
2,780
37%
24%
39%
>90 days overdue <90 days overdue Not overdue
126
165
19
2,908
37%
11%
52%
2,904
40% 6%
54%
134
176
7
2,956
33%
16%
51%
1Q
128
172
9
129
171
8
3Q
31% 13%
56%
2011 2012
2,835
18
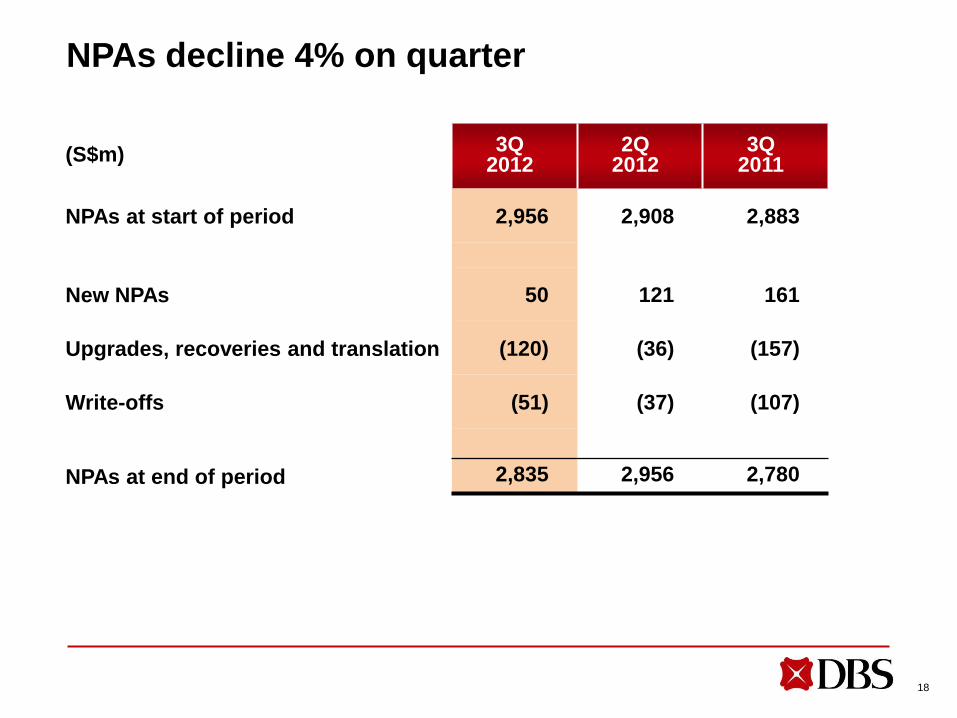
NPAs decline 4% on quarter
(S$m) 3Q
2012 2Q
2012 3Q
2011
NPAs at start of period 2,956 2,908 2,883
New NPAs 50 121 161
Upgrades, recoveries and translation (120) (36) (157)
Write-offs (51) (37) (107)
NPAs at end of period 2,835 2,956 2,780
19
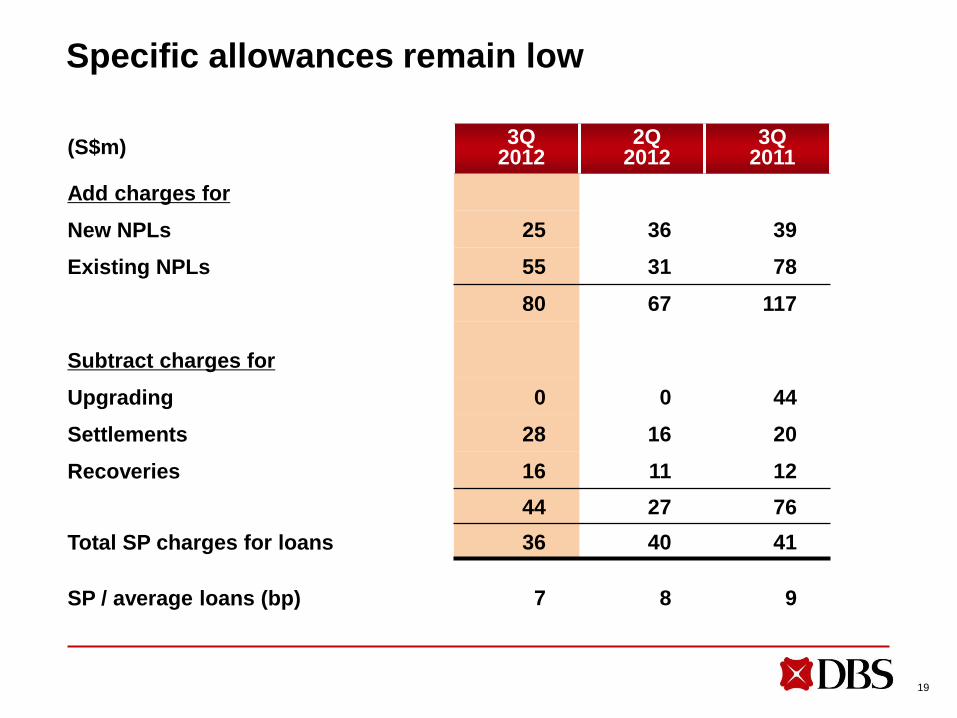
Specific allowances remain low
(S$m) 3Q
2012 2Q
2012 3Q
2011
Add charges for
New NPLs 25 36 39
Existing NPLs 55 31 78
80 67 117
Subtract charges for
Upgrading 0 0 44
Settlements 28 16 20
Recoveries 16 11 12
44 27 76
Total SP charges for loans 36 40 41
SP / average loans (bp) 7 8 9

AFS portfolio diversified between investment-grade government and corporate debt
Sep 12
(S$m)
Jun 12
(S$m)
Singapore government securities 10,007 9,952
Other government securities 12,175 12,615
Supranational, bank and
corporate debt securities 10,651 11,240
Equities 1,107 1,148
Total 33,940 34,955
European governments and banks
As percentage of total assets
1,956
0.5%
2,278
0.6%
20

21
European AFS exposure mostly in AAA entities; no exposure to peripheral countries
(S$m)
Supranational 276 0 276
Germany 690 0 690
United Kingdom 857 117 974
Netherlands 0 16 16
Total 1,823 133 1,956
Government /
Govt-owned Bank Total
*
*
*
* Entities rated AAA by S&P and Fitch, and Aaa by Moody’s

13.1 15.1 14.2 13.5 12.6 12.9 12.7 12.8 13.4
3.6
3.3 3.0 3.0
2.9 2.9 3.7 2.6 3.1
Capital ratios remain strong
22
* Phased-in deduction (of mainly goodwill) against core equity (0% until 31 December 2013)
RWA (S$bn) 177 198
(%)
183
Tier 2
Jun 11
16.5
Mar 11
17.2
Dec 10
18.4
Dec 09
16.7
190 214
Sep 11
15.5
Tier 1
214
Dec 11
15.8
Full
Core Tier 1 (%) based on deductions that are:
Phased in *
11.0 11.5 11.8 11.5 10.7 11.0
13.1 13.5 14.5 14.1 12.6 12.9
225
Jun 12
16.4
11.0
12.8
220
Mar 12
10.9
12.7
15.4
Sep 12
217
11.6
13.4
16.5
23
In summary – nine-month earnings at record
Record performance demonstrates resilience and nimbleness of
our franchise
Strong liquidity, capital and asset quality
While there are headwinds we are well positioned for growth

Disclaimer: The information contained in this document is intended only for use during the presentation and should not be disseminated or
distributed to parties outside the presentation. DBS Bank accepts no liability whatsoever with respect to the use of this document or its contents.
DBS Group Holdings
3Q 2012 financial results
November 1, 2012
Nine-month earnings at record