Embed Size (px)
Citation preview
net_traffic Guide v1.4 series
Nimsoft® Monitor™

Legal Notices Copyright © 2014, CA. All rights reserved.
Warranty
The material contained in this document is provided "as is," and is subject to being changed, without notice, in future editions. Further, to the maximum extent permitted by applicable law, Nimsoft LLC disclaims all warranties, either express or implied, with regard to this manual and any information contained herein, including but not limited to the implied warranties of merchantability and fitness for a particular purpose. Nimsoft LLC shall not be liable for errors or for incidental or consequential damages in connection with the furnishing, use, or performance of this document or of any information contained herein. Should Nimsoft LLC and the user have a separate written agreement with warranty terms covering the material in this document that conflict with these terms, the warranty terms in the separate agreement shall control.
Technology Licenses
The hardware and/or software described in this document are furnished under a license and may be used or copied only in accordance with the terms of such license.
No part of this manual may be reproduced in any form or by any means (including electronic storage and retrieval or translation into a foreign language) without prior agreement and written consent from Nimsoft LLC as governed by United States and international copyright laws.
Restricted Rights Legend
If software is for use in the performance of a U.S. Government prime contract or subcontract, Software is delivered and licensed as "Commercial computer software" as defined in DFAR 252.2277014 (June 1995), or as a "commercial item" as defined in FAR 2.101(a) or as "Restricted computer software" as defined in FAR 52.22719 (June 1987) or any equivalent agency regulation or contract clause. Use, duplication or disclosure of Software is subject to Nimsoft LLC’s standard commercial license terms, and nonDOD Departments and Agencies of the U.S. Government will receive no greater than Restricted Rights as defined in FAR 52.22719(c)(12) (June 1987). U.S. Government users will receive no greater than Limited Rights as defined in FAR 52.22714 (June 1987) or DFAR 252.2277015 (b)(2) (November 1995), as applicable in any technical data.
Trademarks
Nimsoft is a trademark of CA.
Adobe®, Acrobat®, Acrobat Reader®, and Acrobat Exchange® are registered trademarks of Adobe Systems Incorporated.
Intel® and Pentium® are U.S. registered trademarks of Intel Corporation.
Java(TM) is a U.S. trademark of Sun Microsystems, Inc.
Microsoft® and Windows® are U.S. registered trademarks of Microsoft Corporation.
Netscape(TM) is a U.S. trademark of Netscape Communications Corporation.
Oracle® is a U.S. registered trademark of Oracle Corporation, Redwood City, California.
UNIX® is a registered trademark of the Open Group.
ITIL® is a Registered Trade Mark of the Office of Government Commerce in the United Kingdom and other countries.
All other trademarks, trade names, service marks and logos referenced herein belong to their respective companies.
For information on licensed and public domain software, see the Nimsoft Monitor ThirdParty Licenses and Terms of Use document at: http://docs.nimsoft.com/prodhelp/en_US/Library/index.htm?toc.htm?1981724.html.
Contact CA
Contact CA Support
For your convenience, CA Technologies provides one site where you can access the information that you need for your Home Office, Small Business, and Enterprise CA Technologies products. At http://ca.com/support, you can access the following resources:
■ Online and telephone contact information for technical assistance and customer services
■ Information about user communities and forums
■ Product and documentation downloads
■ CA Support policies and guidelines
■ Other helpful resources appropriate for your product
Providing Feedback About Product Documentation
Send comments or questions about CA Technologies Nimsoft product documentation to [email protected].
To provide feedback about general CA Technologies product documentation, complete our short customer survey which is available on the CA Support website at http://ca.com/docs.

Contents 5
Contents
Chapter 1: net_traffic 1.4 7
net_traffic Probe Overview .......................................................................................................................................... 7
Chapter 2: net_traffic Probe Deployment 9
Prerequisites ................................................................................................................................................................ 9
Supported Platforms .................................................................................................................................................... 9
System Requirements .................................................................................................................................................. 9
Software Requirements ............................................................................................................................................. 10
Monitoring System Requirements ............................................................................................................................. 10
Probe Deployment Information ................................................................................................................................. 10
Chapter 3: net_traffic Configuration 11
Probe Configuration Interface Installation ................................................................................................................. 12
Probe Defaults ............................................................................................................................................................ 12
Probe Configuration ................................................................................................................................................... 12
The Setup Tab ..................................................................................................................................................... 13
The Status Tab ..................................................................................................................................................... 19
The Dump Manager Tab...................................................................................................................................... 27
PCAP Filter Examples........................................................................................................................................... 31
Chapter 4: net_traffic QoS Metrics 33

Chapter 1: net_traffic 1.4 7
Chapter 1: net_traffic 1.4
This description applies to net_traffic probe version 1.4.
This section contains the following topics:
net_traffic Probe Overview (see page 7) Documentation Changes (see page 8)
net_traffic Probe Overview
The Network Traffic probe measures the network bandwidth usage in terms of packets per second and bytes per second. You may profile the network usage by defining your own profiles containing criteria such as source, destination (host/network) addresses, and port-service information. It is now simple to monitor the actual bandwidth usage of NetBIOS, Web usage, and more.
net_traffic Probe Overview
8 net_traffic Guide
Documentation Changes
This table describes the version history for this document.
Version Date What's New?
1.4 February 2014 Updated description of the Ref. bandwidth field of the General Tab section.
1.4 June 2013 Added information about existing wincap library in the Prerequisites section.
1.4 December 2012 ■ Added the Filter Manager topic in The Profile Utilization section.
■ Added the Probe Defaults topic.
1.3 March 2011 Added support for 64-bit Linux platform and added NIS changes.
Related Documentation
Documentation for other versions of the net_traffic probe
The Release Notes for the net_traffic probe
Monitor Metrics Reference Information for CA Nimsoft Probes (http://docs.nimsoft.com/prodhelp/en_US/Probes/ProbeReference/index.htm)
Chapter 2: net_traffic Probe Deployment 9
Chapter 2: net_traffic Probe Deployment
This section contains the system requirements and deployment information for the net_traffic probe.
This section contains the following topics:
Prerequisites (see page 9) Supported Platforms (see page 9) System Requirements (see page 9) Software Requirements (see page 10) Monitoring System Requirements (see page 10) Probe Deployment Information (see page 10)
Prerequisites
There should not be any existing winpcap library in the machine before installing the net_traffic probe on 2008 32 bit.
Supported Platforms
The New Probe probe is supported on the same set of operating systems and databases as the Nimsoft Monitor Server solution. Please refer to the:
■ Nimsoft Compatibility Support Matrix for the latest information on supported platforms.
■ Support Matrix for Nimsoft Probes for additional information on the New Probe probe.
System Requirements
The net_traffic probe should be installed on systems with the following minimum resources:
■ Memory: 2-4GB of RAM. Probe's OOB configuration requires 256MB of RAM'
■ CPU: 3GHz dual-core processor, 32-bit or 64-bit
Software Requirements
10 net_traffic Guide
Software Requirements
The net_traffic probe requires the following software environment:
■ Nimsoft Monitor Server 5.1.1 or later
■ Nimsoft Robot 5.23 or later
■ Java Virtual Machine 1.6 or later (typically installed with NMS 5.0 and above)
Monitoring System Requirements
The Network traffic analyzer (net_traffic probe) monitors the network traffic activity and bandwidth usage.
Probe Deployment Information
There are three ways to distribute archive packages. You can distribute the package within the web-based Admin Console (for supported probes), from within Infrastructure Manager, or use the standalone Nimsoft Distribution application.See Probe Deployment for more information on deploying probes.
Chapter 3: net_traffic Configuration 11
Chapter 3: net_traffic Configuration
The net_traffic probe captures network packets that flows through the "wire" and counts the amount of data the packet carries. The probe is predefined with a set of system counters, such as All Ethernet traffic, All TCP/IP traffic, etc. It is possible to configure your own profiles that define various network parameters (source, destination, port and family) as basis for a counter. The network traffic is displayed using various graphs in the user-interface and may be used to determine/troubleshoot network problems.
The network traffic may be monitored/traced using the built-in network-tracing capabilities accessed from the user-interface. This feature collects and summarizes the captured packets and shows the information in a separate "sniffer" window.
Features:
■ Monitor the amount of bandwidth used for various Ethernet protocols and families, such as IP, ARP, RARP, IPX, TCP, UDP, etc. (called system counters).
■ Ability to define your own profile, with source/destination networks/IP-addresses and one or more protocol definitions that becomes a user-defined "counter". For example all traffic from one network to the other, all traffic related to NetBIOS, to/from a specific machine/network, etc.
■ Give alarm notifications whenever a system-counter threshold or custom-threshold is breached.
■ View the network activity (bytes/packet) in real-time graphs.
■ A packet-sniffer (without the content browser) to determine where the bandwidth is compromised with a powerful filtering facility.
■ A summary window that shows the top-n traffic users.
■ Remote dump management. Initiate a network dump at the remote site, and examine the data locally on your PC.
■ Possible to create filters to trigger automatic dump when the pattern specified in the filter is found.
This section describes the configuration concepts and procedures for setting up the net_traffic probe.
This section contains the following topics:
Probe Configuration Interface Installation (see page 12) Probe Defaults (see page 12) Probe Configuration (see page 12)
Probe Configuration Interface Installation
12 net_traffic Guide
Probe Configuration Interface Installation
The probe configuration interface is automatically downloaded and installed by the Nimsoft Infrastructure Manager when the probe is deployed on a robot.
Probe Defaults
At the time of deploying a probe for the first time on robot, some default configuration will get deployed automatically. These probe defaults could be Alarms, QoS, Profiles and so on which save time to configure the default settings. These probe defaults will be seen on a fresh install, that is no instance of that probe is already available on that robot in activated or deactivated state.
Probe Configuration
This section contains specific configuration for the probe.
Probe Configuration
Chapter 3: net_traffic Configuration 13
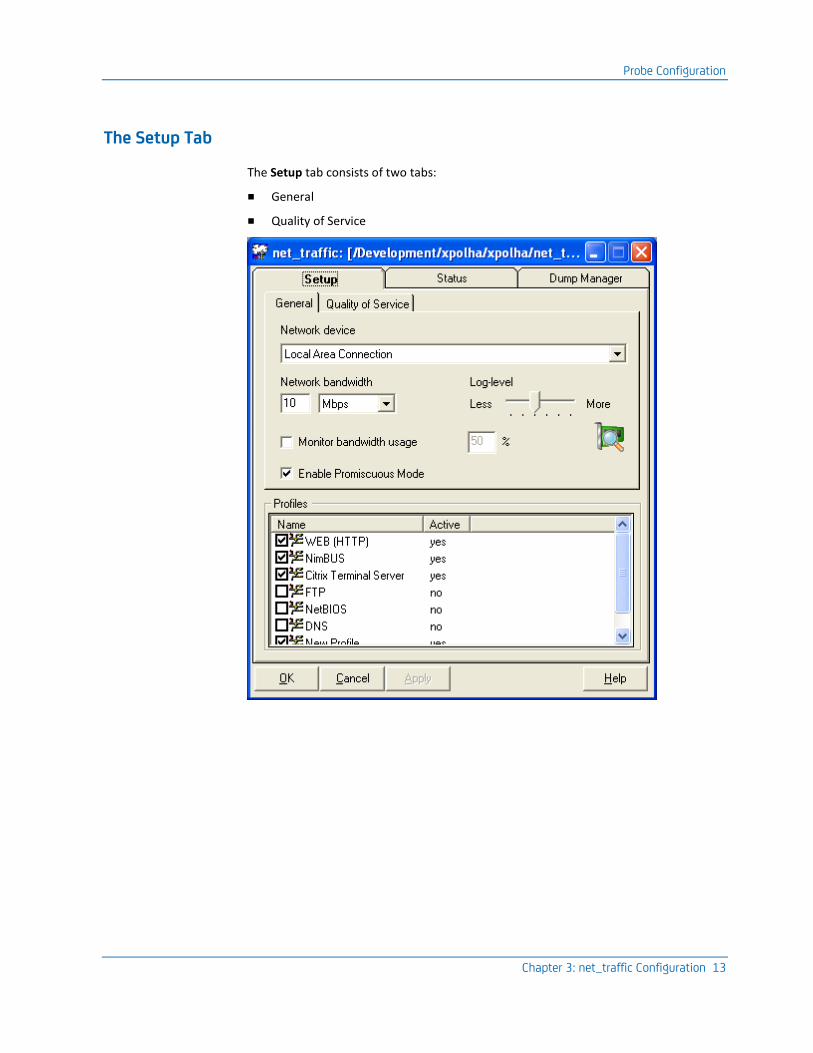
The Setup Tab
The Setup tab consists of two tabs:
■ General
■ Quality of Service
Probe Configuration
14 net_traffic Guide
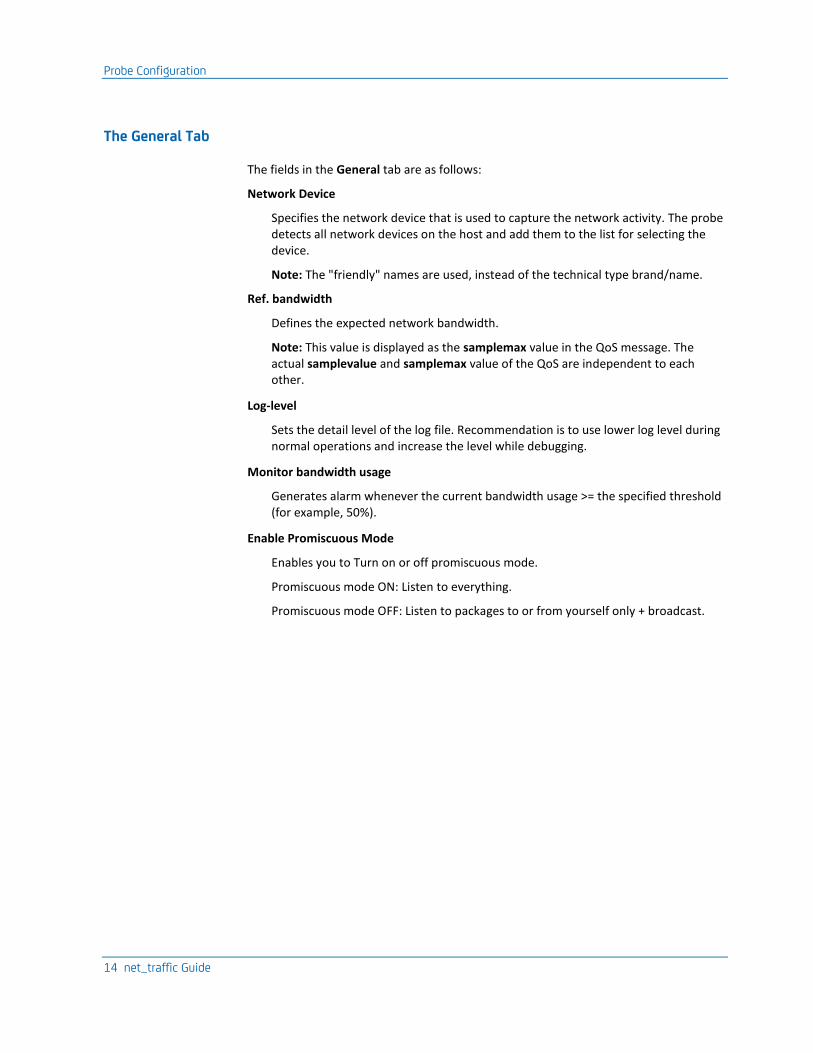
The General Tab
The fields in the General tab are as follows:
Network Device
Specifies the network device that is used to capture the network activity. The probe detects all network devices on the host and add them to the list for selecting the device.
Note: The "friendly" names are used, instead of the technical type brand/name.
Ref. bandwidth
Defines the expected network bandwidth.
Note: This value is displayed as the samplemax value in the QoS message. The actual samplevalue and samplemax value of the QoS are independent to each other.
Log-level
Sets the detail level of the log file. Recommendation is to use lower log level during normal operations and increase the level while debugging.
Monitor bandwidth usage
Generates alarm whenever the current bandwidth usage >= the specified threshold (for example, 50%).
Enable Promiscuous Mode
Enables you to Turn on or off promiscuous mode.
Promiscuous mode ON: Listen to everything.
Promiscuous mode OFF: Listen to packages to or from yourself only + broadcast.

Probe Configuration
Chapter 3: net_traffic Configuration 15
The Quality of Service Tab
The fields in the above dialog box are as follows:
QoS Interval
Defines the interval to send Quality of Service messages. By default, it is 300 seconds.
QoS Name
Activate/deactivate the counters to generate QoS messages as per your needs.
Probe Configuration
16 net_traffic Guide
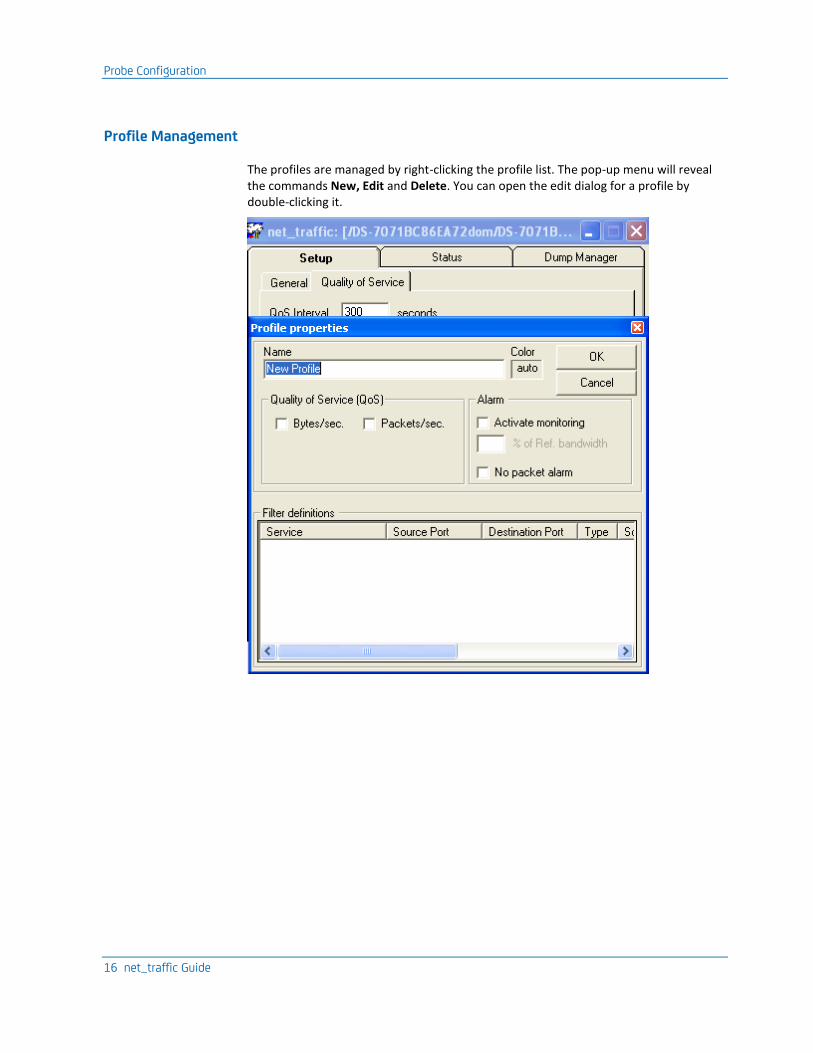
Profile Management
The profiles are managed by right-clicking the profile list. The pop-up menu will reveal the commands New, Edit and Delete. You can open the edit dialog for a profile by double-clicking it.
Probe Configuration
Chapter 3: net_traffic Configuration 17
Each active profile will become a counter in the probe. Packets matching the profile criteria will be accounted for and made available to SLM as Quality of Service objects. The profile may include IP addresses defining the source (host or network) address and/or destination address. You may add filter definitions to your profile by right-clicking the filter list. This will bring up a pop-up menu revealing the commands New, Edit and Delete. Double-clicking a selected profile will edit the filter definition.
The fields in the above dialog box are explained below:
Name
The profile name.
Color
Defines the graph color for the profile utilization plot.
QoS Bytes/Sec.
Enables/disables Quality of Service delivery (bytes per seconds).
QoS Packet/Sec.
Enables/disables Quality of Service delivery (packets per seconds).
Activates monitoring
Activates the alarm functionality alarm monitoring and defines the alarm threshold value in % of total bandwidth.
Note: On selecting Activate monitoring check box, value in % of Ref Bandwidth field must be entered, in order to save the profile.
No packet alarm
If this option is selected, an alarm will be issued if no traffic is detected in the interval.
Filter Properties
Right-clicking a profile brings up the Profile properties dialog, the protocol list defines the following fields:
Name
Specifies the network service name to monitor.
Ignore network direction
When selected, the direction of the traffic is ignored. Clear this option only if you need to specifically set the source and/or destination information.
IP Protocol filter
Defines the protocol family (TCP/UDP).
Probe Configuration
18 net_traffic Guide
Port
Defines the actual port number (service) to monitor. You can select a specific port, or you can select to monitor any port.
■ Source port: This is the port from which the packets are sent.
■ Destination port: This is the port to which the packets are sent.
Exclude port
If a specific port was selected above, you can select to exclude this port and monitor any other ports.
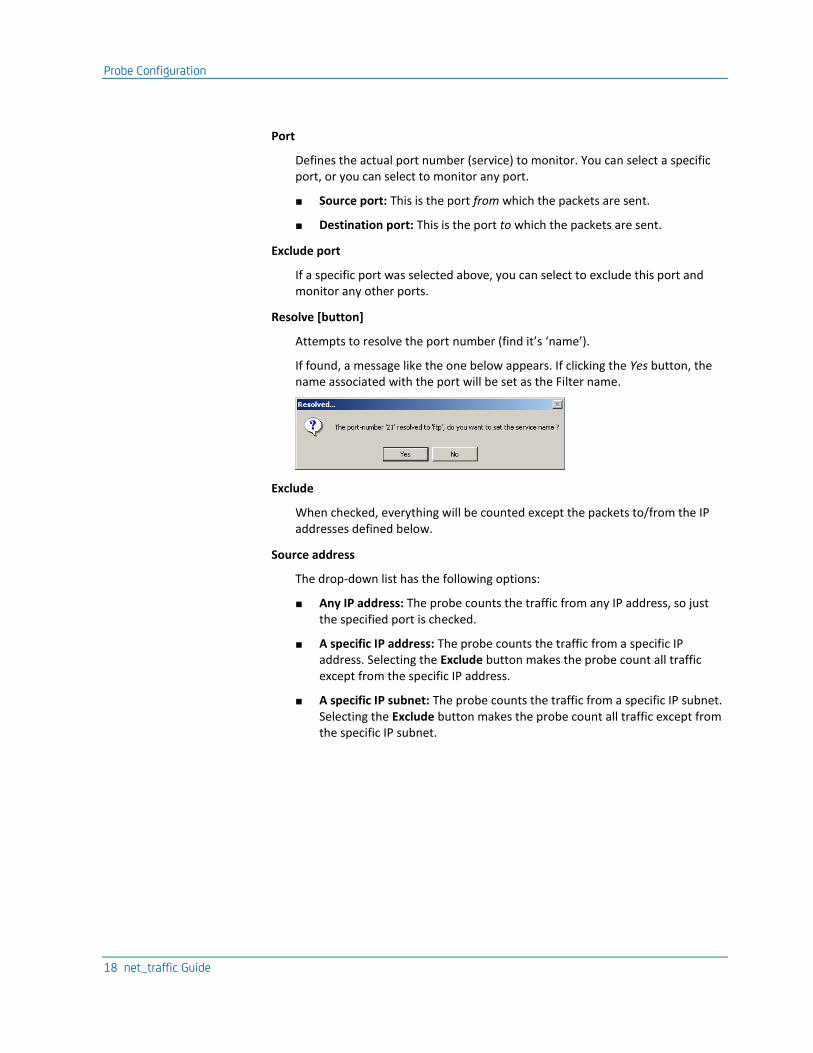
Resolve [button]
Attempts to resolve the port number (find it’s ‘name’).
If found, a message like the one below appears. If clicking the Yes button, the name associated with the port will be set as the Filter name.
Exclude
When checked, everything will be counted except the packets to/from the IP addresses defined below.
Source address
The drop-down list has the following options:
■ Any IP address: The probe counts the traffic from any IP address, so just the specified port is checked.
■ A specific IP address: The probe counts the traffic from a specific IP address. Selecting the Exclude button makes the probe count all traffic except from the specific IP address.
■ A specific IP subnet: The probe counts the traffic from a specific IP subnet. Selecting the Exclude button makes the probe count all traffic except from the specific IP subnet.
Probe Configuration
Chapter 3: net_traffic Configuration 19
Destination address
The drop-down list has the following options:
■ Any IP address: The probe counts the traffic to any IP address, so just the specified port is checked.
■ A specific IP address: The probe counts the traffic to a specific IP address. Selecting the Exclude button makes the probe count all traffic except to the specific IP address.
■ A specific IP subnet: The probe counts the traffic to a specific IP subnet. Selecting the Exclude button makes the probe count all traffic except to the specific IP subnet.
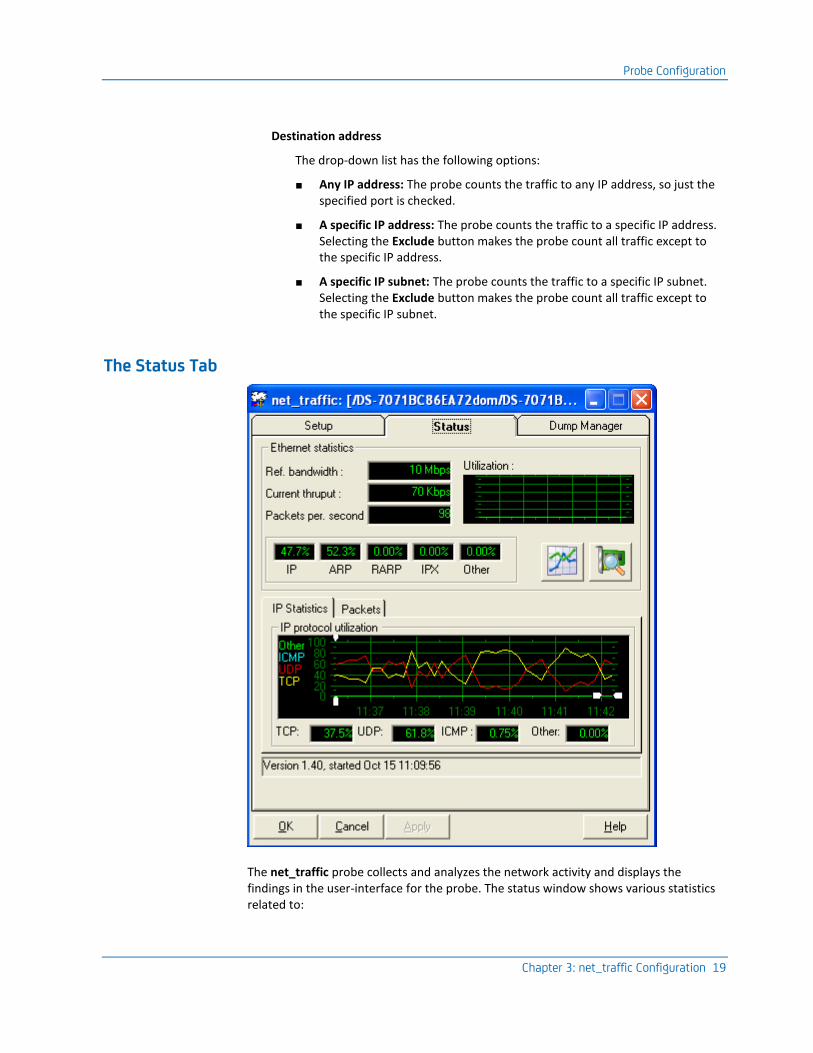
The Status Tab
The net_traffic probe collects and analyzes the network activity and displays the findings in the user-interface for the probe. The status window shows various statistics related to:
Probe Configuration
20 net_traffic Guide
■ Ethernet statistics, displaying
■ The maximum bandwidth for the network device selected on the Setup tab.
■ The current throughput.
■ The number of packet per second
The utilization is displayed in a separate graph.
Also the statistics for the different network protocols is displayed:
■ IP (Internet Protocol)
■ ARP (Address Resolution Protocol)
■ RARP (Remote Address Resolution Protocol)
■ IPX (Internetwork Package exchange)
■ Others
■ IP protocol utilization, displaying the different transport protocols in a graph:
■ TCP (Transmission Control Protocol)
■ UDP (User Datagram Protocol)
■ ICMP (Internet Control Message Protocol)
■ Others
■ Packet distribution.
This graph shows the amount of the different packet sizes processed.
The graphs that display the network traffic are equipped with horizontal and vertical handles that enable you to zoom in/out on time and on the values. Right-clicking the graph brings up the pop-up menu to enable/disable filled graphs.
All values/counters represent traffic utilization related to the used bandwidth. E.g. if the IP counter shows 98.2%, then this means that 98.2% of the current traffic is IP based. The network utilization graph shows the traffic related to the defined bandwidth.
You can launch the profile utilization window and the Network Sniffer by clicking the appropriate/corresponding button in the status window.
Save Window Layout and Positions
Pressing Ctrl+S in the Status window will save your preferred settings in registry.
Probe Configuration
Chapter 3: net_traffic Configuration 21
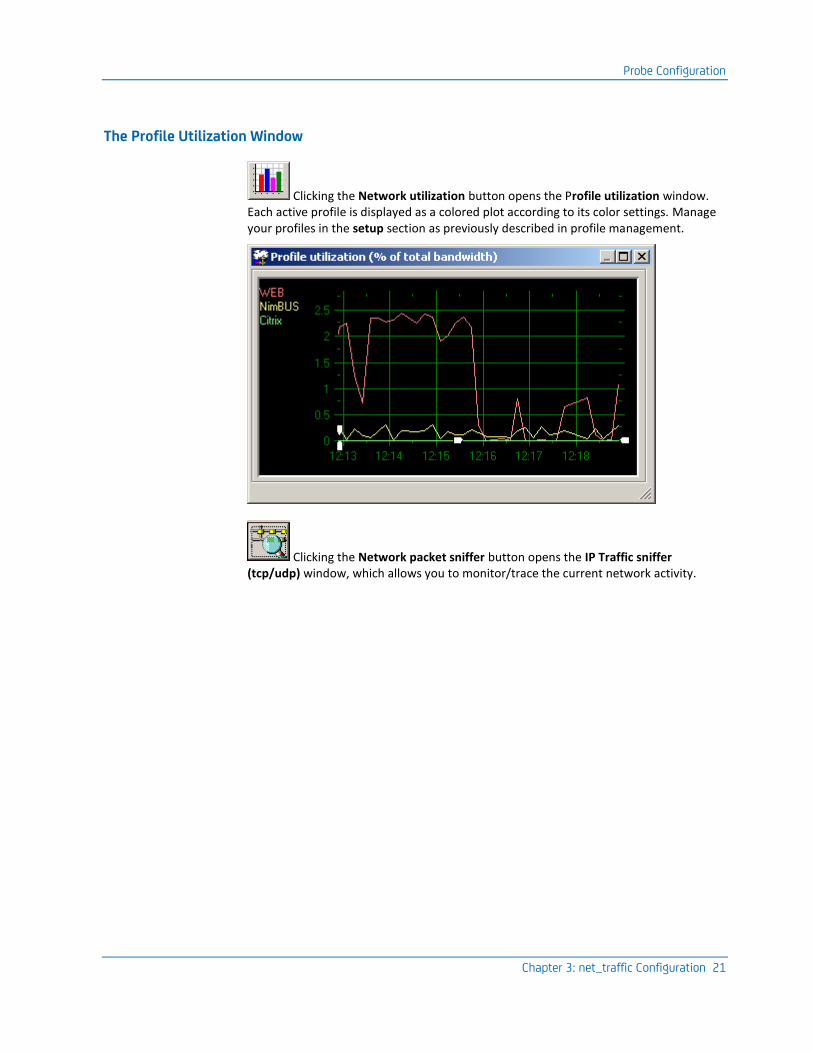
The Profile Utilization Window
Clicking the Network utilization button opens the Profile utilization window. Each active profile is displayed as a colored plot according to its color settings. Manage your profiles in the setup section as previously described in profile management.
Clicking the Network packet sniffer button opens the IP Traffic sniffer (tcp/udp) window, which allows you to monitor/trace the current network activity.
Probe Configuration
22 net_traffic Guide
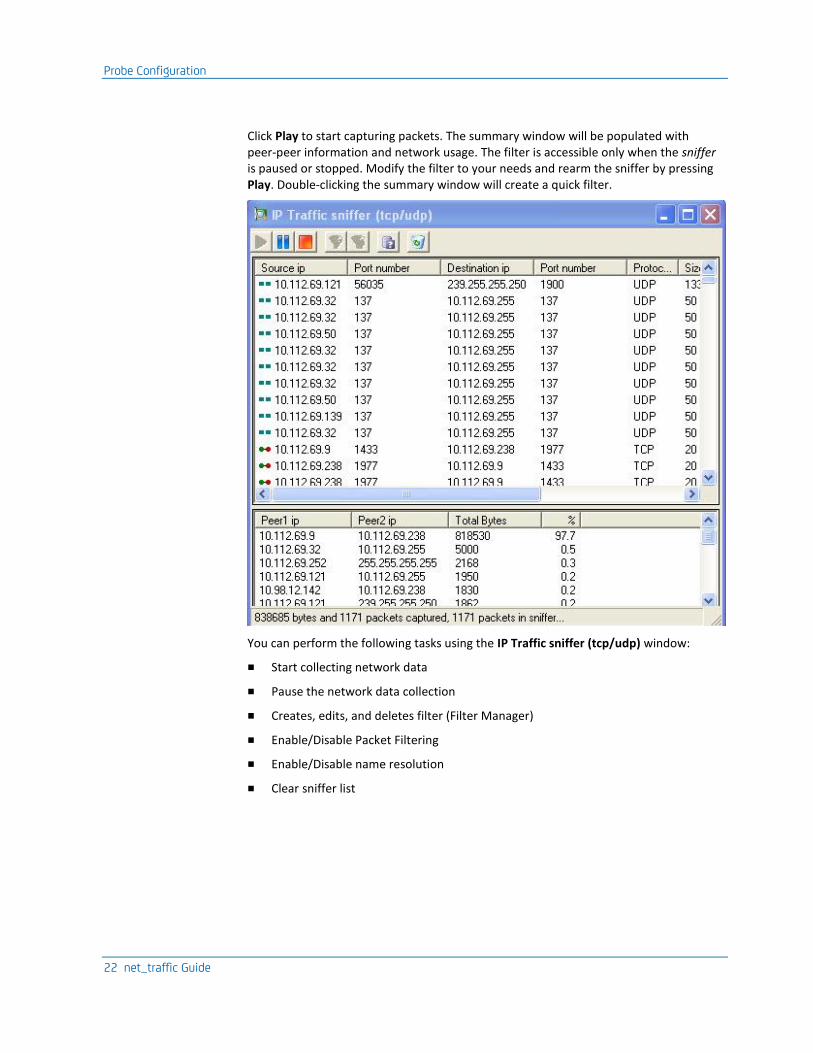
Click Play to start capturing packets. The summary window will be populated with peer-peer information and network usage. The filter is accessible only when the sniffer is paused or stopped. Modify the filter to your needs and rearm the sniffer by pressing Play. Double-clicking the summary window will create a quick filter.
You can perform the following tasks using the IP Traffic sniffer (tcp/udp) window:
■ Start collecting network data
■ Pause the network data collection
■ Creates, edits, and deletes filter (Filter Manager)
■ Enable/Disable Packet Filtering
■ Enable/Disable name resolution
■ Clear sniffer list
Probe Configuration
Chapter 3: net_traffic Configuration 23
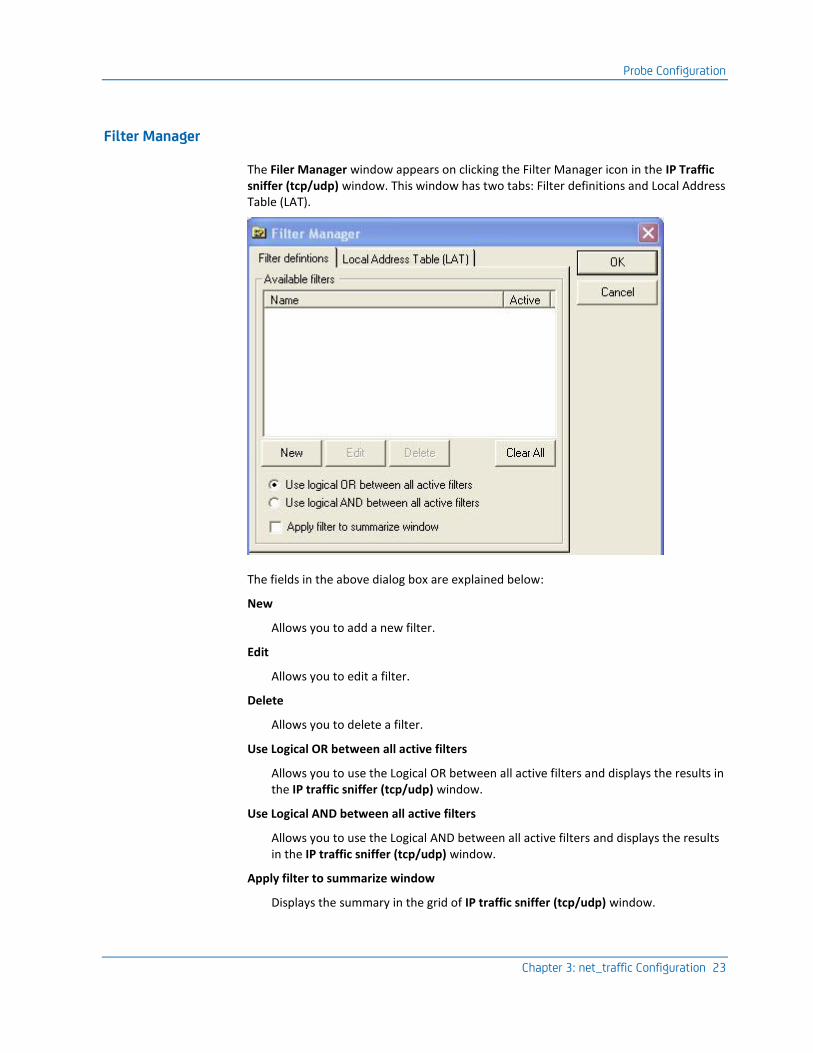
Filter Manager
The Filer Manager window appears on clicking the Filter Manager icon in the IP Traffic sniffer (tcp/udp) window. This window has two tabs: Filter definitions and Local Address Table (LAT).
The fields in the above dialog box are explained below:
New
Allows you to add a new filter.
Edit
Allows you to edit a filter.
Delete
Allows you to delete a filter.
Use Logical OR between all active filters
Allows you to use the Logical OR between all active filters and displays the results in the IP traffic sniffer (tcp/udp) window.
Use Logical AND between all active filters
Allows you to use the Logical AND between all active filters and displays the results in the IP traffic sniffer (tcp/udp) window.
Apply filter to summarize window
Displays the summary in the grid of IP traffic sniffer (tcp/udp) window.
Probe Configuration
24 net_traffic Guide
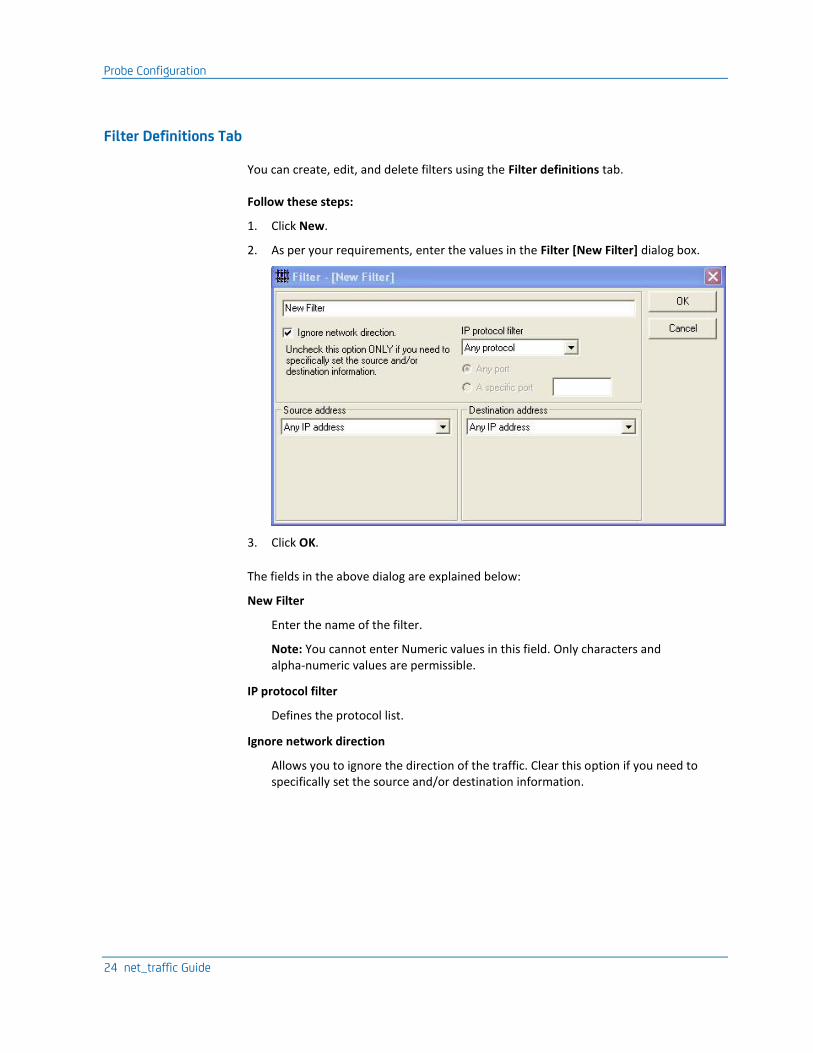
Filter Definitions Tab
You can create, edit, and delete filters using the Filter definitions tab.
Follow these steps:
1. Click New.
2. As per your requirements, enter the values in the Filter [New Filter] dialog box.
3. Click OK.
The fields in the above dialog are explained below:
New Filter
Enter the name of the filter.
Note: You cannot enter Numeric values in this field. Only characters and alpha-numeric values are permissible.
IP protocol filter
Defines the protocol list.
Ignore network direction
Allows you to ignore the direction of the traffic. Clear this option if you need to specifically set the source and/or destination information.

Probe Configuration
Chapter 3: net_traffic Configuration 25
Source address
The drop-down list has the following options:
■ Any IP address: The probe counts the traffic from any IP- address, so just the specified port is checked.
■ A specific IP address: The probe counts the traffic from a specific IP address. Selecting the Exclude button makes the probe count all traffic except from the specific IP address.
■ A specific IP subnet: The probe counts the traffic from a specific IP subnet. Selecting the Exclude button makes the probe count all traffic except from the specific IP subnet.
■ A specific IP range: The probe counts the traffic from a specific IP range.
■ LAN addresses: The probe counts the traffic from LAN addresses.
■ WAN addresses: The probe counts the traffic from WAN addresses.
Destination address
The drop-down list has the following options:
■ Any IP address: The probe counts the traffic to any IP- address, so just the specified port is checked.
■ A specific IP address: The probe counts the traffic to a specific IP address. Selecting the Exclude button makes the probe count all traffic except to the specific IP address.
■ A specific IP subnet: The probe counts the traffic to a specific IP subnet. Selecting the Exclude button makes the probe count all traffic except to the specific IP subnet.
■ A specific IP range: The probe counts the traffic from a specific IP range.
■ LAN addresses: The probe counts the traffic from LAN addresses.
■ WAN addresses: The probe counts the traffic from WAN addresses.
Probe Configuration
26 net_traffic Guide
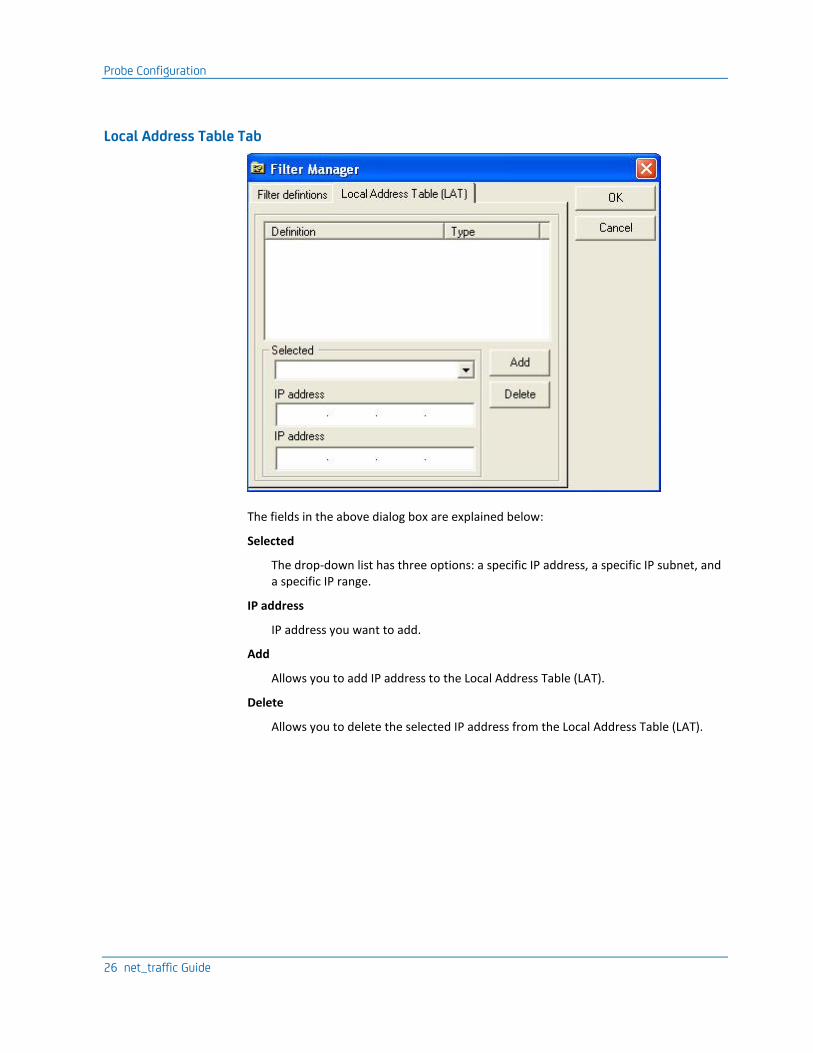
Local Address Table Tab
The fields in the above dialog box are explained below:
Selected
The drop-down list has three options: a specific IP address, a specific IP subnet, and a specific IP range.
IP address
IP address you want to add.
Add
Allows you to add IP address to the Local Address Table (LAT).
Delete
Allows you to delete the selected IP address from the Local Address Table (LAT).
Probe Configuration
Chapter 3: net_traffic Configuration 27
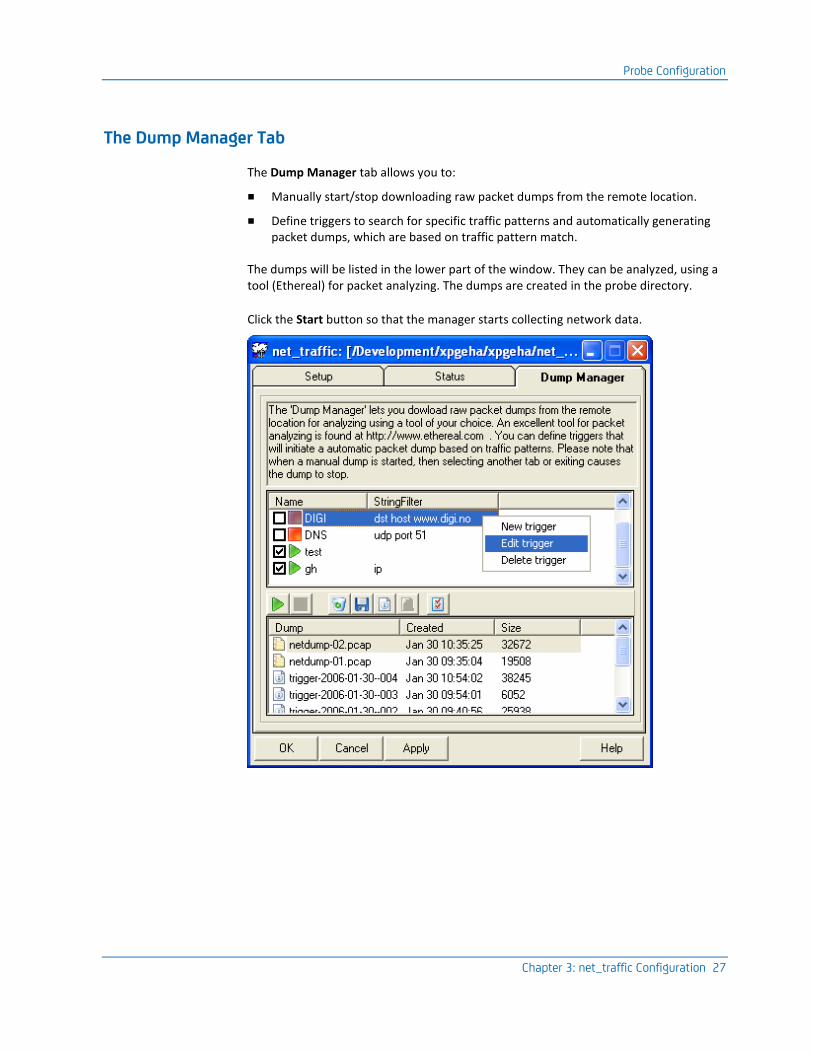
The Dump Manager Tab
The Dump Manager tab allows you to:
■ Manually start/stop downloading raw packet dumps from the remote location.
■ Define triggers to search for specific traffic patterns and automatically generating packet dumps, which are based on traffic pattern match.
The dumps will be listed in the lower part of the window. They can be analyzed, using a tool (Ethereal) for packet analyzing. The dumps are created in the probe directory.
Click the Start button so that the manager starts collecting network data.
Probe Configuration
28 net_traffic Guide
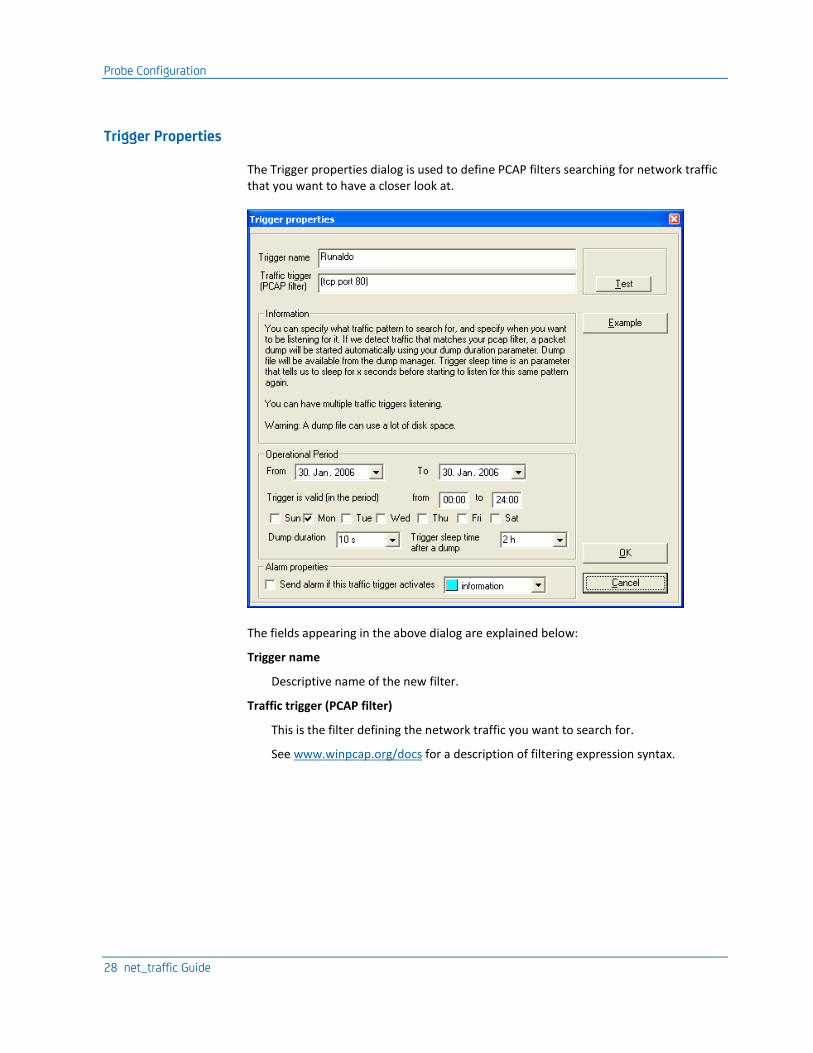
Trigger Properties
The Trigger properties dialog is used to define PCAP filters searching for network traffic that you want to have a closer look at.
The fields appearing in the above dialog are explained below:
Trigger name
Descriptive name of the new filter.
Traffic trigger (PCAP filter)
This is the filter defining the network traffic you want to search for.
See www.winpcap.org/docs for a description of filtering expression syntax.
Probe Configuration
Chapter 3: net_traffic Configuration 29
Operational Period
Specifies the operational (active) periods for the filter.
The From and To fields both offer a calendar functionality, enabling you to select an operational period for the trigger. That means that the trigger is operational in the specified period, but will only be active according the day and time specifications below.
■ Trigger is valid: Select the time period and the day(s) the filter should be active.
■ Dump duration: Specify the maximum time (in seconds) a dump to file should last. That is done to avoid unnecessary large dump files.
■ Time sleep time after a dump: Specify the time (in seconds) between trigger dumps. This interval specifies how long the probe must wait after a dump before it is allowed to perform a new dump.
Test button
Tests the trigger definition. The indicators above the button indicate whether the syntax is correct or incorrect.
Alarm properties
Select this option if you want the probe to send an alarm when traffic matching the filter defined is detected. You may also select the severity of the alarm.
Example button
Inserts an example filter.
When match, a file containing details are dumped to the probe directory: Program Files/Nimsoft/probes/network/net_traffic/dumps. Use the Ethereal tool to analyze the contents of the file.
Note: There is no database to keep records of your trigger dump files. When the GUI program is open, and you have selected the Dump manager tab, the GUI will poll the probe for triggers every 10 seconds. If you let your dump archive grow too big, the GUI and probe will suffer performance loss. In that case it is important to delete dumps that you don’t need anymore, using the Delete button (described below).
Tool buttons and Indicators
As mentioned above, you may add, edit or delete a trigger by right-clicking in the window. Notice that a newly defined trigger NOT is activated (has a red icon) until you select it in the list. When selected, the icons changes to green.
Probe Configuration
30 net_traffic Guide
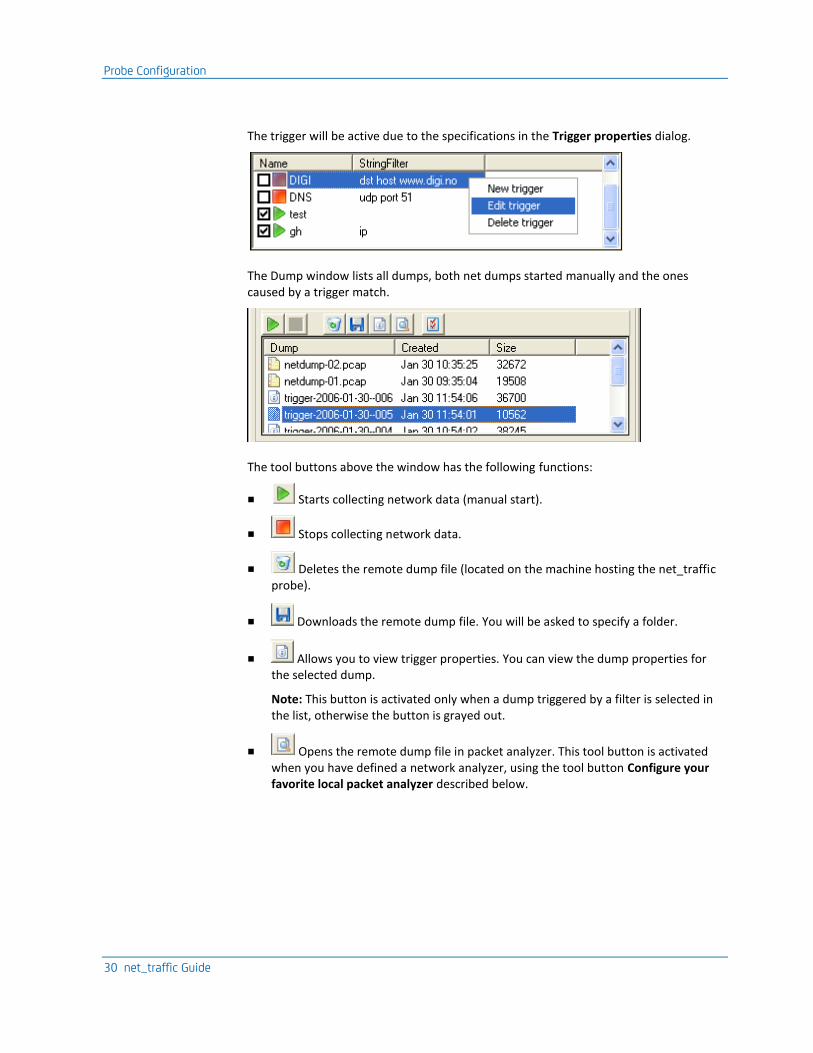
The trigger will be active due to the specifications in the Trigger properties dialog.
The Dump window lists all dumps, both net dumps started manually and the ones caused by a trigger match.
The tool buttons above the window has the following functions:
■ Starts collecting network data (manual start).
■ Stops collecting network data.
■ Deletes the remote dump file (located on the machine hosting the net_traffic probe).
■ Downloads the remote dump file. You will be asked to specify a folder.
■ Allows you to view trigger properties. You can view the dump properties for the selected dump.
Note: This button is activated only when a dump triggered by a filter is selected in the list, otherwise the button is grayed out.
■ Opens the remote dump file in packet analyzer. This tool button is activated when you have defined a network analyzer, using the tool button Configure your favorite local packet analyzer described below.
Probe Configuration
Chapter 3: net_traffic Configuration 31
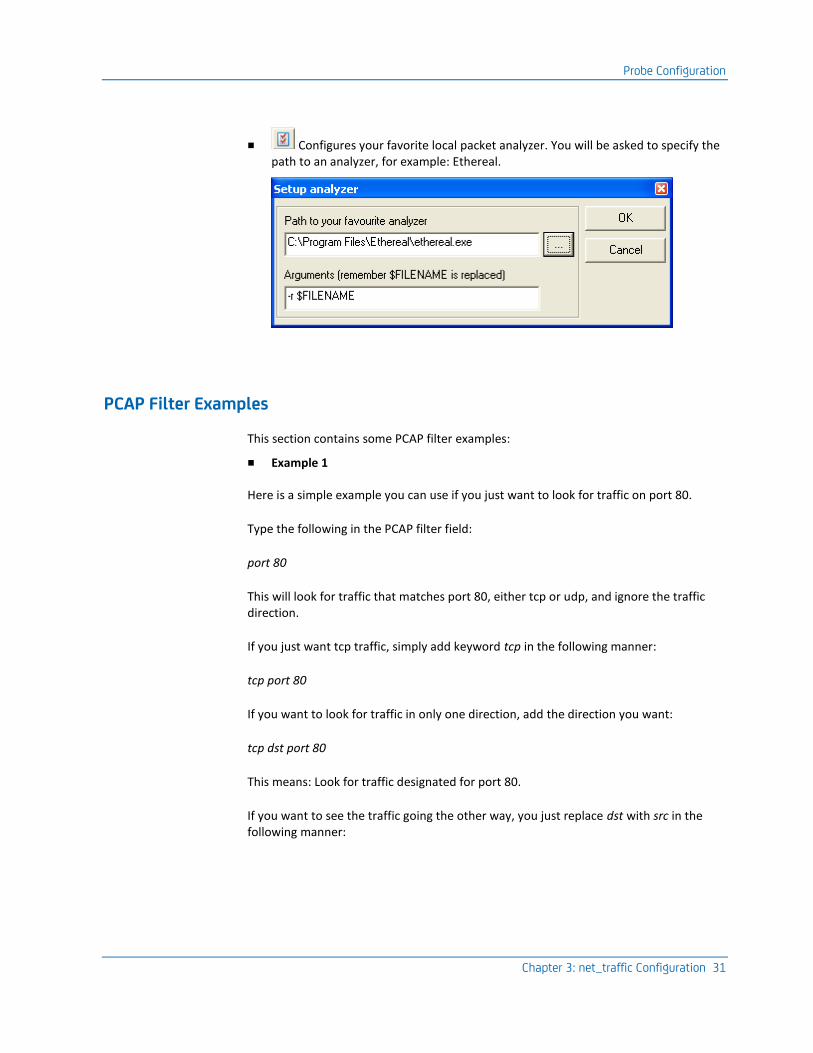
■ Configures your favorite local packet analyzer. You will be asked to specify the path to an analyzer, for example: Ethereal.
PCAP Filter Examples
This section contains some PCAP filter examples:
■ Example 1
Here is a simple example you can use if you just want to look for traffic on port 80.
Type the following in the PCAP filter field:
port 80
This will look for traffic that matches port 80, either tcp or udp, and ignore the traffic direction.
If you just want tcp traffic, simply add keyword tcp in the following manner:
tcp port 80
If you want to look for traffic in only one direction, add the direction you want:
tcp dst port 80
This means: Look for traffic designated for port 80.
If you want to see the traffic going the other way, you just replace dst with src in the following manner:
Probe Configuration
32 net_traffic Guide
tcp src port 80
■ Example 2
Let’s say you have two networks: 193.71.55.0/24 and 10.1.7.0/24.
Some of your servers on the 193.71.55.0 network have both ftp and ssh ports open, and you want to see if anybody uses them at night.
You also want to see if anybody tries to access your web server on the 10.1.7.0 network. You can then combine several ‘rules’ to accomplish this. Here is an example of how this could be done:
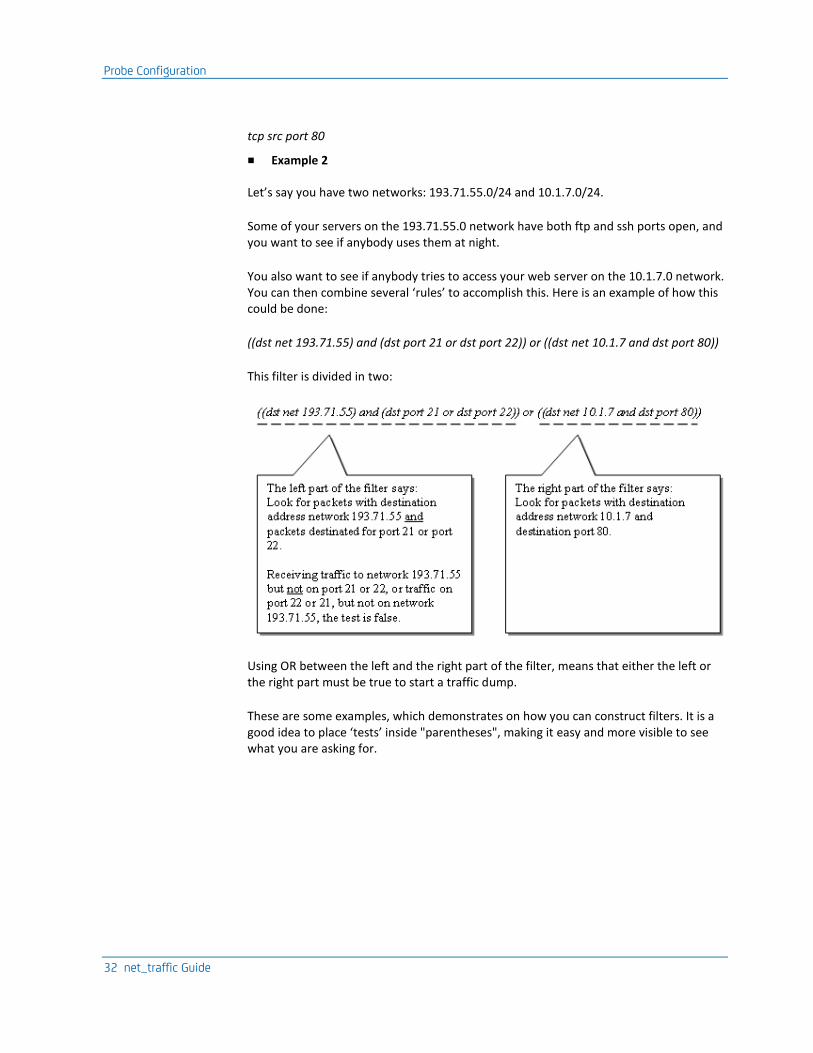
((dst net 193.71.55) and (dst port 21 or dst port 22)) or ((dst net 10.1.7 and dst port 80))
This filter is divided in two:
Using OR between the left and the right part of the filter, means that either the left or the right part must be true to start a traffic dump.
These are some examples, which demonstrates on how you can construct filters. It is a good idea to place ‘tests’ inside "parentheses", making it easy and more visible to see what you are asking for.
Chapter 4: net_traffic QoS Metrics 33
Chapter 4: net_traffic QoS Metrics
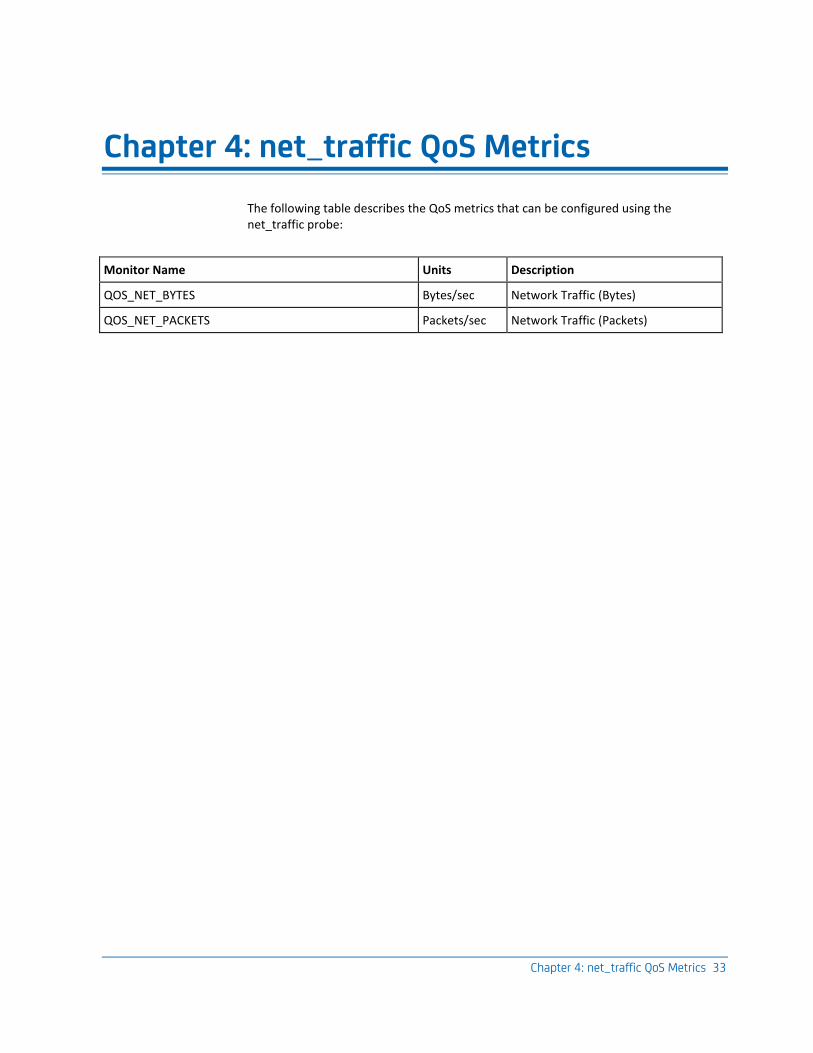
The following table describes the QoS metrics that can be configured using the net_traffic probe:
Monitor Name Units Description
QOS_NET_BYTES Bytes/sec Network Traffic (Bytes)
QOS_NET_PACKETS Packets/sec Network Traffic (Packets)