Embed Size (px)
Citation preview
8/6/2019 Nimsoft Gaining Monitoring Clarity VMware Environments
http://slidepdf.com/reader/full/nimsoft-gaining-monitoring-clarity-vmware-environments 1/11
Virtual Certainty
Best Practices for Gaining Monitoring Clarityin VMware Environments
WHITE PAPER

8/6/2019 Nimsoft Gaining Monitoring Clarity VMware Environments
http://slidepdf.com/reader/full/nimsoft-gaining-monitoring-clarity-vmware-environments 2/11
Virtual Certainty
2
Table of Contents
Executive Summary ......................................................................................3
Introduction .................................................................................................3
Challenges of Monitoring Virtualized Environments ...........................................4
Best Practice #1: Get a Complete Picture of the Infrastructure ...........................5
Best Practice #2: Automate Monitoring of VMs ................................................6
Best Practice #3: Correlate Physical and Virtual Resources ................................ 7
Best Practice #4: Maintain Awareness with vMotion, HA, and DRS ................... 8
Best Practice #5: Fully Integrate Monitoring with the Rest of the Infrastructure .... 8
Best Practice #6: Track and Communicate the Value of IT and Virtualization ...... 9
Nimsoft: Optimizing Performance and Ef ciency in Virtualized Environments ...... 10
Conclusion ................................................................................................ 10

8/6/2019 Nimsoft Gaining Monitoring Clarity VMware Environments
http://slidepdf.com/reader/full/nimsoft-gaining-monitoring-clarity-vmware-environments 3/11

8/6/2019 Nimsoft Gaining Monitoring Clarity VMware Environments
http://slidepdf.com/reader/full/nimsoft-gaining-monitoring-clarity-vmware-environments 4/11

8/6/2019 Nimsoft Gaining Monitoring Clarity VMware Environments
http://slidepdf.com/reader/full/nimsoft-gaining-monitoring-clarity-vmware-environments 5/11
Virtual Certainty
5
many disparate tools in order to get answers to these types of questions:
• Is the application on the VM down?
• Has the network service in the guest VM failed?
• Is the VM guest OS operational?
• Is there a problem with the virtual network on the ESXhost?
• Has the ESX host failed?
• Is the physical network adapter on the serveroperational?
• Is there a power or CPU problem on the physicalserver?
• Have the fabric interconnects to storage from thephysical server failed?
• Is the storage that underlies the physical serveroperational?
As organizations continue to run vital business services invirtualized environments, while expecting administrators tomanage an increasing number of resources in these complexenvironments, they need to apply a host of best practices fordelivering, con guring, and using monitoring. The followingsections outline these best practices.
Best Practice #1: Get a Complete
Picture of the InfrastructureTo effectively control virtualized environments, administrators
need to gain a comprehensive, multi-layered view of theentire virtualized infrastructure—including physical systems,virtualized resources, and applications.
To illustrate, consider the following scenario. An administratorreceives repeated calls from users, who claim that the internalbanking application used to serve checking statements is“taking forever”. The administrator has VMware vSphererunning, which offers basic monitoring of CPU, memory, disk,and network usage. Using vSphere, the administrator can seethat the virtualized servers, which are running the multi-tierWeb application that serves the checking statements, appear
healthy. However, while disk, networking, and memory areall within their threshold limits, CPU usage is exceeding thresholds on several application servers. Given the fact that theapplication spans multiple tiers, including Web, application, and database servers, identifying the source of the issue can bea real problem. In order to nd and x the problem, the administrator needs to take a deeper look into additional layers of infrastructure:
• A “noisy neighbor” located on the same physical server may be consuming all of the available CPU and causing theslowdown.
• An Apache Tomcat server or WebLogic application server may be having issues due to a recent software patch—whileOS, memory, and disk all appear ne, the required services are consuming more resource than expected.
Monitoring Converged Infrastructure PacksIn order to fully leverage the bene ts of virtualization,many organizations are looking to build private clouds.However, designing, developing, testing, and implementing
a private cloud may take considerable time, expense, andeffort. Further, to develop these clouds, businesses musteither reallocate existing infrastructure elements, or gothrough the process of architecture development, design,procurement, and implementation of all the hardware andsoftware required. Consequently, converged infrastructurepacks, such as Vblock and FlexPod, offer a very compellingsolution. These converged infrastructure packs includeeverything an organization needs to deploy a privatecloud, including servers, software, and hardware—all fullyintegrated and ready to plug in, with one purchase and oneorganization providing support.
Once deployed, however, organizations need to monitorand maintain performance of these converged infrastructuresolutions, just as they would any other infrastructurecomponent. Further, even with monitoring for each of the speci c systems within these infrastructure packs,administrators will still be challenged, as with monitoringany virtualized environment. Gaining a cohesive, singleview of these infrastructure packs grows more criticalbecause a solution like Vblock 2 is capable of running 3,000to 8,000 VMs—the equivalent processing power of an entire oor in a data center employing last-generation technology.
The extreme density of infrastructure packs’ computingpower, the virtualized nature of their resources, and thenon- standard nature of their supporting hardware requiresa different approach to successfully ensure organizationsmeet SLAs and uptime commitments of applications andIT services. To effectively run converged infrastructurepacks, IT teams need a monitoring solution that coversall of the physical, virtual, and application layers; one thatautomatically discovers changes to resources; and one thatautomatically deploys monitoring, displays, and reports.
8/6/2019 Nimsoft Gaining Monitoring Clarity VMware Environments
http://slidepdf.com/reader/full/nimsoft-gaining-monitoring-clarity-vmware-environments 6/11
Virtual Certainty
6
• vCenter may be down or not be responding as expected, for example, not reallocating CPU with DRS when thresholdsare hit, and so the resources the application requires aren’t available.
• Networking bandwidth to the physical server may be constrained by other applications sharing the same resource.
• The problem might not be in the VMs experiencing high CPU usage at all, but in downstream access to a databasecluster, one that resides outside of the virtual environment, that has failed and is in the midst of a rebuild.
In this scenario, an IT administrator cannot solve the problem with the simple tools available from VMware. The administratormay need to enlist the help of other domain experts and refer to a handful of tools, for example one for monitoring thenetwork, one for vCenter, one for Weblogic, one for the database, one for the physical chassis and environmental state, andso on, to rule out all the potential causes of the issue. Even for experienced administrators, this process can be extremely timeconsuming, and delays could lead to downtime and have an array of other costs.
To be effective and ef cient in these virtualized environments, administrators need to employ a solution that covers the entireinfrastructure. They need to be able to quickly and easily view the current status of all points within the infrastructure, both tosolve known issues and to spot trends and make corrections before issues arise.
Best Practice #2: Automate Monitoring of VMsGiven the dynamic nature of virtualized environments, businesses need to automate as much as possible. This is vital both tominimize administrative effort and to ensure monitoring information is sustained and meaningful. Following are the essentialcapabilities required to automate monitoring in virtualized environments:
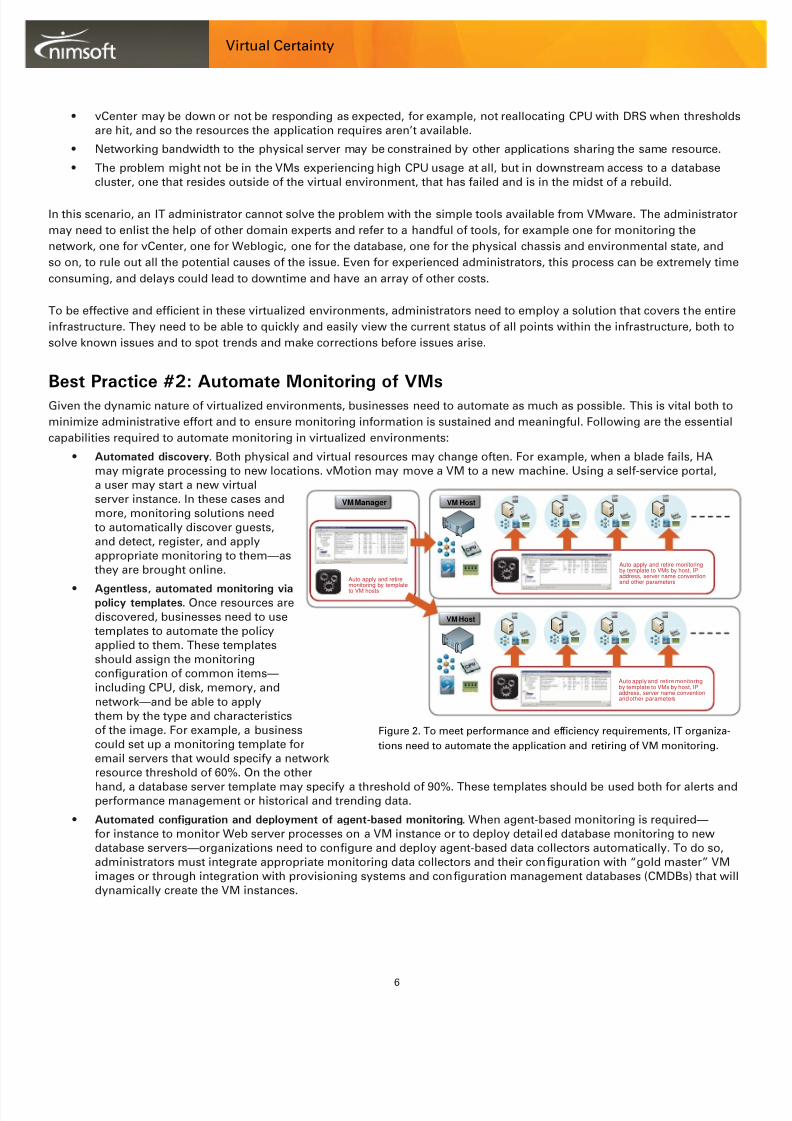
• Automated discovery . Both physical and virtual resources may change often. For example, when a blade fails, HAmay migrate processing to new locations. vMotion may move a VM to a new machine. Using a self-service portal,a user may start a new virtualserver instance. In these cases andmore, monitoring solutions needto automatically discover guests,and detect, register, and applyappropriate monitoring to them—asthey are brought online.
• Agentless, automated monitoring viapolicy templates . Once resources arediscovered, businesses need to usetemplates to automate the policyapplied to them. These templatesshould assign the monitoringcon guration of common items—including CPU, disk, memory, andnetwork—and be able to applythem by the type and characteristicsof the image. For example, a businesscould set up a monitoring template foremail servers that would specify a network resource threshold of 60%. On the other
hand, a database server template may specify a threshold of 90%. These templates should be used both for alerts andperformance management or historical and trending data.
• Automated con guration and deployment of agent-based monitoring . When agent-based monitoring is required—for instance to monitor Web server processes on a VM instance or to deploy detailed database monitoring to newdatabase servers—organizations need to con gure and deploy agent-based data collectors automatically. To do so,administrators must integrate appropriate monitoring data collectors and their con guration with “gold master” VMimages or through integration with provisioning systems and con guration management databases (CMDBs) that willdynamically create the VM instances.
Figure 2. To meet performance and ef ciency requirements, IT organiza-tions need to automate the application and retiring of VM monitoring.
VM HostVM Manager
Auto apply and retire monitoringby template to VMs by host, IPaddress, server name conventionand other parametersAuto apply and retire
monitoring by templateto VM hosts
VM Host
Auto apply and retire monitoringby template to VMs by host, IPaddress, server name conventionand other parameters
8/6/2019 Nimsoft Gaining Monitoring Clarity VMware Environments
http://slidepdf.com/reader/full/nimsoft-gaining-monitoring-clarity-vmware-environments 7/11
Virtual Certainty
7
• Automated display . Organizations also need to ensure that dashboards and reports are automatically populated withaccurate, meaningful data. For example, data for a given instance needs to be properly associated with the rightgroups of physical servers and other resources. Further, if a VM is decommissioned intentionally, for example due toscheduled maintenance or a policy being implemented, reporting needs to have the intelligence to distinguish thatoccurrence from an unplanned outage, so a host of false alarms don’t get generated.
Best Practice #3: Correlate Physical and Virtual ResourcesTo be truly effective in identifying and preventing issues and outages, administrators need to leverage capabilities forcorrelating the monitoring of physical and virtual layers. Following are some of the key requirements:
• Correlation between the ESX host and associated VMs . A business may have eight virtual hosts running on a physicalblade server, and an administrator may see that users are having trouble getting to applications running on thosesystems. In cases like these, administrators need to see whether the issue is being caused at the host, for exampledue to the fact that one of its network cards went down, or identify whether an issue arose that was speci c to a singleVM.
• Correlation with the physical layers underlying the ESX host . The performance of the ESX host is contingent upon ahost of physical layers, including physical storage, such as storage area networks (SANs); networking devices; berconnectivity; power; cooling; and more. Effective remediation and resource control requires administrators to be ableto quickly assess the current status of all these elements.
• Correlation with VMs and resident applications . Administrators need to have visibility into the performance of VM-resident applications, including email servers, databases, packaged applications, and so on, which may span multiplevirtual servers. Display and correlation of problems need to take an integrated view that covers the entire applicationas well as the underlying VMs and infrastructure.
Armed with these capabilities, administrators can be well equipped to make more sophisticated policies that enhanceperformance and maximize the utilization of physical resources:
• Under usage . An administrator may set a policy so that a resource owner is automatically noti ed if 2% or less of a VMis used over a two-day period. That way, the resource owner can determine whether to turn that VM off so resourcesaren’t reserved unnecessarily.
• Over commitment . If one VM sitting on a physical host is taking 90% of the network resources available, other VMssharing that host’s resources won’t have the performance desired. In these cases, administrators need to be alertedautomatically, so they can determine whether there’s a problem, and, if so, nd out where. For example, a software
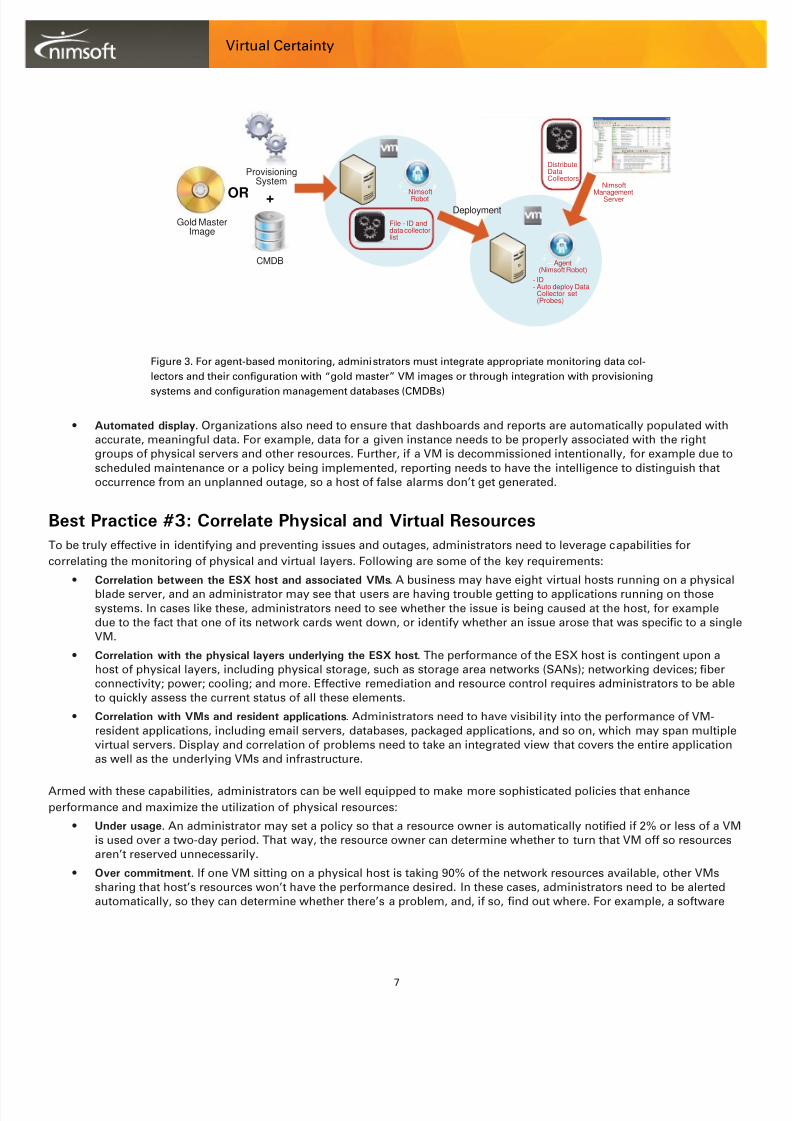
Figure 3. For agent-based monitoring, administrators must integrate appropriate monitoring data col-lectors and their con guration with “gold master” VM images or through integration with provisioning
systems and con guration management databases (CMDBs)
CMDB
ProvisioningSystem
File - ID anddata collectorlist
NimsoftRobot
NimsoftManagement
Server
- ID- Auto deploy Data
Collector set(Probes)
Agent(Nimsoft Robot)
DistributeDataCollectors
DeploymentGold Master
Image
OR +

8/6/2019 Nimsoft Gaining Monitoring Clarity VMware Environments
http://slidepdf.com/reader/full/nimsoft-gaining-monitoring-clarity-vmware-environments 8/11
Virtual Certainty
8
issue may be creating high volumes of network traf c, usage and traf c may have spiked due to unexpectedactivity, or the ongoing commitment required for that VM may not have been forecasted correctly. Based on thisunderstanding, the administrator can then take corrective action, such as xing an issue or migrating other VMs toother physical machines.
Best Practice #4: Maintain Awareness with vMotion, HA, and DRSAs mentioned earlier, vMotion, HA, and DRS are the vehicles within VMware environments that automate the migration of resources. Following are a few practical examples:
• Mail server . An organization’s server administrator may set up a policy in DRS specifying that, if the VM running theemail server reaches or surpasses CPU utilization of 50%, that VM’s allocation will go from 1 CPU to 3 CPUs. Further,the policy may specify that, if usage slips back to 25%, the allocation should go back to 1 CPU.
• Database . For VM-resident databases processing critical workloads, an administrator may dedicate only one or twoVMs to a physical host. In this environment, if CPU utilization or network usage rises above speci c threshold, theadministrator can set a policy using vMotion to move the VM to another physical machine that has more CPUs andbandwidth available.
• Blade failure . If a fan in a chassis fails, causing a blade to fail, VMware HA migrates the workloads from that blade toother resources.
To monitor these environments effectively, administrators need to leverage monitoring solutions that have an integrated,synchronized awareness of these automation technologies. When vMotion, HA, and DRS automate the transition of a VM orprocess to another physical machine, the IP address will change. Another thing may be changed is MAC address. For example,when organizations use tools such as Dell’s Scalent solution, workloads can quickly be migrated between virtual and physicalmachines. To monitor these environments effectively, administrators need to ensure monitoring can seamlessly, automaticallybe updated to re ect these changes. Further, monitoring solutions need to be able to retain monitoring continuity and history,so administrators can better track and assess these issues over time and set better policies.
In virtualized environments, it is important for administrators to con gure thresholds with percentages, rather than speci cnumeric gures. For example, vMotion may shift a VM from a machine where it is assigned 2GB of memory to another whereit is assigned 8GB. In this scenario, if an administrator sets a memory utilization threshold of 700MB in the lower resourced
system it will result in under-utilization when moved. Setting thresholds based on a percentage basis ensures the optimalpolicy regardless of which machine a VM is running from.
Best Practice #5: Fully Integrate Monitoring with the Rest of the InfrastructureBecause monitoring plays such a central, critical role, it is vital that businesses most broadly integrate monitoring into their ITinfrastructure. This is key to both leveraging existing infrastructure investments and monitoring insights as fully as possible.In many organizations, this integration needs to start with the management infrastructure. Organizations typically haveexisting service desk applications, CMDBs, and other IT infrastructure management tool investments, and the morevirtualization monitoring can be integrated with these applications, the better and more ef ciently they can run their IToperations. For instance, virtualization monitoring should be integrated with the organization’s standard IT ticketing work owin an existing service desk application, so that minimal changes to operating procedure are required. CMDB integration allowschanges to monitoring requirements to be centrally maintained and implemented—enabling automated deployment andupdates to supported con gurations.
Further, this integration needs to be enabled at any layer in the monitoring solution stack, including the data, message bus,operations, and presentation layer. For example, at the presentation layer, a business may have dashboards in their servicedesk application, and may want to pull monitoring data from the virtualization environment to populate portions of thosedashboards, allowing them to more ef ciently manage ticket assignment and remediation efforts.

8/6/2019 Nimsoft Gaining Monitoring Clarity VMware Environments
http://slidepdf.com/reader/full/nimsoft-gaining-monitoring-clarity-vmware-environments 9/11
Virtual Certainty
9
Following are additional opportunities for integrating monitoringwith additional areas in the IT infrastructure:
• Provisioning, change, and con guration managementtools . To streamline administration, an organization maywant to have monitoring con gurations assigned using
the CMDB and provisioning system or within VM goldenimages.
• Identity and access controls . If a business is usingMicrosoft Active Directory for managing user identitiesand permissions, they may want to ensure monitoring iseffectively integrated with this environment. For example,only a speci c group of system administrators might beauthorized to access monitoring data from the OracleFinancials applications.
• Lifecycle management tools . An organization may wantto apply lifecycle management tools to their virtualizedenvironment, so, for example, they could enforce a policyof making a given VM obsolete if it falls below a certainutilization percentage for a certain period of time. If thatis the case, monitoring needs to be aware of this policywhen it is enforced, so it gracefully decommissionsassociated monitoring and alerting settings.
• Security environments . Monitoring, and the datagenerated, need to be integrated with an organization’ssecurity policies and environments, including adhering tostandards for data transmission.
Best Practice #6: Track and Communicate
the Value of IT and Virtualization
Today, it is more vital than ever for IT teams to track, measure,and demonstrate their value. This is true for two key reasons:
• First, from an IT team’s standpoint, the automated,on-demand nature of virtualized environments can beboth a blessing and curse: While users may perceive thebene ts, they may be even further removed from theindividuals responsible for maintaining and deliveringthose solutions. Consequently, they may wonder aboutIT’s contribution, and the importance of the team’s roleswithin the business.
• Second, businesses increasingly need to compare the relative merits of internal and externally hosted IT services,such as virtualized resources in a public cloud. A business executive could easily and quickly nd how much asecure, cloud-based server hosting offering would cost each month. To make the best decisions for their businesses,executives need to be able to understand the cost of hosting a comparable type of service or infrastructure internally.
Thus, IT needs to be armed with accurate, timely information about the cost and value of the internal virtualized infrastructure.While VMware has built-in chargeback capabilities, they are very complex to use, and they are not integrated with themonitoring environment or tied to usage of physical systems. Consequently, with these built-in capabilities alone, it will benext to impossible to gain a complete picture of resource usage and cost of given services.
Custom Environment SupportIt is important for monitoring integration to extend tocustomized systems and platforms. Many organizationslook at IT as part of the basis for their competitive edge,
whether in terms of the scale, ef ciency, capacity, orcapabilities their IT environment delivers. In these cases,businesses may do a lot of custom development or adoptmore specialized, niche types of products. Examples of these types of approaches abound:
• A utility may need a way to remotely monitor“smart” meters deployed at customer sites.
• A business may opt to use a power managementtool that is speci c to a type of server rackingsystem that is used to support the virtualizedenvironment.
• An organization may develop a customapplication that runs on top of an Oracledatabase, which means the health andperformance of the application needs to bemonitored and correlated with the performanceof the database application.
• A large enterprise may develop their ownspeci c infrastructure management portal toprovide on-demand resources within a VMwareserver farm—and display monitoring data tousers in a custom dashboard that featuresaccount information and server status.
In these cases, integrating monitoring of the customizedor specialized resources, along with the virtualizedenvironment and the broader IT infrastructure, can bea critical endeavor. Toward that end, businesses needto employ monitoring solutions that offer integration exibility, for example, through both standard APIs andthe ability to develop custom data collectors.

8/6/2019 Nimsoft Gaining Monitoring Clarity VMware Environments
http://slidepdf.com/reader/full/nimsoft-gaining-monitoring-clarity-vmware-environments 10/11

8/6/2019 Nimsoft Gaining Monitoring Clarity VMware Environments
http://slidepdf.com/reader/full/nimsoft-gaining-monitoring-clarity-vmware-environments 11/11
Virtual Certainty
11
About NimsoftNimsoft provides Uni ed Monitoring solutions for virtualized data centers, hosted and managed services, cloud platforms, and SaaS resources.The Nimsoft Uni ed Monitoring architecture virtually eliminates the need to deploy a new monitoring solution for outsourced services, publicor private clouds, or SaaS implementations. Over 1,000 customers use Nimsoft Uni ed Monitoring solutions, including emerging enterprisessuch as Casual Male, European Medicines Agency (EMEA), Ladbrokes, Sur La Table, TriNet, Virgin America, and hundreds of leading hosting,cloud, and managed service providers, such as 1&1, BlueLock, CDW, Rackspace, SoftLayer, and Troubadour. For more information, visitwww.nimsoft.com or to see Nimsoft Uni ed Monitoring in action, visit the Nimsoft public portal at www.uni edmonitoring.com.
Copyright © 2010 CA. All Rights Reserved. One CA Plaza, Islandia, N.Y. 11749. Nimsoft is a trademark or registered trademark of Nimsoft Inc. All other trademarks,
trade names, service marks, and logos referenced herein belong to their respective companies.
North America Headquarters
U.S. toll free:1 877 SLA MGMT (752 6468)1 408 796 3400
Email : [email protected] : www.nimsoft.com
United Kingdom
+44 (0) 845 456 7091
Norway & Northern Europe+47 22 62 71 60
Germany+49 89 208039-645
Australia
+61 (0)2 9236 7216
Brazil+5511 5503 6243
Mexico City+52 (55) 5387 5406
Singapore
+65 64328600
New Delhi+(91 11) 6656 6667
Mumbai+(91 22) 66413800
nimsoft-virt-best-wp-2010-12-16