Embed Size (px)
Citation preview
NIMD Forum 2009
Methylmercury and n-3 poly
unsaturated fatty acids (n-3 PUFA)
exposure from fish consumption
19-20 February 2009
Conference Hall, Minamata Disease Archives
National Institute for Minamata Disease
Minamata City, Kumamoto, Japan
NIMD Forum 2009 Minamata City, 19―20 February 2009
1
Programme
NIMD Forum Ⅰ: Thursday, 19 February 2009 Pages
9:30 - 9:45 Opening Remark
9:45 - 9:55 Dr. Laurie Chan (University of Northern British Columbia, Canada)
3 Balancing the risk of methylmercury and benefits of n-3 polyunsaturated
fatty acids exposure from fish consumption ( Introduction of this Session )
9:55 - 10:25 Dr. Kim Guen Bae (National Institute of Environmental Research,
4 Korea)
Mercury exposures and health effects of school children living near
the mercury emitting facilities in Korea
10:25 - 10:45 Break
10:45 - 11:15 Dr. Akira Yasutake (NIMD) 8
Hair mercury: methylmercury exposure in current Japanese
11:15 - 11:45 Ms. Ami Tsuchiya (University of Washington, USA)
21 Mercury exposure from fish consumption within the Japanese and Korean
communities
11:45 - 13:10 Lunch
13:10 - 13:40 Dr. Mineshi Sakamoto (NIMD)
27 Relationship of methylmercury (MeHg) and docosahexaenoic acid (DHA)
in pregnant women and foetuses
13:40 - 14:10 Dr. Chong-Huai Yan Yu Wang (Shanghai Jiao Tong University)
31 Prenatal low levels mercury exposure on infant development: a prospective
study in Zhoushan Islands, China
14:10 - 14:40 Dr. Hiroshi Satoh (Tohoku University, Japan)
32 Cohort study of the effects of perinatal exposure to methylmercury and
POPs on development of infants in Japan; an interim report of Tohoku
Study of child development
14:40 - 15:00 Break
15:00 - 15:30 Dr. Philippe Grandjean (University of South Denmark, Denmark)
36 Methylmercury exposure, seafood intake and health risks in Faroese
populations
15:30 - 16:00 Dr. Robert O. Wright (Harvard University, USA)
38 Maternal fish intake during pregnancy, blood mercury levels, and child
cognition at age 3 years in a US cohort
16:00 - 16:30 Dr. Kathryn Mahaffey (George Washington University, USA)
39 Omega-3 fatty acids and methylmercury in diet: sources, effects, and
public health considerations
16:30 - 16:50 Dr. Laurie Chan (University of Northern British Columbia, Canada)
Discussion and Conclusion of this Session
18:00 - 19:30 Welcome Reception

NIMD Forum 2009 Minamata City, 19―20 February 2009
2
NIMD Forum Ⅱ: Friday, 20 February 2009 Pages
9:00 - 9:30 Dr. Markus T. Lasut (Sam Ratulangi University, Indonesia)
52 Potential contamination of mercury from artisanal gold mining in
the Talawaan watershed area, north Sulawesi, Indonesia
9:30 - 10:00 Dr. Rojas Maritza (University of Carabobo, Venezuela)
56 Mercury in hair as a diagnostic indicator of exposure to the metal in
a coastal population in Venezuela
10:00 - 10:30 Dr. Masatake Fujimura (NIMD) 70
Hair mercury investigation of mercury –polluted area around the world
10:30 - 10:50 Break
10:50 - 11:20 Dr. Solomon Aragie (Hawassa University, Ethiopia)
72 Methylmercury exposure from fish consumption among communities near
Ethiopian Rift Valley Lakes(ERVLs)
11:20 - 11:50 Dr. Maria da Conceicao (UFPA, Brazil)
78 Clinical evaluation of mercury exposure in riverside from Tapajós Basin,
in the Amazon
11:50 - 12:10 Dr. Laurie Chan (University of Northern British Columbia, Canada)
Total Discussion
12:10 - 12:20 Closing remark
Poster Session Pages
Dr. Jinping Cheng (School of Environmental Science and Engineering,Shanghai Jiao
86 Shanghai Jiao Tong University, Shanghai 200240, China)
Mercury levels in household members hair and in fish from fishing villages in Zhoushan, China
Dr. Domingo JL (Rovira i Virgili University, Spain)
87 Health benefits and chemical risks associated to dietary habits: fish consumption, mercury
and omega-3 fatty acids
Dr. Kwangsik Park (College of Pharmacy, Dongduk Women's University Seoul Korea,
88 Korea)
Estimated daily intake of mercury by general population in Korea
NIMD Forum 2009 Minamata City, 19―20 February 2009
3
Balancing the risk of methylmercury and benefits of n-3 polyunsaturated
fatty acids exposure from fish consumption
L.H.M. Chan*, Choi, K.R. Mahaffey, E. Oken, M. Sakamoto, C.H. Yan *University of Northern British Columbia
Fish and shellfish are widely available food that provides many nutrients, particularly the n-3
polyunsaturated fatty acids (n-3 PUFAs), to many populations globally. Research conducted over the past
several years suggests that there are benefits linked to brain and visual system development in infants and
reduced risk for certain forms of heart disease. However, fish and shellfish are also the major source of
methylmercury (MeHg), a known neurotoxicant that is particularly harmful to fetal brain development.
The objectives of this panel presentation are:
1) to review data on the distributions of MeHg and n3-PUFAs across different fish/shellfish species; 2) to
estimate dietary intake of both MeHg and n-3 PUFAs in different countries;
3) to review the latest biomedical findings on the role and interactions of both n3-PUFAs and
of MeHg on prenatal neurodevelopment; and 4) to review the latest epidemiological data on effects of
fish consumption on child development. The goal is to develop a consensus to provide dietary advice on
how to maximize the dietary intake of n-3 PUFAs and minimize MeHg exposures through optimal choice
of fish and shellfish species.
NIMD Forum 2009 Minamata City, 19―20 February 2009
4
Mercury exposures and health effects of school children
living near the mercury emitting facilities in Korea
Guen-Bae Kima*
, Jong-Hwa Leea, Hee-Jin Park
a, Seung-Do Yu
a, Dae-Seon Kim
a
a Department of Environmental Epidemiology, National Institute of Environmental Research,
In-cheon, Korea.
1. Abstract
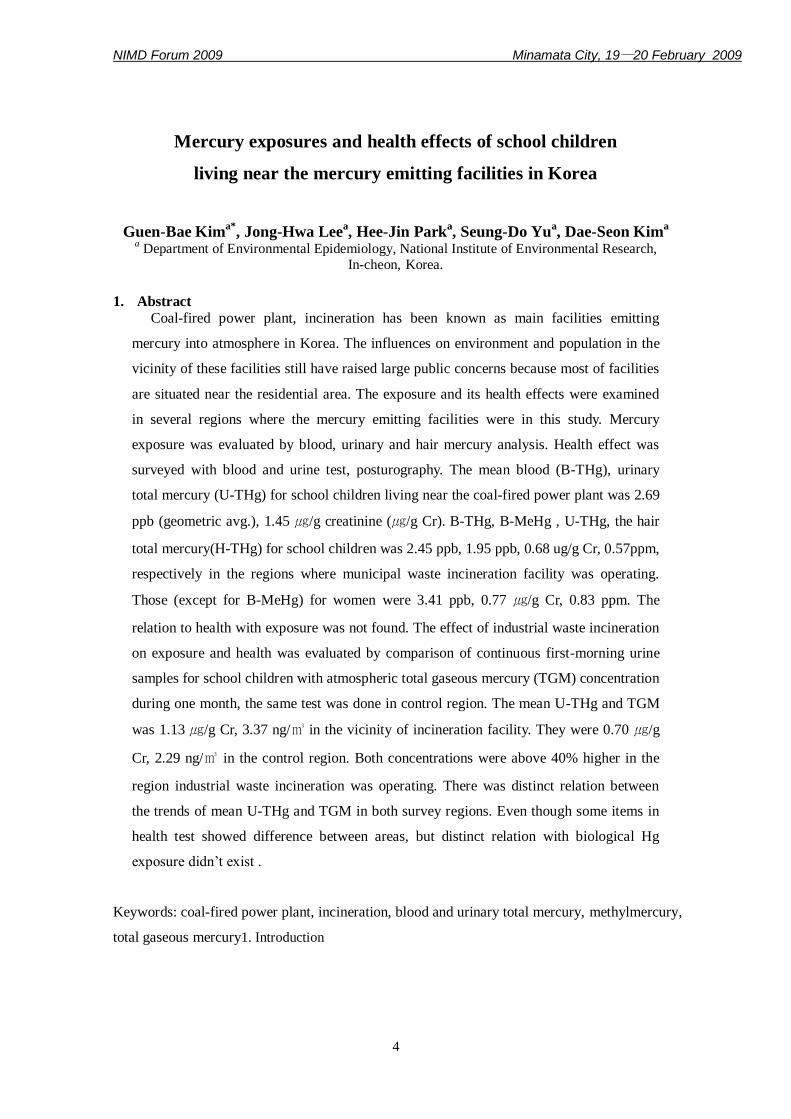
Coal-fired power plant, incineration has been known as main facilities emitting
mercury into atmosphere in Korea. The influences on environment and population in the
vicinity of these facilities still have raised large public concerns because most of facilities
are situated near the residential area. The exposure and its health effects were examined
in several regions where the mercury emitting facilities were in this study. Mercury
exposure was evaluated by blood, urinary and hair mercury analysis. Health effect was
surveyed with blood and urine test, posturography. The mean blood (B-THg), urinary
total mercury (U-THg) for school children living near the coal-fired power plant was 2.69
ppb (geometric avg.), 1.45 ㎍/g creatinine (㎍/g Cr). B-THg, B-MeHg , U-THg, the hair
total mercury(H-THg) for school children was 2.45 ppb, 1.95 ppb, 0.68 ug/g Cr, 0.57ppm,
respectively in the regions where municipal waste incineration facility was operating.
Those (except for B-MeHg) for women were 3.41 ppb, 0.77 ㎍/g Cr, 0.83 ppm. The
relation to health with exposure was not found. The effect of industrial waste incineration
on exposure and health was evaluated by comparison of continuous first-morning urine
samples for school children with atmospheric total gaseous mercury (TGM) concentration
during one month, the same test was done in control region. The mean U-THg and TGM
was 1.13 ㎍/g Cr, 3.37 ng/㎥ in the vicinity of incineration facility. They were 0.70 ㎍/g
Cr, 2.29 ng/㎥ in the control region. Both concentrations were above 40% higher in the
region industrial waste incineration was operating. There was distinct relation between
the trends of mean U-THg and TGM in both survey regions. Even though some items in
health test showed difference between areas, but distinct relation with biological Hg
exposure didn‟t exist .
Keywords: coal-fired power plant, incineration, blood and urinary total mercury, methylmercury,
total gaseous mercury1. Introduction
NIMD Forum 2009 Minamata City, 19―20 February 2009
5
Although the domestic use of mercury has been decreased significantly during recent 10
years in Korea, it is known that the amounts of mercury emission into atmosphere reached
above 50 tons every year which is the eighth in the world (UNEP., 2008). Most of them were
emitted from combustion such as power plant. Waste incineration and non-ferrous metal
manufacturing was also known to release lots of mercury. Despite of national efforts to reduce
mercury emission, increasing demand for power from industry and treatment capacity of waste
by incineration has brought about the increase of non-intentional mercury emission inevitably.
Furthermore lots of mercury emitting facilities are operating near the large residential area,
which raise public and scientific concern about the influence of mercury emission from these
facilities on the exposure and health of population. This presentation summarized the results of
several related-srurvey done resent 3 years in Korea.
2. Subjects and Methods
The survey presented here was performed in the areas where there are main Hg-emitting
facilities near the large residential complex. One coal-fired power plant (PP) which generating
above 1,600 MKW located in western coastal area was selected. One municipal waste (MWI,
capacity: above 100 ㏏) and three industrial waste incineration (IWI, 2 ton/h) facilities in
metropolitan area were also investigated. All subjects were consisted of children in elementary
school (in all survey) and their mother (only in MWI). Total of 449 school children (average age
12 years) and 41 women (average age 37.5 ± 6.3 years, only in MWI) without any particular
exposure to Hg participated with their informed consent. Questionnaire was utilized to collect
information on the personal characteristics including dietary habit, history of residence, life
style and etc. For investigating mercury exposure, blood and urine, hair (only in MWI) samples
were collected. Total mercury in biological samples was measured using Mercury analyzer
(Model SP-3D, Nippon Instrument Corporation, Japan). After pre-treatment process, mercury
vapor was collected into the tube for gold amalgamation and was measured by atomic
adsorption spectrometry. MeHg in the sample was determined by gas chromatography with
ECD according to the NIMD method (Akagi et al. 2000). The health effects of mercury
exposure were investigated through some blood and test and posturography (CATSYS 2000),
oxidative stress biomarker (JAICA, Fukumori., Japan) urinary N-acetyl-β-glucosaminidase .
Statistical analysis was done with SPSS version 10.0 for window. One-way analysis of variance
and Pearson correlations analysis, multiple linear regression (backward elimination) was used.

NIMD Forum 2009 Minamata City, 19―20 February 2009
6
3. Results and Discussion
Considering the amount of coal use in power generation, it is estimated that about 9 tons of
mercury was emitted into air. So there is large concern about the influence of coal combustion
of power plant (PP) on the biological exposure of general population. But it is very difficult to
find related survey and data for evaluation of its effect. For this reason, 136 school children
living near the power plant (5Km east from PP) and other area (20Km below from pp) were
participated. The mean blood (B-THg) and urinary total mercury (U-THg) was 2.69 ppb
(geometric avg.), 1.45 ㎍/g Cr in PP area, which of other area was 2.65, 2.70, respectively.
There was not difference between areas in blood Hg level, but urinary mercury level was
different from our presumption. The difference in U-THg could be explained from the
atmospheric weekly total gaseous mercury concentration (TGM) of two areas. TGM of two area
were 3.6, 4.5 ng/㎥ respectively. The Hg emission from PP was estimated to influence on TGM
of the area being further below regardless of distance, which was reflected in urine.
There are about 230 municipal waste incineration facilities that treat 590,000 ton/year in Korea.
Most of them are situated in the city lots of people live. 69 school children and 41 their mother
participated in this investigation for Hg exposure living close to MSI having treatment capacity
100,000 ton/year and control area (10Km away from MSI in upstream of wind direction). In
MSI area, B-THg and U-THg, B-THg of children was 2.45 ppb, 0.89 ㎍/g Cr, 1.95 ppb (80% of
B-THg), they were 2.20 ppb, 0.68 ㎍/g Cr, 1.75 ppb(80%) in control area. Women‟s B-THg and
U-THg was 3.41 ppb, 0.77 ㎍/g in MWI, 3.03 ppb, 0.87 ㎍/g in control region. While similar
difference was found in B-THg of children and women between two regions, but not in U-THg.
The distinct relation between TGM and biological exposure was found in children. TGM was
3.5(MWI) and 2.7(control). The level of urinary NAG, a lysosomal enzyme excreted in
condition associated with renal tubular damage (Skalova S., 2002), was showed similar
tendency with U-THg level. But the influence of Hg exposure on NAG was estimated to be
slight judging from their low correlation. Other test for health effect such as blood biomarker,
posturography didn‟t show distinct relation with biological exposures.
The influence of Hg emission from some industrial waste incineration facilities in the vicinity
of residential area on biological exposure and health of the school children (281 subject) was
investigated. TGM (daily) and U-THg (every two, first morning urine) was measured during
one month. The results were compared with those gained in control area (40Km east from IWI).
The mean of TGM and U-THg was 3.37 ng/㎥, 1.13 ㎍/g Cr in IWI, they were 2.29, 0.70 in
control area. The TGM in IWI was 50% higher than that of control region, such difference was
also found in U-THg (40% higher). Urinary MDA and 8-OhdG were analyzed to investigate
NIMD Forum 2009 Minamata City, 19―20 February 2009
7
the health effects of U-THg. Different from general understandings, their level was higher in
subjects living in control area and they didn‟t show any statistical relations with Hg exposure as
like posturography.
In conclusion, we can find that Hg emitted from facilities influenced on the biological
exposure, especially in children‟s U-THg. But the level of Hg exposure so low that distinct
relation could not be found with health biomarkers.
NIMD Forum 2009 Minamata City, 19―20 February 2009
8
Hair mercury: methylmercury exposure in current Japanese
Akira Yasutake and Noriyuki Hachiya
National Institute for Minamata Disease; Email: [email protected]
Summary
Methylmercury (MeHg) is an environmental pollutant with neurotoxic effects on the
central nervous system. The major exposure route of MeHg to humans is via consumption of
fish and shellfish which accumulate the chemical through the food web in an aquatic
environment. Hair mercury level is an excellent marker for MeHg exposure, since a portion of
MeHg is highly and stably accumulated there. We have been conducting a survey on hair
mercury contents among general populations from 14 districts to estimate the current Japanese
MeHg exposure level. Total mercury levels of all hair samples collected (12923 in total) were
analyzed by the oxygen combustion-gold amalgamation method using an atomic absorption
mercury detector. Multiple regression analysis revealed that mercury levels were significantly
correlated with several covariates, such as sex, age, the amount of daily intake of total
fish/shellfish, a preference for certain fish such as tuna or bonito, and artificial waving. The
geometric means for the population without artificial waving were 2.47 and 1.65 ppm for males
(n = 5623) and females (n = 3470), respectively. Hair mercury levels varied with age, and the
variations were more significant in males. Since the difference between sexes was not evident
at younger ages, some hormonal control might also be involved in the mercury uptake by human
hair. The average mercury levels in our hair samples varied among the sampling districts. Tuna
is a major carnivorous fish with high mercury accumulations that is often consumed in Japan.
The amount of fish consumption and the preference rate for tuna would appear to be responsible
for the regional variation in hair mercury levels in Japan.
Recently, a provisional tolerable weekly intake (PTWI) of MeHg was revised considering an
effect to fetus by 61st JECFA (FAO/WHO Joint Expert Committee on Food Additives) to 2.0
g/kg/week, which was about half that of the Japanese standard, and corresponded to a hair
level of 2.2 ppm. Very recently, Japanese Government revised PTWI levels for pregnant
women to 2.0 g/kg/week, corresponding to a hair level of 2.75 ppm. The distribution of hair
mercury levels in Japanese populations in the present study indicated that 25% and 15% of the
Japanese females of child-bearing age were estimated to be exposed to MeHg over the PTWI
levels of 61st JECFA and Japan, respectively. This would reflect the high Japanese
NIMD Forum 2009 Minamata City, 19―20 February 2009
9
consumption of marine products. However, not only mercury contamination, but also the
nutritional benefit may have to be considered when discussing the risk involved in the current
level of fish and shellfish consumption in Japan.
Keywords: hair mercury; Japanese population; methylmercury exposure; PTWI; fish
consumption
Methylmercury (MeHg) is formed by saprophyte microorganisms from inorganic mercury
compounds in the aquatic environment (ATSDR, 1992). It is accumulated in fish and shellfish
through the marine food web. Since the MeHg accumulation increases with the food web,
carnivorous fish such as tuna, swordfish and shark often exhibit high levels of mercury.
Furthermore, due to the long biological half-life of MeHg, the chemical tends to accumulate
throughout the life of fish (Clarkson, 1992). Marine mammals such as whales and dolphins also
show high concentrations of mercury. Accordingly, the major route of human exposure to
MeHg is the ordinary consumption of fish and shellfish. MeHg is readily absorbed from the
gastrointestinal tract and distributed among various tissues including the brain. The
permeability of the chemical at the blood-brain barrier is responsible for its hazardousness
neurotoxic effect.
A WHO report (1990) concluded that the NOAEL (no observed adversary effect level) for
adults is 50 ppm of the hair mercury level based on the analytical data of MeHg pollution in the
past. Since the developing nervous system of the fetus has been considered highly susceptible
to the effect of MeHg (Cox et al., 1989), the report also mentioned a possible association with
an increased risk to the neurodevelopment of the fetus when maternal hair levels rise above 10
ppm. Accordingly, recent studies on the health effects of MeHg have focused on the exposure
risk to pregnant women and the neuropsychological outcomes in newborns.
In Japan, the provisional regulatory standards of mercury and MeHg in fish and shellfish
were determined in 1973 to be 0.4 and 0.3 ppm, respectively, based on the assumption of a safe
intake limit of 0.17 mg mercury/person/week (0.48 g/kg bw/day). In the determination, based
on the NOAEL reported by WHO (1990), uncertainty factor 10 was employed. This is almost
equal to the former PTWI (3.3 g mercury/kg bw/week) reaffirmed at the 53rd JECFA meeting
(JECFA, 1999). On the other hand, due to high susceptibility of the developing fetus, the
exposure limit of MeHg has been suggested for pregnant women. The revised reference dose
(RfD) of the US Environmental Protection Agency (EPA, 1997) set the safe exposure limit to
NIMD Forum 2009 Minamata City, 19―20 February 2009
10
0.1 g mercury/kg bw/day in 1997. This RfD has been calculated as 1/10 of the benchmark
dose obtained in a study of the Iraq incident of 1971-1972 (Cox et al. 1989). However, since
the manner of MeHg exposure in that incident was quite different from the ordinary exposure
risk incurred through fish consumption, the Committee on Toxicological Effects of
Methylmercury convened by the United States National Research Council (NRC, 2000)
reevaluated the RfD based on the data obtained in a cohort study conducted in the Faroe Islands
(Grandjean et al., 1997). On the other hand, based on the results from cohort studies in the
Faroe Islands and the Seychelles, a provisional tolerable weekly intake (PTWI) of MeHg was
determined to be 1.6 g mercury/kg/week using an uncertainty factor 6.4.at the 61st meeting of
the Joint FAO/WHO Expert Committee on Food Additives (JECFA, 2003). Very recently, the
PTWI for pregnant women has also revised in Japan to 2.0 g mercury/kg/week (MHLW 2005).
They also used NOEL/BMD of Faroes and Seychelles studies, but employed an uncertainty
factor 4. However, a considerable segment of the Japanese population is thought to be exposed
to MeHg in excess of the above levels due to their habitually high consumption of marine
products (Yasutake et al., 2003; 2004). Here we reported on a survey of the hair mercury levels
in a cross section of representative Japanese sub-populations to estimate the current MeHg
exposure levels in Japan.
Materials and Methods
Hair sampling
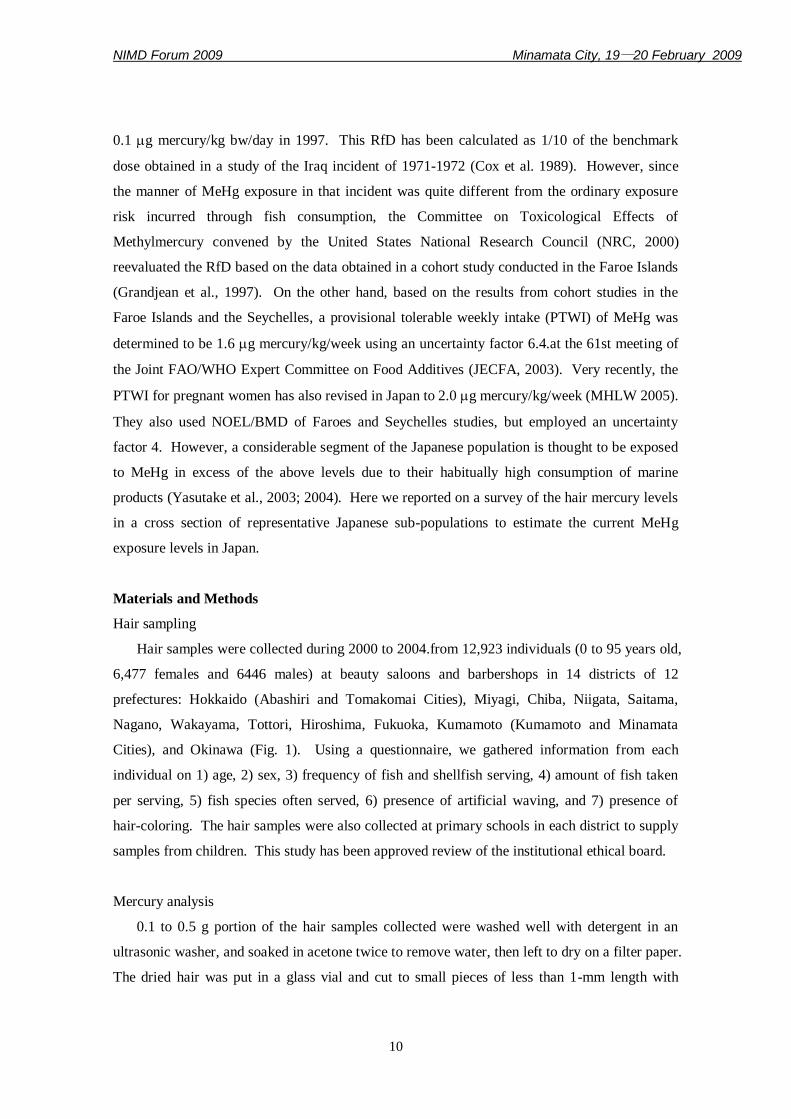
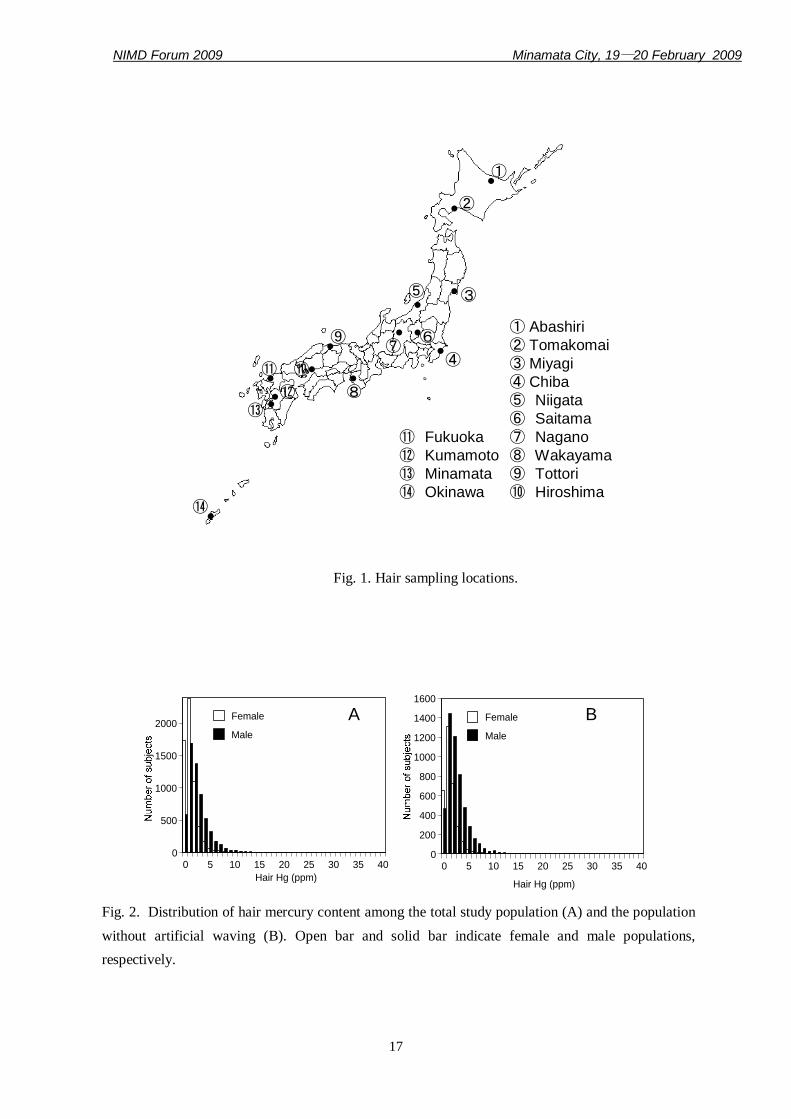
Hair samples were collected during 2000 to 2004.from 12,923 individuals (0 to 95 years old,
6,477 females and 6446 males) at beauty saloons and barbershops in 14 districts of 12
prefectures: Hokkaido (Abashiri and Tomakomai Cities), Miyagi, Chiba, Niigata, Saitama,
Nagano, Wakayama, Tottori, Hiroshima, Fukuoka, Kumamoto (Kumamoto and Minamata
Cities), and Okinawa (Fig. 1). Using a questionnaire, we gathered information from each
individual on 1) age, 2) sex, 3) frequency of fish and shellfish serving, 4) amount of fish taken
per serving, 5) fish species often served, 6) presence of artificial waving, and 7) presence of
hair-coloring. The hair samples were also collected at primary schools in each district to supply
samples from children. This study has been approved review of the institutional ethical board.
Mercury analysis
0.1 to 0.5 g portion of the hair samples collected were washed well with detergent in an
ultrasonic washer, and soaked in acetone twice to remove water, then left to dry on a filter paper.
The dried hair was put in a glass vial and cut to small pieces of less than 1-mm length with
NIMD Forum 2009 Minamata City, 19―20 February 2009
11
scissors. About 20 mg aliquot of the hair sample thus prepared was dissolved in 2N NaOH (0.5
ml) in a 1.5-ml polypropylene tube by heating at 60 C for 30 min. Ten or twenty l of the
sample solution was subjected to total mercury analysis according to the oxygen combustion-
gold amalgamation method (Ohkawa et al. 1977) using an atomic absorption mercury detector
MD-1 (Nippon Instruments, Co., Ltd., Osaka, Japan). Quality of analysis was confirmed by
analyzing a reference material of human hair, NIES CRM No.13, with a certified value was 4.42
0.2 ppm. Our data of 5 times analysis was 4.55 0.05 ppm.
Statistical analysis
Because hair mercury concentrations analyzed were distributed in a lognormal profile,
Student‟s t-test was performed on the mercury content data after logarithmic conversion.
Multiple regression analysis was conducted by using a SPSS statistical package (SPSS Japan
Inc., Tokyo). The amount of daily intake of total fish and shellfish was estimated from serving
frequency and the amount of fish and shellfish consumed in each serving.
Results
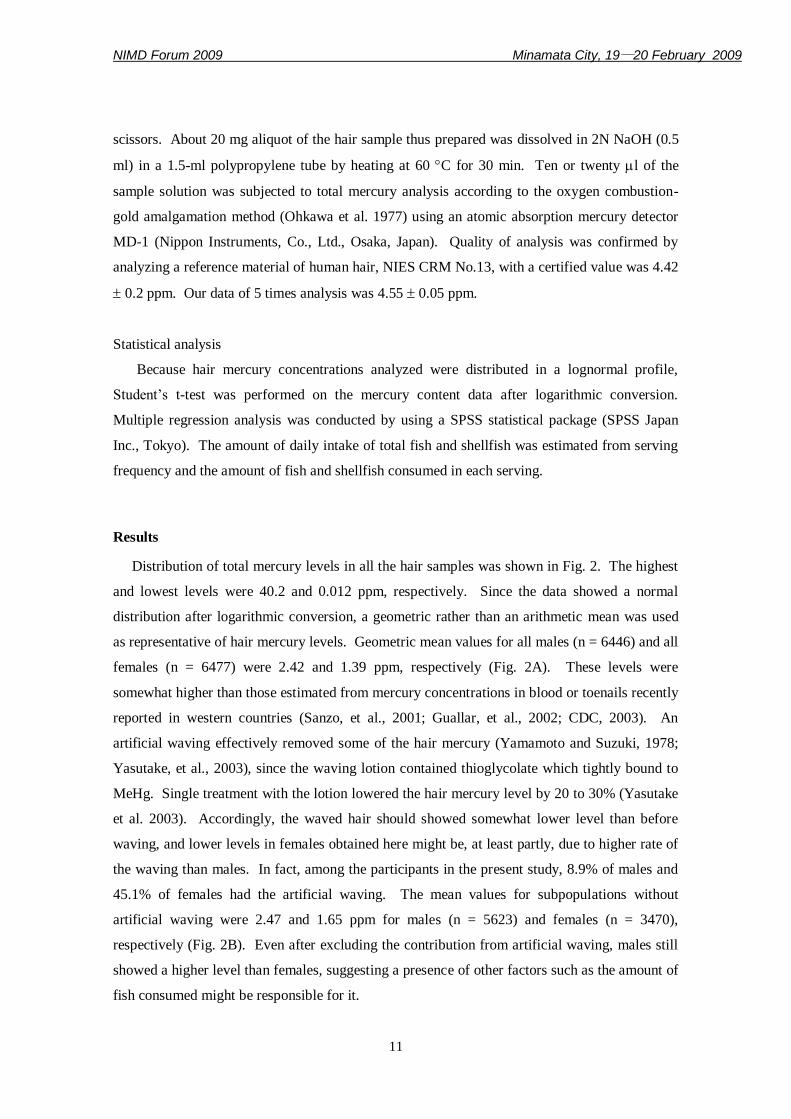
Distribution of total mercury levels in all the hair samples was shown in Fig. 2. The highest
and lowest levels were 40.2 and 0.012 ppm, respectively. Since the data showed a normal
distribution after logarithmic conversion, a geometric rather than an arithmetic mean was used
as representative of hair mercury levels. Geometric mean values for all males (n = 6446) and all
females (n = 6477) were 2.42 and 1.39 ppm, respectively (Fig. 2A). These levels were
somewhat higher than those estimated from mercury concentrations in blood or toenails recently
reported in western countries (Sanzo, et al., 2001; Guallar, et al., 2002; CDC, 2003). An
artificial waving effectively removed some of the hair mercury (Yamamoto and Suzuki, 1978;
Yasutake, et al., 2003), since the waving lotion contained thioglycolate which tightly bound to
MeHg. Single treatment with the lotion lowered the hair mercury level by 20 to 30% (Yasutake
et al. 2003). Accordingly, the waved hair should showed somewhat lower level than before
waving, and lower levels in females obtained here might be, at least partly, due to higher rate of
the waving than males. In fact, among the participants in the present study, 8.9% of males and
45.1% of females had the artificial waving. The mean values for subpopulations without
artificial waving were 2.47 and 1.65 ppm for males (n = 5623) and females (n = 3470),
respectively (Fig. 2B). Even after excluding the contribution from artificial waving, males still
showed a higher level than females, suggesting a presence of other factors such as the amount of
fish consumed might be responsible for it.
NIMD Forum 2009 Minamata City, 19―20 February 2009
12
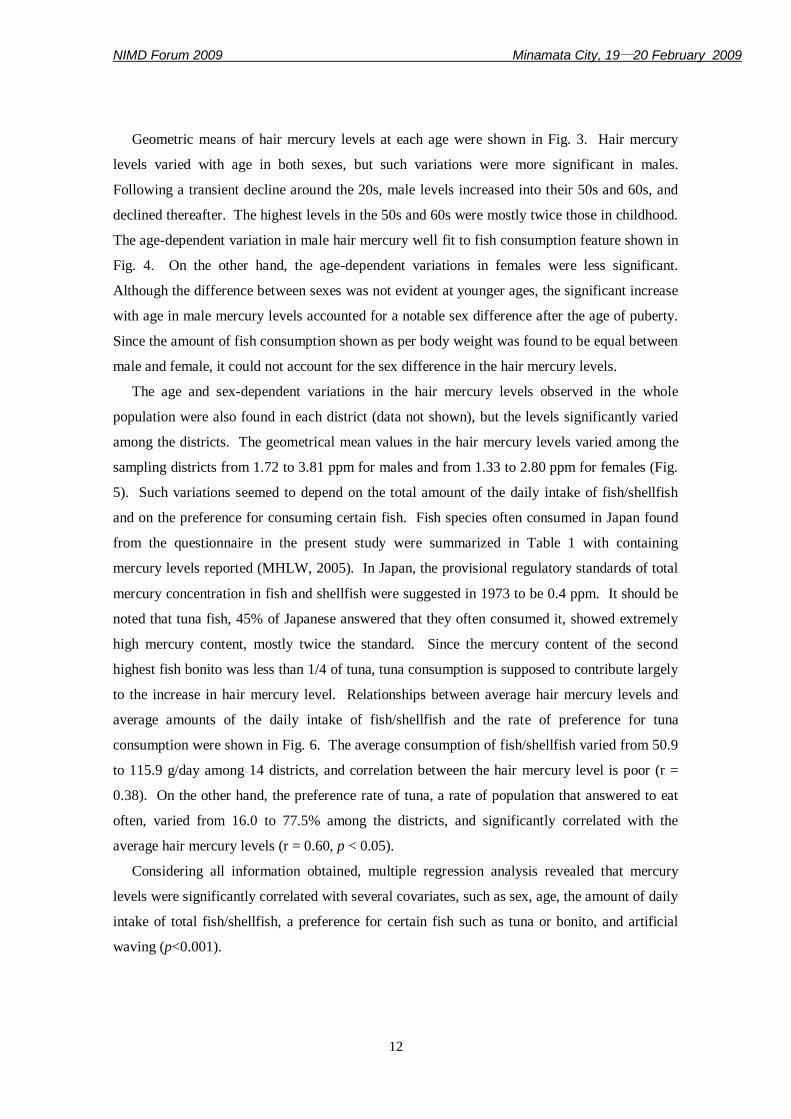
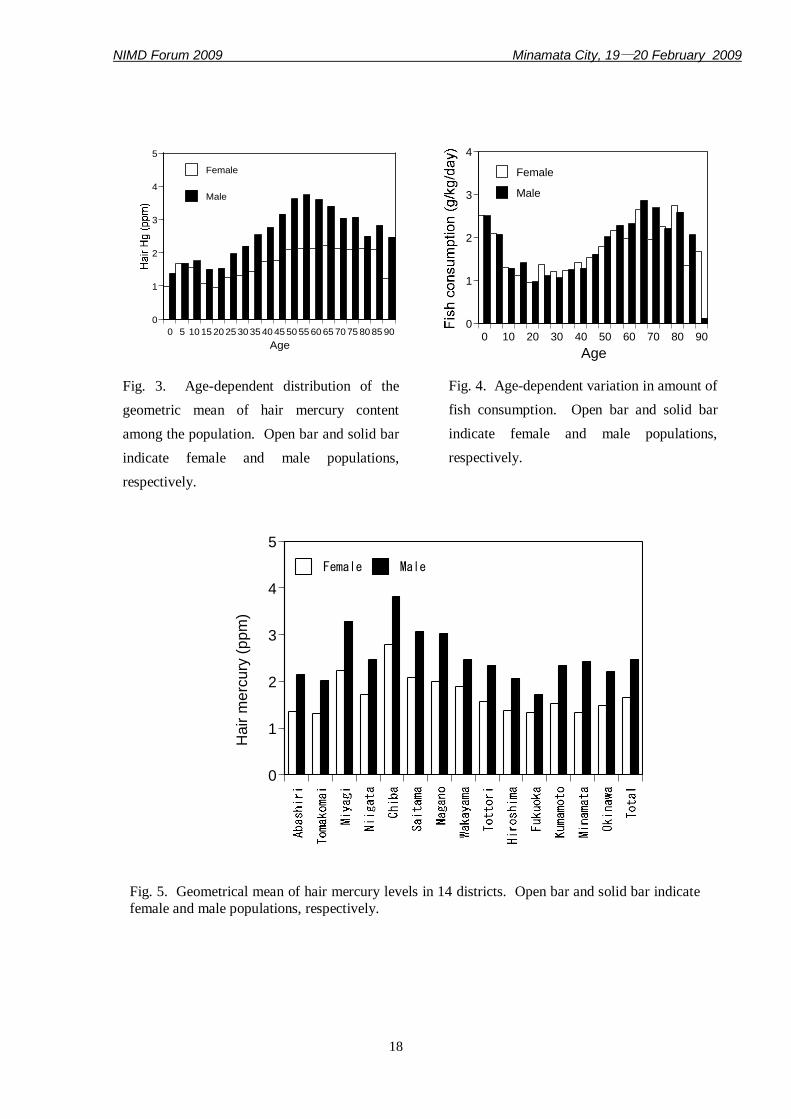
Geometric means of hair mercury levels at each age were shown in Fig. 3. Hair mercury
levels varied with age in both sexes, but such variations were more significant in males.
Following a transient decline around the 20s, male levels increased into their 50s and 60s, and
declined thereafter. The highest levels in the 50s and 60s were mostly twice those in childhood.
The age-dependent variation in male hair mercury well fit to fish consumption feature shown in
Fig. 4. On the other hand, the age-dependent variations in females were less significant.
Although the difference between sexes was not evident at younger ages, the significant increase
with age in male mercury levels accounted for a notable sex difference after the age of puberty.
Since the amount of fish consumption shown as per body weight was found to be equal between
male and female, it could not account for the sex difference in the hair mercury levels.
The age and sex-dependent variations in the hair mercury levels observed in the whole
population were also found in each district (data not shown), but the levels significantly varied
among the districts. The geometrical mean values in the hair mercury levels varied among the
sampling districts from 1.72 to 3.81 ppm for males and from 1.33 to 2.80 ppm for females (Fig.
5). Such variations seemed to depend on the total amount of the daily intake of fish/shellfish
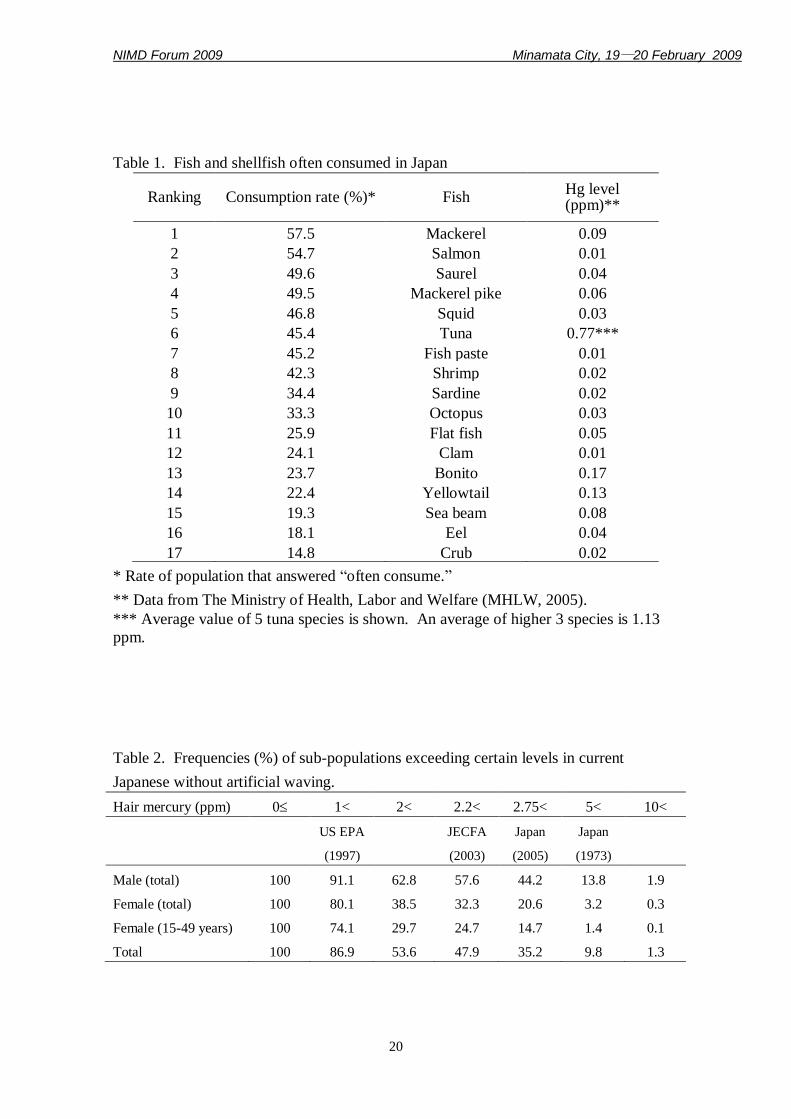
and on the preference for consuming certain fish. Fish species often consumed in Japan found
from the questionnaire in the present study were summarized in Table 1 with containing
mercury levels reported (MHLW, 2005). In Japan, the provisional regulatory standards of total
mercury concentration in fish and shellfish were suggested in 1973 to be 0.4 ppm. It should be
noted that tuna fish, 45% of Japanese answered that they often consumed it, showed extremely
high mercury content, mostly twice the standard. Since the mercury content of the second
highest fish bonito was less than 1/4 of tuna, tuna consumption is supposed to contribute largely
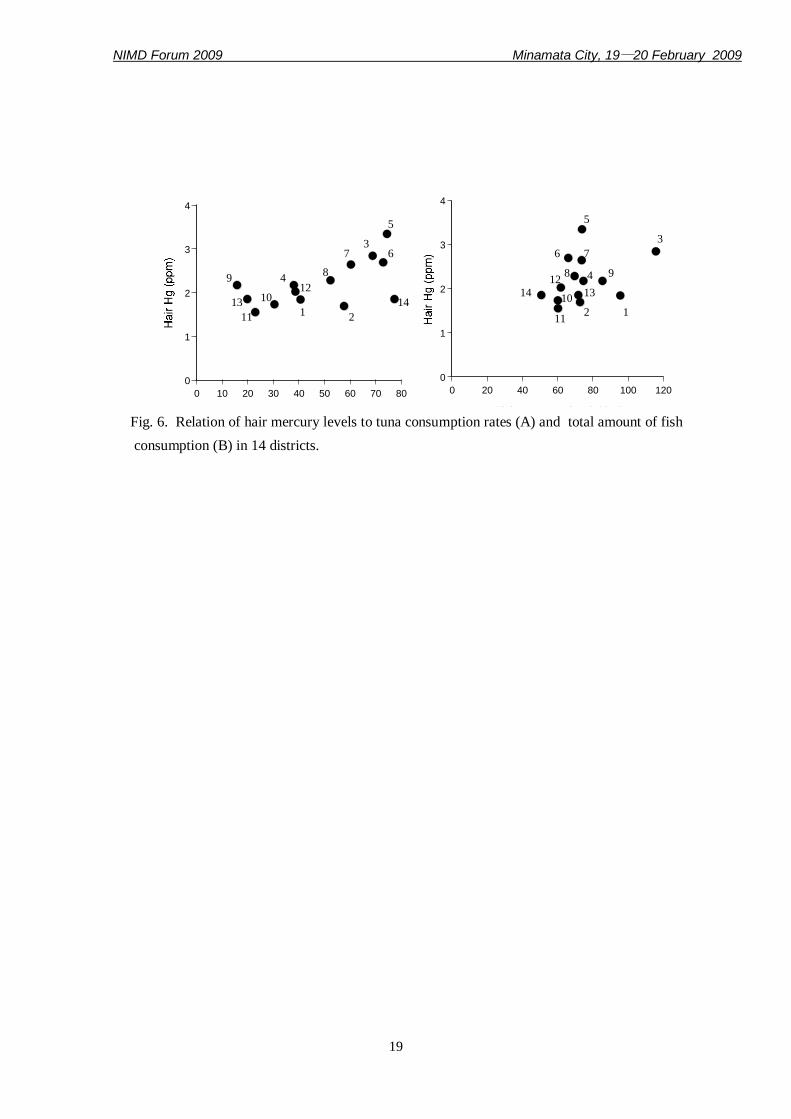
to the increase in hair mercury level. Relationships between average hair mercury levels and
average amounts of the daily intake of fish/shellfish and the rate of preference for tuna
consumption were shown in Fig. 6. The average consumption of fish/shellfish varied from 50.9
to 115.9 g/day among 14 districts, and correlation between the hair mercury level is poor (r =
0.38). On the other hand, the preference rate of tuna, a rate of population that answered to eat
often, varied from 16.0 to 77.5% among the districts, and significantly correlated with the
average hair mercury levels (r = 0.60, p < 0.05).
Considering all information obtained, multiple regression analysis revealed that mercury
levels were significantly correlated with several covariates, such as sex, age, the amount of daily
intake of total fish/shellfish, a preference for certain fish such as tuna or bonito, and artificial
waving (p<0.001).
NIMD Forum 2009 Minamata City, 19―20 February 2009
13
Discussion
Human hair is an excellent marker for MeHg exposure, since a part of the chemical absorbed
is accumulated there in a constant rate (WHO 1990). Here, we analyzed total mercury levels of
general Japanese hair samples collected in 14 districts to estimate the current MeHg exposure
level. The hair mercury levels were found to vary depending on age, sex and amount and
species of fish/shellfish consumed.
It should be noted that although no difference was observed in the amount fish/shell fish
consumption between males and females through ages, males (mean 2.47 ppm) showed higher
hair mercury level than females (mean 1.65 ppm). It is documented in experimental animal that
significant sex difference was observed in tissue distribution of MeHg, and that tissue uptake
and elimination of MeHg could be enhanced by testosterone treatment (Hirayama and Yasutake,
1986; Hirayama et al., 1987). The fact in the present study that the adult males showed higher
hair mercury levels than the females of same age, despite the same fish consumption rates,
might indicate a positive contribution of male hormone in mercury uptake to human hair.
The exposure level to MeHg can be estimated from hair mercury levels using the
following formula (NRC, 2000). Hair level (ppm, g/g) was converted to
corresponding blood level (g/L) by multiplying by 1000/250, since an average
hair/blood ratio of mercury concentration is 250. The sex difference in the hair mercury
levels mentioned above may suggest that it is necessary to employ some different
factor(s) for males and females when MeHg exposure level is estimated form hair
mercury concentration.
where
C = mercury concentration in blood (g/L) = hair level (ppm) x 1000/250
b = elimination rate constant (0.014/day)
V = blood volume (9% of body weight)
A = fraction of the dose absorbed (0.95)
f = absorbed fraction distributed to the blood (0.05)
bw = body weight (kg)
d = dose (g/kg bw/day)
C x b x V d = ------------------------- A x f x bw

NIMD Forum 2009 Minamata City, 19―20 February 2009
14
We found through the present study that amount and species of the consumed fish
varied among the districts, and that these variations seemed to account for the regional
variation in the hair mercury levels. Among fish species often consumed through Japan,
tuna is the exclusive carnivorous fish with high mercury accumulations. Since the
consumption rate of tuna widely varied among the district, it might contribute the
regional variation of the hair mercury. The highest rate of tuna consumption was found
in Okinawa and Chiba, while Tottori and Minamata had the lowest rate. The highest
hair mercury level found in Chiba among all the districts was probably due to the high
consumption of tuna there. Despite Okinawa also showed a marked tendency to
consume tuna, their lowest amount of total fish/shellfish consumption among the
districts would tended to depress their hair mercury levels. In contrast, the two districts
with the lowest hair mercury levels, Fukuoka and Hiroshima, showed both lower
amounts of fish consumption and a lower preference for tuna among the districts. Thus,
tuna consumption is a critical factor that affects the hair mercury levels in Japanese.
Various levels have been recommended as a safe exposure limit to MeHg in several
countries and by international committees as mentioned before. In Japan 0.17 mg
mercury/person/week (3.4 g mercury/kg bw/week) was suggested as a safe exposure
limit for adult in 1973. This is almost equal to the former PTWI (3.3 g mercury/kg
bw/week) reaffirmed at the 53rd JECFA meeting (JECFA, 1999), and corresponds to a
hair mercury level of about 5 ppm. On the other hand, 0.1 g mercury/kg bw/day,
which was suggested as an RfD by the EPA (1997) and reevaluated by the NRC (2000),
is the lowest level, and corresponds to a hair level of 1.0 ppm. The new PTWI 1.6 g
mercury/kg bw/week suggested by 61st JECFA (2003) corresponds to a hair mercury
level of 2.2 ppm. Recent PTWI in Japan recommended for pregnant women (MHLW
2005), 2.0 g mercury/kg bw/week, corresponds to a hair mercury level of 2.75 ppm.
The cumulative frequency of hair mercury levels without artificial waving in our
survey was shown in Table 2. The portions that exceeded the 5 ppm which was
recommended in Japan (1973) and by the former PTWI (JECFA, 1999) were less than
10% of the total population surveyed. When restricted to females of child-bearing age,
15 to 49 years old, 1.4% of the sub-population had hair mercury concentrations
exceeding that level. However, the majority (87% of the total, 80% of females, 74% of
females at child-bearing age, and 91% of males) exceeded EPA‟s 1 ppm. On the other
hand, the average hair mercury levels of all Japanese females (1.65 ppm, without
waving) and females of child-bearing age (1.43 ppm, without waving) were lower than
the both PTWI levels for pregnant women recommended by 61st JECFA (JECFA 2003)
and Japan (MHLW 2005). However, considerable population segments (24.7% of
NIMD Forum 2009 Minamata City, 19―20 February 2009
15
females of child-bearing age) exceeded the PTWI level recommended by the 61st
JECFA (2003). Similarly, 14.7% of them exceeded the Japanese new PTWI (MHLW
2005). Although it is difficult to assess the risk level for the Japanese females of child-
bearing age, they may not be urgently at risk, since the two PTWIs contain uncertainty
factors, 6.4 and 4 for 61st JECFA and Japan, respectively. Furthermore, none of them
in our survey exceeded the NOEL/BMD levels obtained in the Faroes and Seychelles
studies (JECFA 2003).
For pregnant women and those who may become pregnant, The Ministry of Health,
Labor and Welfare, Japan (2005) recently announced a program to regulate the
consumption of several kinds of fishes and whales that contained high concentrations of
mercury. Such a program may be sufficiently effective to bring about some reduction in
fish consumption in Japan. However, not only the risk of mercury contamination, but
also food habits and nutritional benefits may have to be considered when determining a
regulatory standard of fish and shellfish. Accordingly, sufficient and accurate
information for general population must be provided to reach an appropriate decision on
fish consumption. Hair analysis may, at least in part, contribute to such decisions by
providing information on the MeHg exposure levels of each individual.
References
ATSDR (1992) Agency for Toxic Substances and Disease Registry, Mercury toxicity. Am. Fam.
Physician, 46, 1731-1741.
CDC (2003) Second National Report on Human Exposure to Environmental Chemicals. The
Centers for Disease Control and Prevention, United States
Clarkson, T.W. (1992) Mercury: major issues in environmental health. Environ. Health
Perspect., 100, 31-38.
Cox, C., Clarkson, T.W., Marsh, D.O., Amin-Zaki, L., Tikriti, S. and Myers, G.G. (1989) Dose-
response analysis of infants prenatally exposed to methylmercury. An application of a
single compartment model to single-strand hair analysis. Environ. Res., 49, 318-332.
EPA (1997) Mercury Study Report to Congress. United States Environmental Protection
Agency, Washington, DC., EPA.
Grandjean, P., Weihe, P., White, R.F., Debes, F., Araki, S., Yokoyama, K., Murata, K.,
Sørensen, N., Dahl, R. and Jørgensen, P.J. (1997) Cognitive deficit in 7-year-old children
prenatally exposed to methylmercury. Neurotoxicology, 19, 417-428.
NIMD Forum 2009 Minamata City, 19―20 February 2009
16
Guallar, E., Sanz-Gallardo, M.I., van't Veer, P., Bode, P., Aro, A., Gomez-Aracena, J., Kark,
J.D., Riemersma, R.A., Martin-Moreno, J.M. and Kok, F.J. (2002) Mercury, fish oils, and
the risk of myocardial infarction. New Engl. J. Med., 347, 1747-1754.
Hirayama, K., Yasutake, A. and Inoue, M. (1987) Effect of sex hormones on the fate of
methylmercury and glutathione metabolism in mice. Biochem. Pharmacol., 36, 1919-1924.
JECFA (1999) Joint FAO/WHO Expert Committee on Food Additives 53rd Meeting. Rome, 1-
10 June 1999. http://www.who.int./pcs/jecfa/jecfa.htm
JECFA (2003) Joint FAO/WHO Expert Committee on Food Additives 61st Meeting. Rome, 10-
19 June 2003. http://www.who.int./pcs/jecfa/jecfa.htm
NRC (2000) Toxicological Effects of Methylmercury, National Academy Press, National
Research Council. Committee on the Toxicology Effects of Methyl-Mercury, Washington
DC.
Sanzo, J.M., Dorronsoro, M., Amiano, P., Aguinagalde, F.X. and Azpiri, M.A. (2001)
Estimation and validation of mercury intake associated with fish consumption in an EPIC
cohort of Spain. Public Health Nutr., 4, 981-988.
MHLW (2005) The Ministry of Health, Labor and Welfare, http://www.mhlw.go.jp/topics/
bukyoku/iyaku/syoku-anzen/suigin/index.html.
WHO (1990) IPCS Environmental Health Criteria 101 Methylmercury. World Health
Organization, Geneva.
Yamamoto, R. and Suzuki, T. (1978) Effects of artificial hair-waving on hair mercury values.
Int. Arch. Occup. Environ. Health, 42, 1-9.
Yasutake, A., Matsumoto, M., Yamaguchi, M. and Hachiya, N (2003) Current hair mercury
levels in Japanese: survey in five districts. Tohoku J. Exp. Med., 199, 161-169.
Yasutake, A., Matsumoto, M., Yamaguchi, M. and Hachiya, N (2004) Current hair mercury
levels in Japanese for estimation of methylmercury exposure. J. Health Sci., 50, 120-125.
NIMD Forum 2009 Minamata City, 19―20 February 2009
17
① Abashiri
② Tomakomai
③ Miyagi
④ Chiba
⑤ Niigata
⑥ Saitama
⑦ Nagano
⑧ Wakayama
⑨ Tottori
⑩ Hiroshima
①
②
⑩
⑨
⑤
④
3
8
6
•
⑪ Fukuoka
⑫ Kumamoto
⑬ Minamata
⑭ Okinawa
⑬
⑪
•
⑦
⑫
•
•• •
•
•
• ••
•
•
•
⑭
Fig. 1. Hair sampling locations.
0 5 10 15 20 25 30 35 400
500
1000
1500
2000
Hair Hg (ppm)
Female
Male
0 5 10 15 20 25 30 35 400
200
400
600
800
1000
1200
1400
1600
Hair Hg (ppm)
Female
Male
A B
Fig. 2. Distribution of hair mercury content among the total study population (A) and the population
without artificial waving (B). Open bar and solid bar indicate female and male populations,
respectively.
NIMD Forum 2009 Minamata City, 19―20 February 2009
18
0 5 10 15 20 25 30 35 40 45 50 55 60 65 70 75 80 85 90
0
1
2
3
4
5
Age
Female
Male
0 10 20 30 40 50 60 70 80 90
0
1
2
3
4
Age
Female
Male
Fig. 3. Age-dependent distribution of the
geometric mean of hair mercury content
among the population. Open bar and solid bar
indicate female and male populations,
respectively.
Fig. 4. Age-dependent variation in amount of
fish consumption. Open bar and solid bar
indicate female and male populations,
respectively.
0
1
2
3
4
5
Female Male
Hair m
erc
ury
(p
pm
)
Fig. 5. Geometrical mean of hair mercury levels in 14 districts. Open bar and solid bar indicate
female and male populations, respectively.
NIMD Forum 2009 Minamata City, 19―20 February 2009
19
0
1
2
3
4
0 10 20 30 40 50 60 70 80
Rate of tuna consumption (%)
0
1
2
3
4
0 20 40 60 80 100 120
Fish consumption (g/day)
1: Abashiri; 2: Tomakomai; 3: Miyagi; 4: Niigata; 5: Chiba; 6: Saitama; 7: Nagano; 8: Wakayama
9: Tottori; 10: Hiroshima; 11: Fukuoka; 12: Kumamoto; 13: Minamata; 14: Okinawa
1211
3
4
5
6 7
10
8 912
1314
1 211
3
4
5
67
10
89
12
13 14
Fig. 6. Relation of hair mercury levels to tuna consumption rates (A) and total amount of fish
consumption (B) in 14 districts.
NIMD Forum 2009 Minamata City, 19―20 February 2009
20
Table 1. Fish and shellfish often consumed in Japan
Ranking Consumption rate (%)* Fish Hg level (ppm)**
1 57.5 Mackerel 0.09
2 54.7 Salmon 0.01
3 49.6 Saurel 0.04
4 49.5 Mackerel pike 0.06
5 46.8 Squid 0.03
6 45.4 Tuna 0.77***
7 45.2 Fish paste 0.01
8 42.3 Shrimp 0.02
9 34.4 Sardine 0.02
10 33.3 Octopus 0.03
11 25.9 Flat fish 0.05
12 24.1 Clam 0.01
13 23.7 Bonito 0.17
14 22.4 Yellowtail 0.13
15 19.3 Sea beam 0.08
16 18.1 Eel 0.04
17 14.8 Crub 0.02
* Rate of population that answered “often consume.”
** Data from The Ministry of Health, Labor and Welfare (MHLW, 2005).
*** Average value of 5 tuna species is shown. An average of higher 3 species is 1.13
ppm.
Table 2. Frequencies (%) of sub-populations exceeding certain levels in current
Japanese without artificial waving.
Hair mercury (ppm) 0 1< 2< 2.2< 2.75< 5< 10<
US EPA
(1997)
JECFA
(2003)
Japan
(2005)
Japan
(1973)
Male (total) 100 91.1 62.8 57.6 44.2 13.8 1.9
Female (total) 100 80.1 38.5 32.3 20.6 3.2 0.3
Female (15-49 years) 100 74.1 29.7 24.7 14.7 1.4 0.1
Total 100 86.9 53.6 47.9 35.2 9.8 1.3
NIMD Forum 2009 Minamata City, 19―20 February 2009
21
Mercury exposure from fish consumption
within the Japanese and Korean communities
Ami Tsuchiyaa,b
, Thomas A. Hinnersc, Thomas M. Burbacher
a,
Elaine M. Faustmana,b
, Koenraad Mariënd
a Department of Environmental and Occupational Health Services, University of Washington, Seattle,
WA, USA, b Institute for Risk Analysis and Risk Communication, University of Washington, Seattle,
Washington, USA; c National Exposure Research Laboratory, United States Environmental Protection Agency, Las
Vegas, NevadaUSA; d Washington State Department of Health, Olympia, Washington, USA
Abstract
Most fish consumption guidance is based on preventing exposure to contaminants.
However, fish may be a culturally important food item and provides nutrients that are
essential to optimal growth and health. In this study, we examined high end fish
consumers who were women of childbearing age living in the U.S. to determine how
intake of n-3 polyunsaturated fatty acids relates to mercury (Hg) exposure and how the
relationship can impact fish consumption guidance.
As part of the Arsenic Mercury Intake Biometric Study involving the Japanese and
Korean communities, we obtained Hg fish tissue concentrations for species consumed,
hair-Hg levels, and fish, eicosapentaenoic acid (EPA) and docosahexaenoic acid (DHA)
intake levels. The intake and Hg exposure data were compared with published national
data. In total, 214 participants were enrolled into this longitudinal study; 106 Japanese
and 108 Koreans. Fish intake (shellfish & finfish combined) for both communities (73 &
82 g/d for Japanese & Koreans, respectively) was close to the 95th
percentile for the US
general population. Hair Hg levels were also above the national average of 0.2 ppm (1.2
& 0.6 ppm for the Japanese & Koreans, respectively). Although total finfish consumption
rates between the two populations were in proximity to each other, Hg intake between the
two is significantly different. Consumption patterns suggest that within both populations,
there may be a percentage of individuals not obtaining their daily dietary requirement of
DHA or DHA+EPA.. Fish consumption guidelines based on contaminant concentrations
alone can have the unintended consequence of causing a portion of the population to have
an insufficient intake of required nutrients. There are sufficient differences in fish-species
consumption behavior and Hg intake levels between these two populations to suggest that
Asian populations should not be grouped as a whole, but treated independently.
NIMD Forum 2009 Minamata City, 19―20 February 2009
22
Keywords: mercury, n-3 fatty acids, fish, nutrition, fish advisories, Japanese, Korean
1. Introduction
Fish contain contaminants such as mercury (Hg), PCBs, dioxin and pesticides that may cause
adverse health effects in humans when consumed in large quantities. In particular, health effects
of Hg have been well documented beginning with the Minamata and Iraqi incidents (Bakir et al.
1973; Harada 1995; Kondo 2000). As a result of studies on human effects, the US
Environmental Protection Agency (USEPA) established a reference dose (RfD) of 0.1 ug/kg/day
for methylmercury while the Joint Food and Agriculture Organization/World Health
Organization Expert Committee on Food Additives (JECFA) determined the provisional
tolerable weekly intake (pTWI) to be 1.6 ug/kg/week (World Health Organization 2003).
Because fish is the most prominent source of non-occupational Hg exposure in our diet,
regulatory agencies worldwide have developed fish consumption guidelines derived from
established reference doses or tolerable intakes. Thus, most public health guidelines are based
on preventing overexposure by providing fish consumption advice (Scherer et al. 2008).
Along with concern over contaminant exposure, fish consumption is also associated with
improved health (Akabas and Deckelbaum 2006; Cohen et al. 2005). In particular, fish is a
major source of n-3 polyunsaturated fatty acids (PUFAs) such as eicosapentaenoic acid (EPA)
and docosahexaenoic acid (DHA). DHA and EPA together are thought to play important roles
in neurodevelopment (Akabas and Deckelbaum 2006; Hibbeln et al. 2006). The optimal intake
of DHA is thought to be between 100 and 300 mg per day for women (Akabas and Deckelbaum
2006). For DHA and EPA together the optimal intake is considered to be between 400 and 500
mg per day (Gebauer et al. 2006; Kris-Etherton et al. 2002).
Recently, studies have investigated the risk-benefit aspects of seafood consumption; with
results being inconclusive (Budtz-Jorgensen et al. 2007; Nesheim et al. 2007; Sakamoto et al.
2004). In this paper, we attempt to better understand this issue by examining high end fish
consumers consisting of women of childbearing age living in the U.S. to determine how the
intake of PUFAs relates to Hg exposure and how this relationship can impact fish consumption
guidance.
2. Subjects and Methods
As part of the Arsenic Mercury Intake Biometric Study, women of childbearing age (18-45
years) who identified themselves as Korean, Japanese or of Japanese or Korean descent
participated in the longitudinal study. The recruitment method and sample collection methods
have been previously described in detail (Tsuchiya et al. 2008; Tsuchiya et al. 2008). In
NIMD Forum 2009 Minamata City, 19―20 February 2009
23
summary, participants came to the clinics and participated in a structural interview consisting of
a fish consumption survey and a demographic questionnaire while also providing biological
samples. The fish consumption survey was developed based on previously used surveys
(Mariën and Patrick 2001; Sechena et al. 2003; Toy et al. 1996). Participants were asked to
identify the fish species they consumed during the past year and provide amounts and frequency
of consumption for each species consumed. Hair from the nape of the neck was collected for
Hg analysis. DHA and EPA intakes were estimated based on the consumption of individual
species. The amounts of DHA and EPA in fish species were determined by using previously
published data (Ackman 2000; Exler and Weihrauch 1976; Kagawa 2005; Mahaffey 2004). The
study materials were approved by the State of Washington Department of Social and Health
Services Human Research Review Board.
3. Results and Discussion
A total of 214 women of childbearing age (106 Japanese and 108 Koreans) participated in this
study. Mean finfish intake for Japanese was 60 g/d and 59 g/d for Koreans with mean total
seafood intakes being 73 g/d and 82 g/d, respectively. Intake levels were not significantly
different (p <0.05) between communities. These seafood intakes were close to the 95th
percentile for the U.S. general population as provided from National Health and Nutrition
Examination Survey data (Mahaffey et al. 2004).
The species consumed by the populations were markedly different. The 6 finfish species most
consumed by the Japanese were: salmon (29 % of total intake), mackerel (9%), black cod (6%),
squid (6%), light tuna (canned) (5%) and halibut (4%). The species most consumed by the
Korean population were: squid (23%), mackerel (12%), yellow croacker (11%), salmon (9%),
flounder/sole (6%), and light tuna (canned) (6%). In addition to the differences in species
consumed, hair-Hg levels were significantly different between the two communities.
The mean hair-Hg level for the Japanese was 1.6 ppm with 55 % of the population exceeding
the USEPA‟s RfD of 1.2 ppm. However, the mean hair-Hg level for the Korean population was
0.75 ppm and only 13% exceeded the RfD. The difference in Hg exposure is likely due to the
differences in type of fish species consumed.
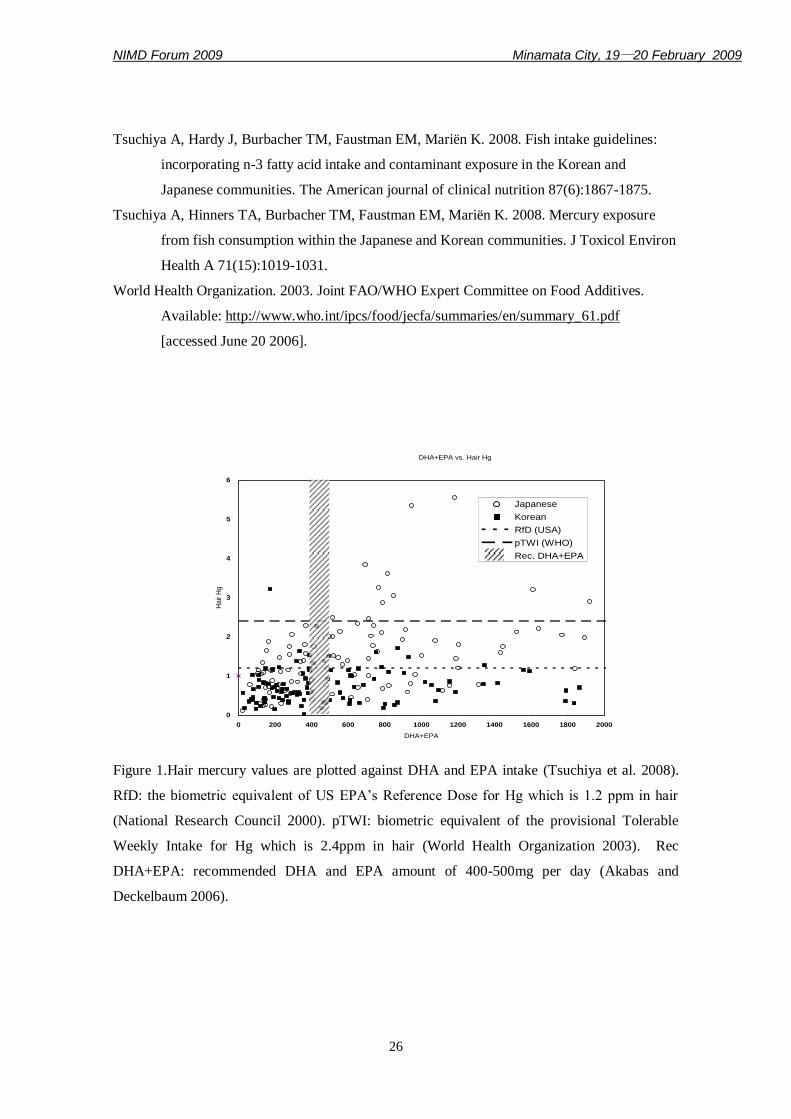
Intakes of DHA and EPA were plotted against hair-Hg levels (Figure 1). For the Japanese
community, 40 individuals (38%) did not meet the recommended DHA + EPA intake and of
those, 12 individuals (11%) exceeded the RfD. Within the Korean community, 62 individuals
(57%) did not meet the recommended DAH+EPA intake. However, only 5 (5%) exceeded the
RfD. Our results suggest that both communities consumed fish in large quantity, yet a portion
NIMD Forum 2009 Minamata City, 19―20 February 2009
24
of each population did not meet DHA + EPA recommended intake on a daily bases. Therefore,
these two populations could benefit from fish consumption guidance that includes information
on minimizing Hg exposure as well as on the benefits of fish consumption so as to reduce both
Hg exposure while also reducing the number of individuals not obtaining the recommended
levels of n-3 PUFAs. Further, the guidance should be population specific as the Japanese need
to reduce their Hg exposure while increasing DHA+EPA intake. In contrast, the Korean
population needs to increase their intake of fatty fish species that are low in Hg and have no
restrictions placed on fish consumption. The observed differences between the two populations
in regards to fish consumption behavior, hair-Hg levels, DHA/EPA intake and recommended
public health guidance on fish consumption suggests that Asian populations should not be
grouped as a whole, but treated independently.
References
Ackman R. 2000. Fatty acids in fish and shellfish. In: Fatty Acids in Foods and Their Helath
Implications, 2nd Edition (Chow C, ed):Marcel Dekker AG, Basel, 153-174.
Akabas SR, Deckelbaum RJ. 2006. Summary of a workshop on n-3 fatty acids: current status of
recommendations and future directions. The American journal of clinical nutrition 83(6
Suppl):1536S-1538S.
Bakir F, Damluji SF, Amin-Zaki L, Murtadha M, Khalidi A, al-Rawi NY, et al. 1973.
Methylmercury poisoning in Iraq. Science 181(96):230-241.
Budtz-Jorgensen E, Grandjean P, Weihe P. 2007. Separation of risks and benefits of seafood
intake. Environ Health Perspect 115(3):323-327.
Cohen JT, Bellinger DC, Connor WE, Shaywitz BA. 2005. A quantitative analysis of prenatal
intake of n-3 polyunsaturated fatty acids and cognitive development. American journal
of preventive medicine 29(4):366-374.
Exler J, Weihrauch JL. 1976. Comprehensive evaluation of fatty acids in foods. VIII. Finfish. J
Am Diet Assoc 69(3):243-248.
Gebauer SK, Psota TL, Harris WS, Kris-Etherton PM. 2006. n-3 fatty acid dietary
recommendations and food sources to achieve essentiality and cardiovascular benefits.
The American journal of clinical nutrition 83(6 Suppl):1526S-1535S.
Harada M. 1995. Minamata disease: methylmercury poisoning in Japan caused by
environmental pollution. Crit Rev Toxicol 25(1):1-24.
NIMD Forum 2009 Minamata City, 19―20 February 2009
25
Hibbeln JR, Ferguson TA, Blasbalg TL. 2006. Omega-3 fatty acid deficiencies in
neurodevelopment, aggression and autonomic dysregulation: opportunities for
intervention. Int Rev Psychiatry 18(2):107-118.
Kagawa Y. 2005. Standard Tables of Food Composition in Japan. Fifth Revised and Enlarged
Edition. Tokyo:Kagawa Education Institute of Nutrition.
Kondo K. 2000. Congenital Minamata disease: warnings from Japan's experience. J Child
Neurol 15(7):458-464.
Kris-Etherton PM, Harris WS, Appel LJ. 2002. Fish consumption, fish oil, omega-3 fatty acids,
and cardiovascular disease. Circulation 106(21):2747-2757.
Mahaffey KR. 2004. Fish and shellfish as dietary sources of methylmercury and the omega-3
fatty acids, eicosahexaenoic acid and docosahexaenoic acid: risks and benefits. Environ
Res 95(3):414-428.
Mahaffey KR, Clickner RP, Bodurow CC. 2004. Blood organic mercury and dietary mercury
intake: National Health and Nutrition Examination Survey, 1999 and 2000. Environ
Health Perspect 112(5):562-570.
Mariën K, Patrick GM. 2001. Exposure analysis of five fish-consuming populations for
overexposure to methylmercury. J Expo Anal Environ Epidemiol 11(3):193-206.
National Research Council. 2000. Toxicological effects of methylmercury. Washington,
DC:National Academy Press.
Nesheim MC, Yaktine AL, Institute of Medicine (U.S.). Committee on Nutrient Relationships
in Seafood: Selections to Balance Benefits and Risk. 2007. Seafood choices : balancing
benefits and risks. Washington, D.C.:National Academies Press.
Sakamoto M, Kubota M, Liu XJ, Murata K, Nakai K, Satoh H. 2004. Maternal and fetal
mercury and n-3 polyunsaturated fatty acids as a risk and benefit of fish consumption to
fetus. Environ Sci Technol 38(14):3860-3863.
Scherer AC, Tsuchiya A, Younglove LR, Burbacher TM, Faustman EM. 2008. Comparative
analysis of state fish consumption advisories targeting sensitive populations. Environ
Health Perspect 116(12):1598-1606.
Sechena R, Liao S, Lorenzana R, Nakano C, Polissar N, Fenske R. 2003. Asian American and
Pacific Islander seafood consumption -- a community-based study in King County,
Washington. J Expo Anal Environ Epidemiol 13(4):256-266.
Toy KA, Polissar NL, Liao S, Mittelstaedt GD. 1996. A fish consumption study of the Tulalip
and Squaxin Island tribes of the Puget Sound region. Marysville, WA: Tulalip Tribes,
Department of Environment.
NIMD Forum 2009 Minamata City, 19―20 February 2009
26
Tsuchiya A, Hardy J, Burbacher TM, Faustman EM, Mariën K. 2008. Fish intake guidelines:
incorporating n-3 fatty acid intake and contaminant exposure in the Korean and
Japanese communities. The American journal of clinical nutrition 87(6):1867-1875.
Tsuchiya A, Hinners TA, Burbacher TM, Faustman EM, Mariën K. 2008. Mercury exposure
from fish consumption within the Japanese and Korean communities. J Toxicol Environ
Health A 71(15):1019-1031.
World Health Organization. 2003. Joint FAO/WHO Expert Committee on Food Additives.
Available: http://www.who.int/ipcs/food/jecfa/summaries/en/summary_61.pdf
[accessed June 20 2006].
Figure 1.Hair mercury values are plotted against DHA and EPA intake (Tsuchiya et al. 2008).
RfD: the biometric equivalent of US EPA‟s Reference Dose for Hg which is 1.2 ppm in hair
(National Research Council 2000). pTWI: biometric equivalent of the provisional Tolerable
Weekly Intake for Hg which is 2.4ppm in hair (World Health Organization 2003). Rec
DHA+EPA: recommended DHA and EPA amount of 400-500mg per day (Akabas and
Deckelbaum 2006).
DHA+EPA vs. Hair Hg
0
1
2
3
4
5
6
0 200 400 600 800 1000 1200 1400 1600 1800 2000
DHA+EPA
Hair H
g
Japanese
Korean
RfD (USA)
pTWI (WHO)
Rec. DHA+EPA
DHA+EPA vs. Hair Hg
0
1
2
3
4
5
6
0 200 400 600 800 1000 1200 1400 1600 1800 2000
DHA+EPA
Hair H
g
Japanese
Korean
RfD (USA)
pTWI (WHO)
Rec. DHA+EPA
NIMD Forum 2009 Minamata City, 19―20 February 2009
27
Relationship of methylmercury (MeHg) and
docosahexaenoic acid (DHA) in pregnant women and fetuses
Mineshi Sakamotoa*
, Shyoichi Kawakamib,Katsuyuki Murata
c,
Kunihiko Nakaid, Hiroshi Satoh
d
aDepartment of Epidemiology, National Institute for Minamata Disease,
Minamata, Kumamoto 867-0008, Japan. bGynecology & Obstetrics, Fukuda Hospital, Kumamoto 860-0004, Japan.
cDepartment of Environmental Health Sciences, Akita University School of Medicine, Akita 010-
8543, Japan dEnvironmental Health Sciences, Tohoku University Graduate School of Medicine,
Sendai 980-8575, Japan
Abstract
This study was designed to determine the relationship between methylmercury (MeHg)
exposure and docosahexaenoic acid (DHA) concentrations in pregnant women and fetuses to
consider the risk and benefit of maternal fish consumption during the gestation period. Venous
blood samples were collected from 55 pairs of mothers from early gestation, and mothers and
fetuses (cord blood) at parturition. Total mercury (Hg) in blood and fatty acids in plasma were
measured. Maternal Hg level showed a tendency to decline from early gestation to parturition.
Cord blood Hg level was about 1.8 times higher than mothers. Significant positive correlations
with Hg (r=0.78) and DHA (r=0.67) were observed between mother and fetuses, indicating that
both substances in fetuses reflect maternal exposures. Significant positive correlations of Hg
and DHA were observed in mothers both at early gestation (r=0.29) and at parturition (r=0.36).
A significant positive correlation with MeHg and DHA was also observed in cord blood
(r=0.36). These results confirm that both Hg and DHA which originated from fish consumption
transferred from mothers to fetus and they existed in the fetal blood with a positive correlation.
Pregnant women in particular need not give up eating fish to obtain such benefits. However,
they would do well to at least consume smaller fish, which contains less MeHg, thereby
balancing the risks and benefits from fish consumption.
Keywords: methylmercury, heavy metals, placental transfer, red blood cells, cord blood
1.Inroduction
Methylmercury (MeHg) is a well known and widespread environmental neurotoxicant. In the
natural course of events, most human exposure to MeHg is through fish and sea mammal
NIMD Forum 2009 Minamata City, 19―20 February 2009
28
consumption. Generally, the larger fish and sea mammals at the top of the food chain, such as
shark, tuna and whale, contain higher levels of MeHg than the smaller ones. Fetuses are known
to be a high-risk group for MeHg exposure since the susceptibility of the developing brain itself
is high. Therefore, the effect of MeHg exposure on pregnant women remains an important issue
for elucidation, especially in populations which consume much fish and sea mammals.
On the other hand, human intake of the n-3 longer chain of polyunsaturated fatty acids (PUFA),
such as eicosapentaenoic acid (EPA, C20:5n-3) and docosahexaenoic acid (DHA, C22:6n-3), is
also known to be produced originally by phytoplankton, mainly from fish consumption. Both
of these fatty acids are very beneficial for human health. Especially, DHA is known to be an
important n-3 PUFA for normal brain development and function. Rapid brain growth occurs
primarily during the third trimester in humans, and the amount of these fatty acids increases
dramatically during the period. This period corresponds to when the human brain is most
susceptible to MeHg, and also a high accumulation of MeHg in the brain may occur during the
period.
We conducted a study mainly to determine the relationship between Hg and plasma fatty acid
concentrations in mothers and fetus to evaluate the risks and benefits of maternal fish
consumption by comparing 55 maternal-fetal pairs of blood samples.
2. Subjects and Methods
Fifty-five healthy Japanese pregnant women without any particular exposure to Hg provided
informed consent to participate in the present trial approximately at early gestation. These
women ranged in age from 19 to 40 years (average age 29.3 ± 4.8 years), and resided in
Kumamoto City, Kumamoto, Japan. Blood and hair samples were collected at early gestation
and at parturition from the mothers. Cord blood samples were collected immediately after birth.
Fatty acid composition analysis in plasma was immediately performed by SRL Inc. (Tokyo,
Japan). Blood samples were stored at -80C until total Hg (THg) analysis. This study was
approved by the Ethics Committee of the National Institute for Minamata Disease (NIMD).
Total Hg in 0.5 g of blood was determined by cold vapor atomic absorption spectrophotometry
(CVAAS) according to the method of Akagi (Akagi et al., 2000).
3. Results and Discussion
MeHg is one of the substances most risky to fetal brain development, and most of the exposure to
MeHg is through maternal fish consumption (IPCS, WHO 1990). On the other hand, DHA, which
is important for the fetal brain and its growth, is also derived from maternal fish consumption. If
NIMD Forum 2009 Minamata City, 19―20 February 2009
29
human exposure to MeHg were independent of nutrition from fish, we would aim at zero exposure.
However, fish plays an important cultural role among Japanese and contains n-3 polyunsaturated
fatty acids, such as DHA and EPA. Therefore, this study was designed to determine the
relationship between MeHg exposure and DHA concentrations in pregnant women and fetuses to
consider the risk and benefit of maternal fish consumption during the gestation period.
MeHg and DHA levels in cord blood showed the tendency to increase with fish intake (g/day).
Significant positive correlations with MeHg (r=0.78) and DHA (r=0.67) were observed between
maternal and cord blood, indicating that both substances in fetuses reflect maternal exposures.
Cord blood Hg level was about 1.8 times higher than mothers at parturition. This suggests that
MeHg actively transfers to the fetus across the placenta via neutral amino acid carrier (Ashner,
M., Clarkson, T.W 1988), when the fetus is most susceptible to MeHg. Therefore, the effect of
MeHg exposure remains an important issue for elucidation, especially in populations which
consume much fish and sea mammals. Maternal Hg levels at early gestation and at parturition
showed a significant positive correlation (r=0.53). However, the level showed a tendency to
decline from early gestation to parturition, indicating that high amount of MeHg transfers from
mothers to fetuses through placenta during gestation.
DHA and arachidonic acid (AA) are abundant in the brain. During rapid brain growth, large
amounts of DHA and AA from the maternal circulation must reach the fetus to meet its needs
for development. The rapid quantitative accretion of both DHA and AA during the third
trimester of pregnancy was noticed in human brain. Breast-milk also contains these fatty acids.
Our data showed that the fetal/maternal ratio of DHA and AA are higher than other fatty acids,
which are not important for brain, indicating that the fatty acids which are important for the
brain and its growth were selectively transferred from maternal blood to cord blood.
Though the origins of the two fatty acids are completely different, DHA showed significant
positive correlations with AA, which is also important for fetal brain and its growth. This
phenomenon is interesting, and it may suggest that the ratio of these fatty acids is also important.
Hair/blood Hg ratios were 356 at early gestation, 339 at partition, and higher than 250 at the
steady state, which indicates that MeHg distribution can not be explained by a single-
compartment model. This must be taken into consideration in risk assessment of MeHg during
gestation.
Significant positive correlations of MeHg and DHA were observed in mothers both at early
gestation (r=0.29) and at parturition (r=0.36). A significant positive correlation with MeHg and
DHA was also observed in fetuses (r=0.36). These results suggest that they were derived from
fish consumption and were selectively transferred from mothers to fetuses. These results
NIMD Forum 2009 Minamata City, 19―20 February 2009
30
indicate that both MeHg and DHA, which act contrary to the normal growth and function of the
developing brain, were taken into the maternal blood through maternal fish consumption and
transfer to fetal blood, and that they showed positive correlations. Therefore, if the ordinary fish
consumed are low in MeHg but rich in DHA, children‟s health will especially benefit from the
fish consumption. However, if the fish MeHg concentration is high enough to ruin the effect of
DHA, fish consumption will retard children‟s development. Pregnant women in particular
would do well to consume at least smaller fish, thereby reducing the risk from large fish but
allowing them to continue to eat them in order to confer the benefits.
References
Akagi, H., Castillo, E.S., Cortes-Maramba, N. 2000. Sci Total Environ 259 (1-3), 31-43.
IPCS, WHO. Environmental Health Criteria 101. Geneva, 1990
Ashner, M., Clarkson, T.W. 1988. Teratology, 19, 145-155
NIMD Forum 2009 Minamata City, 19―20 February 2009
31
Prenatal low levels mercury exposure on infant development:
a prospective study in Zhoushan Islands, China
Chong-Huai Yan Yu Wang*, Yu Gao, Hong Zhang, Xiao-Ming Shen *XinHua Hospital affiliated to Shanghai Jiao Tong University School of Medicine, Shanghai
Institute for Pediatric Research, Shanghai Key Laboratory of Children‟s Environmental Health
Shanghai 200092, China
Objective. To explore the relationship between prenatal mercury exposure and infant neuro-
developmental outcomes in Zhoushan cohort.
Material and methods. 408 mother-infant pairs were enrolled in the cohort of Zhoushan
Islands. Prenatal mercury exposure was determined by measuring cord blood mercury(CBHg,
Range 1.34-18.34µg/L). Based on their CBHg, children were divided into two groups: 80 in low
mercury group (LG, CBHg<P20, 3.98µg/L), and 84 in high mercury group (HG, CBHg>P80,
8.09µg/L). Children were followed up at 3 (n=149) and 12 (n=123)months mos. of age with
evaluated BSID, hair mercury and questionnaire. The association between CBHg concentrations
and neurodevelopmental outcomes at 3 and 12 months of age was examined by multiple
regression analysis with adjustment for confounding variables.
Results. The average hair mercury levels were 1058.71±69.58(LG), 1903.06±139.37µg/kg(HG)
of 3-month-infant and 906.05±110.26(LG), 1512.41±93.85µg/kg(HG) of 12-month-infant. The
hair mercury of 12-month were lower than that of 3-month significantly in both group. MDI of
3-month-infant were 109.01±4.16 of LG, 108.32±4.23 of HG, PDI were 99.91±3.28 of LG, and
98.71±5.21 of HG. MDI of 12-month-infant were 110.60±4.29 of LG, 109.56±4.29 of HG; PDI
were 104.06±3.75, and 101.70±3.59 of HG. There were no significant differences of MDI and
PDI between the two groups in both ages. At 3 months, high risk factors for MDI were hair
mercury of 3 months and head circumference; and those for PDI were hair mercury of 3 months
and gender. At 12 months, the high risk factors for MDI scores were hemoglobin of 3 months,
age when children stood up and those for PDI were age when children stood up, average times
of fish dinners of mother and hemoglobin of 12 months.
Conclusions. The hair mercury level was significantly related with CBHg. The mercury
exposure level of 12- month-infant was lower than that of 3-month-infant. Prenatal low level
mercury exposure had no significantly impacts on infants' development in Zhoushan cohort.
NIMD Forum 2009 Minamata City, 19―20 February 2009
32
Cohort study of the effects of perinatal exposure to
methylmercury and POPs on development of infants in Japan;
an interim report of Tohoku Study of child development
Hiroshi Satoh, Kunihiko Nakai, Keita Suzuki*, Naoyuki Kurokawa, Tomoko Oka-
Sugawara, Nozomi Tatsuta*, Takashi Ohba and Miyuki Shimada
Environmental Health Sciences, Tohoku University Graduate School of Medicine, Sendai 980-8575,
Japan
*Human Development and Disabilities, Tohoku University Graduate School of Education, Sendai,
980-8576, Japan
Abstract
Possible effects on the development of infants exposed to methylmercury and POPs in utero
are of great concern among fish-eating populations, because exposures occur through maternal
fish intake. Moreover fish also contains n-3 polyunsaturated fatty acids essential for normal
brain development in the fetus and infant. Therefore we have been performing a prospective
cohort study, the Tohoku Study of Child Development (TSCD), to examine the effects of
perinatal exposure to methylmercury and POPs emphasizing PCBs on neurobehavioral
development. Healthy pregnant women in Tohoku district, northeastern part of the mainland
Japan, were recruited. Biological samples were collected during pregnancy and at delivery.
Several types of questionnaire were administered including food-intake frequency questionnaire.
The development of infants has been repeatedly assessed by Brazelton Neonatal Behavioral
Assessment Scale, Bayley Scales of Infant Development and Kaufman Assessment Battery for
Children. Biological samples have been analyzed for total and methylmercury, heavy metals,
dioxins, PCBs and several organochlorine pesticides. Since this cohort study is on going and
especially chemical analyses have not been completed, in this paper 466 mother-infant pairs
who had PCB data were analyzed. The results of multiple regression analyses suggested that
perinatal exposures to methylmercury and PCBs have sporadically shown effects on infant
development. But the effects seem to be temporary rather than permanent. This is especially
true for methylmercury. It is thought we have to continue the follow-up of TSCD infants more
and to carry on chemical analyses to increase the numbers of samples and species of substances
to be analyzed. We are now carrying out the follow-up examination at 84-month-old including
Wechsler Intelligence Scale for Children (3rd edition), Boston Naming Test, Continuous
Performance Test and electrophysiological examinations.
NIMD Forum 2009 Minamata City, 19―20 February 2009
33
Keywords: methylmercury, PCBs, perinatal exposure, postnatal development, Neonatal
Behavioral Assessment Scales, Bayley Scales of Infant Development, Kaufman Assessment
Battery for Children
1. Introduction
Several epidemiological studies have indicated that perinatal exposure to heavy metals and
some persistent organic pollutants (POPs) can cause the developmental deficits such as
postnatal growth delay and poor cognitive functions. Especially methylmercury (MeHg) and
polychlorinated biphenyls (PCBs) are of great concern among fish-eating populations, because
exposures occur through maternal fish intake. Moreover fish also contains n-3 polyunsaturated
fatty acids essential for normal brain development in the fetus and infant. Therefore we have
been performing a prospective cohort study, the Tohoku Study of Child Development (TSCD),
to examine the effects of perinatal exposure to methylmercury and POPs emphasizing PCBs on
neurobehavioral development in Japanese children (Nakai et al., 2004).
2. Subjects and Methods
Healthy pregnant women were recruited with their informed consents at obstetrical wards of
two hospitals in urban area, and one obstetrical ward of a hospital and an obstetric clinic in
coastal area in Tohoku district, northeastern part of the mainland Japan. Maternal blood was
collected during pregnancy. Cord blood, cord tissue and placenta were collected at delivery.
Hair samples were also collected before leaving the hospitals or the clinic. Several types of
questionnaire were administered including food-intake frequency questionnaire, educational and
occupational backgrounds and life-style before leaving. Breast milk was collected at their own
home one month later. The samples were sent to our laboratory under cooling condition by a
courier service. Approximately 1,300 mother-infant pairs were obtained after applying
exclusion criteria such as congenital anomaly, a severe disease and low-birth weight.
The development of infants have been longitudinally assessed by Brazelton Neonatal
Behavioral Assessment Scale (NBAS) at 3-day-old, Bayley Scales of Infant Development
(BSID) and Kyoto Scale of Psychological Development at 7- and 18-month-old and Kaufman
Assessment Battery for Children (K-ABC) at 42-month-old. Chemical analyses of biological
samples are in progress. The followings are the target substances in biological samples: total
mercury in hair; total and methylmercury in maternal and cord blood; heavy metals in maternal
and cord blood and placenta; dioxins, PCBs and several organochlorine pesticides in maternal
and cord blood and breast milk.
NIMD Forum 2009 Minamata City, 19―20 February 2009
34
Multiple regression analysis was applied to detect the effects of perinatal exposure to
chemicals on Birth Weight, NBAS, Mental Development Index (MDI) and Psychomotor
Development Index (PDI) of BSID, Mental Processing (MPS) and Achievement Scales (AS) of
K-ABC. Since we have been interested in the developmental effects of perinatal chemical
exposure through fish consumption, total mercury in the segment of maternal hair 3 cm from the
scalp (Hg Hair) (Ohba et al., 2008), PCBs in cord blood (PCB), maternal annual fish
consumption (Fish) and cord blood lead (Pb) were set as independent variables and fixed in the
model. The other variables including maternal age at delivery (Maternal Age), body weight
before pregnancy (BW), alcohol drinking or smoking during pregnancy (yes/no: Drinking or
Smoking), Parity (primipara/multipara), Delivery Type (spontaneous/not), years of Education
(<=12 or 12<), Raven's standard progressive matrices (Raven), Sex of babies, Gestational Week,
Birth Weight, Apgar score (1 min.) were entered in the regression models and backward
stepwise analyses were carried out. Variables were log-transformed when appropriate.
3. Results and Discussion
Since this cohort study is on going and especially chemical analyses have not been
completed, the analyses on the association between infant development and perinatal exposures
to POPs and heavy metals have been limited. In this paper, 466 mother-infant pairs who had
PCB data were analyzed. Chemical analyses on mercury and Pb for these pairs were done. The
numbers of female/male babies were 222/244. The mean+/-SD of Gestational Week was
39.6+/-1.25 and Birth Weight 3080+/-331g, respectively. The median of Fish was 20.5 kg/year.
As for the exposure measures, medians of total mercury in maternal and cord blood were 5.3,
10.0 ng/ml, and most (>95%) was methylmercury. Hg Hair well correlated with total and
methylmercury in maternal and cord blood. The median of Hg Hair was 1.97 ng/mg and within
the normal range in Japan. The medians of PCB and Pb were 47.6 ng/g-lipid and 9.7 ng/ml
(0.97 micro-g/100mL), respectively. These levels were rather low compared with other studies
(Nakamura et al., 2008).
By the multiple regression analyses, significant variables selected for Birth Weight were
Maternal Age, BW, Fish, Sex, Gestational Week and PCB (Kurokawa et al., 2008). Among
these variables PCB was negatively associated with Birth Weight. As for the results of NBAS,
only motor cluster in the seven clusters in NBAS was negatively associated with Hg Hair, and
Maternal Age, Birth Weight and Fish showed positive associations (Suzuki et al., 2006).
Perinatal methylmercury exposure showed a negative but slight effect whereas fish intake
showed slight positive one. For BSID at 7-month-old, no association with these variables was
observed for MDI and Education was only variable to affect PDI. As for BSID at 18-month-old,
NIMD Forum 2009 Minamata City, 19―20 February 2009
35
sex difference was observed for MDI and Birth Weight negatively associated with PDI.
Although perinatal PCB exposure did not show effects on either NBAS, BSID at 7- and 18-
month-old, it affected MPS at 42-month-old. Fish also negatively associated. Parity solely
affected AS. Pb showed no association with either developmental outcome above.
It has been suggested that perinatal exposures to methylmercury and PCBs have sporadically
shown effects on infant development. But the effects seem temporary ones rather than
permanent ones so far. This is especially true for methylmercury. PCB showed a negative
association with Birth Weight but did not with other outcomes including NBAS and BSIDs. It
is interesting that PCB showed a negative association with MPS in K-ABC which was
examined later. We do not know reasons at this moment, though it is anticipated
neurodevelopmental effects by PCB exposure may be persistent with a long biological half-life
of the substances. We do not have data on PCBs in breast milk. It is considered that postnatal
exposure to PCBs via milk must evaluated in addition to perinatal exposure.
It is thought we have to continue the follow-up of infant development more and to carry on
chemical analyses to increase the numbers of samples and species of substances to be analyzed.
We are now carrying out the follow-up examination at 84-month-old including Wechsler
Intelligence Scale for Children (3rd edition), Boston Naming Test, Continuous Performance
Test and electrophysiological examinations.
References
Kurokawa, N., K. Nakai, K. Suzuki, T. Nakamura, K. Sakurai, M. Shimada, T. Ohba, C.
Satoh,
S.Kameo, K. Okamura and H. Satoh. (2008) Organohalogen Compounds. 70: 2256-2259.
Nakai, K., K. Suzuki, T. Oka, K. Murata, M. Sakamoto, K. Okamura, T. Hosokawa, T. Sakai,
T. Nakamura, Y. Saito, N. Kurokawa, S. Kameo and H. Satoh. (2004) Tohoku Journal of
Experimental Medicine 202: 227-237.
Nakamura, T., K. Nakai, T. Matsumura, S. Suzuki, Y. Saito and H. Satoh. (2008) Science
of the Total Environment. 394: 39-51.
Ohba, T., N. Kurokawa, K. Nakai, M. Shimada, K. Suzuki, N. Sugawara, S. Kameo,
C. Satoh and H. Satoh. (2008) Tohoku Journal of Experimental Medicine. 214: 69-78.
Suzuki, K., K. Nakai, T. Nakamura, T. Hosokawa, K. Okamura, T. Sakai, N. Kurokawa,
S. Kameo, K. Murata and H. Satoh. (2006) Organohalogen Compounds. 68: 1201-1204.
NIMD Forum 2009 Minamata City, 19―20 February 2009
36
Methylmercury exposure, seafood intake and health risks
in Faroese populations
Anna L. Choi1, Pal Weihe
2, Esben Budtz-Jørgensen
3, Poul J. Jørgensen
4, Jukka T.
Salonen5,6
, Tomi-Pekka Tuomainen6, Katsuyuki Murata
7, Hans Petur Nielsen
2,
Maria Skaalum Petersen8, Jórun Askham
2, Philippe Grandjean*
1,8
1Department of Environmental Health, Harvard School of Public Health, Boston, MA
2Faroese Hospital System, Tórshavn, Faroe Islands
3Institute of Public Health, University of Copenhagen, Copenhagen, Denmark
4Department of Clinical Biochemistry, Pharmacology, and Genetics, Odense University Hospital,
Odense, Denmark 5Oy Jurilab Ltd, Kuopio, Finland
6Research Institute of Public Health, School of Public Health and Clinical Nutrition,
University of Kuopio, Kuopio, Finland 7Department of Environmental Health Sciences, Akita University School of Medicine,
Akita, Japan *8
Institute of Public Health, University of Southern Denmark, Odense, Denmark
Methylmercury is a worldwide contaminant found in seafood and freshwater fish and is a well-
established developmental neurotoxicant. However, essential nutrients in fish and seafood may
provide beneficial effects on brain development. The impact on the same health outcomes by
two exposures originating from the same food source provides a classic example of negative
confounding. We therefore re-examined our previous findings of developmental neurotoxicity
in a Faroese birth cohort and included adjustment for maternal fish intake during pregnancy. In
this population, most of the methylmercury intake originates from pilot whale meat, which
contains only small amounts of n-3 fatty acids. A weak association existed between mercury
exposure and fish intake (r = 0.23). Both methylmercury exposure and fish nutrition intake are
assessed with some degree of imprecision, which needs to be incorporated in the statistical
analysis. When taking fish intake into account, the adverse effects of methylmercury increased.
Thus, failure to adjust for the benefits of fish intake caused an underestimation of the true extent
of methylmercury neurotoxicity.
Recent evidence has suggested that methylmercury may promote or predispose to the
development of heart disease, while n-3 fatty acids from seafood also in this case may
counteracting the adverse effects. In a pilot study, we examined 42 Faroese whalingmen (aged
30-70 years) to assess possible adverse effects within a wide range of methylmercury exposures
from consumption of pilot whale meat. The average number of fish dinners consumed per week
in the last year was included as a covariate that was allowed to affect both mercury exposure
and outcomes. Exposure levels were assessed from mercury analysis of toenails and whole

NIMD Forum 2009 Minamata City, 19―20 February 2009
37
blood obtained at the time of clinical examination, and of a hair sample that had been collected
seven years previously. Outcome measures include heart rate variability, blood pressure (BP),
common carotid intima-media thickness (IMT), and brainstem auditory evoked potentials.
Multiple regression and structural equation analyses were carried out to determine the
confounder-adjusted effect of mercury exposure. Taking into account correlations among
related measures, exposure and outcomes were categorized in groups to derive latent exposure
and response variables in structural equation models. Multiple regression analysis was used to
compare the predictive validity of individual exposure biomarkers and the latent exposure
variable on individual and latent outcomes. The toenail mercury concentrations varied widely
and had a geometric mean of 2.0 μg/g; hair concentrations averaged about 3-fold higher. The
strongest associations were seen with BP and IMT, with toenail mercury as the strongest
predictor. Adjustment for the benefits from fish consumption resulted in strengthened
associations between mercury exposure and increased BP and IMT.
The results of both studies suggest that substantial underestimation occurs and that it affects
both the extent of mercury toxicity and the fish-associated benefits, when mutual adjustment is
not included in the statistical analysis. The underestimation is augmented by imprecise exposure
assessment. Regulatory agencies should reconsider current dietary advisories to provide better
guidance to consumers in making prudent choices to maintain a nutritious diet with fish and
seafood that are low in mercury concentrations.
References:
Budtz-Jørgensen E, Grandjean P, Weihe P. Separation of risks and benefits of seafood intake.
Environ Health Perspect 2007; 115: 323-7.
Choi AL, Cordier S, Weihe P, Grandjean P. Negative confounding in the evaluation of toxicity:
The case of methylmercury in fish and seafood. Crit Rev Toxicol 2008; 38: 877-93.
Choi AL, Weihe P, Budtz-Jørgensen E, Jørgensen PJ, Salonen JT, Tuomainen T-P, Murata K,
Nielsen HP, Petersen MS, Askham J, Grandjean P. Methylmercury exposure and adverse
cardiovascular effects in Faroese whalingmen. Environ Health Perspect (in press).
NIMD Forum 2009 Minamata City, 19―20 February 2009
38
Maternal fish intake during pregnancy, blood mercury levels,
and child cognition at age 3 years in a US cohort
Emily Oken1, Jenny S. Radesky
1, Robert O. Wright*
2, David C. Bellinger
3,
Chitra J. Amarasiriwardena4, Ken P. Kleinman
1,
Howard Hu5 and Matthew W. Gillman
1,6
1 Department of Ambulatory Care and Prevention, Harvard Medical School and Harvard Pilgrim
Health Care, Boston, MA *2
Department of Medicine, Children's Hospital Boston and Channing Laboratory,
Brigham and Women's Hospital and Harvard Medical School, Boston, MA 3 Department of Neurology, Boston Children's Hospital and Harvard Medical School, Boston, MA
4 Department of Environmental Health, Harvard School of Public Health, Boston, MA
5 Department of Environmental Health, University of Michigan, Ann Arbor, MI
6 Department of Nutrition, Harvard School of Public Health, Boston, MA
Correspondence to Dr. Emily Oken, Department of Ambulatory Care and Prevention, 133 Brookline
Avenue, Boston, MA 02215 (e-mail: [email protected] ).
The balance of contaminant risk and nutritional benefit from
maternal prenatal fish
consumption for child cognitive development is not known. Using data from a prospective
cohort study of 341 mother-child pairs in Massachusetts enrolled in 1999–2002,
the authors
studied associations of maternal second-trimester fish intake and erythrocyte mercury levels
with children's scores on the Peabody Picture Vocabulary Test (PPVT) and Wide Range
Assessment of Visual Motor Abilities (WRAVMA) at age 3 years. Mean maternal total fish
intake was 1.5 (standard deviation, 1.4) servings/week, and 40 (12%) mothers consumed >2
servings/week. Mean maternal mercury level was 3.8 (standard deviation, 3.8)
ng/g. After
adjustment using multivariable linear regression, higher fish intake was associated with better
child cognitive test performance, and higher mercury levels with poorer test
scores. Associations
strengthened with inclusion of both fish and mercury: effect estimates for fish intake of >2
servings/week versus never were 2.2 (95% confidence interval (CI): –2.6,
7.0) for the PPVT and
6.4 (95% CI: 2.0, 10.8) for the WRAVMA; for mercury in the top decile, they were –4.5 (95%
CI: –8.5, –0.4) for the PPVT and –4.6 (95% CI:
–8.3, –0.9) for the WRAVMA. Fish
consumption of
2 servings/week was not associated with a benefit. Dietary recommendations
for pregnant women should incorporate the nutritional benefits as well as the risks of fish intake.
Abbreviations: CI, confidence interval; DHA, docosahexaenoic acid; EPA, eicosapentaenoic
acid; PPVT, Peabody Picture Vocabulary Test; SD, standard deviation; WRAVMA, Wide
Range Assessment of Visual Motor Abilities
NIMD Forum 2009 Minamata City, 19―20 February 2009
39
Omega-3 fatty acids and methylmercury in diet:
sources, effects, and public health considerations
Kathryn R. Mahaffey
a
a Professorial Lecturer. Department of Occupational and Environmental Health, George Washington
University School of Public Health,
Washington D.C. USA
Abstract
Fish and shellfish contain both methylmercury, a neurotoxin that at high exposures produces
devastating effects on the developing nervous system. Fish and shellfish also contain a group of
chemicals, called n-3 polyunsaturated fatty acids (n-3 PUFAs) or omega-3 fatty acids. Specific
n-3 PUFAs are important structural components of the developing nervous system. Human can
synthesize these from precursors, but it is not clear if the rate of synthesis is rapid enough to
meet the needs of the developing fetal nervous system. Compared with males, females
(especially during pregnancy), appear to have a higher rate of synthesis of two key omega-3
fatty acids: Eicosapentaenoic acid (EPA) and docosapentaenoic acid (DHA). These are
synthesized from other dietary fatty acids. It is not clear that eating fish in amounts that provide
more omega-3 fatty acids than approximately 2000 milligrams/day of EPA and DHA offers any
benefits. The limit of intake providing benefits may be much lower.
Some studies of child development suggest that if methylmercury exposure from fish and
shellfish is low enough, EPA and DHA provided in fish and shellfish may be protective against
the adverse effects of methylmercury on the developing nervous system. The evidence for this
is very limited. Fortunately the quantities of EPA and DHA in specific fish and shellfish species
vary a lot. Some kinds of fish have more than 10-times the amount of EPA and DHA than do
other kinds of fish. For methylmercury the amount of mercury in specific fish species can differ
by 20-to-30 fold. Fortunately the fish that are highest in omega-3 fatty acids are not necessarily
high in mercury. Unfortunately some fish that are high in methylmercury do not contain very
much of the omega-3 fatty acids. Knowing which fish and shellfish have the most health
protective ratios of omega-3 fatty acids and are the lowest in methylmercury will help people
chose fish that are the most protective of human health.
Keywords: methylmercury, heavy metals, omega-3 fatty acids, n-3 polyunsaturated fatty acids,
eicosapentaenoic acid, EPA, decosapentaenoic acid, DHA, fish, blood mercury, hair mercury,
diet.
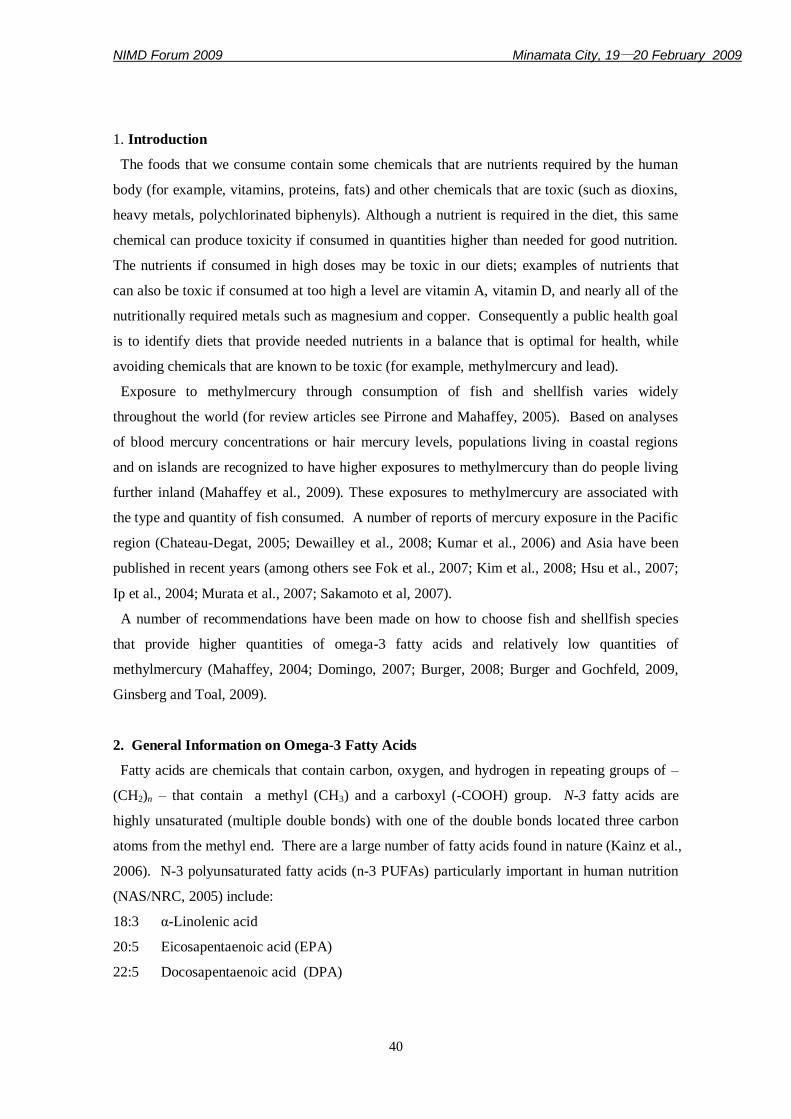
NIMD Forum 2009 Minamata City, 19―20 February 2009
40
1. Introduction
The foods that we consume contain some chemicals that are nutrients required by the human
body (for example, vitamins, proteins, fats) and other chemicals that are toxic (such as dioxins,
heavy metals, polychlorinated biphenyls). Although a nutrient is required in the diet, this same
chemical can produce toxicity if consumed in quantities higher than needed for good nutrition.
The nutrients if consumed in high doses may be toxic in our diets; examples of nutrients that
can also be toxic if consumed at too high a level are vitamin A, vitamin D, and nearly all of the
nutritionally required metals such as magnesium and copper. Consequently a public health goal
is to identify diets that provide needed nutrients in a balance that is optimal for health, while
avoiding chemicals that are known to be toxic (for example, methylmercury and lead).
Exposure to methylmercury through consumption of fish and shellfish varies widely
throughout the world (for review articles see Pirrone and Mahaffey, 2005). Based on analyses
of blood mercury concentrations or hair mercury levels, populations living in coastal regions
and on islands are recognized to have higher exposures to methylmercury than do people living
further inland (Mahaffey et al., 2009). These exposures to methylmercury are associated with
the type and quantity of fish consumed. A number of reports of mercury exposure in the Pacific
region (Chateau-Degat, 2005; Dewailley et al., 2008; Kumar et al., 2006) and Asia have been
published in recent years (among others see Fok et al., 2007; Kim et al., 2008; Hsu et al., 2007;
Ip et al., 2004; Murata et al., 2007; Sakamoto et al, 2007).
A number of recommendations have been made on how to choose fish and shellfish species
that provide higher quantities of omega-3 fatty acids and relatively low quantities of
methylmercury (Mahaffey, 2004; Domingo, 2007; Burger, 2008; Burger and Gochfeld, 2009,
Ginsberg and Toal, 2009).
2. General Information on Omega-3 Fatty Acids
Fatty acids are chemicals that contain carbon, oxygen, and hydrogen in repeating groups of –
(CH2)n – that contain a methyl (CH3) and a carboxyl (-COOH) group. N-3 fatty acids are
highly unsaturated (multiple double bonds) with one of the double bonds located three carbon
atoms from the methyl end. There are a large number of fatty acids found in nature (Kainz et al.,
2006). N-3 polyunsaturated fatty acids (n-3 PUFAs) particularly important in human nutrition
(NAS/NRC, 2005) include:
18:3 α-Linolenic acid
20:5 Eicosapentaenoic acid (EPA)
22:5 Docosapentaenoic acid (DPA)
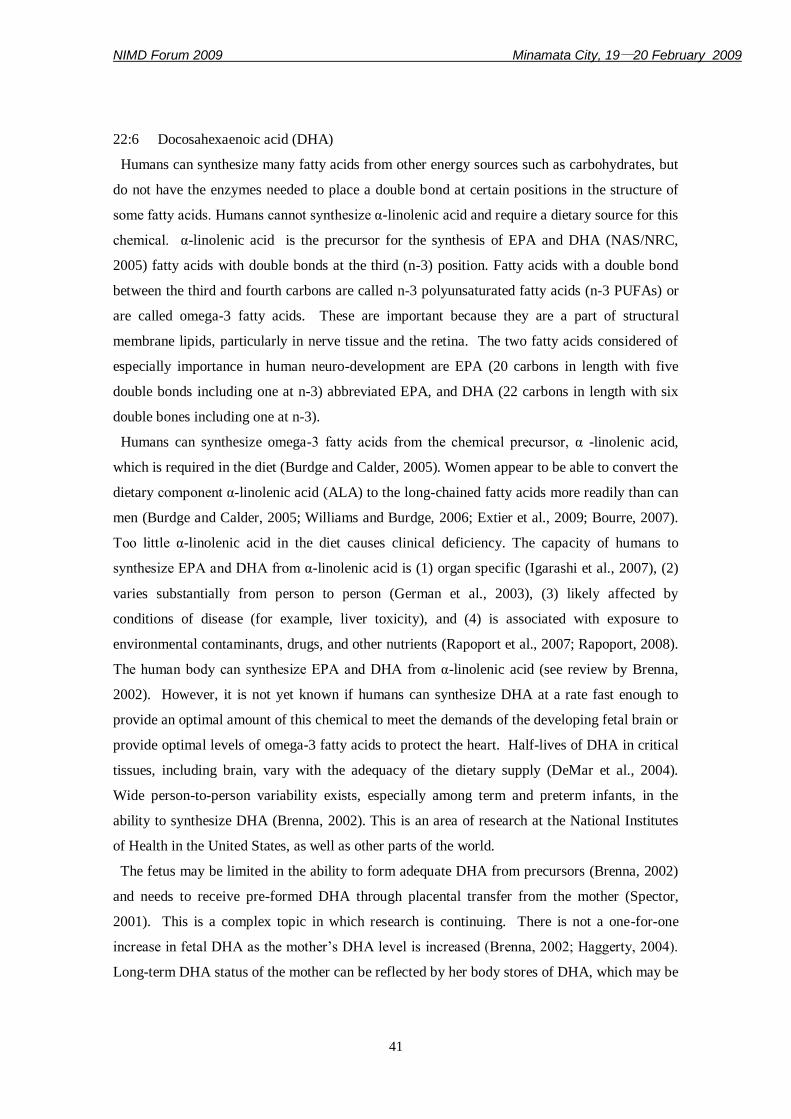
NIMD Forum 2009 Minamata City, 19―20 February 2009
41
22:6 Docosahexaenoic acid (DHA)
Humans can synthesize many fatty acids from other energy sources such as carbohydrates, but
do not have the enzymes needed to place a double bond at certain positions in the structure of
some fatty acids. Humans cannot synthesize α-linolenic acid and require a dietary source for this
chemical. α-linolenic acid is the precursor for the synthesis of EPA and DHA (NAS/NRC,
2005) fatty acids with double bonds at the third (n-3) position. Fatty acids with a double bond
between the third and fourth carbons are called n-3 polyunsaturated fatty acids (n-3 PUFAs) or
are called omega-3 fatty acids. These are important because they are a part of structural
membrane lipids, particularly in nerve tissue and the retina. The two fatty acids considered of
especially importance in human neuro-development are EPA (20 carbons in length with five
double bonds including one at n-3) abbreviated EPA, and DHA (22 carbons in length with six
double bones including one at n-3).
Humans can synthesize omega-3 fatty acids from the chemical precursor, α -linolenic acid,
which is required in the diet (Burdge and Calder, 2005). Women appear to be able to convert the
dietary component α-linolenic acid (ALA) to the long-chained fatty acids more readily than can
men (Burdge and Calder, 2005; Williams and Burdge, 2006; Extier et al., 2009; Bourre, 2007).
Too little α-linolenic acid in the diet causes clinical deficiency. The capacity of humans to
synthesize EPA and DHA from α-linolenic acid is (1) organ specific (Igarashi et al., 2007), (2)
varies substantially from person to person (German et al., 2003), (3) likely affected by
conditions of disease (for example, liver toxicity), and (4) is associated with exposure to
environmental contaminants, drugs, and other nutrients (Rapoport et al., 2007; Rapoport, 2008).
The human body can synthesize EPA and DHA from α-linolenic acid (see review by Brenna,
2002). However, it is not yet known if humans can synthesize DHA at a rate fast enough to
provide an optimal amount of this chemical to meet the demands of the developing fetal brain or
provide optimal levels of omega-3 fatty acids to protect the heart. Half-lives of DHA in critical
tissues, including brain, vary with the adequacy of the dietary supply (DeMar et al., 2004).
Wide person-to-person variability exists, especially among term and preterm infants, in the
ability to synthesize DHA (Brenna, 2002). This is an area of research at the National Institutes
of Health in the United States, as well as other parts of the world.
The fetus may be limited in the ability to form adequate DHA from precursors (Brenna, 2002)
and needs to receive pre-formed DHA through placental transfer from the mother (Spector,
2001). This is a complex topic in which research is continuing. There is not a one-for-one
increase in fetal DHA as the mother‟s DHA level is increased (Brenna, 2002; Haggerty, 2004).
Long-term DHA status of the mother can be reflected by her body stores of DHA, which may be
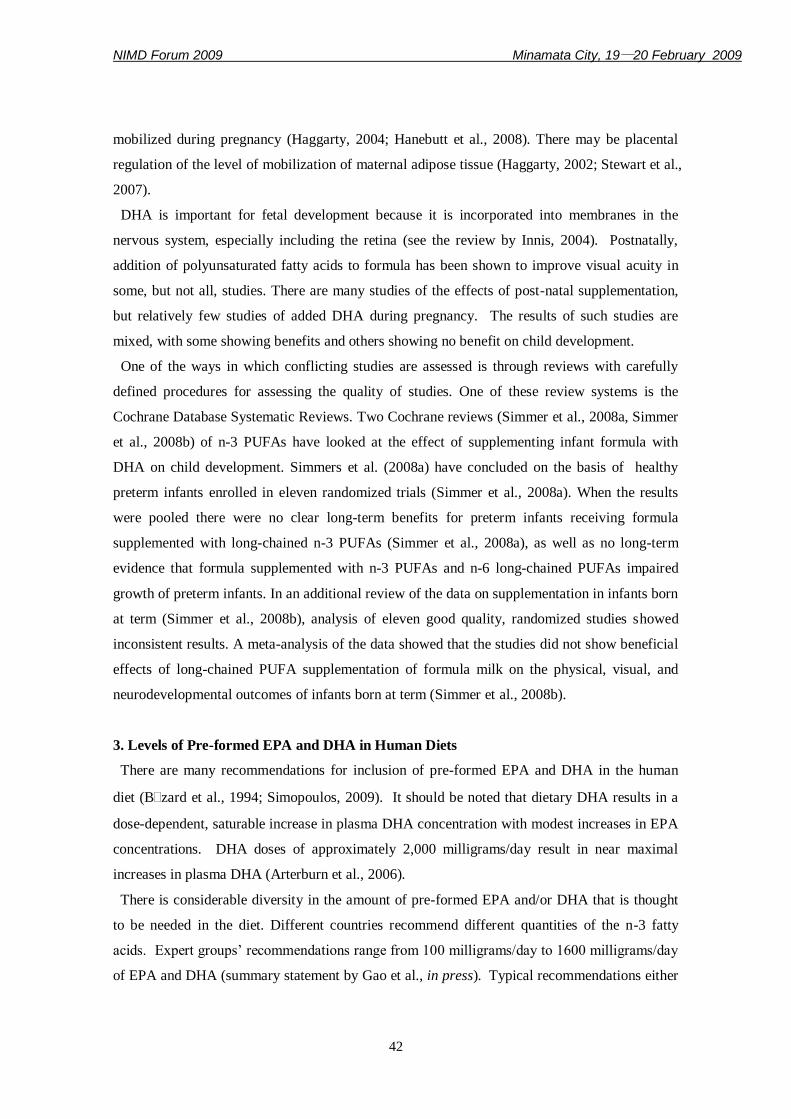
NIMD Forum 2009 Minamata City, 19―20 February 2009
42
mobilized during pregnancy (Haggarty, 2004; Hanebutt et al., 2008). There may be placental
regulation of the level of mobilization of maternal adipose tissue (Haggarty, 2002; Stewart et al.,
2007).
DHA is important for fetal development because it is incorporated into membranes in the
nervous system, especially including the retina (see the review by Innis, 2004). Postnatally,
addition of polyunsaturated fatty acids to formula has been shown to improve visual acuity in
some, but not all, studies. There are many studies of the effects of post-natal supplementation,
but relatively few studies of added DHA during pregnancy. The results of such studies are
mixed, with some showing benefits and others showing no benefit on child development.
One of the ways in which conflicting studies are assessed is through reviews with carefully
defined procedures for assessing the quality of studies. One of these review systems is the
Cochrane Database Systematic Reviews. Two Cochrane reviews (Simmer et al., 2008a, Simmer
et al., 2008b) of n-3 PUFAs have looked at the effect of supplementing infant formula with
DHA on child development. Simmers et al. (2008a) have concluded on the basis of healthy
preterm infants enrolled in eleven randomized trials (Simmer et al., 2008a). When the results
were pooled there were no clear long-term benefits for preterm infants receiving formula
supplemented with long-chained n-3 PUFAs (Simmer et al., 2008a), as well as no long-term
evidence that formula supplemented with n-3 PUFAs and n-6 long-chained PUFAs impaired
growth of preterm infants. In an additional review of the data on supplementation in infants born
at term (Simmer et al., 2008b), analysis of eleven good quality, randomized studies showed
inconsistent results. A meta-analysis of the data showed that the studies did not show beneficial
effects of long-chained PUFA supplementation of formula milk on the physical, visual, and
neurodevelopmental outcomes of infants born at term (Simmer et al., 2008b).
3. Levels of Pre-formed EPA and DHA in Human Diets
There are many recommendations for inclusion of pre-formed EPA and DHA in the human
diet (Bzard et al., 1994; Simopoulos, 2009). It should be noted that dietary DHA results in a
dose-dependent, saturable increase in plasma DHA concentration with modest increases in EPA
concentrations. DHA doses of approximately 2,000 milligrams/day result in near maximal
increases in plasma DHA (Arterburn et al., 2006).
There is considerable diversity in the amount of pre-formed EPA and/or DHA that is thought
to be needed in the diet. Different countries recommend different quantities of the n-3 fatty
acids. Expert groups‟ recommendations range from 100 milligrams/day to 1600 milligrams/day
of EPA and DHA (summary statement by Gao et al., in press). Typical recommendations either
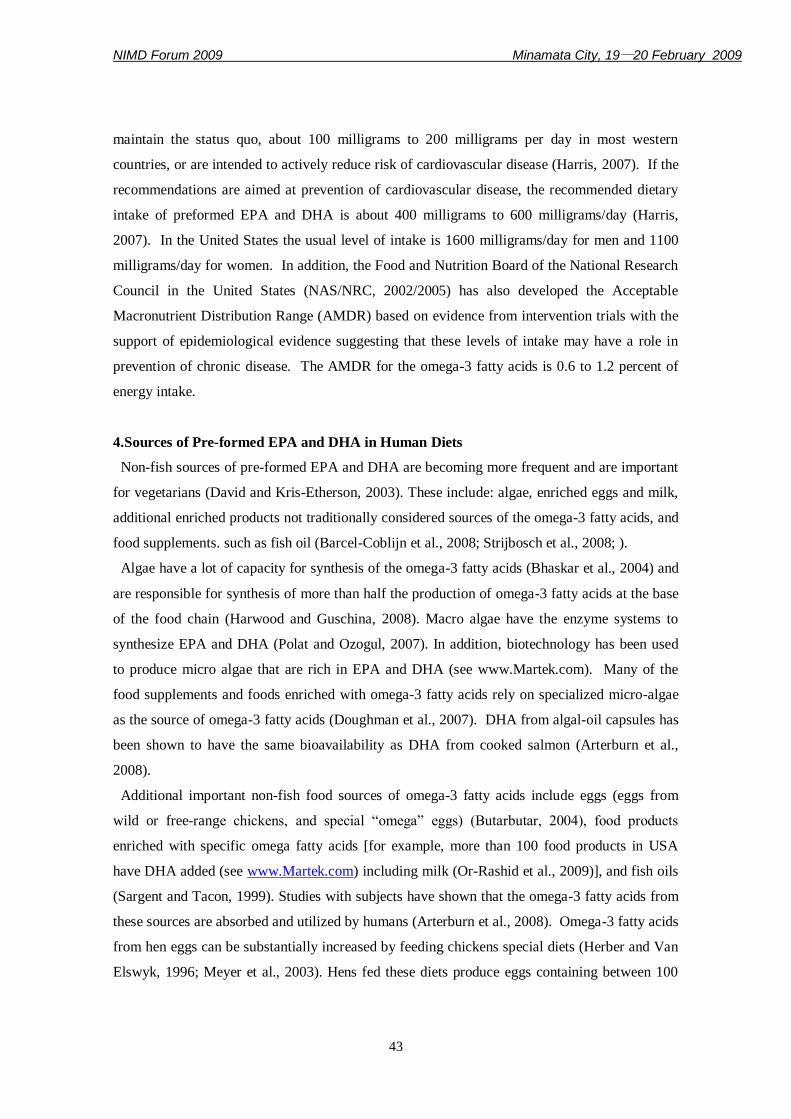
NIMD Forum 2009 Minamata City, 19―20 February 2009
43
maintain the status quo, about 100 milligrams to 200 milligrams per day in most western
countries, or are intended to actively reduce risk of cardiovascular disease (Harris, 2007). If the
recommendations are aimed at prevention of cardiovascular disease, the recommended dietary
intake of preformed EPA and DHA is about 400 milligrams to 600 milligrams/day (Harris,
2007). In the United States the usual level of intake is 1600 milligrams/day for men and 1100
milligrams/day for women. In addition, the Food and Nutrition Board of the National Research
Council in the United States (NAS/NRC, 2002/2005) has also developed the Acceptable
Macronutrient Distribution Range (AMDR) based on evidence from intervention trials with the
support of epidemiological evidence suggesting that these levels of intake may have a role in
prevention of chronic disease. The AMDR for the omega-3 fatty acids is 0.6 to 1.2 percent of
energy intake.
4.Sources of Pre-formed EPA and DHA in Human Diets
Non-fish sources of pre-formed EPA and DHA are becoming more frequent and are important
for vegetarians (David and Kris-Etherson, 2003). These include: algae, enriched eggs and milk,
additional enriched products not traditionally considered sources of the omega-3 fatty acids, and
food supplements. such as fish oil (Barcel-Coblijn et al., 2008; Strijbosch et al., 2008; ).
Algae have a lot of capacity for synthesis of the omega-3 fatty acids (Bhaskar et al., 2004) and
are responsible for synthesis of more than half the production of omega-3 fatty acids at the base
of the food chain (Harwood and Guschina, 2008). Macro algae have the enzyme systems to
synthesize EPA and DHA (Polat and Ozogul, 2007). In addition, biotechnology has been used
to produce micro algae that are rich in EPA and DHA (see www.Martek.com). Many of the
food supplements and foods enriched with omega-3 fatty acids rely on specialized micro-algae
as the source of omega-3 fatty acids (Doughman et al., 2007). DHA from algal-oil capsules has
been shown to have the same bioavailability as DHA from cooked salmon (Arterburn et al.,
2008).
Additional important non-fish food sources of omega-3 fatty acids include eggs (eggs from
wild or free-range chickens, and special “omega” eggs) (Butarbutar, 2004), food products
enriched with specific omega fatty acids [for example, more than 100 food products in USA
have DHA added (see www.Martek.com) including milk (Or-Rashid et al., 2009)], and fish oils
(Sargent and Tacon, 1999). Studies with subjects have shown that the omega-3 fatty acids from
these sources are absorbed and utilized by humans (Arterburn et al., 2008). Omega-3 fatty acids
from hen eggs can be substantially increased by feeding chickens special diets (Herber and Van
Elswyk, 1996; Meyer et al., 2003). Hens fed these diets produce eggs containing between 100
NIMD Forum 2009 Minamata City, 19―20 February 2009
44
milligrams to more than 500 milligrams of the omega-3 fatty acids per 50 gram egg. It is also
known that free-range or non-caged chickens often obtain diets that increase the omega-3
content of their eggs. Consequently specialized chicken-raising procedures (e.g., feeding
poultry specialized diets) are not necessarily required to increase the omega-3 content of the
eggs. Poultry meat may also be a source of omega-3 fatty acids (Simonpoulos, 2000).
5. Fish and Shellfish
Globally, the most commonly consumed sources of omega-3 fatty acids are fish, shellfish, and
marine mammals which obtain them from algae that can make these fatty acids. The quantity of
omega-3 fatty acids in fish varies greatly between fish species (Mahaffey et al., 2004; NRC-US,
2006, Weaver et al., 2008; Chung et al., 2008; Ozogul et al., 2008; Osman et al., 2007).
Estimated intakes of omega-3s (EPA and DHA combined) from individual fish/shellfish species
vary greatly in the amounts of both fatty acids (Sidhu, 2003; Mahaffey, 2004; NAS/NRC, 2006;
Domingo, 2007). The fat content of specific fish species is moderately predictive of the omega-
3 content with certain fatty fish species (especially salmon, mackerel, sardines, herring) being
high in omega-3 fatty acids. However, other species that are low in fat (especially shrimp and
trout) are also good sources of omega-3 fatty acids. Table 1 provides a summary of the omega-
3 levels in various fish species.
Weaver et al., (2008) evaluated the species most commonly consumed in North America and
grouped species into those providing n-3 fatty acids in amounts of more than 500 milligrams,
between 150 and 500 milligrams, or less than 150 milligrams
per 100 grams of fish consumed. Fish species that provided the highest levels of n-3 fatty acids
were sockeye salmon, farmed trout, farmed salmon, Copper River salmon, Coho salmon,
brozini, and toothfish. Species providing the lowest amounts of n-3 fatty acids were mahi-mahi,
skate, triggerfish, monkfish, red snapper, wahoo, grouper, corvina, and tuna. Species
intermediate in n-3 fatty acids are: haddock, cod, halibut, sole, flounder, crustacea, perch, black
bass, tilapia, and swordfish. These groups reflect only their omega-3 fatty acid content, not the
mercury concentrations present.
The Japanese diet is relatively low in fat with an average intake of approximately 60
grams/day or 26% of energy (Sugano and Hirahara, 2000). The intake of n-3 polyunsaturated
fatty acids (PUFAs) is reported to be approximately 3,000 milligrams /day/capita (Sugano and
Hirahara, 2000). In Japan fish, shellfish, and edible fats and oils are the most important source
of n-3 PUFAs. The species providing the most PUFAs are horse mackerels, sardines, and tuna
(Sugano and Hirahara, 2000). These investigators indicate that fish intake in Japan has declined
NIMD Forum 2009 Minamata City, 19―20 February 2009
45
especially among younger people. They also indicate that fish from cultured or farmed sources
is increasing whereas consumption of wild fish is decreasing.
6. Methylmercury and Child Development
High exposures to methylmercury have produced severe damage to the fetal nervous system
(Tsubaki and Irukyama, 1977; Bakir et al., 1973). In addition to the effects of exposures to
high-levels of methylmercury, a number of prospective epidemiological studies of lower
exposures to methylmercury have been conducted in a number of countries including the
Seychelle Islands, the Faroe Islands, New Zealand, the United States, Italy, and Japan.
The studies from the Faroe Islands, the Seychelle Islands and New Zealand were used by the
United States National Academy of Sciences (2000) and United States Environmental
Protection Agency (Rice et al., 2001) to develop a Reference Dose for methylmercury. This
dose is 0.1 microgram per kilogram body weight per day. There have been additional
evaluations of the amounts of methylmercury that produce adverse health effects have been
developed by various organizations, including the World Health Organization/Food and
Agriculture Organization (these were summarized by Mergler et al., 2007).
The major differences between various government assessments are not their estimates of the
amount of methylmercury producing adverse effects. The differences are mainly in the amount
of exposure considered to be without adverse effects. The magnitude of the factor used to
extrapolate from exposures known to produce effects to exposures thought to be safe for a
country varies from one assessment of the risks of methylmercury to another. Components of
these factors are differences in the distribution of methylmercury within the body and
differences in susceptibility of individuals to methylmercury. These factors influencing the
distribution of methylmercury within body tissues and susceptibility of various organs to
methylmercury include genetic differences and dietary factors.
7. Association between Omega-3 Fatty Acids and Methylmercury Exposure
Among the reports on effects of diet on child development are studies that have used general
measures of fish consumption (for example, Daniels et al., 2004; Hibbeln et al., 2007) or include
direct measurements of methylmercury exposure, as well as estimates of fish consumption
(Daniels et al., 2004; Oken et al., 2008; Jedrychowski et al., 2006 and 2007; Lederman et al.,
2008; Davidson et al., 2008). Some of these reports indicate that methylmercury exposure
shows adverse effects on child development (e.g., Oken et al., 2008; Lederman et al., 2008) and
that increases in fish consumption benefit indices of child development (e.g., Daniels et al.,
NIMD Forum 2009 Minamata City, 19―20 February 2009
46
2004; Oken et al., 2008; Lederman et al., 2008). Increases in the association between mercury
exposure and poorer scores on indices of child development were observed after adjustment for
fish intake (e.g., Oken et al., 2008; Lederman et al., 2008). It is important to note that the
exposures to mercury studied by Oken et al., (2008) and by Lederman et al. (2008) were at the
relatively low end of mercury exposures when compared to populations who routinely consume
fish as a major part of their diet.
8. Complexity of the Association between Methylmercury Exposure and Dietary Sources
of the Omega-3 Fatty Acids
Both omega-3 fatty acids and methylmercury are contained in fish and shellfish. However,
fish species contain widely different quantities of omega-3 fatty acids and methylmercury.
Some fish species are high in omega-3 fatty acids and others are high in methylmercury
(Mahaffey, 2004; Sakomoto et al., 2004; Philibert et al., 2006; Mahaffey et al., 2008; Domingo,
2007). The amount of methylmercury in fish increases with the trophic level of the
fish/shellfish species. By contrast, the pattern of omega-3 fatty acids is not dependent on the
tropic level of the fish species. For example, Kainz et al. (2006) demonstrated that although
methylmercury concentrations increase steadily with body size in both plankton and fish, the
essentially fatty acids show irregular retention patterns at different trophic levels. Although
both EPA and methylmercury generally increase at higher trophic levels in the planktonic food
web, the magnitude of bioaccumulation is much greater for methylmercury compared with EPA.
This is because aquatic organisms retain the essential fatty acids at lower rates than they retain
methylmercury (Kainz et al., 2006).
The relationship differs for DHA and methylmercury accumulation. Although EPA and
methylmercury increase along the planktonic food web, methylmercury bioaccumulates at
higher rates than does EPA (Kainz et al., 2006). By contrast, DHA primarily found in
phospholipids of cell membranes, is retained differently than EPA with respect to
methylmercury (Kainz et al., 2006). Retention of dietary DHA is determined by the taxonomic
composition of the planktonic food web and independent of DHA requirements. This variability
in comparative rates of bioaccumulation for methylmercury, for EPA, and for DHA, helps to
explain divergent patterns of these chemicals in individual fish species.
Data on the association between blood mercury concentration and fish consumption also help
to understand food sources of omega-3 fatty acids and methylmercury. As an example, data
from the United States evaluating blood mercury concentrations among women of child-bearing
age showed that there was a moderate correlation between total fish intake and blood organic
NIMD Forum 2009 Minamata City, 19―20 February 2009
47
mercury concentration (Mahaffey et al., 2008). There is not a consistent association between the
quantity of methylmercury in a particular fish and/or shellfish species and the amount of omega-
3 fatty acids present in the fish or shellfish species (Mahaffey, 2004; US NAS/NRC, 2006). The
ratio of omega-3 fatty acids to methylmercury intake depended on the species of fish consumed
(Mahaffey et al., 2008).
Many of the studies of child-development have relied on frequency of fish consumption to
estimate (1) total fish intake or (2) fish intake by category such as fatty fish. One of the
limitations of this approach is that the size of the fish serving may be small (e.g., 30 grams) or
medium (e.g., 180 to 250 grams) making it difficult to quantitate exposures. Another limitation
is that many of these studies have not reported which species of fish are eaten by the people
participating in the study. The limited information in such studies of child-development makes
it difficult to know the intake of omega-3 fatty acids or methylmercury. Absent biological
monitoring of either exposure (e.g., blood or hair mercury concentrations), and blood levels of
the omega-3 fatty acids, it is hard to draw conclusions based on estimates of total fish intake
rather than intake of specific fish species.
Constituents of fish may attenuate the adverse effects of methylmercury in an exposure range
that is yet to be clarified. There is also the issue of negative confounding in the evaluation of
methylmercury toxicity (Budtz-Jergensen et al., 2007; Choi et al, 2008). The risks of
methylmercury neurotoxicity and the benefits of fish consumption can be underestimated if
there are inadequate confounder adjustment and imprecision of exposure estimates (Choi et al.,
2008).
9. Conclusions
Much more information is needed on quantities of the omega-3 fatty acids (EPA, and
especially DHA) that can be synthesized from α-linolenic acid through women‟s metabolism.
Although there have been several studies of the association between fish intake and child
development, a number of the recent studies have been carried out at exposure levels that are
relatively low compared with cultures that routinely rely on fish as a major dietary staple.
Nonetheless, several of the studies show effects associated with methylmercury exposure as
well as benefits of fish consumption.
Fortunately, the ratio of omega-3 fatty acids and methylmercury concentration within
individual fish and shellfish species varies considerably (Mahaffey, 2004; NAS/NRC, 2006;
Domingo, 2007). It is possible to chose fish species that are both high in omega-3 fatty acids
and low in mercury. Although methylmercury exposure is closely linked with the amount and
NIMD Forum 2009 Minamata City, 19―20 February 2009
48
species of fish eaten, there are non-fish sources of the omega-3 fatty acids. These include:
algae, marine oils, products enriched with specific omega-3 fatty acids, and various meat and
poultry products from animals fed diets that provide nutrients from diverse sources. None of
these sources have high levels of methylmercury.
Fish and shellfish provide most of the preformed omega-3 fatty acids in the diet for most
countries. A diet that enough omega-3 fatty acids, but avoids methylmercury from fish remains
a goal. The solution requires dietary strategies, public health communication, and pollution
control.
References
Arterburn LM, Hall EB, Oken H. 2006. Am J Clin Nutr 83(suppl):1467S-1476S.
Arterburn LM, Oken HA, Hoffman JP, et al. 2007. Lipids 42:1011-24.
Arterburn LM, Oken HA, Hall EB, et al. 2008. J Am Diet Assoc 108:1204-1209.
Bakir, F., Damluji, SF, Amin-Zaki I, et al. 1973. Science 180:230-241.
Barcel-Coblijin G, Murphy EJ, Othman R, et al. 2008. Am J Clin Nutr 88:801-809.
Bzard J, Blond JP, Bernard A, Clouet P. 1994. Reprod Nutr Dev 34:539-68.
Bhaskar N, Kinami T, Miyashita K, et al. 2004. Z Naturforsch [C] 59:310-314.
Bourre JM. 2007. Biomedicine Pharmacothera 61:105-112.
Brenna JT. Curr Opin Clin Nutr Metab Care 5:127-132.
Budtz-Jergensen E, Grandjean P, Weihe P. 2007. Environ Health Perspect 115:323-327.
Burdge GC, Calder PC. 2005. Reprod Nutr Dev 45:581-597.
Burger J. 2008. Environ Res 108:107-116.
Burger J, Gochfeld M. 2009. Environ Res, in press.
Butarbutar TB. Southeast Asian J Trop Med Pub Health 35:1036-1038.
Chateau-Degat ML. 2005. Neurological signs of ciguatera disease: evidence of their
persistency. In: Portrait Epidmiologique de la Ciguetere dans le Pacifique-sud (PhD Thesis).
Quebec, Canada: Laval University.
Choi AL, Cordier S, Weihe P, Grandjean P. 2008. Crit Rev Toxicol 38:877-893.
Chung H, Nettleton JA, Lemaitre RN, et al., 2008. J Nutr 138:2422-2427.
Daniels JL, Longnecker MP, Rowland AS, et al. 2004. Epidemiology 15: 3394-402.
Davidson PW, Strain JJ, Myers GJ et al. 2008. NeuroToxicology 29:767-775.
Davis BC, Kris-Etherton. 2003. Am J Clin Nutr 78 (suppl): 640S-646S.
NIMD Forum 2009 Minamata City, 19―20 February 2009
49
DeMar JC Jr, Ma K, Bell JM, Rapoport SI. 2004. J Neurochem 91:1125-1137.
Dewailley E, Suhas E, Mou Y, et al. 2008. Asia Pac J Clin Nutr 17:461-470.
Domingo JL. 2007. Environment Internatl 33:993-998.
Doughman SD, Krupanidhi S, Sanjeevi CB. 2007. Curr Diabetes Rev 3:198-203.
Extier A, Langelier B, Perruchot MH, et al. 2009. J Nutr Biochem in press.
Fok TF, Lam HS, Hg PC, et al. 2007. Environ Int 33:84-92.
Gao F, Kiesewetter D, Chang L, et al. In press.
German JB, Roberts MA, Watkins SM. 2003. J Nutr 133:2078S-2083S.
Ginsberg GL, Toal BF. 2009. Environ Health Perspect 117:267-275.
Haggerty P. 2002. Placenta 23 Supp A:528-538.
Haggerty P. 2004. Eur J Clin Nutr 58:1559-1570.
Hanebutt FL, Demmelmair H, Schiessl B, et al. 2008 Clin Nutr 27:685-693.
Harris WS. 2007. J Cardiovasc Med (Hagerstown) 8 (suppl 1):550-552.
Harwood JL, Guschina IA. 2009. Biochimie. In press.
Hibbeln JR, David JM, Steer C, et al. 2007. Lancet 369(9561):578-585.
Hsu CS, Liu PL, Chen LC, et al. 2007. BJOG 114: 81-85.
Igarashi M, Ma K, Chang L, et al. 2007. J Lipid Res 48:2463-2470.
Igarashi M, DeMar JC, Ma Kaizong, et al. 2007. J Lipid Res 48:1150-1158.
Innis SM. 2004. Adv Exp Med Biol 554:27-43.
Ip P, Wong V, Ho M, et al. 2004. Pediatr Int. 46:715-721.
Jedrychowski W, Jankowski J, Flak E, et al. 2006. Ann Epidemiol 16:439-447.
Kainz M, Telmer K, Mazumder A. 2006. Sci Total Environ 368:271-282.
Kim SA, Jeon CK, Paek DM. 2009. Sci Total Environ 402:36-42.
Kumar M, Aalsberg B, Mosley L. 2006. Mercury levels in Fijian seafood and potential health
implications. Report for the World Health Organization. Suva, Fiji. Fiji Islands Institute of
Applied Sciences.
Lederman SA, Jones RL, Caldwell KL. et al. 2008. Environ Health Perspect 116:1085-1091.
Mahaffey KR. 2004. Environ Res 95:414-428.
Mahaffey KR, Clickner RP, Jeffries RA. 2008. Environ Res 107:20-29.
Mahaffey KR, Clickner RP, Jeffries RA. 2009. Environ Health Perspect 117:47-53.
Mergler D, Anderson HA, Chan, et al., 2007 Ambio 36:3-11.
Moghadasian MH. 2008. Crit Rev Food Sci Nutr 48:402-410.
Murata K, Dakeishi M, Shimada M Satoh H. 2007. Tohoku J Exp Med 213:187-202.
Nakai K, Suzuki K, Oka T, et al.. 2004. Tohoku J Exp Med 202:227-237.
NIMD Forum 2009 Minamata City, 19―20 February 2009
50
National Academy of Sciences/National Research Council. Committee on Toxicological Effects
of Methylmercury. 2000. Effects of Methylmercury. National Academy Press, Washington D.C.
National Academy of Sciences/National Research Council. 2005. Dietary Reference Intakes
for Energy, Carbohydrate, Fiber, Fat, Fatty Acids, Cholesterol, Protein, and Amino Acids
(Marconutrients). National Academy Press, Washington D.C.
National Academy of Sciences/National Research Council. 2006. Seafood Choices: Balancing
Benefits and Risks. National Academy Press. Washington D.C.
Oken E, Radesky JS, Wright RO, et al., 2008. 167:1171-1181.
Osman F, Jaswir I, Khaza‟ai H, Hashim R. 2007. J Oleo Sci 56:107-113.
Or-Rashid MM, Odongo NE, Wright TC, McBride BW. 2009. J Agric Food Chem, in press.
Ozogul Y, Ozogul F, Cicek E, et al. 2008. Int J Food Sci Nutr 29:1-12.
Philibert A, Vanier C, Abdelouahah, et al. 2006. Am J Clin Nutr 84:1299-1307.
Pirrone N, Mahaffey KR. (Editors) Dynamics of Mercury Pollution on Regional and Global
Scales. Springer Press. 2005.
Polat S, Ozogul Y. 2007. Int J Food Sci Nutr 12:1-7.
Raccine R, Deckelbaum. 2007. Curr Opin Clin Nutr Metab Care 10:123-128.
Rapoport SI, Rao JS, Igarashi M. 2007. Prostaglandins Leukot Essent Fatty Acids. 77:251-261.
Rapoport SI. 2008. Prostaglandins Leukot Essent Fatty Acids 79:153-156.
Rapoport SI, Rao J, Igarashi M. 2007. Prostglandins Leukotrienes Essent Fatty Acids 77:251-
261.
Rice DC, Schoeny R, Mahaffey K. 2003. Risk Anal. 23: 107- .
Sargent JR, Tacon AG. 1999. Proc Nutr Soc 58:377-383.
Sidhu KS. 2003. Reg Toxicol Pharmacol 38:336-344.
Simmer K, Schulzke SM, Patoie S. 2008a. Cochrane Database Syst Rev 23: CD000375.
Simmer K, Patole SK, Rao SC. 2008 b. Cochrane Database Syst Rev 23:CD000376.
Simopoulos AP. 2000. Poultry Sci 79:961-970.
Simopoulos AP. 2009. World Rev Nutr Diet 99:1-16.
Spector AA. 2001. J Mol Neurosci 16:159-165.
Stewart F, Rodie VA, Ramsay JE, et al. 2007. Lipids 42:335-344.
Strijbosch RA, Lee S, Arsenault DA, et al. 2008. Metabolism 57:698-707.
Sugano M, Hirahara F. 2000. Is J Clin Nutr 71(suppl):189S-196S.
Wakai K. 2009. J Epidemiol 19:1-11.
Weaver KL, Ivester P, Chilton JA, et al. 2008. J Am Diet Assoc 108:1178-1185.
Tsubaki T, Inkyama K (Eds.), 1977. Minamata Disease. Elsevier Press. Amsterdam.
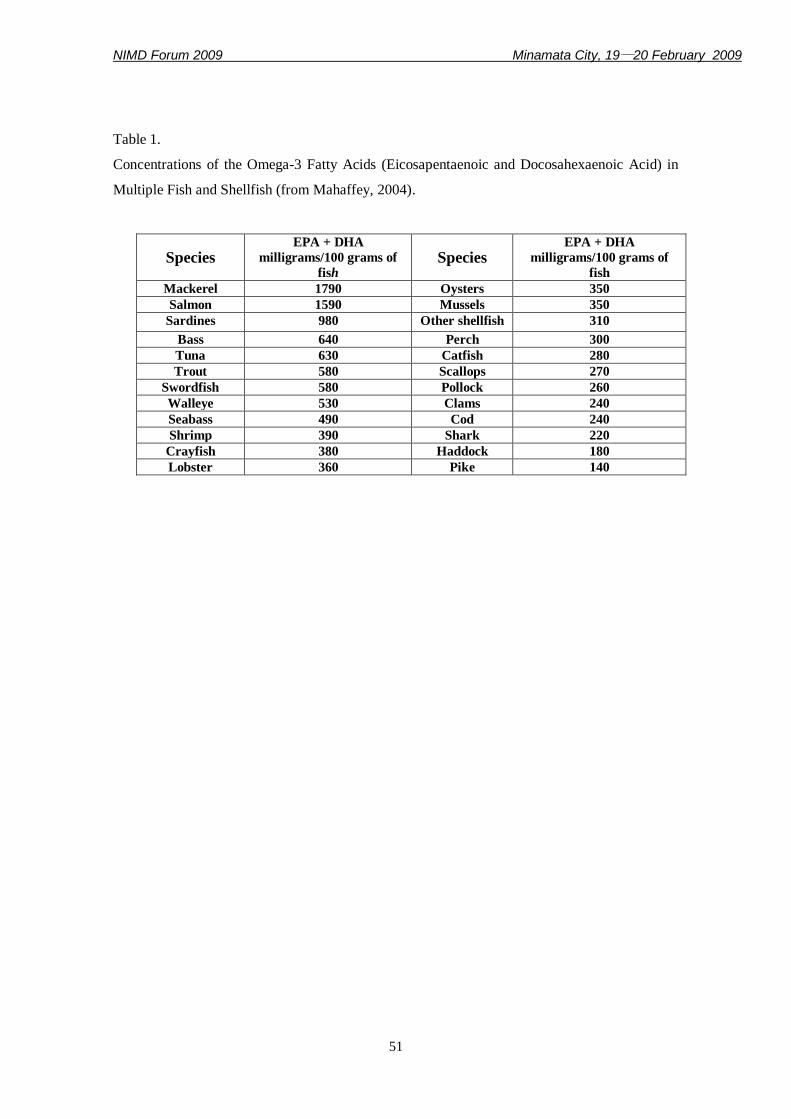
NIMD Forum 2009 Minamata City, 19―20 February 2009
51
Table 1.
Concentrations of the Omega-3 Fatty Acids (Eicosapentaenoic and Docosahexaenoic Acid) in
Multiple Fish and Shellfish (from Mahaffey, 2004).
Species EPA + DHA
milligrams/100 grams of
fish Species
EPA + DHA
milligrams/100 grams of
fish
Mackerel 1790 Oysters 350
Salmon 1590 Mussels 350
Sardines 980 Other shellfish 310
Bass 640 Perch 300
Tuna 630 Catfish 280
Trout 580 Scallops 270
Swordfish 580 Pollock 260
Walleye 530 Clams 240
Seabass 490 Cod 240
Shrimp 390 Shark 220
Crayfish 380 Haddock 180
Lobster 360 Pike 140
NIMD Forum 2009 Minamata City, 19―20 February 2009
52
Potential contamination of mercury from artisanal gold mining
in the Talawaan watershed area, north Sulawesi, Indonesia
Markus T. Lasuta*
& Yoshiaki Yasudab
a Faculty of Fisheries and Marine Science, Sam Ratulangi University, Manado, North Sulawesi,
Indonesia b Natural Sciences Section, National Institute for Minamata Disease, Minamata City, Kumamoto,
Japan
Abstract
Mercury (Hg) discharge through the artisanal gold mining activities is one of the
environmental concerns due to its emission that may follows natural methylation of
mercury to result environmental contamination with an impact in human health. To assess
potential impact of Hg emitted from such activities, sampling was carried out in a
watershed area of Talawaan, north Sulawesi, Indonesia, where that type of mining are
widely occurred. Sediment and biota were collected in riverine system, while human hairs
were collected from the residents living in the remote area. Total mercury (THg) and
methyl mercury (MeHg) were measured in each of the samples. The results showed that
THg and MeHg were found in all samples. In sediments, the THg concentration mostly
decreased with distance from the mining area. Ratio between THg-MeHg in sediment was
0.0035. Accordingly, since there is no anthropogenic source of MeHg in the area,
methylation process of Hg was occurred along the riverine system. Methyl mercury was
found in the human hair samples in various levels higher than the control value. Since the
residents consumed fish from the river daily, mercury impact may potentially occur.
Keywords: methyl mercury, artisanal gold mining, north Sulawesi, Indonesia
1. Introduction
Artisanal gold mining activity in small-scale is mostly conducted by communities with the
primitive techniques and equipments to recover gold. It spreads widely in developing countries
(Ogola et al., 2002; de Lacerda, 2003), including Indonesia, such as in north Sulawesi (James,
1994; Kambey et al., 2001; Limbong et al., 2003). However, in contradiction, as it practically
uses an amalgam technique using Hg to recover gold, it is one of the major environmental
concerns of Hg sources (de Lacerda and Salomons, 1998; Kambey et al., 2001; Ogola et al.,
2002; de Lacerda, 2003; Limbong et al., 2003). In north Sulawesi, approximately 200 tons of
NIMD Forum 2009 Minamata City, 19―20 February 2009
53
Hg is used annually in regard to this purpose (Kambey et al., 2001). Forty to 50% of the Hg
used in amalgamation is estimated to be lost into rivers during the process as metallic Hg, and
other (5 to 10%) Hg is lost into environment during the recovery of gold from Hg amalgam.
Further estimation is approximately 1.32 kg loss of Hg for 1 kg gold production (Pfeiffer and
Lacerda, 1988 cf de Lacerda and Salomons, 1998).
The objective of the present study is to assess potential contamination of Hg emitted from an
artisanal gold mining area to the water-receiving area of Talawaan watershed by analyzing
present concentrations and spatial distribution of total Hg (THg) and methyl Hg (MeHg) in
sediments and biota, including in human scalp hairs, then discussing potential impacts on
human health.
2. Subjects and Methods
Talawaan watershed covers an area of 34,000 ha. In 2004, artisanal gold mining activities
cover an area of 822 ha at upper land are of the watershed in 8 villages (Wasian, Tatelu,
Tatelu Rondor, Tatelu Warukapas, Talawaan, Kolongan, Tetey, and Mapanget) of north
Sulawesi, in which about 2500 to 3000 miners involved (Lingkubi, 2004). The main river of
Talawaan (TR), and the other two rivers [Kima (KR) and Bailang (BR)], are flowing through
the watershed from the upper land area (artisanal gold mining area) to the beach. The rivers are
used by the communities for daily activities (bathing, washing, and fishery).
Sampling was carried out along the three rivers (TR, KR, and BR). Stations were set at each
of the rivers based on the distance from the mining area. Sediment and biota (snails, crabs, and
fish) were collected at each station, while human hairs were collected from the residents living
in an area remote but closely related to the riverine system of TR. Total mercury (THg) and
methyl mercury (MeHg) were measured in each of the samples. While THg was measured
using mercury analyzer, the MeHg was measured by a gas chromatograph with ECD detector
after extracted by dithizone-sodium sulfide extraction method.
3. Results and Discussion
THg was detected in all samples that varied within sampling sites and sample types. The
concentrations in the TR sediment varied following the sites from 0.078 to 1.137 ppm. The
highest concentration was at the mining area and the lowest was at the river mouth. The
mercury concentration decreased with distance from the mining area. The same pattern was
also observed in the KR where the highest concentration (0.099 ppm) was found at the sites
close to the mining area and the lowest one (0.022 ppm) was at the river mouth. In BR, the
situation was somewhat different that the highest THg concentration (0.176 ppm) was found in
NIMD Forum 2009 Minamata City, 19―20 February 2009
54
the several hundred meters inside area of the river mouth with a thick precipitation of sediment
and the lowest (0.009 ppm) was at just the river mouth.
The variation of the THg concentration in sediment showed in the sampling area was due
mainly to an introduction of Hg from other source which mainly from anthropogenic one, as
introduction of anthropogenic source of Hg may elevate its natural concentration (Yasuda,
2000). Hg discharged from amalgamation in the artisanal gold mining area is in an elemental
form through the canals and rivers.
THg was also found in the biota samples in various levels based on the species. Source of the
Hg is mostly from sediment where it plays a key role in controlling the metal concentrations in
biota (Blanchette., 2001).
MeHg was found in all sediment samples in the ratio of THg-MeHg as 0.0035. It was also
found in all samples of the biota. Accordingly, since there is no anthropogenic source of MeHg
in the area, methylation process of Hg was occurred in sediment along the riverine system.
Moreover, through food webs where bioaccumulation occurred, the concentration of the
methylated Hg is increased and magnified (Lasut & Yasuda, 2008).
MeHg was also found in the human hair samples in various levels higher than the control
value. Hg methylation generally increases its toxicity as a result of its enhanced penetration
through lipid membranes (Bustamante et al., 2006) of organisms and human. Since the residents
consumed fish from the river daily, mercury impact may potentially occur.
References
Blanchette, M. C., Hynes, T. P., Kwong, Y. T. J., Anderson, M. R., Veinott, G., Payne, J. F.,
Stirling, C., & Sylvester, P. J. (2001). A chemical and ecotoxicological assessment of the
impact of marine tailings disposal. Tailings and Mine Waste „01. Balkema, Rotterdam, pp.
323-331.
Bustamante, P., Lahaye, V., Durnez, C., Churlaud, C., & Caurant, F. 2006. Total and organic
Hg concentrations in cephalopods from the North Eastern Atlantic waters: Influence of
geographical origin and feeding ecology. Science of the Total Environment, 368, 585-596.
de Lacerda, L. D., Salomons, W. 1998. Mercury from gold and silver mining: a chemical time
bomb? Springer-Verlag, Berlin, 146 pp.
de Lacerda, L. D. 2003. Updating global Hg emissions from small-scale gold mining and
assessing its environmental impacts. Environmental Geology 43, 308-314.
NIMD Forum 2009 Minamata City, 19―20 February 2009
55
James, L. P. 1994. The mercury “tromol” mill: an innovative gold recovery technique, and a
possible environmental concern. Journal of Geochemical Exploration 50, 493-500.
Kambey, J. L., Farrell, A. P., Bendell-Young, L. I. 2001. Influence of illegal gold mining on
mercury levels
in fish of North Sulawesi‟s Minahasa Peninsula (Indonesia). Environmental Pollution
114, 299-302.
Lasut, M. T., Yasuda, Y. 2008. Accumulation of mercury in marine biota of Buyat Bay, north
Sulawesi, Indonesia. Coastal Marine Science 32(1), 33-38.
Limbong, D., Kumampung, J., Rimper, J., Arai, T., Miyazaki, N. 2003. Emission and
environmental implications of mercury from artisanal gold mining in north Sulawesi,
Indonesia. Science of the Total Environment 302, 227-236.
Lingkubi, O. 2004. Upaya pemerintah dalam mengatasi dampak pencemaran pertambangan
di Kecamatan Dimembe [Eng: government actions to overcome pollution impacts from
artisanal gold mining activities
in Dimembe]. Makalah. Pemerintah Kabupaten Minahasa Utara.
Ogola, J. S., Mitullah, W. V., Omulo, M. A. 2002. Impact of gold mining on the
environmenta and human health: a case study in the Migori Gold Belt, Kenya.
Environmental Geochemistry & Health 24, 141-158.
Yasuda, Y. 2000. Minamata Bay. In: Okada M, Peterson SA, editors. Water Pollution Control
Policy and Management: The Japanese Experience. Chapter 13. Gyosei Ltd., Tokyo.
NIMD Forum 2009 Minamata City, 19―20 February 2009
56
Mercury in hair as a diagnostic indicator of exposure
to the metal in a coastal population in Venezuela
Rojas Maritza (1,3)
, Nakamura Kunihiko (2)
Seijas David (3)
, Squillante G(3)
,
Pieters Maria Alejandra (3)
, Infante Saba (4)
. (1): MRM-CONSULTOX, Valencia, Venezuela;
(2): National Institute for Minamata disease. Minamata, Japan;
(3): Center for Toxicological Investigations of the University of Carabobo (CITUC).
Calle 144 No. Río-211, La Ceiba. Valencia, Venezuela;
(4): Science and Technology School (FACYT). University of Carabobo, Valencia, Venezuela.
(1): Postal address: Calle Urano 91-20 Trigal Norte. Valencia, Venezuela. Tel. 58-241-8430004.
E mail: [email protected]
Abstract
Total and methylmercury in hair (THg-H and MeHg-H) were determined in 160 adults to
characterize them in terms of Hg-exposure and potential risk. The study group constituted of 60
individuals living in the Central-North coast of Venezuela. Part of the area was known to be
contaminated with mercury from a chlor-alkali plant installed close to one of the tributaries‟
rivers of the Caribbean Sea. The study group was selected from 4 inclusion criteria points. The
control group was composed of 100 individuals selected from Carabobo State with no-known
exposure to Hg. A questionnaire was designed to collect demographic, health information, work
activities and fishing consumption habits. Hair samples were analyzed for THg. Samples with
THg-H > 5 ug/g were also analyzed for MeHg. The mean THg-H was 1.88 ± 1.50 and 0.99 ±
0.87 ug/g for the study and control groups, respectively. The study group was statistically higher
than control individuals, however, no statistical differences on THg-H between each of the 4
categories of the study group and control group were found. Mean MeHg-H value was 3.67 ±
1.25 ug/g. Associations were made between Hg-H and several variables. No significant relation
was noted between Hg-H levels and clinical symptoms. R analyses and t-tests were used to
examine for individual associations between questionnaire variables and THg-H. The main
predictors of THg-H levels in the study group were fish consumption and its frequency. As both
groups presented relatively low values for THg-H and MeHg-H the results of this study indicate
that Hg exposure did not exceed safe levels. However, a more in-depth exposure assessment
should be conducted to characterize more accurately this exposure, mainly in terms of water and
fish sampling for Hg content.
Key words: Mercury; exposure; mercury in hair
Short Title: Mercury exposure assessment
NIMD Forum 2009 Minamata City, 19―20 February 2009
57
Resumen
Mercurio total y metil mercurio en cabello (THg-H y MeHg-H) fueron determinados en 160
adultos para caracterizar esta población en términos de exposición a Hg y su potencial riesgo. El
grupo Estudio consistió de 60 individuos que viven en la costa Centro-Norte de Venezuela.
Parte de esta área se había reportado contaminada, años atrás, con Hg de una planta de cloro-
soda instalada junto a uno de los ríos tributarios del mar Caribe. El grupo Estudio se seleccionó
con base en 4 criterios de inclusión. El grupo Control estuvo compuesto de 100 individuos del
Estado Carabobo, sin exposición conocida a Hg. Se administró un cuestionario para obtener
información referida a: demografía, salud, actividades laborales y alimentación con pescado. Se
analizaron muestras de cabello para determinar THg. Las que resultaron superiores a 5 ug/g, se
analizaron también para MeHg. El promedio de THg-H fue de 1.88 ± 1.50 y 0.99 ± 0.87 ug/g
para los grupos estudio y control respectivamente. El grupo estudio resultó estadísticamente
superior al control, sin embargo, no se hallaron diferencias estadísticamente significantes en el
THg-H comparando cada una de las 4 categorías del grupo estudio. La media de MeHg-H fue
de 3.67 ± 1.25 ug/g. Se calcularon asociaciones entre Hg-H y algunas variables. No se encontró
una relación significativa entre los niveles de de Hg-H y los síntomas reportados. Se usaron R-
análisis y t-test y para examinar las asociaciones individuales entre las variables del
cuestionario y el THg-H. Los principales predictores de los niveles de THg-H en el grupo
estudio fueron el consumo de pescado y su frecuencia. Ya que ambos grupos estudiados
presentaron valores relativamente bajos de THg-H y MeHg-H, los resultados de este estudio
indican que la exposición a Hg no excedió los niveles permisibles. Sin embargo, se requiere una
evaluación más profunda para caracterizar, en forma más exacta esta exposición, principalmente
en lo que se refiere a determinar concentraciones de Hg en muestras de agua y de pescado en la
zona.
Palabras clave: Mercurio, exposición, mercurio en cabello.
Título corto: Evaluación de exposición a mercurio
Introduction
The major source of environmental mercury is natural degassing of the earth's crust; however,
industrial activities can expose individuals and the environment to toxic levels directly or
indirectly through the use and misuse of mercurial compounds (1).
NIMD Forum 2009 Minamata City, 19―20 February 2009
58
Several studies have indicated an association between Hg exposure diet rich in fish (2, 3, 4).
This work was done at the Puerto Cabello-Moron coastal area of Venezuela, an ideal location
for industries that require large land areas, water and marine transportation. Part of the area was
known to be contaminated with mercury because of the installation of a chlor-alkali plant in a
petrochemical complex that was close to one of the tributaries‟ rivers (called “Caño
Alpargaton”) that empties into the Caribbean Sea (5, 6). Mercury spills from these plants
between 1957-1976 produced concern in the 70 km coastal zone from Puerto Cabello to
Chichiriviche and in the National Park area. The government of Venezuela requested an
evaluation of the impact of the discharges of the major industries in that zone. The evaluation
identified some negative impacts such as high Hg levels (> 3 ppm) at the sediments of Caño
Alpargaton (6). During the following years, several potentially polluting industries were built in
the area where some of the villagers consumed fish as their main source of food intake. While
fish is a beneficial food, the primary exposure to MeHg is through consumption of fish,
considered the main contamination pathway of MeHg to human beings (7). In some of the
villages studied, fish is the primary and frequently, the only source of animal protein
Mercury exposure was evaluated by measuring the Hg content of hair. Total and methylmercury
in the hair (THg-H and MeHg-H) are useful bioindicators of long-term exposure to Hg. MeHg-
H is specific for MeHg contamination, particularly from ingestion of Hg contaminated fish,
where MeHg is easily bio-accumulated and bio-magnified and becomes concentrated in fish,
particularly, carnivorous fish (8).
Once incorporated into hair at the root, Hg remains stable while hair continues to grow at
approximately 1 cm per month. Hair represents recent and historical exposures while blood Hg
content would reflect only recent Hg intake (9). One of the advantages of hair as a biological
sample is that the segmental analysis of strands provides the opportunity to reconstitute past
exposure history based on their growth rate (9, 10, 11). MeHg builds up in hair during its
formation and shows a good correlation with blood Hg levels. There is evidence that THg-H is
about 250 to 300 times higher than Hg in blood (7, 8). Therefore a conversion factor of 1:250
has been used to convert THg-H to Hg in whole blood (12).
The authors have updated part of the above mentioned surveillance and have investigated the
current potential Hg-contamination in a selected population of villagers in the region of Puerto
Cabello-Moron coastal area of Venezuela.
NIMD Forum 2009 Minamata City, 19―20 February 2009
59
Method
Analytical, case-control study. The Study group included 60 individuals living at the Central-
North coast of Venezuela (Falcon-Carabobo States) and was selected according to the following
criteria:
Retired individuals that worked in the petrochemical industry at the time of the
contamination (n=20);
Current petrochemical workers (n=13);
People living in a fishing village (with high fish intake, locally caught) located at 10 km
from the petrochemical industry (n=14).
People living in Puerto Cabello, a big Carabobo State port, located at 20 km from the
petrochemical industry and whose fish intake is also high (n=13).
The Control group consisted of 100 individuals (50 male; 50 female) from Valencia, Carabobo
State with no-known Hg-exposure.
A questionnaire including socio-demographic information, health history, Hg-related
signs/symptoms if presented during the last 2 years, work activities (potential Hg exposure) and
life styles was given by interview to both groups. Respondents were also asked about
consumption of fish (yes/no), type of fish and the estimated average number of times per week
they ate fish (in the past 6 months). The population was categorized according to frequency of
fish intake (1=Daily; 2= 2-5x/week; 3= 1-3x/week; 4= Do not eat fish). We did not ask about
daily average quantity of fish consumed (grams) for different meals nor the relative proportion
or size (length and weight) of different fish species consumed. The study was carried out during
the dry season of the year.
Approximately 1-g hair samples were obtained from the subjects, trimming hair close to the
scalp. Hair samples were stored in plastic bags previously identified until analyzed. Samples
were sent to Japan and both parameters were analyzed at the Laboratory of the Sciences
Institute for Minamata Disease. THg-H was determined in Study and Control groups by a
flameless atomic absorption spectrometer with a mercury analysis vaporizer (Rigaku Mercury
SP-1; Nippon Instruments Co. Ltd, Tokyo). Samples with THg-H > 5 ug/g were also analyzed
for MeHg -methods of Nakamura et al, 1999 (13) and Nakano and Miyamaoto, 2003 (14), by
atomic absorption spectrophotometry. Analytical quality control was ensured with standard hair
samples provided by the Japanese Institute for Environmental Studies and used as a control.
Volunteers were informed about the objectives of the study and confidentiality issues. Written
consent was obtained from the volunteers. They received the results of the analyses.
NIMD Forum 2009 Minamata City, 19―20 February 2009
60
Statistics:
Descriptive statistical analyses were used to illustrate socio-demographic variables and
concentrations of Hg-H and to characterize the fish diet. Mean comparisons were carried out
using the Student‟s t test. R package was used for the one-way analysis of variance (15). This
one was the most suitable model for the treatment of our data with independent categorical
variables. The proposed model used to estimate the relationship between the dependent variable
THg-H and the independent variables sex, group classification, smoking and drinking habits,
fish intake and frequency of fish intake, is the following: THg-H = μ + β1sex + β2 group classif.
+ β3 smoking habit + β4 alcohol intake + β5 fish intake + β6 frequency fish intake + ε, where
each independent variable is measured in two or more factor levels.
Results
The distribution of the study population according to group, sex, age and Hg-H values is
represented in Table 1. The study group had statistically higher THg-H values (p<0.01) than
control individuals. Only four individuals (3 male, 1 female) of the study group, had THg-H > 5
ug/g. Mean MeHg-H concentration was 3.67 ± 1.25 ug/g. Table 2 shows the distribution of the
study group according to classification and mean values of Hg-H.
Percentile distributions with mean THg-H levels for the 4 classifications in the study group are
presented in Fig 1. Fig. 2 describes box-plots showing concentrations of THg-H of the study
group based on “frequency of fish intake”. Each box shows the median, 25th and 75
th percentiles.
Fifty seven individuals in the study group (95%), referred to eat fish from nearby water bodies.
Table 3 shows their frequency of fish intakes according to groups studied and mean values of
THg-H (ug/g). Twenty nine fish species were reported. From these, the sea species most
frequently reported were: “Lisa” (Mugil sp), followed by “Pargo” (Lutjanus sp), Carite
(Scomberomorus sp) and Tuna (Thunnus sp). Twenty five species were sea fish and four were
river fish.
Table 4 shows the results obtained from the study group using the routines of the R statistical
package for the one-way variance analysis. Only variables that could influence the THg-H
values were “fish intake” and “frequency of fish intake”. This analysis made for the control
group did not reveal any contributing factors to THg-H.
1.1 Twenty three Hg-related signs and or symptoms were investigated. In the study group,
28/60 individuals (46.7%) reported some type of sign and/or symptom (26 with THg <
5 and 2 with ≥ 5 ug/g). The signs/symptoms most reported in that group (all
NIMD Forum 2009 Minamata City, 19―20 February 2009
61
frequencies) were: sleepiness (13 people; 21.7%), followed by hearing disturbance (10
people, 16.7%), anxiety and sadness (7 people each; 11.7%) and tremor (6 people;
10%). No significant relation was noted between hair mercury levels and clinical
symptoms in the current study. The symptom most frequently reported as “very
frequently” was headache (8 people; 13.3%), followed by joints pain (6 people; 10%)
(Table 5).
Discussion
Since Me-Hg accounts for more than 80% of THg in hair (16), THg could be used to estimate
exposure to Me-Hg (17). Mean levels of THg-H were below the safety limit reported by WHO
(10 ug/g) and values of MeHg-H were not significant different from the permissible limit (2
ug/g) (18). None of the women studied had THg-H over 10 ug/g which has been reported to be
the upper limit guideline for pregnant women (19). A MeHg-H level around 50 ug/g is
associated with a 5% risk of neurological damage to adults (8). Participants‟ levels were lower
than levels associated with such effects among adults (50 ug/g hair) and among children
exposed in uterus (10 ug/g hair) (18). VOY ACA
Our THg-H values are consistent with the ones obtained by Nilson et al, 2001 (20), although
those authors obtained MeHg-H levels lower that the present study. Both mean values obtained
in our study were lower than the ones reported in studies from other countries such as Brazil (21,
22) and French Guiana (23). However, the statistically higher THg-H values in the study group
may indicate that could exist a potential for Hg contamination in the area.
When evaluating the different fish species reported, apart from tuna, we did not find the ones
that are more susceptible of Hg uptake as reported by other researchers (7, 22). Due to the great
variety of fish species available and reported it is difficult to determine the type of fish
predominant as a typical diet in this region, so further epidemiological studies would be
recommended.
Levels of THg-H in the Fishing village group were higher than the ones in other groups
although not statistically different. This is probably due to the higher fish consumption. THg-H
concentrations decreased in the following order: Fishing village > Current workers > Retired
workers > Puerto Cabello, which is considered consistent with what was expected.
Table 4 shows that the only variables that could influence the THg-H values in the study group
are “fish intake” and “frequency of fish intake”, as the probability of rejection of the F test is
0.035 and 0.034 respectively, which implies that they are significant at 4%. Other factors
studied did not contribute significantly to THg-H levels.
NIMD Forum 2009 Minamata City, 19―20 February 2009
62
As expected, Fig. 2 shows an increase in THg-H concentrations in the study group individuals
whose frequency of fish intake was “daily”. The fact that mean THg-H value of the Fishing
village residents was the highest in the study group (2.5 ± 1.56 ug/g) and 57% of this population
reported a daily frequency of fish intake (mean THg-H 3.55 ± 0.97 ug/g), indicates that diet
factors contributed importantly to the Hg-H levels, especially the daily frequency of intake.
These findings suggest that the fish from the coast of that area may be contaminated with Hg
although with permissible levels. This potential contamination should be further monitored with
methods including the Hg determination in fish samples.
Since all Hg-H concentrations in this population were below 10 ug/g (considered as the limit
below which clinical signs are not apparent) (24), signs and or symptoms reported could not be
considered specific to mercury intoxication so we can not derive definitive conclusions from
these results. However, a more in-depth exposure assessment should be conducted to
characterize more accurately this exposure mainly in terms of water and fish sampling for Hg
content.
References
1. Magos L, Clarkson TW. Overview of the clinical toxicity of mercury. Ann Clin
Biochem. 2006; 43(Pt 4):257-268
2. Frery N, Maury-Brachet R, Maillot E, Deheeger M, De Merona B, Boudou A.
Gold-mining activities and mercury contamination of native Amerindian
communities in French Guiana. Key role of fish in dietary uptake. Environ
Health Perspect 2001; 109 (5): 449-456.
3. Kehrig HA, Malm O, Akagi H. MeHg in air samples from different riverine
groups, Amazon, Brazil. Water, Air and Soil Pollution 1997; 97:17-29.
4. Boischio AA and Cernichiari E. Longitudinal Hair Mercury Concentration in
Riverside Mothers along the Upper Madeira River (Brazil). Environ Res 1998;
77(2):79-83.
5. Pérez D. Línea Base de referencia Biológica en el ambiente marino costero del
área de Golfo Triste. Informe final del proyecto por contrato Pequiven-
Universidad Simón Bolívar. Caracas. 1989.
6. Parra Pardi G. Estudio integral de la cuenca del río Yaracuy. Dirección de
Malariología y Saneamiento Ambiental M.S.A.S. Caracas 1974, 341pp.
NIMD Forum 2009 Minamata City, 19―20 February 2009
63
7. Malm O, Branches F, Akagi H, Castro M, Pfeiffer W, Harada M, Bastos WR,
Kato H. Mercury and MeHg in fish and human hair from the Tapajós river
basin, Brazil. Sci Total Environ 1995; 175(2):141-150.
8. Veiga M and Baker R. Protocols for Environmental and Health Assessment of
Mercury Released by Artisanal and Small-scale Gold Miners. Published by
GEF/UNDP/UNIDO Global Mercury Project. Vienna, ISBN 92-1-106429-5.
2004, 289pp.
9. Canuel R, Boucher de Grosbois S, Atikessé L, Lucotte M, Arp P, Ritchie C ,
Mergler D, Man Chan HM, Amyot M and Anderson R. New Evidence on
Variations of Human Body Burden of Methylmercury from Fish Consumption
(Mini monograph). Environ Health Perspect 2006; 114 (2):302-306.
10. Lebel J, Mergler D, Branches F, Lucotte M, Amorin M, Larribe F, Dolbec, J.
Neurotoxic effects of low-level MeHg contamination in the Amazonian basin.
Env Res Section A 1998; 79:20-32.
11. Harnly M, Sharon S, Rojas P, Fornes R, Flessel P, Smith D, Kreutzer R,
Goldman L. Biological monitoring for mercury within a community with soil
and fish contamination. Environ Health Perspect 1997; 105(4):424-429.
12. Hightower JM and Moore D. Mercury Levels in High-End Consumers of Fish.
Environ Health Perspect 2003; 114(4):604-608.
13. Nakamura K, Naruse I, Takizawa Y. A new mass screening method for MeHg
poisoning using mercury-volatilizing bacteria from Minamata Bay. Ecotoxicol
and environ saf 1999; 44(1):100-104.
14. Nakano A and Miyamaoto Y. Development of an analytical method for MeHg
determination by atomic absorption photometry. Proceedings of International
Workshop on Health and Environmental Effects of Mercury -Impacts of
Mercury in South and Central America. Belem, Brazil. 2003, 218-238 pp.
15. The R Project for Statistical Computing. Version: 2.2.1. Available from:
http://www.r-project.org. December 2005.
16. Cernichiari E, Toribara TY, Liang L, Marsh DO, Berlin MW, Myers GJ, Cox C,
Shamlaye CF, Choisy O, Davidson P, et al. The biological monitoring of
mercury in the Seychelles study. Neurotoxicology 1995; 16:613-628
17. NRC (National Research Council). Toxicological effects of methyl-mercury.
Washington, DC: National Academy Press. 2000.
NIMD Forum 2009 Minamata City, 19―20 February 2009
64
18. WHO. ENVIRONMENTAL HEALTH CRITERIA 101, Methylmercury.
World Health Organization, Geneva, 1990.
19. Skerfving S. Mercury in fish. Some toxicological considerations. Food Cosmet.
Toxicol 1973; 10:545-556.
20. Nilson SA Jr, Costa M, Akagi H. Total and methylmercury levels of a coastal
human population and of fish from the Brazilian northeast. Environ Sci Pollut
Res Int. 2001; 8(4):280-284.
21. Guimaraes JRD, Fostier AH, Forti MC, Melfi JA, Kehrig H, Mauro JBN et al.
Mercury in human and environmental samples from two lakes in Amapa,
Brazilian Amazon. Ambio 1999; 28:296-301.
22. Leino T and Lodenius M. Human hair mercury levels in Tucuruí area, State of
Pará, Brazil. Sci Total Environ 1995; 175(2):119-125.
23. Cordier S, Grasmick C, Paquier-Passelaigue M, Mandereau L, Weber JP, Jouan
M. Mercury exposure in French Guiana: levels and contaminants. Arch Environ
Health 1998; 53(4):299-303.
24. Harada M, Nakachi S, Cheu T, Hamada H, Ono Y, Tsuda T, Yanagida K,
Kizaki T, Ohno H. Monitoring of mercury pollution in Tanzania: relation
between head hair mercury and health. Sci Total Environ 1999; 227(2-3):249-
256.

NIMD Forum 2009 Minamata City, 19―20 February 2009
65
TABLE I. DISTRIBUTION OF THE STUDY POPULATION
ACCORDING TO GROUP, SEX, AGE AND THg-H VALUES.
Group AGE
(Years) SEX
THg
(ug/g)
THg-H (ug/g) MeHg-H
(ug/g)
n % (1)
X ± SD
(R)
X ± SD
(R)
Study
47.47 ±
14.66
(R= 21-74)
Male
< 5 33 58.92
1.53 ±
1.05
(0.21-4.38)
-
≥ 5 3 75
5.78 ±
1.05
(5.16-7.00)
3.85 ±
1.47
(2.17-4.90)
Total
male 36 60
1.88 ±1.57
(0.21-
7.00)
-
Female
< 5 23 41.08
1.72 ±1.21
(0.31-
4.70)
-
≥ 5 1 25 5.61 3.14
Total female
24 40
1.88 ±1.42
(0.31-
5.61)
-
Total
Study G.
< 5 56 100
1.61 ±1.11
(0.21-
4.70)
-
≥ 5 4 100
5.74 ±0.86
(5.16-7.00)
3.67 ±
1.25
(2.17-
4.90)
Total
60 100
1.88 ±
1.50(*)
(0.21-
7.00)
-
Control
36.86 12.35
(R=18–74)
Male
< 5 50 50
1.08 ±0.84
(0.13-
4.37)
-
Female
< 5 50 50
0.90 ±0.89 (0.09-
4.31)
-
Total Control Group
< 5 100 100
0.99 ±
0.87 (0.09-
4.37)
-
R: Range (1): % based on each total according to THg values: Study: < 5 ug/g (n=56) and ≥ 5 ug/g (n=4);
Control: <5 ug/g (n=100).
(*): Significant difference with respect to Control group (t-Student for independent samples)

NIMD Forum 2009 Minamata City, 19―20 February 2009
66
TABLE Ⅱ. “STUDY” GROUP ACCORDING TO CLASSIFICATION
AND MEAN VALUES OF Hg-H
Classification THg-H (ug/g)
THg-H (ug/g) MeHg-H (ug/g)
n % (1)
X± SD(*)
(R)
X ± SD
(R)
Retired workers
< 5 18 32.1 1.07±0.75
(0.21-2.97) -
≥ 5 2 50 6.09±1.27
(5.19-7.00)
3.33±1.64
(2.17-4.49)
Total 20 33.3 1.57±1.72
(0.21-7.00) -
Current workers < 5 13 23.2
2.04±1.07
(0.60-4.70) -
≥ 5 0 - - -
Fishing Village
< 5 13 23.2 2.29±1.42
(0.31-4.38) -
≥ 5 1 25 5.16 4.90
Total 14 23.3 2.50±1.56
(0.31-5.16) -
Puerto Cabello
< 5 12 21.4 1.20±0.63 (0.40-2.70)
-
≥ 5 1 25 5.61 3.14
Total 13 21.6 1.54±1.36
(0.40-5.61) -
TOTAL
< 5 56 100 1.61±1.11 (0.21-4.70)
-
≥ 5 4 100 5.74±0.86
(5.16-7.00)
3.67±1.25
(2.17-4.90)
Total 60 100 1.88±1.50 (0.21-7.00)
-
R: Range
(1): % based on each frequency according to THg values: < 5 ug/g (n=56) and ≥ 5 ug/g (n=4);
(*): No statistical differences between studied groups (one-way ANOVA)
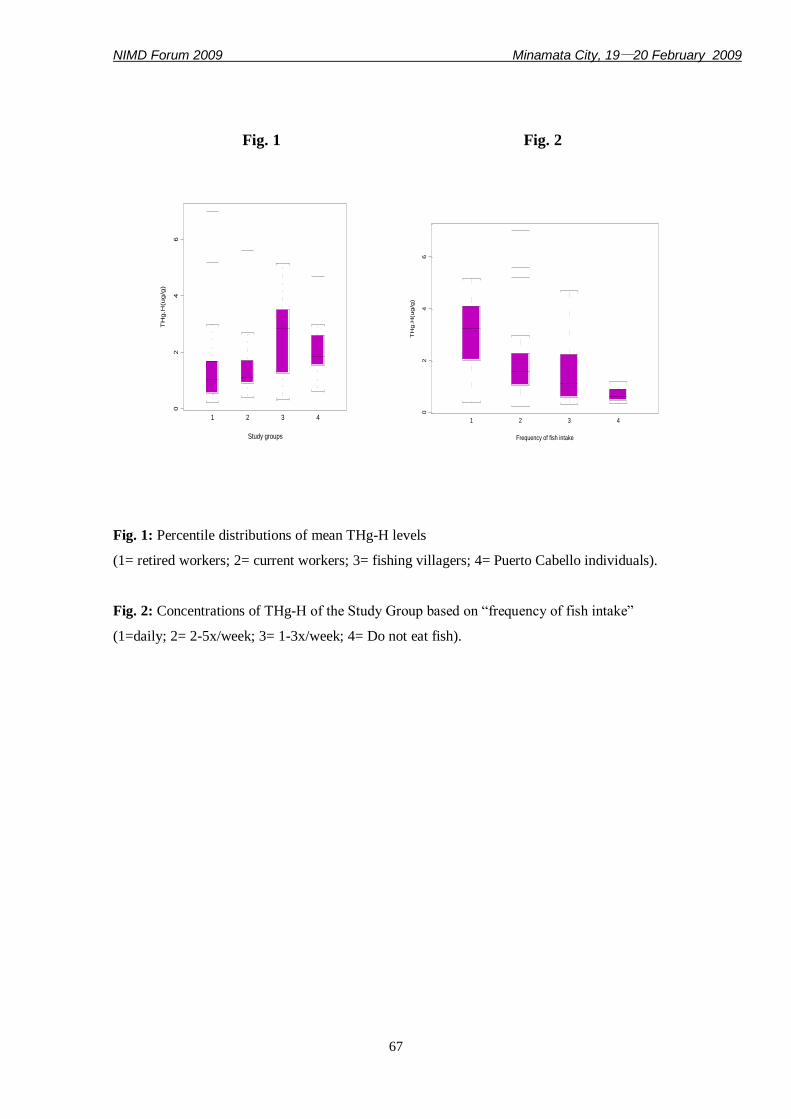
NIMD Forum 2009 Minamata City, 19―20 February 2009
67
Fig. 1 Fig. 2
02
46
1 2 3 4
Study groups
TH
g.H
(ug
/g)
02
46
1 2 3 4
Frequency of fish intake
TH
g.H
(ug/g
)
Fig. 1: Percentile distributions of mean THg-H levels
(1= retired workers; 2= current workers; 3= fishing villagers; 4= Puerto Cabello individuals).
Fig. 2: Concentrations of THg-H of the Study Group based on “frequency of fish intake”
(1=daily; 2= 2-5x/week; 3= 1-3x/week; 4= Do not eat fish).
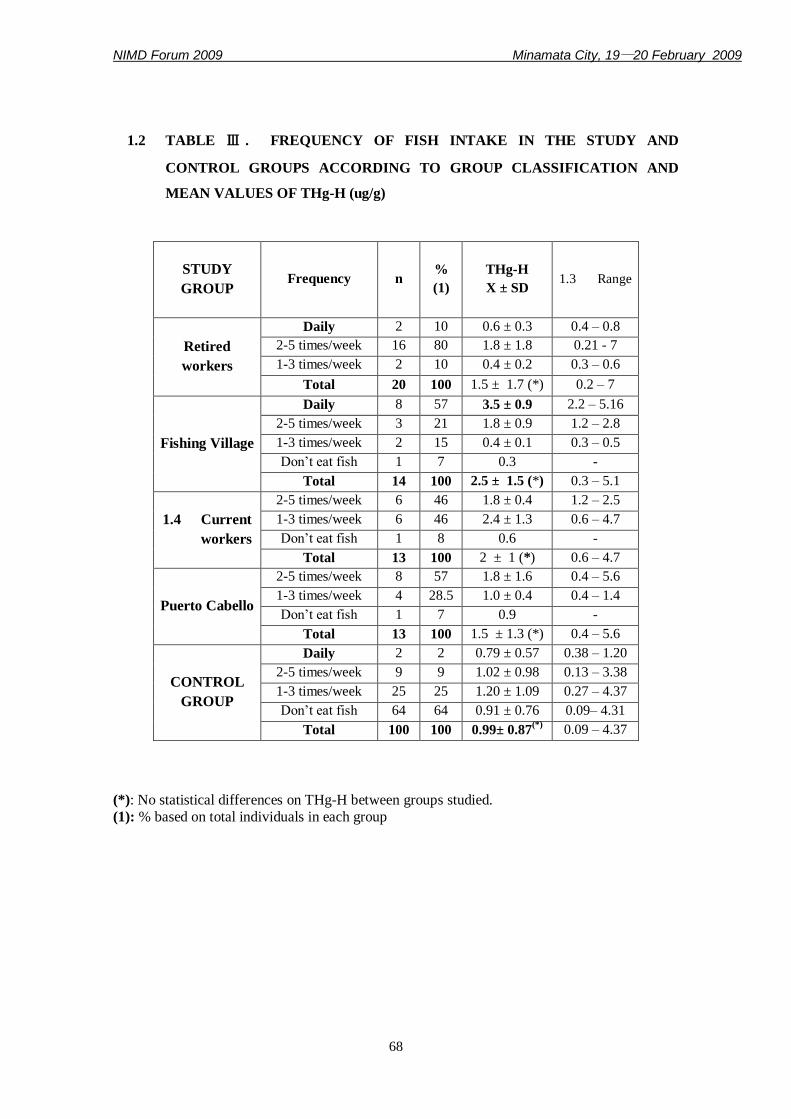
NIMD Forum 2009 Minamata City, 19―20 February 2009
68
1.2 TABLE Ⅲ . FREQUENCY OF FISH INTAKE IN THE STUDY AND
CONTROL GROUPS ACCORDING TO GROUP CLASSIFICATION AND
MEAN VALUES OF THg-H (ug/g)
STUDY
GROUP
Frequency n %
(1)
THg-H
X ± SD 1.3 Range
Retired
workers
Daily 2 10 0.6 ± 0.3 0.4 – 0.8
2-5 times/week 16 80 1.8 ± 1.8 0.21 - 7
1-3 times/week 2 10 0.4 ± 0.2 0.3 – 0.6
Total 20 100 1.5 ± 1.7 (*) 0.2 – 7
Fishing Village
Daily 8 57 3.5 ± 0.9 2.2 – 5.16
2-5 times/week 3 21 1.8 ± 0.9 1.2 – 2.8
1-3 times/week 2 15 0.4 ± 0.1 0.3 – 0.5
Don‟t eat fish 1 7 0.3 -
Total 14 100 2.5 ± 1.5 (*) 0.3 – 5.1
1.4 Current
workers
2-5 times/week 6 46 1.8 ± 0.4 1.2 – 2.5
1-3 times/week 6 46 2.4 ± 1.3 0.6 – 4.7
Don‟t eat fish 1 8 0.6 -
Total 13 100 2 ± 1 (*) 0.6 – 4.7
Puerto Cabello
2-5 times/week 8 57 1.8 ± 1.6 0.4 – 5.6
1-3 times/week 4 28.5 1.0 ± 0.4 0.4 – 1.4
Don‟t eat fish 1 7 0.9 -
Total 13 100 1.5 ± 1.3 (*) 0.4 – 5.6
CONTROL
GROUP
Daily 2 2 0.79 ± 0.57 0.38 – 1.20
2-5 times/week 9 9 1.02 ± 0.98 0.13 – 3.38
1-3 times/week 25 25 1.20 ± 1.09 0.27 – 4.37
Don‟t eat fish 64 64 0.91 ± 0.76 0.09– 4.31
Total 100 100 0.99± 0.87(*)
0.09 – 4.37
(*): No statistical differences on THg-H between groups studied.
(1): % based on total individuals in each group
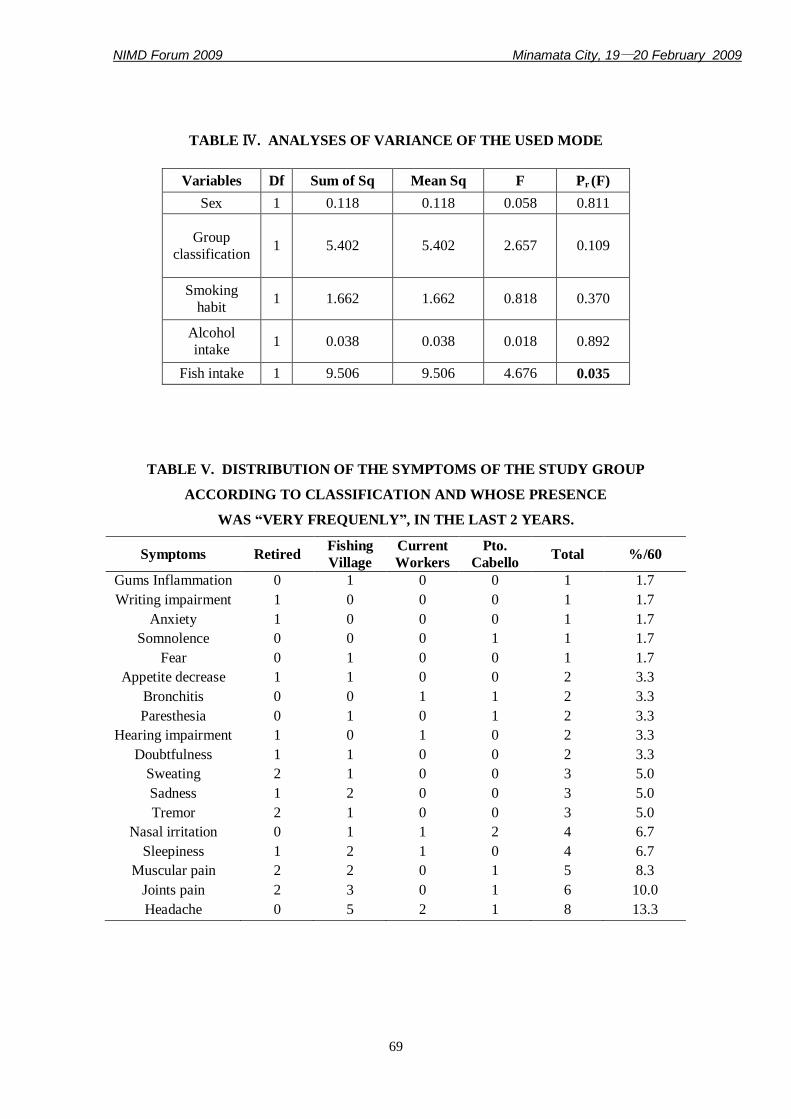
NIMD Forum 2009 Minamata City, 19―20 February 2009
69
TABLE Ⅳ. ANALYSES OF VARIANCE OF THE USED MODE
Variables Df Sum of Sq Mean Sq F Pr (F)
Sex 1 0.118 0.118 0.058 0.811
Group
classification 1 5.402 5.402 2.657 0.109
Smoking
habit 1 1.662 1.662 0.818 0.370
Alcohol
intake 1 0.038 0.038 0.018 0.892
Fish intake 1 9.506 9.506 4.676 0.035
TABLE V. DISTRIBUTION OF THE SYMPTOMS OF THE STUDY GROUP
ACCORDING TO CLASSIFICATION AND WHOSE PRESENCE
WAS “VERY FREQUENLY”, IN THE LAST 2 YEARS.
Symptoms Retired Fishing
Village
Current
Workers
Pto.
Cabello Total %/60
Gums Inflammation 0 1 0 0 1 1.7
Writing impairment 1 0 0 0 1 1.7
Anxiety 1 0 0 0 1 1.7
Somnolence 0 0 0 1 1 1.7
Fear 0 1 0 0 1 1.7
Appetite decrease 1 1 0 0 2 3.3
Bronchitis 0 0 1 1 2 3.3
Paresthesia 0 1 0 1 2 3.3
Hearing impairment 1 0 1 0 2 3.3
Doubtfulness 1 1 0 0 2 3.3
Sweating 2 1 0 0 3 5.0
Sadness 1 2 0 0 3 5.0
Tremor 2 1 0 0 3 5.0
Nasal irritation 0 1 1 2 4 6.7
Sleepiness 1 2 1 0 4 6.7
Muscular pain 2 2 0 1 5 8.3
Joints pain 2 3 0 1 6 10.0
Headache 0 5 2 1 8 13.3
NIMD Forum 2009 Minamata City, 19―20 February 2009
70
Hair mercury investigation of mercury-polluted areas
around the world
Masatake Fujimura1, Akito Matsuyama
2, Masaaki Nakamura
3,
Akira Yasutake1, Mineshi Sakamoto
2, Kunihiko Nakamura
1.
1: Basic Medical Science, National Institute for Minamata Disease
2: Epidemiology, National Institute for Minamata Disease
3: Clinical Medicine, National Institute for Minamata Disease
The most effective method to understand the human health risk of harmful substances such as
methylmercury at the early stage is assessment of the exposure level.
"How much of the harmful substance is taken into the body?”
It is clear that methylmercury uptake from food etc. into the body is eliminated by urine etc.,
and accumulates in hair and fingernail at a constant rate. The concentration of methylmercury in
hair is an effective indicator to understand the level of human exposure to methylmercury. The
purpose of this investigation is to assess the methylmercury exposure level around the world by
measuring the hair mercury level of the inhabitants in regions where methylmercury pollution is
possible by gold mining, factory pollution related and fish dining habits etc., and to contribute
to prevention of related health hazard.
These results were obtained from a 6-year investigation (2003-2008). Hair samples were
collected from 2,054 inhabitants (males: 881, females: 1,173) in 8 countries (Kazakhstan, China,
South Korea, Colombia, Benin, Indonesia, Venezuela and French Guiana) around the world.
The concentrations of total mercury in the hair were determined according to the oxygen
combustion-gold amalgamation method using a mercury analyzer MA 2000 (Nippon
Instruments). Methylmercury analysis was involved immersion of the samples in 2N HCL,
heating at 100 for 5 minutes to leach out methylmercury from the sample, methylmercury
extration into toluene, and determination by gas-liquid chromatography with electron capture
determination method using a gas chromatograph G 3800 (Yanaco).
Some hair samples from Benin included very high concentration of mercury (>1000 ppm).
The ratio of methylmercury to the total mercury, which was an indicator of the human body
internal exposure, ranged from 0.6 to 1.0%. Since no miner‟s hair included in these hair
samples, it was suggested that cosmetics such as hair conditioner involved in mercury caused
high value of mercury. In the case of Indonesia, the ratio of methylmercury to the total mercury
ranged from 1 to 30% in a lot of samples. Samples included miners‟ hair who worked in the
gold mine. The high concentration of mercury was ascribed to external exposure while gold

NIMD Forum 2009 Minamata City, 19―20 February 2009
71
mining. The average concentration of hair total mercury in French Guiana was remarkably
high at 7.6 ppm (male) and 9.3 ppm (female), respectively. The ratio of methylmercury to the
total mercury, ranged from 80 to nearly 100%. It was collected from inhabitants who have a
habit of eating fish in the mercury-polluted area near a gold mine mountain. The high
concentration of methylmercury was ascribed to consumption of mercury-polluted fish.
NIMD Forum 2009 Minamata City, 19―20 February 2009
72
Methyl mercury exposure from fish consumption among
communities near Ethiopian Rift Valley Lakes (ERVLs)
*Solomon Aragie PhD candidate, Hawassa University, Ethiopia [email protected]
Abstract: Fish is an important component of the diet in Ethiopia and it is an excellent source of
important nutrients. Yet, such benefits may be offset by the presence of contaminants such as,
methylmercury (MeHg). Our objective is to investigate MeHg exposure levels and nutritional
benefits from fish consumption in communities near ERVLs. This research involves three
phases: Phase I was focused on the assessment of fish consumption pattern and major health
problems of the population, which was conducted using a structured food frequency
questionnaire. Phase II will focus on MeHg and n-3 polyunsaturated fatty acids (n-3PUFAs)
exposure assessments and Phase III is planned to involve a cohort study of child development.
The diets of the study population are dominated by a single staple food and the source of animal
proteins for most of the study population, for instance, for 100 % of Arbamich and 82.1 % of
Zeway fishermen was fish only and they never ate other animal proteins. There are six
important fish species landing in the study areas. (Tilapia) O. niloticus consumption rate in
Zeway, Awassa and Arbaminch is 81.1 %, 78 % and 79.3%, respectively. Catfish and Barbus
species are the second and the third most frequently consumed species next to tilapia. Mean
fish meal consumption rate in the study population per week was 8.5 (range 1- 14 meals). Half
(47.9%) of the population had 10 to 14 meals per week. The average weekly fish meal
consumption was significantly different among fishermen in Arbaminch, Zeway and Awassa
(13.5, 10.2 and 9.5 respectively P< 0.01). Mean amount of fish consumption per week per
individual was 1309g (range 125g - 3500g per week).Highest amount of fish was consumed in
Arbaminch than Awassa and Zeway (3062.5g, 1046.8g and 1343.7 g respectively) and the
result was statistically significantly different ( P<0.05). In the health status survey, Mental
illness was reported as their major family health problem by 24.5 % of households from Zeway
islands. Fishermen and their assistants in all study areas and Zeway fishermen families have
been found to consume grater quantities of fish per week. Such frequent fish consumptions, may
pose a health risk if consumed fish is contaminated with MeHg. Therefore, the second phase
will focus on the assessment of MeHg and n-3PUFA exposure among fishermen and their
families living around these lakes.
Key words: Ethiopian Rift Valley Lakes; Fish consumption; Methylmercury; Polyunsaturated
fatty acid.
NIMD Forum 2009 Minamata City, 19―20 February 2009
73
Introduction: Fish is an important component of the diet in Ethiopia where about 49% of the
total population is considered „under-nourished‟ (FAO, 1995). Estimated annual fish yield
potential of the country is about 51,000 tonnes (Mebrat, 1993). The ERVLs are being used for
commercial fisheries, irrigation, power generation, recreation and for some industrial purposes.
The sources of major pollutants affecting these lakes are factories, agriculture and sewage.
Mineral extraction from Lake Abijata, effluents from the tannery at Koka reservoir and the
textile industries in Awassa and Arba Minch have affected the concerned fisheries. Expanding
horticultural production is making increasing use of chemical inputs. Aquatic food chains are
capable of accumulating certain environmental contaminants up to toxic concentrations. MeHg
is the most dramatic and best documented example of high bioaccumulation (Clarkson, 1995).
Mercury concentration was reported from one of the rift valley lakes, Lake Awassa. The
Mercury concentration in the effluent discharged to and the concentration in the water from
Tikur Wuha is 5.1µg/l and 2.8µg/l (Zinabu and Pearce, 2003). Desta et al (2006) reported the
high mercury concentration in some fish species such as, piscivorous Big Barbs (Barbus
intermedius) in Lake Awassa. The level of mercury was beyond the marketing limit of the
European Union (0.5 mg/kg) and FAO/WHO‟s guideline for safe fish consumption (0.3 mg/kg).
Communities living around these lakes have a long history of relying upon fish as a major part
of thier diet and using fish for commercial fisheries. Compared to other group of populations,
fishermen and thier families may eat more and variety of fish than the general population. Yet,
nothing is known about the exposure level as well as health effects caused by contaminants
through fish consumption. The purpose of this study is therefore to investigate MeHg exposure
levels and nutritional benefits from fish consumption in communities near ERVLs. This study
involves three phases: Phase I was focused on the assessment of fish consumption pattern and
major health problems of the population, Phase II will focus on MeHg and n-3 PUFAs exposure
assessments and Phase III is planned to involve a cohort study of child development.
Methods: Phase I: The study area includes fish landing sites and surroundings at lakes situated
in the southern part of the Ethiopian rift valley. More than 70% of the total populations were
surveyed. People fishing at the time of survey and head of households available at home were
included. This cross- sectional study involved questionnaire administration to be completed by
each participant. The questionnaire was designed using (UNEP DTIE, 2008) guideline. The
study was approved by ethics committee of Addis Ababa University. Fish weight estimation and
NIMD Forum 2009 Minamata City, 19―20 February 2009
74
species identification were performed with the help of staffs from Ethiopian Fish Production
and Marketing Corporation (EFMPC).
Phase II: To assess exposure to mercury, hair and blood samples will be collected from
fishermen families and children who are working as assistants to the fishermen. We will also
determine plasma polyunsaturated fatty acid concentrations of the study population. In addition,
Fish samples from different species will be used for chemical analysis including mercury and
fatty acid concentrations using standard procedures. Phase III: Since fetus is a highest risk
group for MeHg exposure. At the third stage, we are also going to collect the samples from
pregnant women and fetuses (cord blood) for the future cohort study of child development.
Results and Discussion: The total number of households surveyed was 307, consisting of 184
in Zeway Islands 69 in Arbaminch and 54 in Awassa. In addition, 133 fishermen and 21
children working as assistants were surveyed at fishing sites. The primary source of income for
all participants is fishing. All respondents have permanent residence in the area.
The diets of the study population are dominated by a single staple food such as cereals with
some vegetables such as cabbage or tomato. Overall, the mean number of fish meals eaten per
week by the whole population was 8.5. The survey also gathered information on consumption of
other major sources of animal proteins and fruits. The source of animal proteins for most of the
study population, for instance, for 100 % of Arbamich fishermen and 82.1 % of Zeway
fishermen was fish only and they never ate other animal proteins. Therefore, fish can be
considered as the only source of animal proteins for our study population.
There are six important fish species landing in the study areas. The dominant species was
(Tilapia) Oreochromis niloticus. Tilapia was the most frequently consumed fish in Zeway,
Awassa and Arbaminch by 81.1 %, 78 % and 79.3% of the study population, respectively.
Catfish and Barbus species are the second and the third most frequently consumed species next
to tilapia. The mercury concentrations of piscivorous big barbs, O. niloticus and C. garipinus
from lake Awassa were 0.01to 0.94mg/kg; 0.0028 and 0.082 mg/ kg and 0.002–0.154 mg /kg
respectively (Desta et al., 2006). Since the mercury concentration of the big Barbu species was
beyond FAO/WHO‟s guideline for safe fish consumption, it may pose a health risk to those
people who frequently consumed this species. However, mercury concentration of these species
from the other lakes such as, lake Zeway and Chamo were not determined so far. According to
recent observation in lake Zeway and estimation of annual commercial catch in lake Awassa,
the landings of Catfish and big Barb become increasing (Bjokli, 2004). Given the high fishing
NIMD Forum 2009 Minamata City, 19―20 February 2009
75
pressure on tilapia and its overexploitation, the share of big Barb and Catfish in the commercial
catch from these lakes is expected to rise in the future.
Our study showed that all fish sources are nearby lakes and the study populations consume
locally self-coughed fish. Mean fish meal consumption rate in the study population per week
was 8.5 (range 1- 14 meals). Half (47.9%) of the study population had 10 to 14 meals per week.
These indicate that, on average, people ate fish everyday and twice a day on some days. The
average weekly fish meal consumption was significantly different among fishermen in
Arbaminch, Zeway and Awassa (13.5, 10.2 and 9.5 respectively P< 0.01). In general, large
population of Arbaminch fishermen (100%) and Zeway fishermen and their families (61.4%)
had the highest number of meals (10 to 14 meals) consumed per week compared to the other
study groups.
The amount of fish consumed per week by the study population ranges from 125g to 3500g. The
mean fish consumption rate by the whole population was 1309g/week. Arbaminch fishermen
consume significantly higher amount of Fish per week than Awassa and Zeway fishermen
(mean: 3062.5g Vs 1046.8g, 1343.7 g respectively, P<0.005). Arbaminch and Awassa
fishermen families had the lowest amount of fish per week (mean: 527.1g and 564.8g
respectively). Large proportion (63.5%) of Arbaminch fishermen consume the highest amount
of fish (3000g to 3500g) per week compared to the other study groups (P< 0.01). Decreased
fishing opportunity by family members, the long distance between fishing sites and their
residence and access to fish markets to sell fish in a better price may be considered as possible
reasons for fish consumption differences between fishermen and their respective family
members. Easy access to lakes may account for the higher consumption rates among the Zeway
fishermen families compared to Awassa and Arbaminch fishermen families.
The estimated fish consumption rate by the study population (63kg/year) was more than 6 times
higher than the amount of fish consumed by the local people living in the areas such as,
Arbaminch, Sodo and Awassa (8.5kg/year) and in Gambella, close to River Baro (10kg/year)
(FAO, 1995). It was also exceeds the estimated total per capita fish consumption of Sub-
Saharan Africa (6.7kg/year) as well as per capita consumption of most developing countries
(14kg/year) (Delgado, et al., 2003). In Ethiopia, extreme regional variation in fish consumption
was reported (René, 1991). Seasonal fish production, troughs in demand, fasting habit and the
repeated changes in the prices of animal products are major factors associated with fish
consumption rate in Ethiopian (René, 1991).
In general most (87.9%) of the study population exceeds the weekly recommended amount of
fish to be eaten (US EPA, 2004). However, since there is no fish consumption advisory in
NIMD Forum 2009 Minamata City, 19―20 February 2009
76
Ethiopia and / or in the absence of data regarding the levels of toxic pollutants in various fish
species, it is difficult to judge whether their fish consumption pattern exposed them to toxic
pollutants such as MeHg or not.
The study populations in all study areas had complaint for infectious diseases that are very
common in Sub Saharan African countries. But unique to population from Zeway islands,
Mental illness was reported as their major family health problem by 24.5 % of the households.
In the previous study, a relatively high prevalence of mental illness (1.8% of Bipolar disorders
and 0.06% schizophrenia) among Zay people was reported (Abebaw et al., 2004). Sixty-six
percent of them were from Zeway islands. In contrast with several studies that showed the
association of greater seafood consumption with lower prevalence of bipolar disorders (Hibbeln
1998; Noaghiul and Hibbeln 2003), a relatively high prevalence of bipolar disorder was
observed in our population who consume more than 10 fish meals and on the average 1344g of
fish per week. Even this prevalence of mental illness was significantly higher compared to the
prevalence observed among non fish eating communities of Ethiopia (Kebede and Alem, 1999).
It is also known that insufficient dietary intake of omega-3 essential fatty acids increases the
risk of affective disorders (Hibbeln and Salem, 1995) and this is also supported by the results of
a double-blind, placebo-controlled trial that reported a reduction in the number of severe
affective episodes and a reduction in depression scores in bipolar patients receiving 9.6 g/day of
EPA and DHA (Stoll et al., 1999). Therefore, the present unexpected rate of mental illness
among fish eating community on Zeway islands can be explained by the fact that: either 1) the
most frequently consumed fish species in the present study may have very low omega 3 PUFAs
or 2) the association of omega 3 PUFAs with bipolar disorders may vary from population to
population or 3) the prevalence of the disorder would be much higher than the present findings,
if the diets of this population were not dominated by fish.
In conclusion, Phase I of the present research showed Fishermen and their families living
around ERVLs solely rely on fish to cover their daily proteins. The most frequently consumed
fish species was Tilapia followed by Catfish and Barbus species. Mental illness was identified
as a serious health problem by many people interviewed on the two Zeway islands. Fishermen
and their assistants in all study areas and Zeway fishermen families including women and
children have been found to consume grater quantities of fish per week. These frequent fish
consumptions, while having significant general health benefits, it may pose a health risk if
consumed fish is contaminated with toxic chemicals such as MeHg. Therefore, the Second
phase of the research will focus on the: 1) Determination of the levels of MeHg and n- 3PUFAs
contents of frequently consumed fish species.2) Assessment of both MeHg and n-3PUFAs
NIMD Forum 2009 Minamata City, 19―20 February 2009
77
exposure level of the study population. 3) Association of frequent fish consumption and
prevalence of mental illness among Zeway fishermen.
References:
Abebaw et al., (2004) J. Affective disorder, 80: 1-10
Bjørkli S. (2004).MSc thesis, Agricultural University of Norway
Clarkson, T.W., (1995). Am. J. Clin. Nutr.,61 682-86
Delgado et al., (2003) IFPRI Washington, D.C., U.S.A
Desta et al. (2006) Ecology of Freshwater Fish,15: 532-43
FAO (1995). Fisheries and Aquaculture, Rome, FAO
Hibbeln JR (1998) Lancet; 351:1213
Kebede and Alem (1999) Acta Psychiatr. Scand, 100: 11-17
Mebrat, A. (1993). pp 45-53. Rome, FAO
Noaghiul, S. and. Hibbeln, J.R (2003) Am. J. Psychiatry,
160:2222–2227
René, F., (1991). JEFAD/FMRS/91/20. UNECA.
Stoll A ,et al (1999). Arch Gen Psychiatry; 56:407–412
UNEP DTIE (2008) Guidance for identifying populations at
risk, Geneva, Switzerland
US EPA (2004) fact sheet. EPA-823-F-04-016.
Zinabu, and Pearce ( 2003) Hydrobiologia 492:171-178.

NIMD Forum 2009 Minamata City, 19―20 February 2009
78
Clinical evaluation of mercury exposure in riverine
from Tapajós Basin, in the Amazon.
Maria da Conceição Nascimento Pinheiro 1; Teiichi Oikawa
1;
Carlos Araújo da Costa 1; José Luiz Fernandes Vieira
1;
Geraldo de AssiGuimarães 1;Amélia A. de Araújo
1;
Luiz Carlos de Lima Silveira1,2
; Manoel Villarroel1.
1-Núcleo de Medicina Tropical/UFPA. 2. Instituto de Ciências Biológicas/UFPA.
Abstract
For many years the riverside from Tapajós basin has been showed mercury levels that exceed
those safe to health. To investigate the toxic effects associated to mercury exposure the authors
propose to valuable the occurrence of neurological effects in the inhabitants from a small
community Tapajós basin in the Amazon. A group of 26 subjects, 4 men and 22 women, 39,7 ±
15,8 years old (range: 14-66 years old) were clinically examined and subjected to
electromyography (ENMG). Exclusion criteria comprised early exposure to mercury vapor,
leprosy, diabetes and other systemic diseases that could potentially affect the nervous system.
Symptoms were presented in the 15(55,5%) subjects, such as anxiety (19,2%), headache(7,7%),
lumbar pain (7,7%), cervical pain (3,8%), general fatigue(3,8%) insomnia(7,7%), tremor of
hands(3,8%), numbness of hands(11,3%), psychic irritability(3,8%) and memory
disturbance(3,8%).. Three women with paresthesias also had Phalen‟s(hands) and Tinel‟s
positives (wrist) and electromyography(ENMG) with prolongation of the median distal latency
(Carpal Tunnel Syndrome). In a case was observed sensory disturbances of the extremities the
glove-stoching type associated with tremor, vibration sound disturbance, Romberg‟s sign,
hyporreflexia, ataxia(finger-nose-test), inability to walk straight and disturbance of equilibrium
(Romberg‟s test). He also had slowed sensory and motor nerve conduction velocities in the
upper and lower extremities. That case showed the similar symptoms to methylmercury
intoxication. However, the hair mercury level from 3,2 to 11ppm. We need the further study to
reveal the cause of that syndrome.
Key words: Mercury exposure. Mercury toxicity . ENMG. Riverine. Amazon.
Support: CNPq; FAPESPA; IBNnet; JICA.
NIMD Forum 2009 Minamata City, 19―20 February 2009
79
Introduction
Methyl mercury is a environmental toxic compound that biomagnifies though the aquatic food
web, placing at risk humans who consume significant quantities of predatory fish from upper
trophic levels or who rely heavily on fish as a food source (Clarkson, 2002).
Human exposure to methyl mercury at levels exceeding those considered safe and with risk of
adverse effect has been registered across in the world, including levels lower than those that
produced the historic epidemics of methyl mercury poisoning in Japan and Iraq.In some
populations, however, there is growing evidence that current exposure are sufficient to alter
normal function of several physiological and developmental systems, indicating that methyl
mercury exposure still constitutes an important public health problem.
The neurotoxic effects of excessive exposure to methyl mercury has been repeatedly verified
and include somatosensory disturbance (peripheral nerves of limbs – glove and stocking type),
auditory disturbance, constriction of visual field, ataxia, tremor, dysartria, abnormal reflexes and
psychiatric signs (Harada,1995; Fugino 1994)
For more than two decades, riverside communities from Tapajós basin located in the west
region of Brazil‟Pará State has been exposed to mercury levels don‟t save to health through diet
((Akagi et al,1995; Barbosa et al, 1995; Malm et al. 1997; Lebel, et al. 1997; Pinheiro et al,
2007). Studies on the mercury content of fish in the Amazon river system have shown that
levels often surpass 0.5ppm fresh weight (Barbosa et al. 1995; Lacerda and Solomons,1991;
Malm et al,1995; Brabo et al,2000).
In this work, we have performed a neurological examination of inhabitants of a small
community of the Tapajós basin to evaluate the degree of nervous system impairment in this
population that could be related to the mercury exposure.
Methods
Population
The study targeted people living in a small village situated on the bank of a tributary of the
Amazon River. This village is approximately 120Km from the most extensive gold-mining
fields in Tapajós Riverl. A house-to-house survey revealed that this village had a total
population of 780 people. Part of these inhabitants, about 120 persons (≥14years old) who had
some complaints, or wished to undergo a medical examination were underwent general medical
NIMD Forum 2009 Minamata City, 19―20 February 2009
80
examination performed from September, 2008. Twenty six (26) subjects were selected to
symptoms and signs neurological and electromyographyc evaluation. The participation‟criteria
included older than 14 years old, long-term local residents (for more ten years), mercury levels
higher than 6ppm. They were given health evaluation by physician staff of Tropical Medicine
Institute of Federal University Pará. The neurologic examination was conducted by a physician
expert in neurology and neurophysiology. We excluded any exposed subjects with diagnosis of
leprosy, diabetes mellitus, cerebrovascular diseases, and early exposure to mercury vapor.
Epidemiological information
Information concerning demographics, medical and work history, dietary habits, including
fish consumption, with an emphasis on number fish meals were collected by a questionnaire,
administered during interview by a physician.
Hair sample and Analysis
Hair strands from root taken from the occipital region were analyzed to total mercury.
Mercury concentration was determined by atomic absorption spectrophotometry. In 1996 and
1998 hair sample were analyzed in Environmental Science Center of Tokyo/Institute of
Environmental Science Technology, Yokohama, Japão, in 2000 were performed in the
Laboratório de Caracterizacão Química of the Instituto de Pesquisas Energéticas e Nucleares
(IPEN),University of São Paulo, Brazil , in 2003, 2005, 2006 in the Laboratory of the
Tropical Medicine Institute of Pará Federal University. All the results were in µg/g (ppm).
Clinical evaluation
Examination of the peripheral nervous system was carried out by a neurologist physician (MV)
in all patients and performed according to standardized protocol. Sensory function was
examined in all extremities and included pain and light touch perception, vibration, joint
position sense according to a distal to proximal distribution. Equilibrium, Romberg‟s test,
coordination, muscle strength, reflex.
NIMD Forum 2009 Minamata City, 19―20 February 2009
81
Neurophysiological test.
For neurophysiologic evaluation was used a Medelec Synergy EMG (Oxford Instruments,
Surey, England). Right and left median, ulnar, deep peroneal and tibial motor nerves, right and
left radial, median, ulnar and sural sensory nerves and tibial F-waves were studied. Recording
were performed on Medelec Synergy EMG machine. Median and ulnar nerve compound muscle
action potentials (CMAPs) were recorded from the abductor pollicis brevis (APB) and the
abductor digiti minimi (ADM) muscles and stimulation was delivered at the wrist and the elbow.
Peritoneal and tibial CMAPs were recorded from the extensor digitorum brevis(EDB) and the
abductor hallucis (AH) muscles and stimulation was delivered at the ankle and the knee.
Median, ulnar and radial sensory nerves action potentials (SNAPs) were recorded with ring
electrodes from digit II, digit I and digit V and stimulation was apllied at the wrist, 14cm from
the recording electrodes. Sural SNAPs were recording posterior to the malleolus and stimulation
14cm proximally in the midcalf. The skin temperature was above 31ºC in all subjects and was
usually between 31 and 34ºC.
In the sensory NCS low filter were set at 10Hz and high filters at 5 kHz. Sweep speed was 1ms
per division, sensitivity was adjusted between 10 and 20µv per division, and stimulus duration
was 0,1ms.
In the motor NCS low filter were set at 3Hz and high filters at 10kHz. Sweep speed was 2 ms
per division, sensitivity was adjusted between 1 and 2 mv per division, and stimulus duration
was 0,2.
Ethical evaluation
The study protocol was approved by the ethics communities of the Tropical Medicine Institute
of the Federal University of Pará, Brazil. All participants gave their informed consent prior to
study.
Results and Discussion
In this study 26 subjects had history of residence at Tapajós river for more 10 years and
intake fish meals frequentelly and actually eat more than six fish meals for week. Some studies
NIMD Forum 2009 Minamata City, 19―20 February 2009
82
showed that the fish is important source of protein the dietary in riverine communities from
Amazonian (Lebel et al,1997; Eve et al, 1996) and mercury levels were related to the frequency
of fish consumption (Grandjean et al,1993; Eve et al, 1996). In polluted area as Minamata in
Japan the history of residence time, the occupational activities and food qualities was sugestive
of exposure to a high degree of pollution(Tsubaki and Takahashi,1986). In this study, there was
a epidemiological information suggesting low exposure to mercury for long time.
Reference values for mercury levels in hair from non-exposed individuals based on a review of
existing data from other countries is 2ppm (WHO,1990). WHO advisory maximum tolerable
levels for hair is 6ppm. In present study the maximum total mercury concentration found was
71,5ppm, and the means 26,5± 29,6ppm for males and 15,54± 5,9ppm for females. It is quite
clear that contamination with methylmercury is present.. Hair mercury levels measured in our
study were similar to those reported in other studies along the Tapajós River (Akagi et al,1995;
Barbosa et al, 1995; Malm et al. 1997; Lebel, et al. 1997; Pinheiro et al, 2007) and in other
regions of the Brazilian Amazon (Barbosa et al. 1998; Boischio and Cernichiari,1998).
Combinations of epidemiological information, mercury level in hair sample and neurological
signs observed in residents from polluted area are very important for the mercury poisoning „s
diagnosis. Sensory disturbance is one of the cardinal symptoms of methylmercury intoxication.
Sensory impairment of the extremities is of the glove-stocking type, sometimes with perioral
dysesthesia were observed in cases acute and chronic of Minamata disease which is the
neurological disorder induced by oral ingestion of organic mercury accumulated in fishes and
seafood (Harada,1995)
In this study, 26 subjects of total 120 inhabitants who wished to undergo a medical
examination or had in this time some symptom or sign was examinated for a physician to
neurological symptoms and sigs. Peripheral nerve involvement was observed in four cases.
Three women with more than forty years old had paresthesias, positives phalen‟s sign (hand)
and tinel‟s sign (wist), and eletroneuromyography(ENMG) with prolongation of the median
distal latency that suggested Carpal Tunnel Syndrome. The mean of mercury levels in hair
sample in each women were 8.1ppm, 8.5ppm and 22ppm however there was not evidence of
others neurological abnormalities.
In a case was observed sensory disturbances of the extremities the glove-stoching type
associated with tremor, vibration sound disturbance, Romberg‟s sign, hyporreflexia,
ataxia(finger-nose-test), inability to walk straight and disturbance of equilibrium (Romberg‟s
test). Although he had living for a long time mercury exposure area their mercury levels were
from 3,2 to 11ppm. According OMS⁄1990 the highest level without neuronal symptoms was
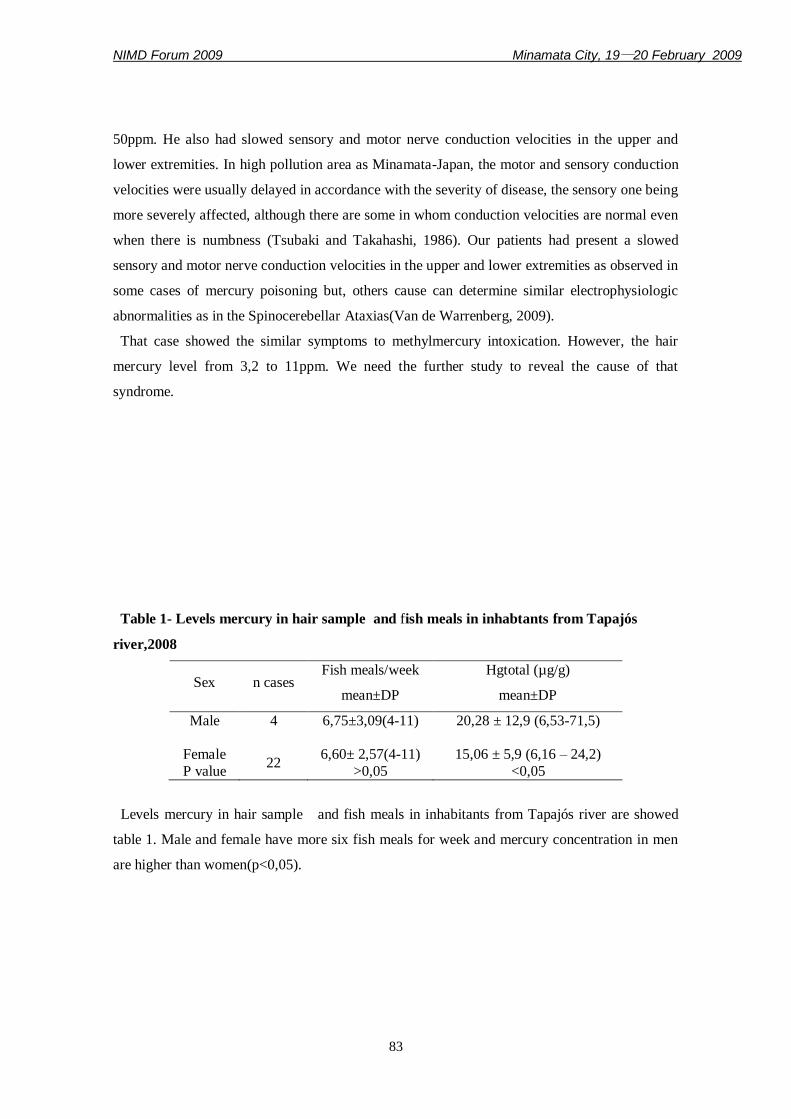
NIMD Forum 2009 Minamata City, 19―20 February 2009
83
50ppm. He also had slowed sensory and motor nerve conduction velocities in the upper and
lower extremities. In high pollution area as Minamata-Japan, the motor and sensory conduction
velocities were usually delayed in accordance with the severity of disease, the sensory one being
more severely affected, although there are some in whom conduction velocities are normal even
when there is numbness (Tsubaki and Takahashi, 1986). Our patients had present a slowed
sensory and motor nerve conduction velocities in the upper and lower extremities as observed in
some cases of mercury poisoning but, others cause can determine similar electrophysiologic
abnormalities as in the Spinocerebellar Ataxias(Van de Warrenberg, 2009).
That case showed the similar symptoms to methylmercury intoxication. However, the hair
mercury level from 3,2 to 11ppm. We need the further study to reveal the cause of that
syndrome.
Table 1- Levels mercury in hair sample and fish meals in inhabtants from Tapajós
river,2008
Sex n cases Fish meals/week
mean±DP
Hgtotal (µg/g)
mean±DP
Male 4 6,75±3,09(4-11) 20,28 ± 12,9 (6,53-71,5)
Female
P value
22
6,60± 2,57(4-11)
>0,05
15,06 ± 5,9 (6,16 – 24,2)
<0,05
Levels mercury in hair sample and fish meals in inhabitants from Tapajós river are showed
table 1. Male and female have more six fish meals for week and mercury concentration in men
are higher than women(p<0,05).
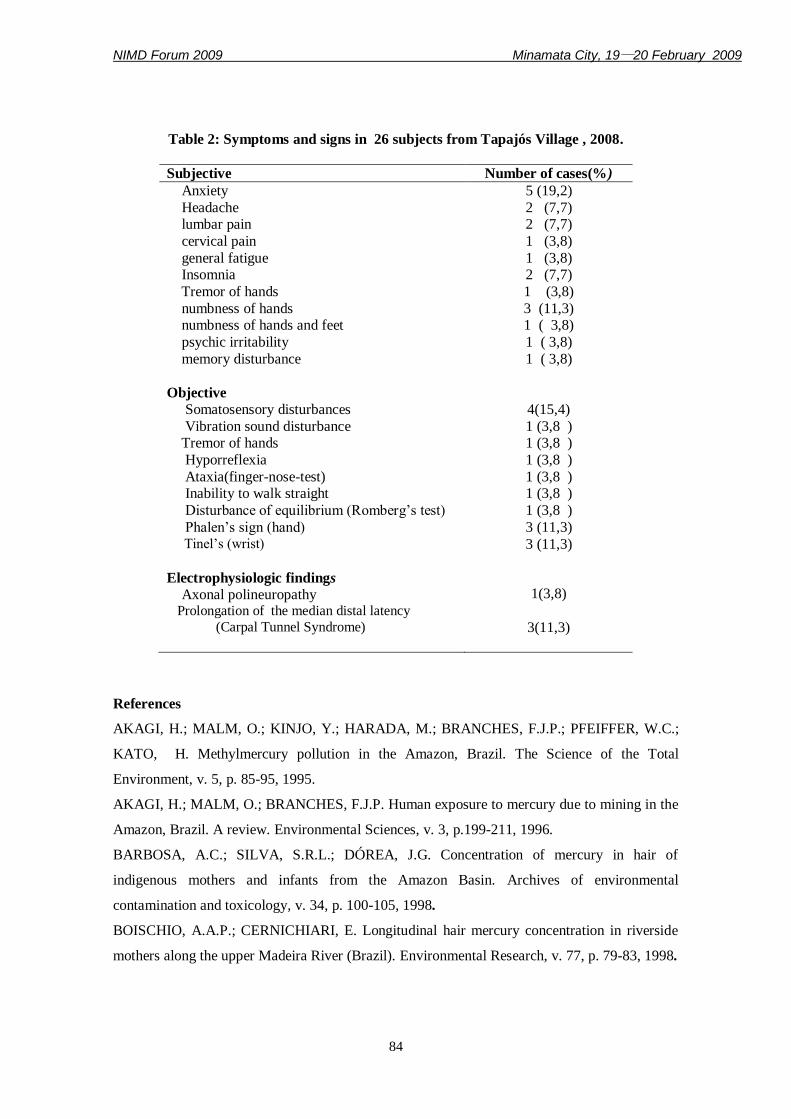
NIMD Forum 2009 Minamata City, 19―20 February 2009
84
Table 2: Symptoms and signs in 26 subjects from Tapajós Village , 2008.
Subjective Number of cases(%)
Anxiety 5 (19,2)
Headache 2 (7,7) lumbar pain 2 (7,7)
cervical pain 1 (3,8)
general fatigue 1 (3,8) Insomnia 2 (7,7)
Tremor of hands 1 (3,8)
numbness of hands 3 (11,3) numbness of hands and feet 1 ( 3,8)
psychic irritability 1 ( 3,8)
memory disturbance 1 ( 3,8)
Objective
Somatosensory disturbances 4(15,4)
Vibration sound disturbance 1 (3,8 ) Tremor of hands 1 (3,8 )
Hyporreflexia 1 (3,8 )
Ataxia(finger-nose-test) 1 (3,8 ) Inability to walk straight 1 (3,8 )
Disturbance of equilibrium (Romberg‟s test) 1 (3,8 )
Phalen‟s sign (hand) 3 (11,3) Tinel‟s (wrist) 3 (11,3)
Electrophysiologic findings
Axonal polineuropathy Prolongation of the median distal latency
(Carpal Tunnel Syndrome)
1(3,8)
3(11,3)
References
AKAGI, H.; MALM, O.; KINJO, Y.; HARADA, M.; BRANCHES, F.J.P.; PFEIFFER, W.C.;
KATO, H. Methylmercury pollution in the Amazon, Brazil. The Science of the Total
Environment, v. 5, p. 85-95, 1995.
AKAGI, H.; MALM, O.; BRANCHES, F.J.P. Human exposure to mercury due to mining in the
Amazon, Brazil. A review. Environmental Sciences, v. 3, p.199-211, 1996.
BARBOSA, A.C.; SILVA, S.R.L.; DÓREA, J.G. Concentration of mercury in hair of
indigenous mothers and infants from the Amazon Basin. Archives of environmental
contamination and toxicology, v. 34, p. 100-105, 1998.
BOISCHIO, A.A.P.; CERNICHIARI, E. Longitudinal hair mercury concentration in riverside
mothers along the upper Madeira River (Brazil). Environmental Research, v. 77, p. 79-83, 1998.
NIMD Forum 2009 Minamata City, 19―20 February 2009
85
BRABO, E.S.; SANTOS, E.O.; JESUS, I.M.; MASCARENHAS, A.F.S.; FAIAL, K.F. Mercury
contamination of fish and exposures of on indigenous community in Para State, Brazil.
Environmental Research, v. 84, p. 197-203, 2000.
CLARKSON, TW. The Three Modern Faces of Mercury. Environment Health Perspect,110:
11-23, 2002.
EVE, E.; OLIVEIRA, E.F.; EVE, C. The mercury problem and diets in the Brazilian Amazon:
planning a solution. Environmental Conservation, v. 23, p. 133-139, 1996.
GRANDJEAN, P.; CARDOSO. B.; GUIMARÃES, G. Mercury poisoning. Lancet, v. 342, p.
991, 1993.
FUGINO,T. Clinical and Epidemiological Studies on Chronic Minamata Disease Part I: Study
on Katsurajima Island. Kumamoto Medical Journal.Kumamoto Japan.v.44, n. 4,1994.
HARADA M. Minamata disease: methylmercury poisoning in Japan caused by environmental
pollution. Critical Reviews in Toxicology, v. 25, p. 1-24, 1995.
LACERDA, L.D.; SALOMONS, W. Mercúrio na Amazônia: uma bomba química? Rio de
Janeiro: CETEM/CNPq, 1992, 78 p. Série Tecnologia Ambiental.
LEBEL, J.; ROULET, M.; MERGLER, D.; LUCOTTE, M.; LARRIBE, F. Fish diet and
mercury exposure in a riparian Amazonian population. Water, Air and Soil Pollution, v. 97, p.
31-44, 1997.
LEBEL, J.; MERGLER, D.; BRANCHES, F.; LUCOTTE, M.; AMORIM, M.; LARRIBE, F.;
DOLBEC, J. Neurotoxic effects of low-level methylmercury contamination in the Amazonian
Basin. Environmental Research, v. 79, p. 20-32, 1998.
HARADA M. Neurotoxicity of methylmercury, Minamata and the Amazon. In: Yasui, M.,
Strong, M.J., Ota, K.K., Verity, M.A. (eds.) Mineral and Metal Neurotoxicology, p. 177-187.
New York, U.S.A.: CRC Press, 1997.
MALM, O.; BRANCHES, F.J.P.; AKAGI, H.; CASTRO, M.B.; PFEIFFFER, W.C.; HARADA,
M.; BASTOS, W.R.; KATO, H. Mercury and methylmercury in fish and human hair from the
Tapajós River Basin, Brazil. The Science of the Total Environment, v. 175, p. 141-150, 1995.
SHIN J. O. Nerve conduction techniques. In: SHIN J. O Clinical Electromyography.Nerve
Conduction Studies. 2a ed. Williams&Wilkins. 1993, p.39-45.
TSUBAKI, T. TAKAHASHI, H. Clinical aspects of methylmercury poisoning in Minamata. In:
Tsubaki, T., Takahashi, H. (eds.) Recents advances in Minamata Diseases Studies. Tokyo,
Japan: Kodansha, 1986, p. 41-57.
WORLD HEALTH ORGANIZATION (WHO). International Program in Chemical Safety
(IPCS). Environmental Health Criteria 101: Methylmercury. Geneva, Switzerland: WHO, 1990.

NIMD Forum 2009 Minamata City, 19―20 February 2009
86
Mercury levels in household members hair and in fish from fishing
villages in Zhoushan, China(Poster Session)
Jinping Cheng*1, Lili Gao1, Xiaojie Liu2, Mineshi Sakamoto2, Wenhua Wang1
1 School of Environmental Science and Engineering, Shanghai Jiao Tong University, Shanghai
200240, China
2 Department of Epidemiology, National Institute for Minamata Disease, Minamata, Kumamoto
867-0008, Japan
Zhoushan Island is situated on the coast of the East China Sea, near Hangzhou and Shanghai.
The offshore area is an important fishing ground, where the total length of the continental
coastline is 1500 km and the total sea area of the fishing ground is about 100 000 km2. The
annual fish catch is about 800 000 t, representing one third of the Chinese national total.
Seafood dominates the diet of the Zhoushan coastal populations, and includes many species of
fish and shellfish, as well as a variety of other invertebrates. According to the dietary survey of
Jiang et al (2005), A healthy adult in the coastal city of Zhoushan consumed 105±182 g fish
meat each day which is greater than the average rate of consumption of marine products in
China as a whole (23 g/person per day). Our previous studies showed that hair Hg levels in
subjects from Zhoushan City were higher (mean 2.44 μg/g for males and 1.94 μg/g for females)
than the levels found in hair samples from subjects in Shanghai, Ningbo, Dalian and Xiamen
districts. This study aims to assess Hg exposure by measuring total mercury (T-Hg) and methyl
mercury (MeHg) in the hair of fishermen and their household members in Zhoushan fishing
village. Factors such as the quantity of fish consumed, age, gender and Hg levels in fish were
investigated.
NIMD Forum 2009 Minamata City, 19―20 February 2009
87
Health benefits and chemical risks associated to dietary habits: fish
consumption, mercury and omega-3 fatty acids (Poster Session)
Domingo JL,1 Bocio A,
1 Martí-Cid R,
1 Llobet JM,
2 Castell V,
3 Mata E
3
1Laboratory of Toxicology & Environmental Health, School of Medicine, "Rovira i Virgili"
University, Reus; 2Toxicology Unit, School of Pharmacy, University of Barcelona, Barcelona;
3ACSA, Department of Health, Generalitat de Catalunya, Barcelona, Spain
In recent years, and based on the importance of fish as a part of a healthy diet, there has been a
notable promotion of fish and seafood consumption. For cardiovascular risk reduction in the
general population, prestigious institutions such as the American Heart Association have
suggested, among other dietary recommendations, to consume fish, especially oily fish, at least
twice a week. Oily fish are rich in omega-3 polyunsaturated acids (PUFAs) such as EPA
(eicosapentaenoic) and DHA (docosahexanoic), which have shown to have protective effects in
preventing coronary heart disease among other important health benefits. However, recent
studies have also shown that fish consumption might also mean a potential source of exposure
to various chemical pollutants. In our laboratory, we determined in 14 edible marine species the
concentrations of EPA and DHA, as well as those of a number of chemical contaminants,
including mercury (Hg). To quantitative establish the intake of these pollutants (risks) versus
that of EPA + DHA (benefits), we designed a simple software, RIBEPEIX
(http://www.fmcs.urv.cat/portada/ribepeix/). The concentrations of EPA, DHA, and chemical
pollutants were used as database of the program. Although it seems quite evident that fish must
be an important part of a balanced diet, to choose the most suitable species in terms of levels of
PUFAs and pollutants, with special attention to Hg, the frequency of consumption, and the meal
size are essential aspects to balance benefits and risks of a regular consumption of fish and
seafood. Recently, we extended that information to a long series of macro- and micronutrients
contained in widely consumed foodstuffs (other than fish and seafood), and with an important
nutritional value. A new web, RIBEFOOD (http://www.fmcs.urv.cat/ribefood/) was designed.
RIBEPEIX and RIBEFOOD may be used as easy tools to optimize the dietary habits of any
subject by increasing the intake of beneficial nutrients and by reducing those of toxic pollutants,
including Hg. They can be useful not only for professionals (cardiologists, general physicians,
nutritionists, endocrinologists, toxicologists, etc.), but also for the general population, as both
are available (free) in Internet.
NIMD Forum 2009 Minamata City, 19―20 February 2009
88
Estimated daily intake of mercury by general population in Korea
(Poster Session)
Kwangsik Park
1, Eun Jung Park
1, Young Hee Chung
2, Sang Hoon Nam
2,
Dae-Seon Kim3
1College of Pharmacy, Dongduk Women's University Seoul Korea
2National Institute of Environmental Research, Incheon, Korea
3School of Environmental Health, University of British Columbia, Canada
Introduction
Even if only a small amount is released to the environment, mercury causes bio-
accumulation in the ecosystem. Mercury accumulation into human body is through not only
digestive organs but also skin or respiration system. According to National Survey for
Hazardous Materials in General Population, Korea, blood mercury concentrations were
4.34ug/L in 2005, 3.80ug/L in 2007.
This study was accomplished to estimate the daily intake of total mercury through food intake
and environmental media by general population in Korea.
Methods
In order to estimate the amount of mercury intake, we used data from reported scientific
papers and governmental statistics. Pollution degrees in environmental media were analyzed
from recent official data under the consideration of area and season. Even if data of the amount
of food intake and pollution were not enough, we tried to use the representative value of them.
Data of human exposure were calculated and combined by environmental media. Exposure
amount through food intake was estimated by foodstuffs under the consideration of intake
amount and mercury content in that food. Then, daily exposure amount was calculated finally.
․Intake through air =
pollution(㎍/m3)x daily respiration(m
3/day) x unit converting factor(10-3㎎/㎍)
body weight(kg)
․ Intake through water was not considered by the reason no mercury was detected in drinking
and raw water in whole country.
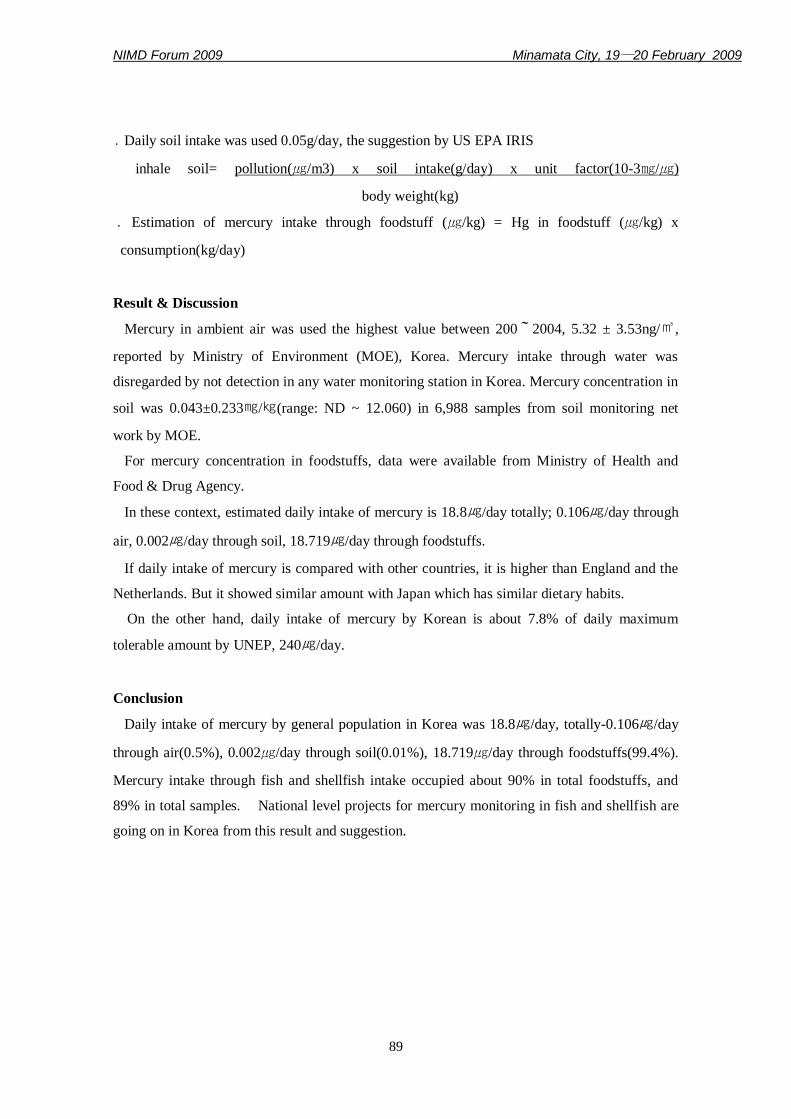
NIMD Forum 2009 Minamata City, 19―20 February 2009
89
․ Daily soil intake was used 0.05g/day, the suggestion by US EPA IRIS
inhale soil= pollution(㎍/m3) x soil intake(g/day) x unit factor(10-3㎎/㎍)
body weight(kg)
․ Estimation of mercury intake through foodstuff (㎍/kg) = Hg in foodstuff (㎍/kg) x
consumption(kg/day)
Result & Discussion
Mercury in ambient air was used the highest value between 200~2004, 5.32 ± 3.53ng/㎥,
reported by Ministry of Environment (MOE), Korea. Mercury intake through water was
disregarded by not detection in any water monitoring station in Korea. Mercury concentration in
soil was 0.043±0.233㎎/㎏(range: ND ~ 12.060) in 6,988 samples from soil monitoring net
work by MOE.
For mercury concentration in foodstuffs, data were available from Ministry of Health and
Food & Drug Agency.
In these context, estimated daily intake of mercury is 18.8㎍/day totally; 0.106㎍/day through
air, 0.002㎍/day through soil, 18.719㎍/day through foodstuffs.
If daily intake of mercury is compared with other countries, it is higher than England and the
Netherlands. But it showed similar amount with Japan which has similar dietary habits.
On the other hand, daily intake of mercury by Korean is about 7.8% of daily maximum
tolerable amount by UNEP, 240㎍/day.
Conclusion
Daily intake of mercury by general population in Korea was 18.8㎍/day, totally-0.106㎍/day
through air(0.5%), 0.002㎍/day through soil(0.01%), 18.719㎍/day through foodstuffs(99.4%).
Mercury intake through fish and shellfish intake occupied about 90% in total foodstuffs, and
89% in total samples. National level projects for mercury monitoring in fish and shellfish are
going on in Korea from this result and suggestion.