Embed Size (px)
Citation preview

NIHR Statistical Group Imaging in Translation Research Meeting
Challenges in the design and analysis of studies evaluating imaging modalities
Pembroke College, Oxford, OX1 1DW Tuesday 1st October 2013
10:00 – 16:00

NIHR Statistical Group: Imaging in Translation Research Meeting
SESSION 1 CHAIR: Professor Doug Altman
10:30 - 10:35 Introduction and welcome Professor Doug Altman, University of Oxford 10:35 - 10:45 Translational research and the NIHR Mark Samuels, Managing Director, NOCRI
10:45 - 11:15 What is translational research and why is it important? Professor Keith Channon, Director, NIHR Oxford BRC
11.15 – 11.45 Imaging technology evaluation for NICE: a physicists perspective Professor Steven Keevil, King's College London 11:45 – 12.15 Statistical considerations: studies evaluating imaging modalities Professor Doug Altman 12:15 - 12:30 Questions & discussion

Translational Research and the NIHR
Mr Mark Samuels NIHR Office for Clinical Research Infrastructure (NOCRI) [email protected]

• To improve health outcomes through advances in research • To improve quality of care by NHS participation in the research process • To strengthen our international competitive position in science • To drive economic growth through investment by life science industries
Why is the Government committed to research in the NHS?

“Life science - and the UK’s role in it - is at a crossroads. Behind us lies a great history of discovery, from the unraveling of DNA to MRI scanning and genetic sequencing. We can be proud of our past, but this government is acutely aware that we cannot be complacent about the future.” David Cameron December 2011
Research and Growth: Strategy for UK Life Sciences

“The old ‘big pharma’ model is becoming more difficult to maintain. In its place is a new focus on translational medicine - more early stage clinical trials with patients, more external innovation, more collaboration.” “This is an ambitious strategy to: •open up universities and business to more collaboration; •invest in the best ideas at an early stage; •remove regulatory barriers; •open up the NHS to new innovations and new clinical trials.”
Research and Growth: Strategy for UK Life Sciences

NIHR established on 1st April 2006 to deliver the strategy set out in Best Research for Best Health
National Institute for Health Research

To improve the health and wealth of the nation through research
Vision

To create a health research system in which the NHS supports:
• outstanding individuals • working in world-class facilities • conducting leading-edge research • focused on the needs of patients and the public
Aim

• Transform research in the NHS • Increase the volume of applied health research, and opportunities to participate in it, for the benefit of patients and the public • Promote and protect the interests of patients and the public in health research • Drive faster translation of basic science discoveries into tangible benefits for patients • Develop and support the people who conduct and contribute to applied health research • Maximise the research potential of the NHS to contribute to the economic growth of the country through the life science industries
Strategic priorities
• Distributed organisation • Focused on the needs of patients • Clear but flexible structure • Maximum devolved decision-making • Maximum local accountability
Structure of the NIHR
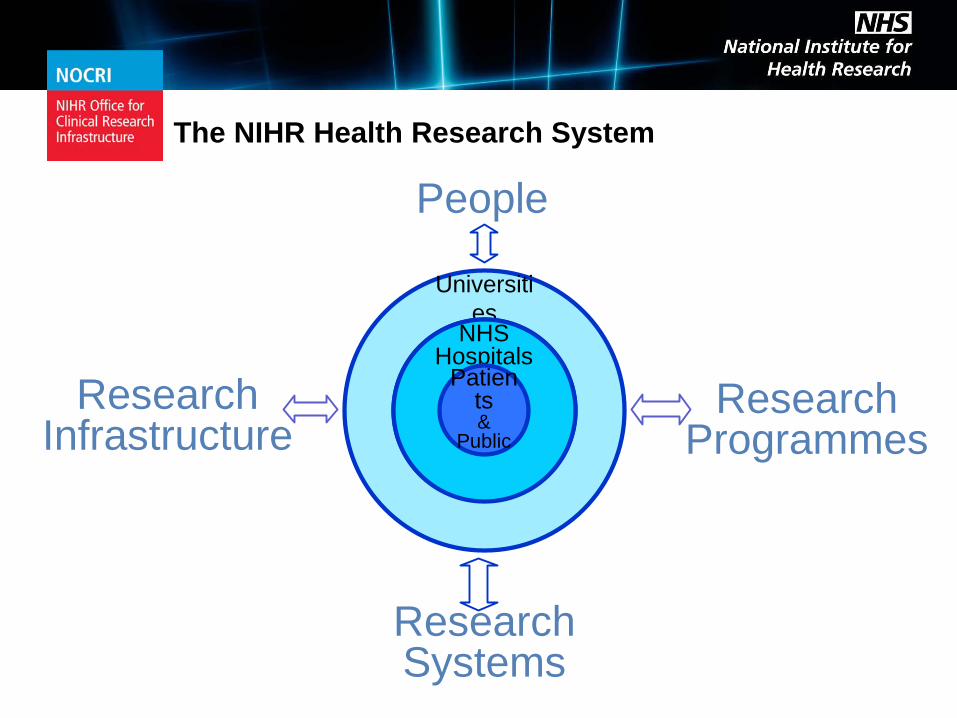
Universities
NHS Hospitals
People
Research Programmes
Patients &
Public
The NIHR Health Research System
Research Systems
Research Infrastructure
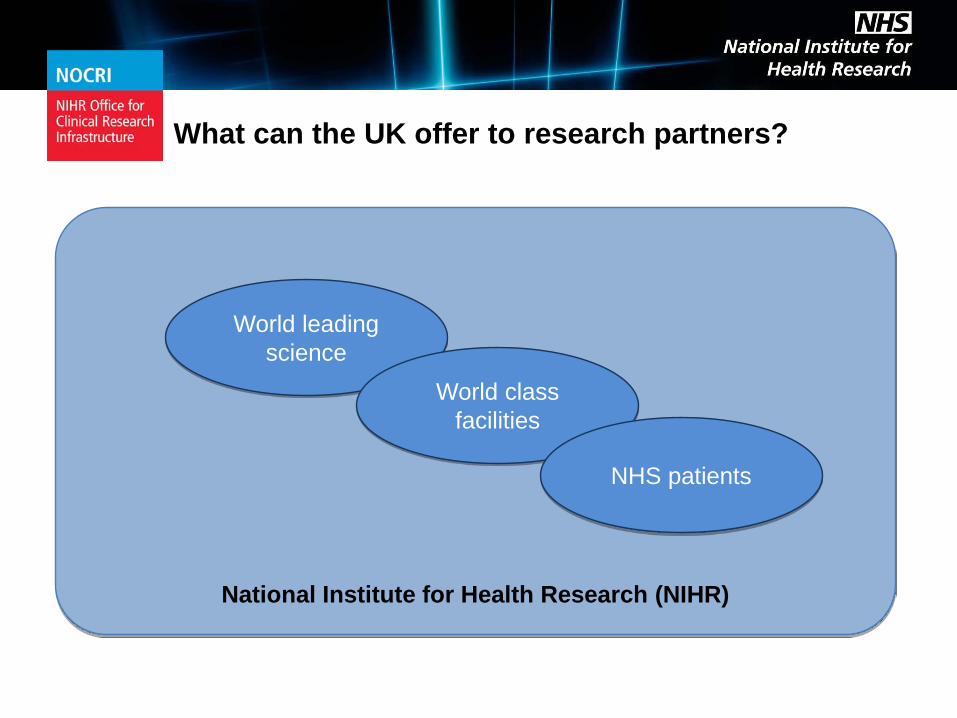
National Institute for Health Research (NIHR)
World leading science
World class facilities
NHS patients
What can the UK offer to research partners?

NIHR Research Infrastructure
> £0.5 billion p.a. investment in relevant infrastructure to support clinical research at all points in the development pipeline
Late-phase clinical research
NIHR Biomedical Research Centres
Early-phase clinical research
Invention Evaluation Adoption
NIHR Biomedical Research Units
NIHR Clinical Research Facilities Experimental Cancer
Medicine Centres
NIHR Clinical Research Network
Healthcare Technology Cooperatives Diagnostic Evidence
Cooperatives

NIHR Clinical Research Network
A single point of contact and entry for all Network research services
Study and protocol feasibility from key opinion leaders and active commercial researchers
Access to a streamlined system for obtaining NHS permission for R&D approvals
Support with study start-up processes, including costing and contract negotiations using standard templates
Dedicated and trained Research Network staff and support services to ensure study delivery at site level
Performance management of the adopted study in partnership with a company
Research Network 'badging' of adopted trials to attract both investigators and patients

Scale of opportunity for research partners
NOCRI supports industry through: • sign-posting • introductions • establishing collaborations • managing relationships
Access via a single point of entry to world class science in world leading institutions and
patients across the NHS

Imaging technology evaluation for NICE: a physicist’s perspective Professor Stephen Keevil, Joint Director, KITEC: King’s Imaging Technology Evaluation Centre


Page 20 Introduction
• Imaging is no longer a purely diagnostic technique: it is increasingly important in treatment planning, guidance and assessment
• Imaging biomarkers have the potential to characterise individual patients, enabling personalised medicine – Improved quality of care through better patient
selection – Reduced costs through identifying non-beneficial
treatments • Imaging makes increasing demands on capital and
revenue budgets – Rapid development requires rapid adoption – But the evidence base is often poor
• Needs an integrated approach involving manufacturers, technical experts and clinical end users

Page 21 A long time ago, in a galaxy far, far away…
UEEP
GCAT
PACSnet
FAXIL

Page 22 A long time ago, in a galaxy far, far away…
STB MDD MDA MHRA PASA
NICE

FAXIL
Page 23 Coming up to date…
UEEP
GCAT
PACSnet

Page 24 Areas of work
• Assessment reports • Facilitating collaborative research into clinical and
cost utility • Specification, compilation and analysis of
databases and registers • Systematic reviews and meta-analysis • Technical evaluation to advise on effective use
• Much broader than previous assessment centres:
requires a multidisciplinary approach • An idea task for an Academic Health Science
Centre!

The tender... Page 25
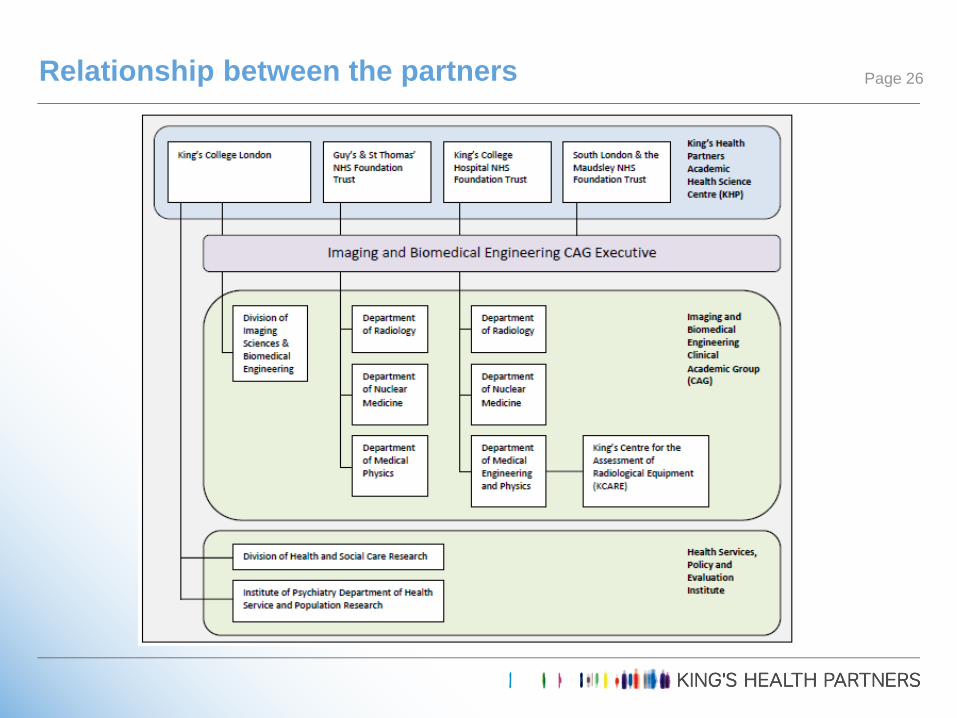
Relationship between the partners Page 26

The broader picture Page 27

● Tender submitted 9th December 2010
● Final round presentations scheduled for 22nd December 2010, postponed (on 21st December!) due to snow
● January 2011- March 2012 negotiations!
● Contract awarded March 2012
● So 2 years of 3 year term remaining
● Work slow to ramp up, very busy since Christmas 2012
Outcome Page 28

● To promote faster uptake of new medical technologies in the NHS
● To encourage collaborative research, in both industry and the NHS, to generate evidence on the clinical utility and/or healthcare system benefits of selected technologies
NICE Medical Technologies Evaluation Programme (MTEP) Page 29

● Technology is a medical device (defined in EU Directive 93/42/EEC, as amended)
● Technology is new or innovative technology
● Technology has a CE mark, or this is expected within 12 months
● Technology is available in the NHS, or manufacturer plans to launch it in the NHS
MTEP eligibility criteria Page 30

● Technology notified by manufacturer / sponsor
● NICE consults with Expert Advisers
● Medical Technologies Advisory Committee selects suitable technologies September MTAC: 2/6 technologies selected Reasons for rejection: inadequate clinical evidence,
inadequate economic evidence, not unique…
● Routed to MTEP if technology: is likely to be cost saving or cost neutral can be evaluated as a single technology can be evaluated on a short timescale
● Or can be routed to other programmes
MTEP selection Page 31

● Project allocated to an External Assessment Centre (EAC)
● NICE prepares and consults on scope, defining disease(s), patients and technology covered by the assessment, outcomes, relevant comparators
● Manufacturer submission of clinical evidence (2 weeks)
● Manufacturer submission of economic evidence (6 weeks)
● EAC assessment report submitted (10 weeks)
● EAC presents at MTAC meeting. MTAC produces draft recommendations (c15 weeks)
● Final guidance issued following consultation (c32 weeks)
MTEP assessment Page 32

● c100 pages
● c100 person-days of work
● Critique of clinical evidence: search strategy, study selection
● Critique of study methodology and sponsor’s analysis and synthesis
● Additional work on clinical evidence
● Critique of economic evidence: search strategy, study selection
● Critique of cost model
● Additional work on economic evidence
Contents of assessment report Page 33

● Assessment report: 2 (neither imaging related!)
● Initial product assessment: 62
● Research facilitation: 4
● Establishment of registers: 1
● Technical advice / horizon scanning: 4
● Expressions of interest: 8
● Miscellaneous: 3
Workload Page 34

● Very few imaging devices are coming through the programme New or novel ‘single technologies’ that
reduce costs are rare Incremental development by several
companies in parallel: about methods, not manufacturers
The Diagnostics Assessment Programme (DAP) can consider (1) multiple technologies, (2) cost-effectiveness
There is little evidence of impact of imaging on patient outcomes
● We are being used as a generic assessment centre and a source of specialist advice on imaging
Comments: nature of allocated work Page 35
● Workload is unpredictable, new projects can be assigned at any time
● Timescales are extremely demanding, particularly if additional work is needed
● There is limited scope for extensions
● Variation of project plans requires discussion and approval by NICE
● All EACs are required to respond to all calls for expression of interest
● EoIs are assessed according to rigid criteria: it is possible to ‘know too much’!
Comments: process and timescales Page 36

● Products are often quite new, with little published evidence available
● Manufacturers are often SMEs, with limited resources/expertise for systematic review and analysis
● Significant additional work can be required from the EAC
● NICE has a relatively low threshold for evidence ● RCTs not expected ● Considerable reliance on expert opinion
● Products have already been filtered by MTAC: a positive outcome is desired at this stage
Comments: quality of evidence and submissions Page 37

● Expert advisers need to be ratified by professional bodies before they can be formally consulted, which can introduce delay
● Consultation with expert advisers is formal and documented
● We cannot use local experts as expert advisers if we also want to involve them in production of the report
Comments: expert advisers Page 38

● Only 2 years left when the contract was signed: difficult to recruit good people to fixed term contracts
● Work can be complex, requiring significant senior level input
● Difficult to coordinate work of four different teams across three campuses
● Difficulties at NHS-university interface: finance, HR, IT…
Comments: practical difficulties Page 39

● It’s been challenging but interesting; we’re keen to continue
● We and NICE have learned a lot from the process
● Current contract expires March 2014
● New call for tenders was expected in late June
● At the time of writing, we are still waiting…
The future Page 40

NIHR Statistical Group: Imaging in Translation Research Meeting
SESSION 2 CHAIR: Professor Janet Peacock
13:15 – 13:30 Challenges for the statistician in designing studies in imaging Professor Janet Peacock, King's College London
13:30 – 13:45 Challenges of functional & structural MRI in a clinical trial Dr Thomas Nichols, University of Warwick
13:45 – 14:00 CASE STUDY 1: T1 mapping - bringing imaging biomarker into clinical practice
Dr James Moon, NIHR University College London and UCLH BRC
14:00 – 14:15 CASE STUDY 2: Tracking eye gaze during radiologist interpretation of endoluminal 3D CT Colonography
Dr Tom Fanshawe, University of Oxford

NIHR Statistical Group: Imaging in Translation Research Meeting
SESSION 2 CHAIR: Professor Janet Peacock
14:15 - 14:30 CASE STUDY 3: 1000 cardiac phenomes project - using computational anatomy to understand heart disease
Dr Declan O'Regan, Imperial College London
14:30 – 14:45 CASE STUDY 4: Diagnostic performance of [11C]choline PET/CT versus MRI in prostate cancer nodal staging: Research Challenges
Dr Amar Challapalli, NIHR Imperial BRC &CRUK-EPSRC-MRC-NIHR Comprehensive Cancer Imaging Centre
14:45 - 15:00 CASE STUDY 5: Imaging biomarkers in colorectal cancer Dr Gina Brown, NIHR Royal Marsden & ICR BRC
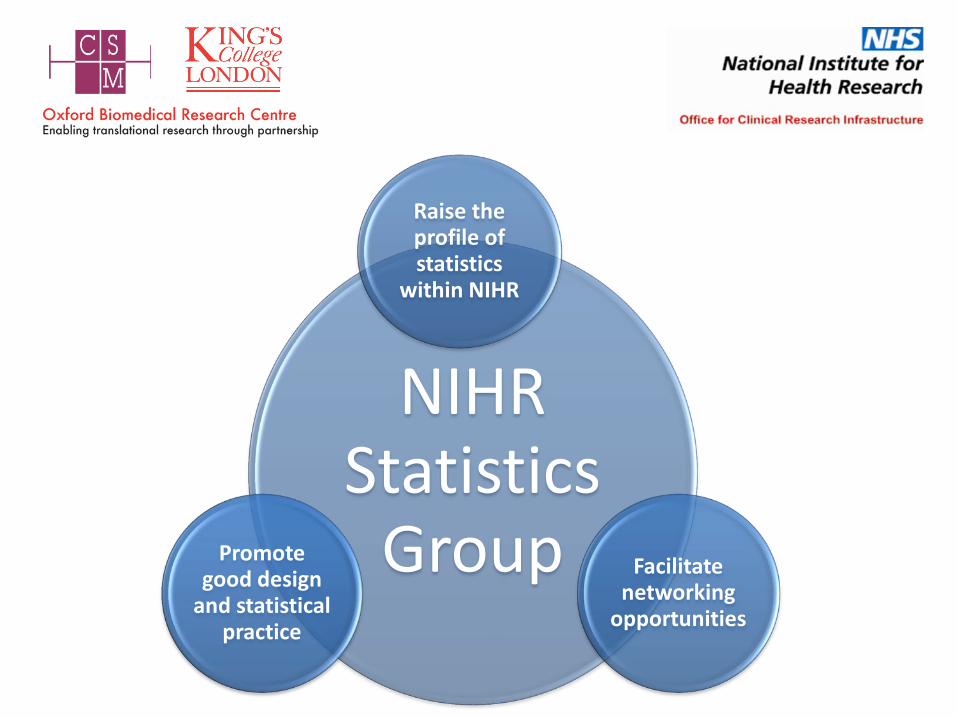
NIHR Statistics
Group
Raise the profile of statistics
within NIHR
Facilitate networking
opportunities
Promote good design
and statistical practice

NIHR Statistics Group • Established 2011 • Educational meetings and workshop events • Identifying statisticians for DMCs and TSCs [email protected] Email: [email protected] Subject: BLANK Message: SUBSCRIBE STAT-LINK Firstname Lastname • Future: mentoring schemes and training

• We are looking for statisticians to join the working committee
• We are looking for institutions who would be willing to host an event
Email: [email protected]

Surgical Clinical Trials Workshop A joint workshop for NIHR statisticians and trainee surgeons
on designing, running and analysing surgical studies.
Wednesday 12th February 2014 University of Birmingham

Challenges for statisticians with studies in imaging
Janet Peacock
Division of Health and Social Care Research, King’s College London; NIHR Biomedical Research
Centre at Guy’s and St Thomas’ NHS Foundation Trust and King's College London
NIHR Statistics Group: Imaging in Translational Research University of Oxford 1st October 2013

What do statisticians do?
• Interdisciplinary team work – Design – Analysis – Interpretation of results – Reporting/presenting results
– Methodological issues
• Both new and existing research
• Statistical thinking

Eg designing an evaluation
• What is the research question? • Or what question does the data answer?
Eg: is a new imaging device better than current one? • How assess ‘better’? • Technological /clinical outcome?
• eg same measurements, diagnostic accuracy, length of stay, mortality etc

What design for evaluation?
• What design will answer the question? • Or what question does design answer?
• Gold standard is randomised controlled trial
Some issues are: • blinding for patient, researcher, assessor • Incomplete data
• Practicality may dictate observational study Some issues are: • Data quality • Comparability of groups & interpreting differences seen

Analysis
What approach to analysis?
• Standard method? • Multiple approaches? • Assumptions met? • Straightforward to interpret? • Easy to communicate? • Clinically meaningful?

Reporting and interpreting results
• Transparent reporting of methods, assumptions, results • Selection of results to present (Clear tables, figures; all subjects accounted for, estimates & CIs) • Conclusions mesh with data in all parts of document cf abstracts

Summary
• Statisticians work collaboratively to: -- design and analyse studies to answer important clinical questions -- review research conducted by others
• Statisticians develop methodological solutions to problems
• Aim of statistics in medical research is always to balance statistical rigour with clinical meaningfulness
Clinical meaning
Statistical rigour
Tracking eye gaze during radiologist interpretation of endoluminal 3D CT
colonography
Tom Fanshawe Department of Primary Care Health Sciences
University of Oxford

NIHR Programme Grant to investigate diagnosis of colorectal cancer using imaging technologies Collaborators include: Steve Halligan (UCL, lead) Emma Helbren (UCL, radiology) Susan Mallett (University of Oxford, statistics) Peter Phillips (University of Cumbria, image perception)

Background
• Bowel cancer has 6% lifetime prevalence in the UK • 17,000 deaths/year in the UK, ~50% mortality rate • Symptoms common, so diagnosis must be rapid,
acceptable to patients, and cost-effective
• Computed tomographic (CT) colonography: CT scanning + 3D imaging
• ‘Virtual colonoscopy’

Reader (radiologist) navigates an endoluminal reconstruction of the colon

Target for identification in this study is adenomatous polyps – precursors of colon cancer


Diagnosis may be assisted by the presence of an indicative mark generated by a computer aided detection (CAD) system (Vitrea, Vital Images)

Early appearance of CAD mark
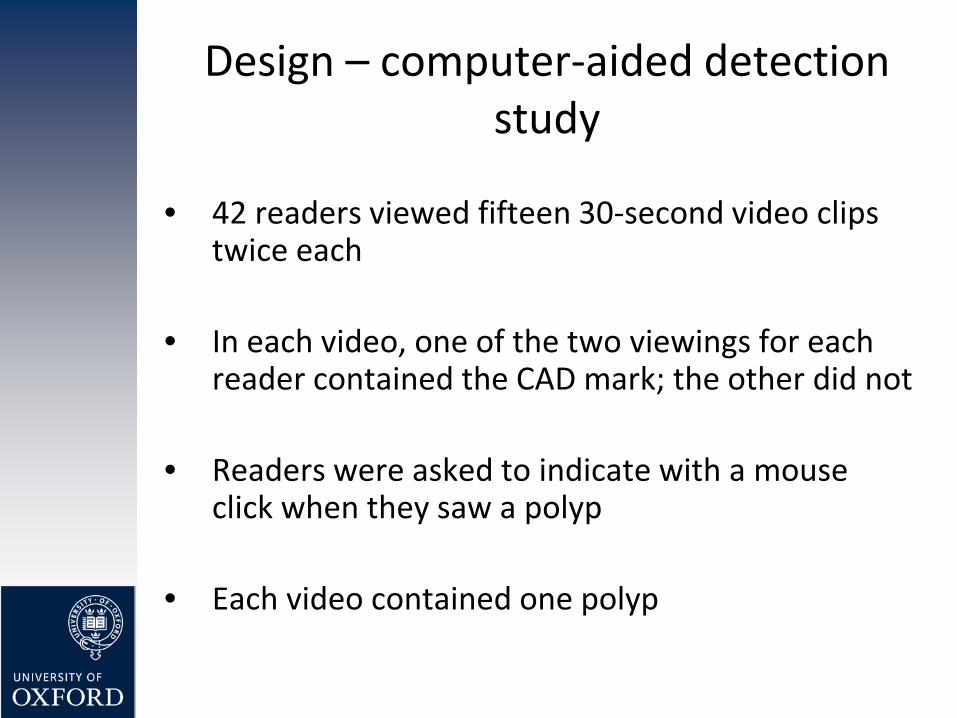
Design – computer-aided detection study
• 42 readers viewed fifteen 30-second video clips
twice each
• In each video, one of the two viewings for each reader contained the CAD mark; the other did not
• Readers were asked to indicate with a mouse click when they saw a polyp
• Each video contained one polyp

Eye tracking


Strategy
• Main interest is in whether gaze is directed at the polyp
• Define a ‘pursuit’ of the polyp as a period when the gaze is directed: • Within 50 pixels of the boundary of the polyp • For at least 100ms of consecutive measurements

Distance to polyp

Issues in data analysis
• Reader- and case-specific measurement error • Missing data
• Multiple imputation
• Hierarchical data structure • Random effects for reader and case
• Different distributional forms for different outcomes (continuous, binary, rate, time-to-event), including zero-inflation

Results – single case
• CAD increased average time spent looking at the polyp
Rea
ders

Diagnostic accuracy
• Presence of CAD resulted in an increase in number of correct polyp identifications • No change in number of incorrect identifications

Results Additionally, CAD is associated with:
• Shorter time to first pursuit of polyp
0.58 to 0.48 seconds • Quicker polyp identification
3.24 to 3.01 seconds • Increased rate of pursuits before polyp identification
0.69 to 0.78 pursuits per second
• A ‘distractor’ effect Readers spend 24% of time looking at the CAD mark even when polyp not visible

Summary
• This is the first study to examine visual search during 3D CT colonography viewing
• Addition of a CAD mark held reader gaze and disrupted usual visual search patterns
• The CAD mark did not cause significant diagnostic confusion, and reduced identification error rate

Phillips, P. et al (2013). Method for tracking eye gaze during intepretation of endoluminal 3D CT colonography. Radiology 267: 924-931. Halligan, S. et al (2011). Incremental benefit of computer-aided detection when used as a second and concurrent reader of CT colonographic data: multiobserver study. Radiology 258: 469-476. Drew, T. et al (2012). When and why might a computer-aided detection (CAD) system interfere with visual search? An eye-tracking study. Acad Radiol 19: 1260-1267. Dr T.R. Fanshawe Department of Primary Care Health Sciences University of Oxford [email protected]

1000 Cardiac Phenomes Project
Dr Declan O’Regan MRC Senior Clinician Scientist
CSC MR Facility

How do genes influence complex biological systems in humans?
Phenotyping
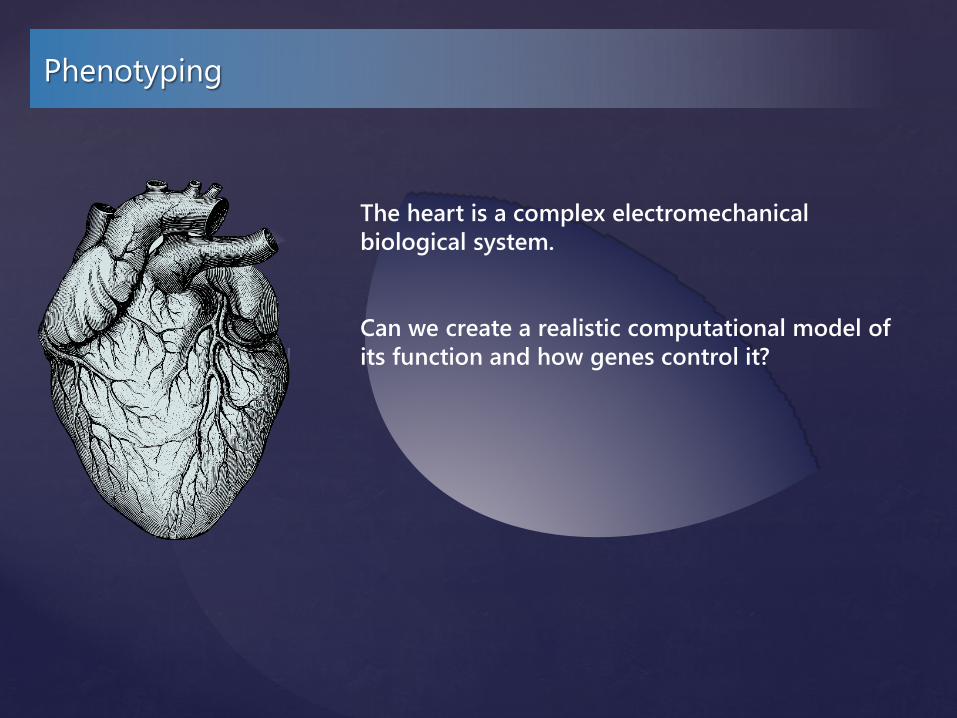
The heart is a complex electromechanical biological system. Can we create a realistic computational model of its function and how genes control it?

Phenotyping
Let’s take the simple but important phenotype of left ventricular hypertrophy: Thickening of the heart muscle Predicts all cause mortality Amenable to treatment Heritability estimate 20 – 70% Both environmental and genetic interactions

Cardiac MR Imaging

Cardiac MR Imaging
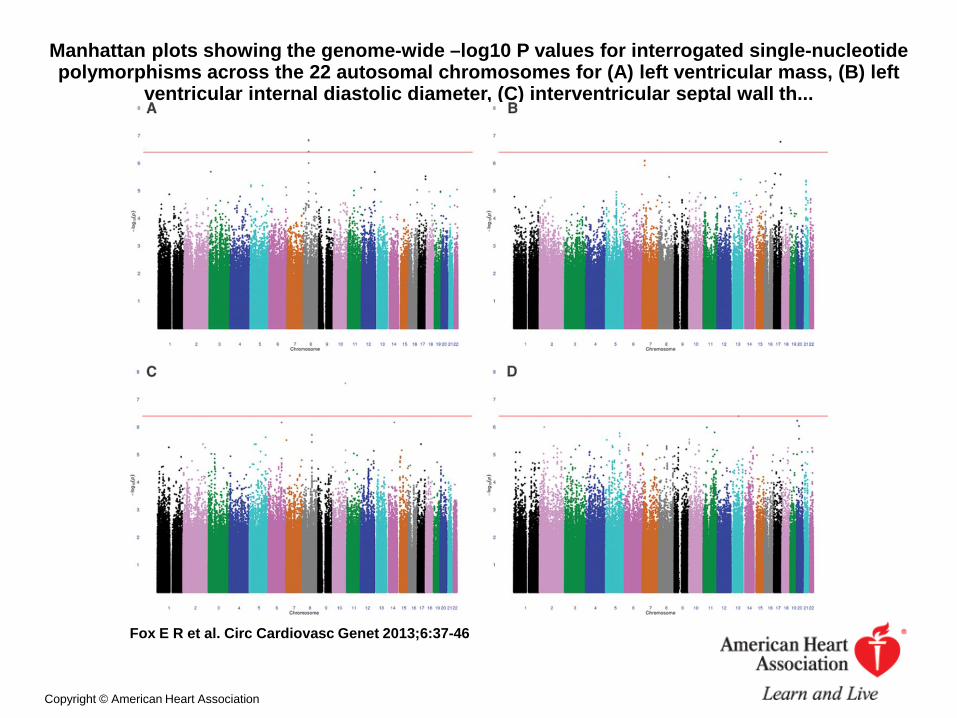
Manhattan plots showing the genome-wide –log10 P values for interrogated single-nucleotide polymorphisms across the 22 autosomal chromosomes for (A) left ventricular mass, (B) left
ventricular internal diastolic diameter, (C) interventricular septal wall th...
Fox E R et al. Circ Cardiovasc Genet 2013;6:37-46
Copyright © American Heart Association

Conventional phenotyping
Limitations of current techniques: Does not model the heart as an organ system
Measurements are subjective and global
Inconsistent comparisons between subjects
Complex traits of motion and strain not included

Cardiac atlas
Manually labelled images of the heart are used to guide segmentation and registration

Segmentation & Co-registration
Iterative segmentation and co-registration with decision fusion.
Target image Atlas 1
Atlas 2

3D whole heart MRI
High resolution MR imaging improves the precision of automated analysis
2D 3D

Statistical strategies
Cardiac Phenotypes Covariates
Multivariate analysis Landmark variables Shape analysis
AGCAAATG SNPs
Age|Gender|BP Demographics
Global Local
Associations
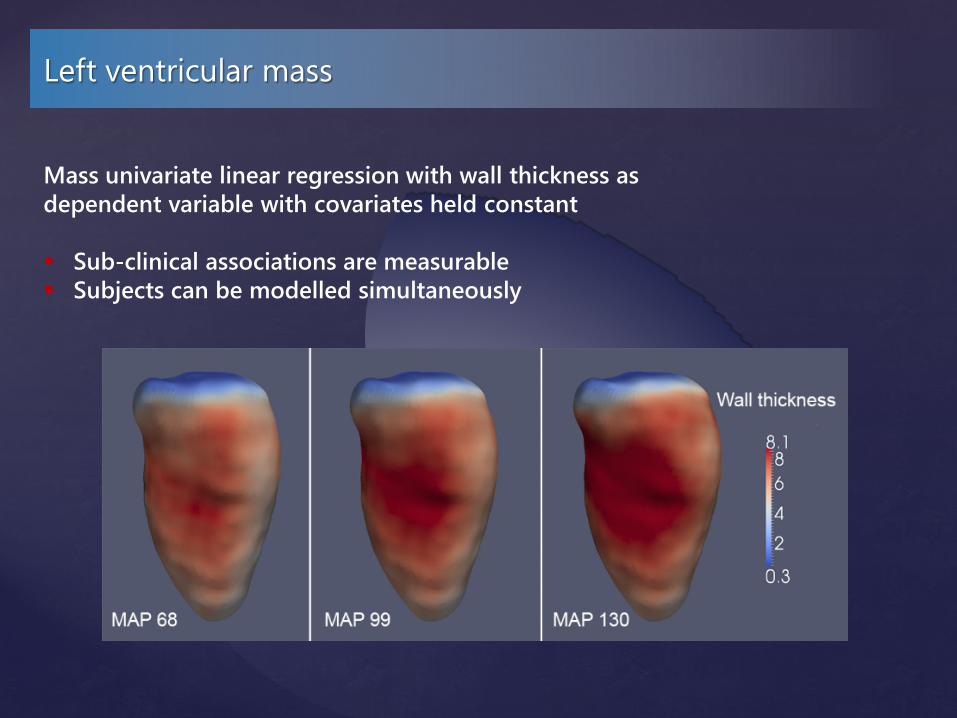
Left ventricular mass
Mass univariate linear regression with wall thickness as dependent variable with covariates held constant Sub-clinical associations are measurable Subjects can be modelled simultaneously

Voxelwise non-parametric tests
Compare wall thickness voxel by voxel between gene variants and controls Bonferroni correction for multiple testing Analysis of covariance to correct for blood pressure and age etc.
Regression coefficients

Sparse regression
To detect causal SNPs across the genome Large multiple testing problem Ignores dependencies between SNPs
Sparse regression Changes problem from “significance of each predictor” to “subset of best predictors” Multi-task regression incorporates sparse structure in genotypes and phenotypes
Regression coefficients
genes
SNPs
pathways

Shape analysis
Assess similarity between phenotypes without a priori hypotheses Manifold learning finds a low-dimensional representation of a complex
shape Finds clusters of similar phenotypes on a non-linear Laplacian Eigenmap

Computational imaging-genetics
Imaging-genetics is a powerful tool for understanding the physiological effect of genetic and environmental factors on the human heart. Future work: Test regression models with initial sequencing data
Integrate strain and motion data into physiological models
Explore phenotypic classification using manifold learning
Support vector machine diagnosis
Disease-specific atlases

MRC Clinical Sciences Centre Prof Stuart Cook Dr Declan O’Regan Dr Enrico Petretto Dr Antonio de Marvao Giuliana Durighel Tamara Diamond Laura Monje Garcia Marina Quinlan Royal Brompton Hospital Dr Paul Barton Dr James Ware Dr Rachel Buchan Dr Angharad Roberts
Department of Computing Prof Daniel Rueckert Dr Wenzhe Shi Department of Mathematics Dr Giovanni Montana Dr Chris Minas Bioinformatics Support Service Mark Woodbridge Department of Medicine Dr Tim Dawes Prof Martin Wilkins Visiting workers
Dr Ben Corden Dr Niall Keenan

Diagnostic performance of [11C]choline PET-CT vs. MRI in prostate cancer nodal staging: Research challenges.
Dr. Amar Challapalli Clinical Research Fellow, Imperial College, London

Nodal staging in Prostate cancer
• LN metastases are seen in 25-30% of pts
• LN involvement reduces disease free survival from 85% to 50%
• Pelvic LND – gold standard • Invasive • 4-5% morbidity • Expensive, needs hospitalization • May not be able to sample all potential nodal areas
• Current anatomic imaging has limited diagnostic accuracy • Pooled sensitivity – 39% • Pooled specificity – 82%
Hovels et al, Clin Radiol 2008

Why Choline
•The increased choline peak is due to altered PL metabolism. •No GPC-> PCho switch. May be increased CK or PLA activity or Choline transport.
Ackerstaff et al, Can Res 2001: 61; 3599
[18F]FDG [11C]Choline
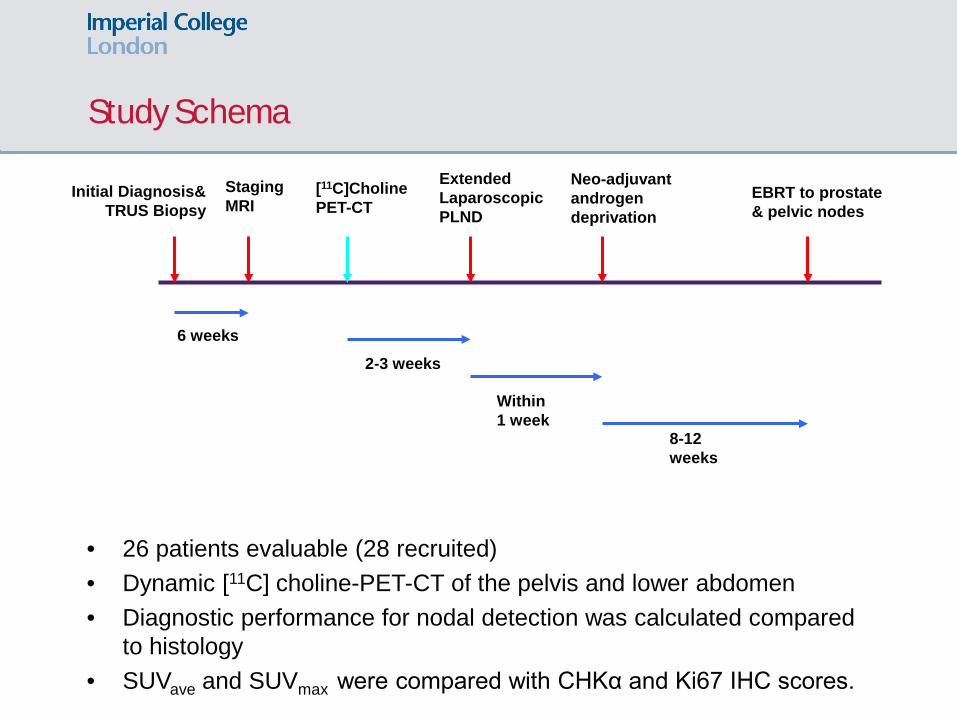
Study Schema
Initial Diagnosis& TRUS Biopsy
Staging MRI
[11C]Choline PET-CT
Extended Laparoscopic PLND
Neo-adjuvant androgen deprivation
EBRT to prostate & pelvic nodes
6 weeks
2-3 weeks
Within 1 week
8-12 weeks
• 26 patients evaluable (28 recruited) • Dynamic [11C] choline-PET-CT of the pelvis and lower abdomen • Diagnostic performance for nodal detection was calculated compared
to histology • SUVave and SUVmax were compared with CHKα and Ki67 IHC scores.

Criteria for nodal involvement
• MRI:
• [11C]Choline PET:
• 5 point scale for ROC analysis MRI [11C]Choline PET/ PET-CT Nodes <4mm or not seen Definitely normal Nodes = 4 – 5.9 mm Probably normal (more likely to be physiological) Nodes = 6 – 7.9 mm Indeterminate (equally physiological/ pathological) Nodes ≥ 8mm but <10mm Probably abnormal (more likely to be pathological) Nodes ≥ 10mm Definitely malignant
0.8 >10 mm

Sample size calculation
• This was a feasibility/pilot study • We were aiming to recruit about 10-12 node positive patients
HIGH RISK GROUP
(>30% risk of nodal disease)
21
3x
NODE POSITIVE
(MRI: ~75% Sensitive)
7
1x
7 + 5

Results
• 406 lymph nodes, in 26 patients, were assessable.
• 27 (6.7%) involved pelvic nodes at eLPL were detected in 9 patients.
• 17 out of the 27 involved nodes were sub-centimetre.
Nodal size No of MRI [11C]choline [11C]choline
(mm) Lymph
nodes (LN) +
(%) PET +
(%) PET-CT +
(%)
0.1 – 1.9 1 0 (0) 0 (0) 0 (0)
2 – 4.9 4 0 (0) 0 (0) 1 (25)
5 – 9.9 12 0 (0) 4 (33) 4 (33)
≥ 10 10 5 (50) 7 (70) 9 (90)

Nodal Analysis on MRI
• 5 nodes TP: median maximum diameter 11mm (9 – 21 mm)
• 22 nodes FN • 18 were sub centimetre • 4 nodes > 1 cm missed due to clustering
• 5 nodes in 4 pts FP • Sampling error • Reactive EI nodes
• Sensitivity – 50% • Specificity – 72.2%

Nodal Analysis on [11C]choline PET-CT: TP Nodes
• 14 nodes in 7 patients were TP • Median maximum diameter: 9mm (4 – 20 mm) • 13 nodes were FN – micro metastases

Nodal Analysis on [11C]choline PET-CT: FP Nodes
B
• 6 nodes in 4 patients were FP • Reactive Ext iliac nodes • Sampling error

[11C]Choline uptake in pelvic nodes

Diagnostic Performance
Imaging modality TP FN FP TN Sensitivity Specificity
[11C]Choline PET-CT 7 2 3 14 77.7 82.4
[11C]Choline PET-CT 14 13 6 373 51.9 98.4


Conclusions
• [11C]choline PET-CT can be used as a non-invasive means of staging pelvic lymph nodes in prostate cancer - highly specific and more sensitive than PET alone or MRI
• High specificity - selecting out patients with high risk prostate cancer who may not need pelvic radiotherapy or enable dose escalation
• [11C]choline PET-CT could be used as a non-invasive surrogate for CHK expression

Prostate RT Planning: A Paradigm shift
Würschmidt et al, Radiation Oncology 2011

Research Challenges
• Duration of recruitment
• Single centre vs. Multi centre
• Co-ordination with Nuclear Medicine Radiologists/ Urologists/ Oncologists/ Pathologists
• Sample size
• Funding for the scans
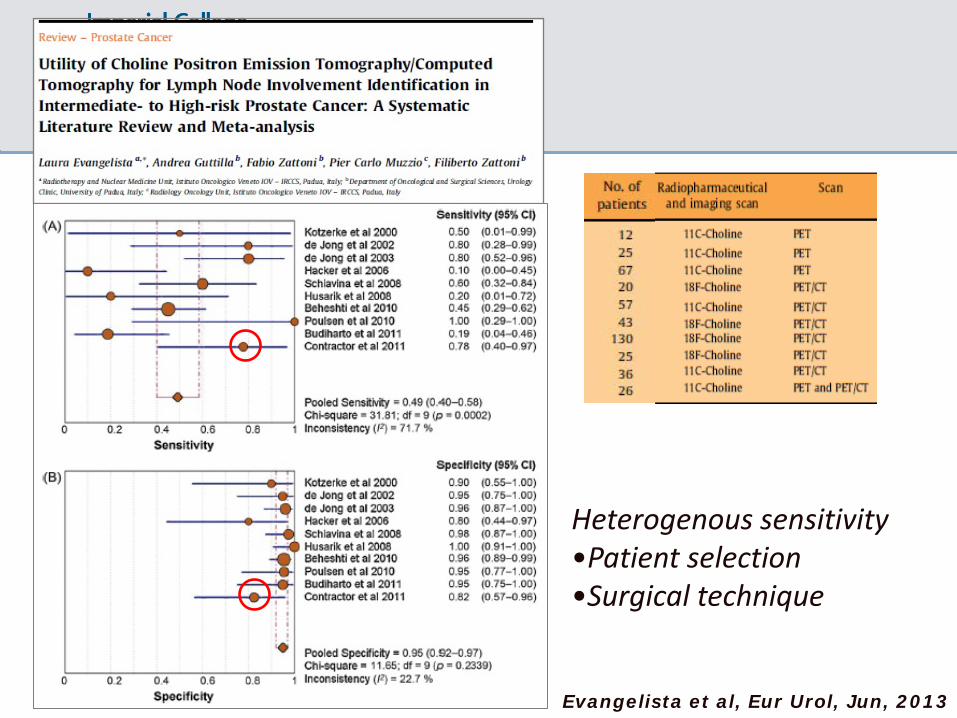
Heterogenous sensitivity •Patient selection •Surgical technique
Evangelista et al, Eur Urol, Jun, 2013


NIHR Statistical Group: Imaging in Translation Research Meeting 15:30 – 16:00 Delegate feedback and panel questions SESSION 3 CHAIR: Professor Doug Altman
Dr Tom Fanshawe Mr Mark Samuels Dr Declan O’Regan Prof Steven Keevil Dr Gina Brown Prof Janet Peacock Dr James Moon Dr Amar Challapalli


![Lecture 22: Statistical Machine Translation€¦ · Statistical Machine Translation We want the best (most likely) [English] translation for the [Chinese] input: argmax English P(](https://img.pdfslide.us/doc/110x75/5f8300468b40600d3c195d38/lecture-22-statistical-machine-translation-statistical-machine-translation-we-want.jpg)