Embed Size (px)
Citation preview
Collection efficiencies of an electrostatic sampler withsuperhydrophobic surface for fungal bioaerosols
T. Han1, Y. Nazarenko1, P. J. Lioy2,3, and G. Mainelis1
1Department of Environmental Sciences, Rutgers University, New Brunswick, NJ, USA
2Environmental and Occupational Health Sciences Institute, Piscataway, NJ, USA
3RWJMS-UMDNJ, Piscataway, NJ, USA
Abstract
We recently developed an electrostatic precipitator with superhydrophobic surface (EPSS), which
collects particles into a 10- to 40-μl water droplet allowing achievement of very high
concentration rates (defined as the ratio of particle concentration in the collection liquid vs. the
airborne particle concentration per time unit) when sampling airborne bacteria. Here, we analyzed
the performance of this sampler when collecting three commonly found fungal spores –
Cladosporium cladosporioides, Penicillium melinii, and Aspergillus versicolor – under different
operating conditions. We also adapted adenosine triphosphate (ATP)-based bioluminescence for
the analysis of collection efficiency and the concentration rates. The collection efficiency ranged
from 10 to 36% at a sampling flow rate of 10 l/min when the airborne fungal spore concentration
was approximately 105–106 spores/m3 resulting in concentration rates in the range of 1 × 10⁵–3 ×
105/min for a 10-μl droplet. The collection efficiency was inversely proportional to the airborne
spore concentration and it increased to above 60% for common ambient spore concentrations, e.g.,
104–105 spores/m3. The spore concentrations determined by the ATP-based method were not
statistically different from those determined by microscopy and allowed us to analyze spore
concentrations that were too low to be reliably detected by microscopy.
Keywords
Electrostatic precipitation; Bioaerosols; Fungi; Collection efficiency; Concentration rate; ATPbioluminescence
Introduction
Because of increasing concerns over the negative health effects caused by exposures to
bioaerosols (airborne bacteria, fungi, and their metabolites) in various indoor and
occupational environments, numerous studies have been conducted to develop more
accurate tools to quantify and identify such exposures (Adhikari et al., 2009; Aizenberg et
© 2011 John Wiley & Sons A/S
G. Mainelis, Department of Environmental Sciences, Rutgers University, 14 College Farm Rd, New Brunswick, NJ 08901, USA, Tel.:732 932 9800, Ext. 6208, Fax: 732 932 8644, [email protected].
NIH Public AccessAuthor ManuscriptIndoor Air. Author manuscript; available in PMC 2014 May 20.
Published in final edited form as:Indoor Air. 2011 April ; 21(2): 110–120. doi:10.1111/j.1600-0668.2010.00685.x.
NIH
-PA
Author M
anuscriptN
IH-P
A A
uthor Manuscript
NIH
-PA
Author M
anuscript
al., 2000; Burge et al., 1989; Gorny et al., 2002; Karol, 1991; Lin and Li, 1998; Reponen et
al., 2005).
Furthermore, the continuing threat of exposure to biological warfare agents has spurred the
development of new bioaerosol detection systems, and several new bioaerosol samplers
have been suggested as candidates for incorporation into such systems (Carlson et al., 2004;
Seo, 2007). For liquid-based bioaerosol collectors, one performance metric is the
concentration rate, which is a defined as the ratio of particle concentration in the collection
liquid vs. the particle concentration in air per unit time. A new wetted-wall bioaerosol
cyclone was shown to have concentration rates in the range of 5 × 10⁵–6 × 10⁵/min for 1-μm
polystyrene latex particles (PSL) (Hu and McFarland, 2007; Seo, 2007). This cyclone
features a continuous liquid outflow at a rate of 1 ml/min. A briefcase-sized electrostatic
precipitator was shown to have a concentration rate of about 1.5 × 10⁴ (Carlson et al., 2004).
We previously described an electrostatic precipitator with a superhydrophobic surface
(EPSS), which is able to collect airborne particles into very small amounts of liquid (Han
and Mainelis, 2008; Han et al., 2010). This sampler achieved concentration rates exceeding
1 × 10⁶/min for two common test bacteria (Pseudomonas fluorescens and Bacillus subtilis
var. niger) and non-biological polystyrene latex particles. Such a concentration rate is much
higher than that currently achieved by most other bioaerosol samplers. However, the
performance of this sampler has not yet been tested with fungal spores.
Fungal spores range from 1.5 to 30 μm in diameter and are generally larger than bacterial
cells or their spores (Reponen et al., 2005). Fungal spores are usually hydrophobic and their
airborne concentration depends on environmental conditions during their release, e.g., wind
speed and turbulence (Levetin, 1995). Therefore, the performance of liquid-based bioaerosol
samplers when collecting fungal spores could be different from that when collecting
airborne bacteria because of the different physical and biological properties of the particles.
As the airborne fungi are responsible for numerous negative health effects (Burge, 2001), it
is important to estimate bioaerosol sampler performance when collecting such particles.
When testing the performance of any bioaerosol sampler, the collected bacterial and fungal
particles could be analyzed by a variety of methods, including quantitative real-time
polymerase chain reaction, direct light and acridine orange epifluorescence microscopy
(AOEM), culture-based analysis, and others (An et al., 2006; Seshadri et al., 2009; Williams
et al., 2001; Zeng et al., 2004). Among other methods, quantification of adenosine
triphosphate (ATP), a basic energy molecule present in all types of living organisms, has
been recognized as a convenient and reliable method for estimating total microbial biomass
in most environmental samples (Karl, 1980). During the ATP-based bioluminescence
reaction, the amount of emitted light is directly proportional to the ATP content or viable
biomass. This method has been applied to analyze the presence of viable microorganisms in
clean-room facilities (Venkateswaran et al., 2003) and as an indicator of bacterial and fungal
activity in cloud water samples (Amato et al., 2007a,b). It has also been suggested as one of
the methods to monitor the microbiological contamination of spacecrafts/instruments
(Olsson-Francis and Cockell, 2010).
Han et al. Page 2
Indoor Air. Author manuscript; available in PMC 2014 May 20.
NIH
-PA
Author M
anuscriptN
IH-P
A A
uthor Manuscript
NIH
-PA
Author M
anuscript
The output from the ATP bioluminescence assay is recorded as relative luminescence units
(RLU), and RLU varies depending on the species-specific ATP content. In general, it is
recognized that bacterial endospores have a lower ATP content (10−21 mol ATP per spore)
compared to vegetative cells (10−17 mol ATP per cell) (Kodaka et al., 1996). Fungal spores,
however, have a higher ATP content compared to that of vegetative bacterial cells
(Rakotonirainy et al., 2003). As the output of the ATP bioluminescence assay depends on
the microorganism species, the studies mentioned previously used the assay to estimate the
overall presence of viable microorganisms. However, when species-specific calibration
curves relating luminescence intensity with the cell concentration are prepared, one could
use this method to quantify pure cultures. We successfully used this approach to rapidly
quantify bacteria when analyzing the collection efficiency of a bioaerosol sampler (Seshadri
et al., 2009). This method, however, has not been applied for testing the effectiveness of
biosampler collection of fungal spores. As the ATP assay is considered particularly
applicable for monitoring samples from environments with extremely low microbial burden
(Venkateswaran et al., 2003) and is a sensitive and time-saving method for detecting viable
fungal spores (Rakotonirainy et al., 2003), we also investigated the applicability of the
method to test the performance of the EPSS when sampling fungal spores.
Thus, the purpose of this study was twofold: (i) to adapt and calibrate the ATP-based
bioluminescence method for testing aerosol samplers with pure fungal cultures and (ii) to
investigate the performance of the electrostatic precipitator with superhydrophobic surface
(EPSS) when collecting fungal bioaerosols using the ATP method. The EPSS was
challenged with three commonly found fungal spores – Cladosporium cladosporioides,
Penicillium melinii, and Aspergillus versicolor and its performance was tested as the
function of the collecting water droplet size (10 and 40 μl), the airborne fungal concentration
(104–107 spores/m3), and the sampling time (10, 30, and 60 min). In addition, we also
investigated conditions that resulted in the optimum performance of the ATP method for the
quantification of specific fungi, such as the duration of fungal growth prior to harvesting.
Materials and methods
Biological test particles
The fungal species used in this study, C. cladosporioides (ATCC 5899; American Type
Culture Collection, Manassas, VA, USA), P. melinii (ATCC 10469), and A. versicolor
(ATCC 26644), are common in indoor and outdoor environments (Horner et al., 1995;
Madelin, 1994). All cultures were plated onto Sabouraud dextrose agar (Becton Dickinson
Microbiology Systems, Cockeysville, MD, USA) and incubated at room temperature
(approximately 26°C) for seven days. During the optimization of the ATP method, the
incubation time varied from 5 to 21 days. After incubation, about 3 ml of sterile deionized
water was added to each plate and the spores were gently harvested from mycelium using a
spreader. The volume of the resulting spore suspension was increased to 50 ml, and the
spores were harvested by centrifugation at 5050 g for 5 min at 4°C (BR4; Jouan,
Winchester, VA, USA) and then washed five times with sterile deionized water under the
same conditions as described previously (Yao and Mainelis, 2006). The resulting spore
pellet was resuspended in sterile deionized water and then diluted 10-fold several times to
Han et al. Page 3
Indoor Air. Author manuscript; available in PMC 2014 May 20.
NIH
-PA
Author M
anuscriptN
IH-P
A A
uthor Manuscript
NIH
-PA
Author M
anuscript
achieve the target airborne concentration of approximately 105–106 spores/m3 for most of
the experiments, as determined by an Aerodynamic Particle Sizer (APS, Model 3321; TSI
Inc., Shoreview, MN, USA). The final spore suspension was examined under a microscope
to verify that the vast majority (>95%) of particles were spores with very few fragments of
mycelium.
Sampler, experimental setup, and sample collection
The EPSS was described in detail in our earlier publications (Han and Mainelis, 2008; Han
et al., 2010). Briefly, the EPSS is a novel electrostatic precipitator with the shape of a closed
half-pipe and is composed of two main parts: the curved and conductive top surface that
serves as a ground electrode and the flat bottom plate that houses a narrow collection
electrode covered by a superhydrophobic substance (HIREC-1450; NTT Corporation Inc.,
Tokyo, Japan) connected to high voltage. This electrode is positioned slightly below (0.3–
0.5 mm) the surface of the plate for the improved guidance of the collecting droplet. A 3.2-
mm-wide collection electrode was used for 40-μl droplets, while a 2.1-mm electrode was
used for 10-μl droplets. The entire device was positioned at a slight angle (5°) relative to
horizontal. During sampler operation, electrically charged particles are electrostatically
deposited on the collection electrode. At the end of a sampling period, a droplet is
introduced at the top of the collection chamber and it rolls down under gravity removing the
collected particles.
The schematic of the experimental setup is shown in Figure 1. For each test, a 30-ml
suspension of fresh fungal spores in sterile deionized water was aerosolized using a Collison
nebulizer (BGI Inc., Waltham, MA, USA), operated at a flow rate, QA, of 4 l/min. After
aerosolization, the spore-laden air was diluted with a HEPA-filtered air flow, QD, of 36 l/
min. The resulting aerosol stream of 40 l/min was passed through a 2-mCi Po-210 charge
neutralizer. The electrically neutralized bioaerosols then passed through a 0.035-m duct
housing a vertically oriented ionizer (Wein Products Inc., Los Angeles, CA, USA), which
imparted positive charge on the particles (VCHARGE = 12 V/50 mA) as described previously
(Han and Mainelis, 2008; Han et al., 2010). A stable DC power supply (BK Precision,
Yorba Linda, CA, USA) provided power to the ionizer. The positively charged bioaerosol
particles passed through a flow straightener and then entered a cylindrical test chamber
(approximately 0.10 m in diameter and 0.25 m in length), where they were aspirated into the
EPSS, operated at a sampling flow rate, QS, 10 l/min. After a sampling time, t, of 10–60
min, the fungal particles deposited on the collecting electrode were removed by a water
droplet rolling along the length of the electrode under the force of gravity. The water droplet
was collected in a vial. Another stable high-voltage DC power supply (Bertan Associates,
Inc., Valhalla, NY, USA) provided collecting voltage (VEPSS = −7kV) to the EPSS. The
entire experimental setup was housed inside a Class II Biosafety cabinet (NUAIRE Inc.,
Plymouth, MN, USA).
Development of bioluminescence method for the analysis of fungal concentrations
Effect of culture age—The bioluminescence intensity of a sample is proportional to its
ATP content, which, in turn, is proportional to the concentration of biological particles in a
sample (Eydal and Pedersen, 2007). When applying this method for fungi, we followed
Han et al. Page 4
Indoor Air. Author manuscript; available in PMC 2014 May 20.
NIH
-PA
Author M
anuscriptN
IH-P
A A
uthor Manuscript
NIH
-PA
Author M
anuscript
procedures we previously developed for the quantification of bacteria (Seshadri et al., 2009).
However, as the growth time of fungal cultures may affect the intensity of bioluminescence,
the first set of experiments was performed with fungal cultures of different ages: 5, 7, 9, 12,
14, and 21 days to determine the optimum growth time. From each 30-ml suspension
containing the test fungi, triplicate 200-μl aliquots were removed and divided equally
between two 1.5-ml centrifuge tubes: 100 μl for the ATP analysis and 100 μl for analysis by
AOEM. For ATP analysis, the selected volume of fungal suspension (100 μl) was combined
with an equal volume of Bactiter-Glo reagent (Promega Corp., Madison, WI, USA); the
contents were briefly vortexed and then left at room temperature for 9 min. The
luminescence intensity of the resulting suspension was measured by a luminometer (model
20/20n; Turner Biosystems Inc., Sunnyvale, CA, USA) and recorded as RLU. The
luminescence intensity was correlated with the total number of fungal spores in 100 μl
determined by AOEM (Nsample, AOEM) as described below. The ratio of luminescence
intensity (RLU) normalized to the Nsample, AOEM and plotted as a function of culture age for
each fungal species is shown in Figure 2. The highest ratios for C. cladosporioides, P.
melinii, and A. versicolor were 7.7 ± 0.4, 5.9 ± 1.0, and 38.8 ± 7.0 RLU/spore, respectively,
and they were obtained with 7-day-old cultures. Based on these results, a culturing period of
7 days was chosen as optimal for all the subsequent experiments.
Preparation of calibration curves—It is evident from Figure 2 that different fungal
species produce luminescence signals of different strength. Thus, separate calibration curves
were prepared for each test species. In addition, our earlier research (Seshadri et al., 2009)
indicated that to improve the accuracy of the method, the calibration curves should be study-
specific, i.e., they should be prepared using the same sampling protocol that will be used to
collect and analyze actual samples. The calibration curve for each fungal species represents
a relationship between the RLU reading from the luminometer and the total spore counts
obtained by AOEM.
Thus, when preparing the calibration curves, test fungi were aerosolized and spores were
collected by EPSS into 40-μl droplets using the same procedures that were later used to
determine the collection efficiency of the EPSS. The 40-μl samples collected by the EPSS
were increased in volume to 200 μl by adding sterile and purified water and then diluted in a
series of 10-fold serial dilutions ranging from 100 to 10−2. A 180-μl aliquot from each
dilution was divided equally between two 1.5-ml centrifuge tubes: 90 μl for the ATP
analysis and 90 μl for AOEM analysis. Each sample for the ATP analysis (90 μl) was
combined with an equal volume of Bactiter-Glo reagent and its luminescence intensity was
determined. The volume of the second 90-μl aliquot was increased to 1 ml, and the total
concentration of fungi was determined by AOEM.
The calibration curves were obtained by plotting number of spore per 20 μl (half of the
EPSS droplet volume) determined via AOEM vs. the RLU values obtained for 20 μl (Figure
3). The coefficient of determination, R2 = 0.999, was obtained for all three species. The
number of spores in an unknown sample could then be determined based on the RLU value
using the equations shown in Figure 3:
Han et al. Page 5
Indoor Air. Author manuscript; available in PMC 2014 May 20.
NIH
-PA
Author M
anuscriptN
IH-P
A A
uthor Manuscript
NIH
-PA
Author M
anuscript
(1)
where Nsample, ATP is the number of spores in a sample based on the ATP measurement. For
any given spore concentration, the highest luminescence intensity was observed from the C.
cladosporioides spores and the lowest from the P. melinii spores. If the RLU values for P.
melinii were set to 1, then intensity ratios for C. cladosporioides and A. versicolor would be
approximately 11.0 and 4, respectively, for the same concentration. The reliable
quantification ranges allowed by the ATP method and AOEM were 50–5 × 10³ spores/20 μl
for C. cladosporioides, 1.6 × 10³–1.5 × 10⁵ spores/20 μl for P. melinii, and 1.3 × 10²–1.1 ×
104 spores/20 μl for A. versicolor. Quantification of lower spore concentrations was
unreliable because of the properties of individual species (weak signal) and the background
luminosity. All the ATP measurements were performed with water diluents and were
adjusted for average background values for water (RLU = 1500).
When calculating the collection efficiency of the EPSS, the number of collected fungal
spores was determined using the corresponding RLU values and equations shown in Figure
3. As could be seen from the Figure, the calibration equations are quite different for each
fungal species, and, thus, quantification of spores is applicable for pure cultures and not for
mixed bioaerosol samples. On the other hand, as the ATP-based bioluminescence method
allows rapidly quantifying spores in pure cultures, it could be a suitable and time-saving
alternative to microscopic counting, especially for laboratory investigations.
Quantification of fungal spores collected by the EPSS
The number of fungal spores collected by the EPSS was determined by both AOEM (An et
al., 2006), using an Axioskop Imager A1 microscope (Carl Zeiss Micro-Imaging Inc.,
Thornwood, NY, USA), and the ATP bioluminescence method. The volume of the sample
collected by the EPSS (10 or 40 μl) was increased to 200 μl with sterile purified water and
was then divided into two equal 100-μl parts: one for ATP analysis and the other for AOEM
analysis. Each portion was placed into a 1.5-ml centrifuge tube.
For ATP analysis, the first 100-μl aliquot was combined with an equal volume of Bactier-
Glo reagent (Promega Corp.) and luminescence intensity was determined as described
previously.
For AOEM analysis, the volume of the second 100-μl aliquot was increased to 1 ml by
adding sterile purified water and the sample was serially diluted in 10-fold dilutions with
sterilized water to achieve a concentration that could be counted by AOEM. Each slide used
for microscopy was prepared by filtering a 1-ml aliquot of the selected dilution through a
25-mm 0.22-μm porosity black polycarbonate filter (Fisher Scientific, Suwannee, GA, USA)
and then staining it with 1 ml of 100 μg/ml acridine orange solution (Biotium, Inc.,
Hayward, CA, USA) for 15 min. After staining, the filter was mounted on a glass
microscope slide with immersion oil and a cover slip. At least 40 randomly chosen
microscope fields were counted using a 40× objective. The total spore number in each
sample, Nsample, AOEM, was calculated as follows:
Han et al. Page 6
Indoor Air. Author manuscript; available in PMC 2014 May 20.
NIH
-PA
Author M
anuscriptN
IH-P
A A
uthor Manuscript
NIH
-PA
Author M
anuscript
(2)
Here, N is the average spore count in each view field of the microscope, X is the number of
fields for the entire filter (X = 980 for Axioskop A1), and D10-fold is the dilution factor.
Determination of the collection efficiency
The observed efficiency with which spores entering the EPSS were removed from the air
stream inside the EPSS was above 90% as determined in our preliminary tests for our
previous study (Han and Mainelis, 2008). This result was similar to our observation of
similar-sized PSL particles. As the ratio of the number of spores in a droplet(s) vs. the
number of spores drawn into the EPSS during a collection period (reference concentration)
represents the overall collection efficiency of the EPSS, we used it as our primary
experimental metric.
The majority of particles deposited on the collection electrode of the EPSS are removed by
the first-introduced water droplet, as shown in our earlier work with bacteria and
polystyrene particles (Han and Mainelis, 2008; Han et al., 2010). Our preliminary
experiments with fungal spores also indicated that the majority of removable spores were
removed by the first droplet, while the second droplet usually contained 4–5%, and the third
droplet contained 1–2% of removable spores. As the primary goal of the sampler was to
achieve a high concentration rate, the collection efficiency and the concentration rate were
calculated based on the first collecting water droplet.
To determine the reference concentration, fungal spores in the test chamber were
isokinetically collected on a 47-mm membrane filter (Pall Inc., East Hills, NY, USA) and
simultaneously counted with an aerodynamic particle sizer (APS) (model 3320; TSI Inc.)
using an isokinetic probe. Spores collected on a filter were extracted into sterile deionized
water using the procedure described elsewhere (Wang et al., 2001). The number of spores in
the resulting suspension was determined by AOEM and compared with the concentration
measured by the APS. It was found that the two number concentrations (APS reading vs.
reference filter) agreed within 9.8%, which was deemed an acceptable agreement given the
inherent uncertainty in microorganism counting by microscopy (the standard deviation is
usually approximately 20%). Thus, to simplify our experimental procedures, the reference
spore number was provided by the APS and the collection efficiency of the EPSS, η, was
determined as:
(3)
Here, Nsample is the number of spores collected in a water droplet (10 or 40 μl) as
determined either by the AOEM (Nsample, AOEM) or the ATP (Nsample, ATP) method;
Nreference is the reference spore number measured by the APS, RAPS is the average spore
concentration (#/cm3) measured by the APS every 20 s for a 10-min sampling time (every
Han et al. Page 7
Indoor Air. Author manuscript; available in PMC 2014 May 20.
NIH
-PA
Author M
anuscriptN
IH-P
A A
uthor Manuscript
NIH
-PA
Author M
anuscript
60 s for 30 min and every 120 s for 60-min sampling time), Qs (l/min) is the sampling flow
rate of the EPSS, and t (min) is the sampling time. The concentration rate, which is a ratio of
particle concentration in the collection liquid vs. the airborne particle concentration per time
unit, can also be expressed as follows (Han and Mainelis, 2008):
(4)
where V is the droplet volume (l).
The effect of the sample analysis method (AOEM vs. ATP) for different fungi and different
droplet sizes was analyzed using ANOVA.
Results and discussion
Figure 4 shows the representative number concentration and particle size distributions of
airborne C. cladosporioides, P. melinii, and A. versicolor spores measured by the APS
averaged over 10-min period. The mode diameter for C. cladosporioides, P. melinii, and A.
versicolor are approximately 2.0, 2.1, and 1.7 μm, respectively.
Figures 5 and 6 show the collection efficiency and the resulting concentration rate of the
EPSS, respectively, when sampling fungal spores at 10 l/min and using water droplets of 10
and 40 μl to remove the collected particles. The collection efficiency, η, was determined for
airborne spore concentrations of approximately 105–106 spores/m3 which, as was
determined in the preliminary experiments, could be comfortably counted via microscopy
without dilution. The sampling time in these tests was 10 min, and the number of collected
spores was determined by the AOEM and ATP methods. As could be seen from Figure 5,
the collection efficiencies of the EPSS measured by the ATP and AOEM methods were 21 ±
2.3% and 21 ± 0.4% for C. cladosporioides, 36 ± 2.4% and 36 ± 2.0% for P. melinii, and 25
± 2.8% and 23 ± 2.7% for A. versicolor when using 40-μl collection droplets. For each
analysis method and for each spore type, the collection efficiency was lower with the
smaller water droplet (10 μl) compared to the larger droplet (40 μl). The highest decrease,
approximately 50%, was observed for C. cladosporioides. For the other two fungi, the
decrease was 20–30%. A similar dependence of the collection efficiency on the size of the
collecting droplet was observed when testing with PSL particles of different sizes. The
decrease was attributed to a less efficient removal of particles deposited on the collection
electrode by a smaller droplet (Han and Mainelis, 2008). Overall, the collection efficiency
for C. cladosporioides was the lowest among the three species tested. There was very good
agreement in the collection efficiencies determined using the AOEM and ATP methods for
all test conditions (three types of test particles and two droplet sizes), and the differences
were not statistically significant (P > 0.05).
Figure 6 shows the concentration rates based on the collection efficiency data presented in
Figure 5. As could be seen, the concentration rates for C. cladosporioides, P. melinii, and A.
versicolor reached approximately 5 × 10⁴, 9 × 10⁴, and 8 × 10⁴/min, respectively, for the 40-
μl water droplet, while the concentration rates were 1 × 10⁵, 3 × 10⁵, and 2 × 10⁵/min,
respectively, for the 10-μl water droplet. These concentration rates were lower than values
Han et al. Page 8
Indoor Air. Author manuscript; available in PMC 2014 May 20.
NIH
-PA
Author M
anuscriptN
IH-P
A A
uthor Manuscript
NIH
-PA
Author M
anuscript
observed for bacteria (approximately 0.9 μm in diameter) and PSL particles (approximately
2 μm in diameter), but still higher than concentration rates of currently available bioaerosol
samplers. In addition, these values were observed for a particular reference concentration of
airborne spores (approximately 105–106/m3). In the ambient environment, spore
concentrations can vary widely and in most cases are approximately 104/m3, but
concentrations as high as 107/m3 could be encountered (Tsai et al., 2007).
As the concentration of fungal spores in an ambient environment could vary widely, in the
next set of experiments, we explored the effect of airborne spore concentration (104 to
~107/m3) on the collection efficiency of the EPSS (Figure 7). Here, the total number of
spores collected in a 40-μl droplet is plotted as a function of the reference spore number,
Nreference, determined according to Equation 3. The reference spore number represents the
number of spores entering the sampler during a collection period. As the 40-μl droplet
yielded higher collection efficiencies compared to the 10-μl droplet, only the 40-μl droplet
was used. Because of the limited sensitivity of AOEM at lower concentrations, sample
analysis was performed only using the ATP-based method. The reference spore number was
determined via APS.
The large figure (Figure 7) shows the entire tested range, while the insert figure shows the
results for lower reference spore numbers. It is apparent that for common concentrations of
ambient airborne fungi (approximately 104–105/m3, Nreference = 103 to ~104), the number of
spores recovered in a droplet is closer to the 1:1 line and the sampler collection efficiency
and the resulting concentration rate would be substantially higher than those shown in
Figures 5 and 6. In fact, for the lowest reference spore numbers tested, the collection
efficiency exceeded 60% for all fungal species. As the reference spore number increases, a
progressively lower percentage of spores are recovered by the droplet – i.e., the collection
efficiency of the EPSS becomes progressively lower. The rate of change, however, seems to
depend on the fungal species. For the airborne reference spore number, Nreference = 106
(airborne concentrations = approximately 107/m3), which was the highest tested, the
collection efficiencies for C. cladosporioides and A. versicolor were under 5%, while the
collection efficiency for P. melinii was approximately 20%. Thus, this sampling technology
may not be best suited for sampling of very high airborne spore concentrations. On the other
hand, ambient concentrations of fungi of 104/l, or 107/m3, are rarely encountered, and the
primary application of the EPSS is the detection of low bioaerosol concentrations because of
its high concentration rates.
The results presented in Figure 7 could be explained based on the hygroscopicity of the
fungal spores. Other physical characteristics of spores, such as size, shape, surface features,
density, and electrostatic charge have also possibly played a role. It is generally accepted
that fungal spores are hydrophobic (Reponen et al., 2005). Thus, when the collecting water
droplet moves over the spores deposited on the collection electrode, majority of the spores
attach to the droplet and do not penetrate into it, as shown in Figure 8. More hydrophilic
particles, such as bacteria, on the other hand, penetrate into the droplet. At low numbers of
deposited spores, the majority of spores can attach to the droplet, which results in high
collection efficiency. At high numbers of deposited spores, the surface of the water droplet
quickly becomes saturated and cannot accept any more fungal spores. As a result, the
Han et al. Page 9
Indoor Air. Author manuscript; available in PMC 2014 May 20.
NIH
-PA
Author M
anuscriptN
IH-P
A A
uthor Manuscript
NIH
-PA
Author M
anuscript
collection efficiency of the EPSS substantially decreases for higher spore concentrations.
Theoretically, 106–5 × 10⁶ fungal spores with a diameter of 2–3 μm could be uniformly
packed onto the surface of a 40-μl droplet, while approximately 109 spores would fit inside
such a droplet. The highest number of spores we were able to collect was in the order of 105
to ~106 spores in a 40-μl droplet. Thus, at high reference spore numbers, we were
approaching the saturation limit of the droplet surface, i.e., many of the spores deposited on
the collection electrode were not picked up by the droplet.
Naturally, not all spores will accumulate only on the droplet surface, but some will penetrate
into the droplet. The ratio of spores on the droplet vs. spores inside the droplet is most likely
determined by the hydrophobic properties of each individual spore type (Figure 8). As could
be inferred from Figure 7, the maximum number of spores that could be accommodated by a
droplet is different for each spore type and possibly represents a difference in their
hydrophobicity. Based on this reasoning, the C. cladosporioides spores seem to be most
hydrophobic, while the P. melinii spores seem to be least hydrophobic of the three tested
species. The data presented in Figure 5 also show that the highest collection efficiency was
observed for P. melinii spores and the lowest for C. cladosporioides spores.
The tests described previously were performed with a 10-min sampling time. For many
sampling projects, longer sampling times are needed and thus additional tests were
performed for the 30- and 60-min sampling times. Given the data presented in Figure 7, i.e.,
decrease in the collection efficiency at higher spore loads, the airborne spore concentration
was adjusted so that the total number of spores entering the EPSS would be approximately
the same for all three sampling times. The collection efficiency of the EPSS tested at 10
l/min with the 40-μl droplet for a 10-, 30-, and 60-min sampling time is presented in Figure
9. The collected spores were quantified by both the AOEM and the ATP-based method.
When the sampling time was increased from 10 to 60 min, the EPSS collection efficiency
for C. cladosporioides analyzed by the AOEM decreased from 21 ± 4% (21 ± 0.4% by ATP)
to 6 ± 0.8% (6 ± 0.7% by ATP). The decrease for the other two fungal species was much
less pronounced: for P. melinii, from 36 ± 2.4% (36 ± 2.4% by ATP) to 31 ± 5.7% (31 ±
3.9% by ATP); for A. versicolor, from 25 ± 2.8% (23 ± 2.7% by ATP) to 20 ± 1.8% (19 ±
1.6% by ATP). The decrease in the collection efficiency with a longer sampling time was
also observed in our earlier study with bacteria (Han et al., 2010). One possible explanation
of the decrease could be less efficient removal of the deposited particles by water droplet
because of the increase in the adhesive forces between the particles and the collection
surface with prolonged contact time (Hinds, 1999). The increase in the adhesion force seems
to depend on the particle type and in our case seems to have been most pronounced for C.
cladosporioides.
Another possible contributing factor is the loss of electrical charge with time and thus
reentry of the collected spores into the air stream. However, even if the spores did lose most
of their charge and the contribution of electrostatic force to the overall adhesive force
became minimal, the adhesive force for particles <10 μm would still be much higher than a
removing force of an air current of 10 m/s (Hinds, 1999), which is stronger than the air
current used in our experiments by more than an order of magnitude. Accordingly, the
fraction of pores observed on the after-filter did not increase with the longer sampling time.
Han et al. Page 10
Indoor Air. Author manuscript; available in PMC 2014 May 20.
NIH
-PA
Author M
anuscriptN
IH-P
A A
uthor Manuscript
NIH
-PA
Author M
anuscript
Even though the average collection efficiency for three fungi after a 60-min sampling time
was approximately 20%, note that all particles removed from the EPSS are concentrated in
only one droplet. Therefore, the entire sample could be analyzed thus increasing the ability
to detect particles of interest. As could be observed from Figure 9, the average collection
efficiency determined using the two methods (AOEM vs. ATP) was in a very good
agreement: the difference was not statistically significant (P > 0.05) for either the different
fungal species nor for different sampling times.
Conclusions
This study showed that the novel bioaerosol sampler with a superhydrophobic collection
surface is able to concentrate airborne fungi (C. cladosporioides, P. melinii, and A.
versicolor) in small amounts of liquid (10 or 40 μl). When sampling with 10-μl droplets,
concentration rates in the range of 1 × 10⁵–3 × 10⁵/min were achieved even though the
collection efficiency was <50%. Such concentration rates are higher than those of the most
currently available bioaerosol samplers, thus improving the detection of low concentrations
of airborne fungi in various environments, including indoors. In addition, it was
demonstrated that the collection efficiency of the EPSS substantially increases at lower
spore loadings and is >60% for airborne spore concentrations usually encountered in the
environment, i.e., 104 to ~105/m3. Based on this study with fungi and an earlier study with
bacteria and PSL particles, it seems that the performance of this sampling technology
depends on particle nature and interaction between the collected particles and the
superhydrophobic collection surface. Among these particles, fungi represent the worst case
scenario. As airborne fungal spores might constitute only 1–4% of particles outdoors
(Battarbee et al., 1997), it is likely that >106 to ~107 particles could be removed by one 40-
μl droplet during field sampling. The interaction of different particles with the collection
surface will be investigated in future studies in more detail.
In addition, we successfully developed and applied an ATP-based bioluminescence method
to quantify collected fungal spores. Spore concentrations determined by the microscopy and
the ATP-based method were in very good agreement and were not statistically different. It
should be noted that that these results were achieved with pure fungal cultures. In a field
sampling situation, where different genera of bacteria, fungi, and their fragments are
encountered in variable stages of dormancy/germination, the ATP signal could not be
correlated with concentration of a particular bioaerosol species. In this case, the ATP signal
may serve as an indicator of the overall viable bioaerosol burden. On the other hand, the
ATP method could serve as a fast and quantitative alternative to traditional microscopy in
laboratory studies with specific fungal species.
Acknowledgments
This publication was supported by the Grant R21-OH00656 ‘Design of Advanced Electrostatic Sampler for TotalBioaerosols’ from CDC-NIOSH and Project 07202 funded by the New Jersey Agricultural Experiment Station(NJAES) at Rutgers, The State University of New Jersey. Its contents are solely the responsibility of the authorsand do not necessarily represent the official view of the CDC-NIOSH or the NJAES. The authors appreciatevaluable suggestions by Dr. Donna Fennell.
Han et al. Page 11
Indoor Air. Author manuscript; available in PMC 2014 May 20.
NIH
-PA
Author M
anuscriptN
IH-P
A A
uthor Manuscript
NIH
-PA
Author M
anuscript
References
Adhikari A, Jung J, Reponen T, Lewis JS, DeGrasse EC, Grimsley LF, Chew GL, Grinshpun SA.Aerosolization of fungi, (1–>3)-[beta]-d glucan, and endotoxin from flood-affected materialscollected in New Orleanshomes. Environ Res. 2009; 109:215–224. [PubMed: 19201399]
Aizenberg V, Reponen T, Grinshpun SA, Willeke K. Performance of Air-O-Cell, Burkard, and ButtonSamplers for Total Enumeration of Airborne Spores. Am Ind Hyg Assoc J. 2000; 61:855–864.
Amato P, Demeer F, Melaouhi A, Fontanella S, Martin-Biesse AS, Sancelme M, Laj P, Delort AM. Afate for organic acids, formaldehyde and methanol in cloud water: their biotransformation by micro-organisms. Atmos Chem Phys Discuss. 2007a; 7:5253–5276.
Amato P, Parazols M, Sancelme M, Mailhot G, Laj P, Delort AM. An important oceanic source ofmicro-organisms for cloud water at the Puy de Dôme (France). Atmos Environ. 2007b; 41:8253–8263.
An HR, Mainelis G, White L. Development and calibration of real-time pcr for quantification ofairborne microorganisms in air samples. Atmos Environ. 2006; 40:7924–7939.
Battarbee JL, Rose NL, Long X. A continuous, high resolution record of urban airborne particulatessuitable for retrospective microscopical analysis. Atmos Environ. 1997; 31:171–181.
Burge HA. Fungi: toxic killers or unavoidable nuisances? Ann Allergy Asthma Immunol. 2001; 87(6Suppl 3):52–56. [PubMed: 11770685]
Burge, HA.; Feeley, JC.; Kreiss, K.; Milton, D.; Morey, PR.; Otten, JA.; Peterson, K.; Tulis, JJ.;Tyndall, R., editors. Guidelines for the Assessment of Bioaerosols in the Indoor Environment;Cincinnati, Ohio. American Conference of Governmental Industrial Hygienists; 1989.
Carlson, C.; DeGange, J.; Cable-Dunlap, P.; Halverson, J. Aerosol-to-Liquid Particle ExtractionSystem (ALPES). Abstracts of 2nd Joint Conference on Point Detection for Chemical andBiological Defense; Williamsburg, VA. 2004. p. 81-82.
Eydal HSC, Pedersen K. Use of an ATP assay to determine viable microbial biomass inFennoscandian Shield groundwater from depths of 3–1000 m. J Microbiol Meth. 2007; 70:363–373.
Gorny RL, Reponen T, Willeke K, Schmechel D, Robine E, Boissier M, Grinshpun SA. Fungalfragments as indoor air biocontaminants. Appl Environ Microbiol. 2002; 68:3522–3531. [PubMed:12089037]
Han T, Mainelis G. Design and development of an electrostatic sampler for bioaerosols with highconcentration rate. J Aerosol Sci. 2008; 39:1066–1078.
Han T, An HR, Mainelis G. Performance of an electrostatic precipitator with superhydrophobic surfacewhen collecting airborne bacteria. Aerosol Sci Technol. 2010; 44:339–348.
Hinds, W. Aerosol Technology: Properties, Behavior, and Measurement of Airborne Particles. NewYork, NY: John Wiley and Sons; 1999.
Horner WE, Helbling A, Salvaggio JE, Lehrer SB. Fungal allergens. Clin Microbiol Rev. 1995; 8:161–179. [PubMed: 7621398]
Hu S, McFarland AR. Numerical performance simulation of a wetted wall bioaerosol samplingcyclone. Aerosol Sci Technol. 2007; 41:160–168.
Karl DM. Cellular nucleotide measurements and applications in microbial ecology. Microbiol MolBiol Rev. 1980; 44:739–796.
Karol MH. Allergic reactions to indoor air pollutants. Environ Health Perspect. 1991; 95:45–51.[PubMed: 1821377]
Kodaka H, Fukuda K, Mizuochi S, Horigome K. Adenosine triphosphate content of microorganismsrelated with food spoilage. Jpn J Food Microbiol. 1996; 13:29–34.
Levetin, E.; Burge, HA., editors. Bioaerosols. Boca Raton, FL: CRC Lewis Publishers; 1995. p.87-120.
Lin WH, Li CS. The effect of sampling time and flow rates on the bioefficiency of three fungal sporesampling methods. Aerosol Sci Technol. 1998; 28:511–522.
Madelin TM. Fungal aerosols: a review. J Aerosol Sci. 1994; 25:1405–1412.
Han et al. Page 12
Indoor Air. Author manuscript; available in PMC 2014 May 20.
NIH
-PA
Author M
anuscriptN
IH-P
A A
uthor Manuscript
NIH
-PA
Author M
anuscript
Olsson-Francis K, Cockell CS. Experimental methods for studying microbial survival inextraterrestrial environments. J Microbiol Meth. 2010; 80:1–13.
Rakotonirainy MS, Héraud C, Lavédrine B. Detection of viable fungal spores contaminant ondocuments and rapid control of the effectiveness of an ethylene oxide disinfection using ATPassay. Luminescence. 2003; 18:113–121. [PubMed: 12687632]
Reponen, T.; Willeke, K.; Grinshpun, SA.; Nevalainen, A. Biological Particle Sampling. In: Willeke,K.; Baron, PA., editors. Aerosol Measurement: Principles, Techniques, and Applications. NewYork: John Wiley & Sons; 2005. p. 751-777.
Seo, Y. PhD Dissertation. Dept of Mech Eng, Texas A&M University; College Station, TX: 2007.Design of Wetted Wall Bioaerosol Concentration Cyclone.
Seshadri S, Han T, Krumins V, Fennell DE, Mainelis G. Application of ATP bioluminescence methodto characterize performance of bioaerosol sampling devices. J Aerosol Sci. 2009; 40:113–121.
Tsai FC, Macher JM, Hung YY. Biodiversity and concentrations of airborne fungi in large US officebuildings from the BASE study. Atmos Environ. 2007; 41:5181–5191.
Venkateswaran K, Hattori N, La Duc MT, Kern R. ATP as a biomarker of viable microorganisms inclean-room facilities. J Microbiol Meth. 2003; 52:367–377.
Wang Z, Reponen T, Grinshpun S, Gorny R, Willeke K. Effect of sampling time and air humidity onthe bioefficiency of filter samplers for bioaerosol collection. J Aerosol Sci. 2001; 32:661–674.
Williams RH, Ward E, McCartney HA. Methods for integrated air sampling and DNA analysis fordetection of airborne fungal spores. Appl Environ Microbiol. 2001; 67:2453–2459. [PubMed:11375150]
Yao M, Mainelis G. Effect of physical and biological parameters on enumeration of bioaerosols byportable microbial impactors. J Aerosol Sci. 2006; 37:1467–1483.
Zeng QY, Westermark SO, Rasmuson-Lestander A, Wang XR. Detection and quantification ofWallemia sebi in aerosols by real-time PCR, conventional PCR, and cultivation. Appl EnvironMicrobiol. 2004; 70:7295–7302. [PubMed: 15574929]
Han et al. Page 13
Indoor Air. Author manuscript; available in PMC 2014 May 20.
NIH
-PA
Author M
anuscriptN
IH-P
A A
uthor Manuscript
NIH
-PA
Author M
anuscript
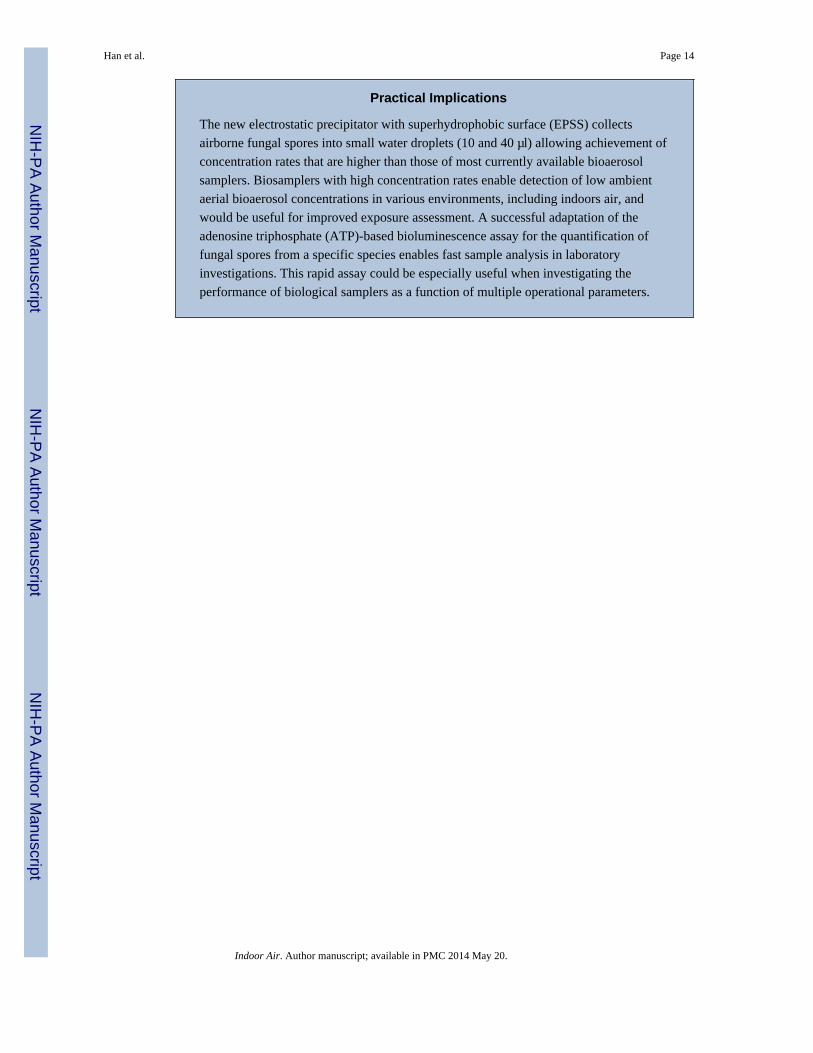
Practical Implications
The new electrostatic precipitator with superhydrophobic surface (EPSS) collects
airborne fungal spores into small water droplets (10 and 40 μl) allowing achievement of
concentration rates that are higher than those of most currently available bioaerosol
samplers. Biosamplers with high concentration rates enable detection of low ambient
aerial bioaerosol concentrations in various environments, including indoors air, and
would be useful for improved exposure assessment. A successful adaptation of the
adenosine triphosphate (ATP)-based bioluminescence assay for the quantification of
fungal spores from a specific species enables fast sample analysis in laboratory
investigations. This rapid assay could be especially useful when investigating the
performance of biological samplers as a function of multiple operational parameters.
Han et al. Page 14
Indoor Air. Author manuscript; available in PMC 2014 May 20.
NIH
-PA
Author M
anuscriptN
IH-P
A A
uthor Manuscript
NIH
-PA
Author M
anuscript
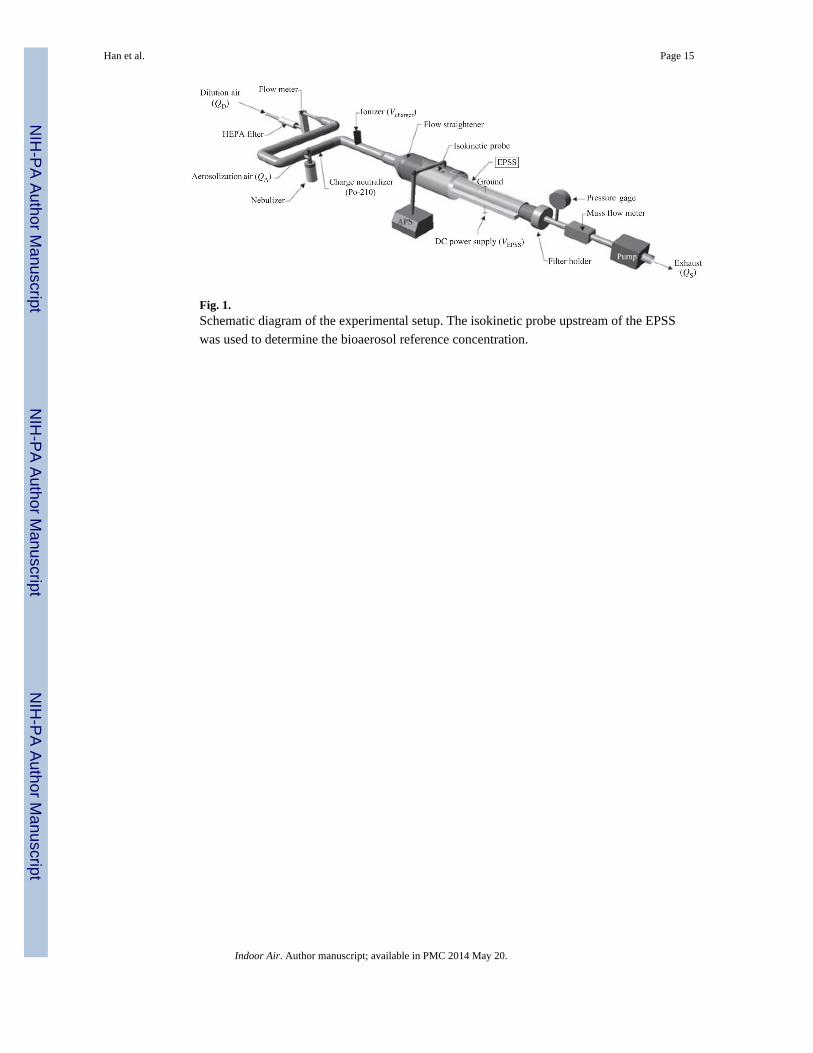
Fig. 1.Schematic diagram of the experimental setup. The isokinetic probe upstream of the EPSS
was used to determine the bioaerosol reference concentration.
Han et al. Page 15
Indoor Air. Author manuscript; available in PMC 2014 May 20.
NIH
-PA
Author M
anuscriptN
IH-P
A A
uthor Manuscript
NIH
-PA
Author M
anuscript
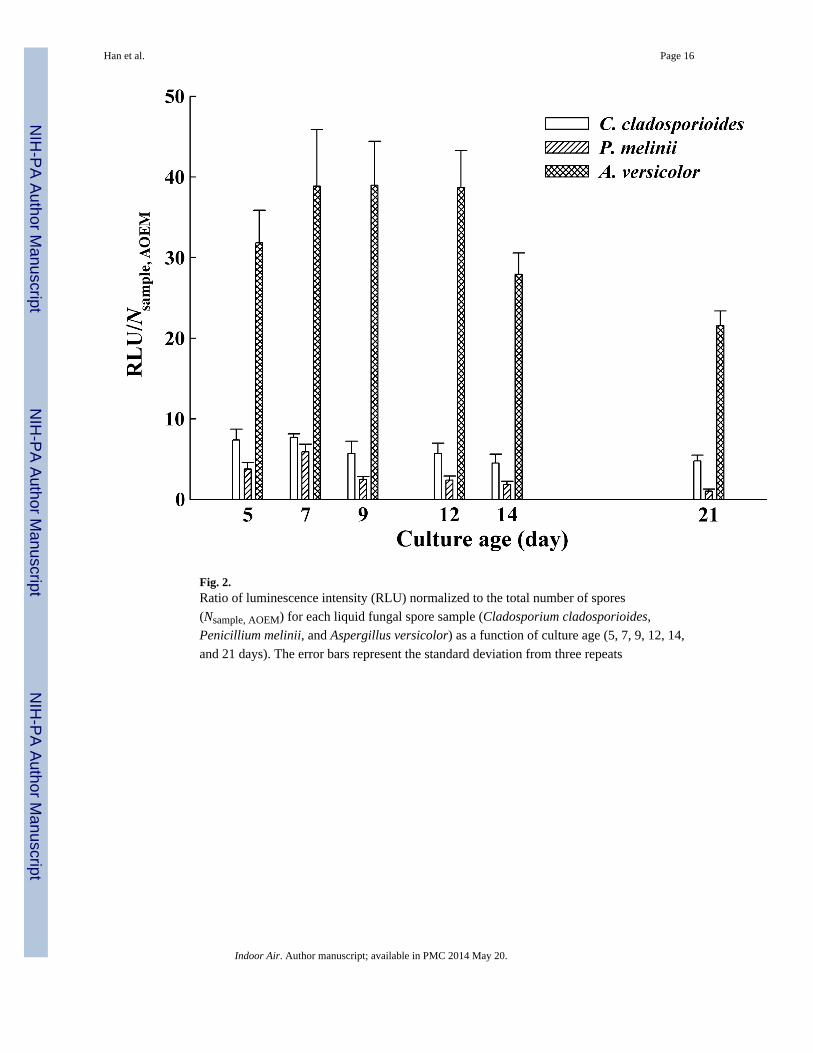
Fig. 2.Ratio of luminescence intensity (RLU) normalized to the total number of spores
(Nsample, AOEM) for each liquid fungal spore sample (Cladosporium cladosporioides,
Penicillium melinii, and Aspergillus versicolor) as a function of culture age (5, 7, 9, 12, 14,
and 21 days). The error bars represent the standard deviation from three repeats
Han et al. Page 16
Indoor Air. Author manuscript; available in PMC 2014 May 20.
NIH
-PA
Author M
anuscriptN
IH-P
A A
uthor Manuscript
NIH
-PA
Author M
anuscript
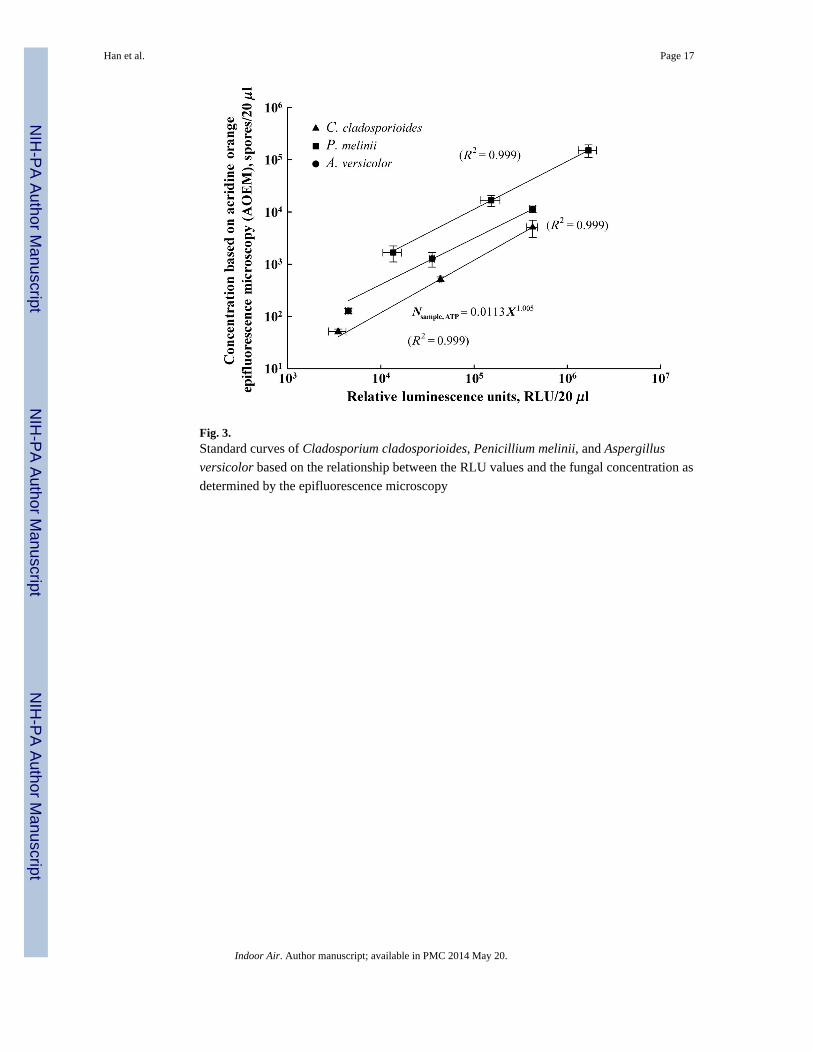
Fig. 3.Standard curves of Cladosporium cladosporioides, Penicillium melinii, and Aspergillus
versicolor based on the relationship between the RLU values and the fungal concentration as
determined by the epifluorescence microscopy
Han et al. Page 17
Indoor Air. Author manuscript; available in PMC 2014 May 20.
NIH
-PA
Author M
anuscriptN
IH-P
A A
uthor Manuscript
NIH
-PA
Author M
anuscript
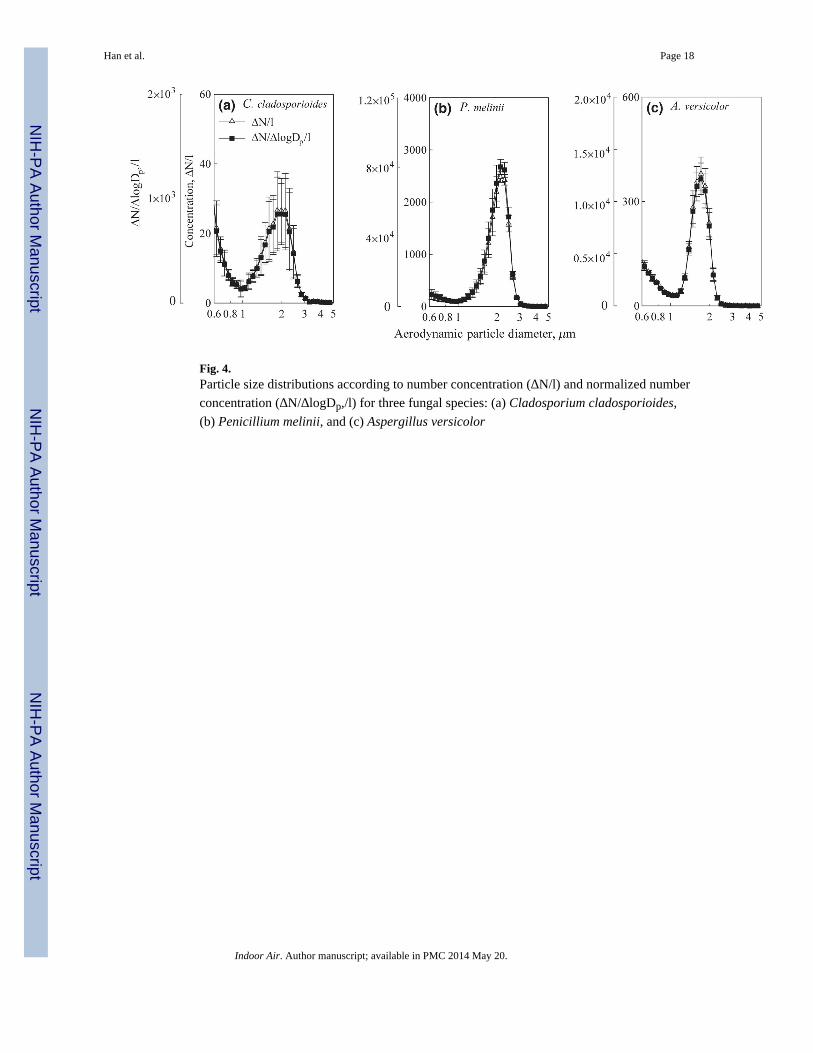
Fig. 4.Particle size distributions according to number concentration (ΔN/l) and normalized number
concentration (ΔN/ΔlogDp,/l) for three fungal species: (a) Cladosporium cladosporioides,
(b) Penicillium melinii, and (c) Aspergillus versicolor
Han et al. Page 18
Indoor Air. Author manuscript; available in PMC 2014 May 20.
NIH
-PA
Author M
anuscriptN
IH-P
A A
uthor Manuscript
NIH
-PA
Author M
anuscript
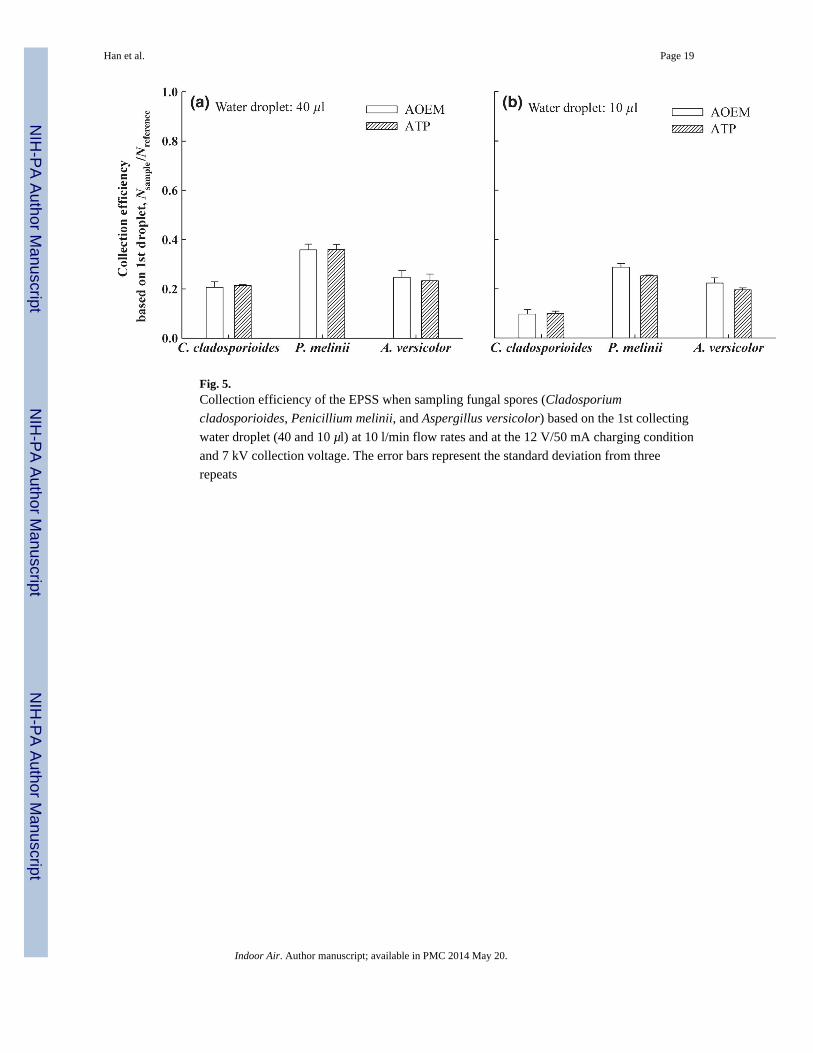
Fig. 5.Collection efficiency of the EPSS when sampling fungal spores (Cladosporium
cladosporioides, Penicillium melinii, and Aspergillus versicolor) based on the 1st collecting
water droplet (40 and 10 μl) at 10 l/min flow rates and at the 12 V/50 mA charging condition
and 7 kV collection voltage. The error bars represent the standard deviation from three
repeats
Han et al. Page 19
Indoor Air. Author manuscript; available in PMC 2014 May 20.
NIH
-PA
Author M
anuscriptN
IH-P
A A
uthor Manuscript
NIH
-PA
Author M
anuscript
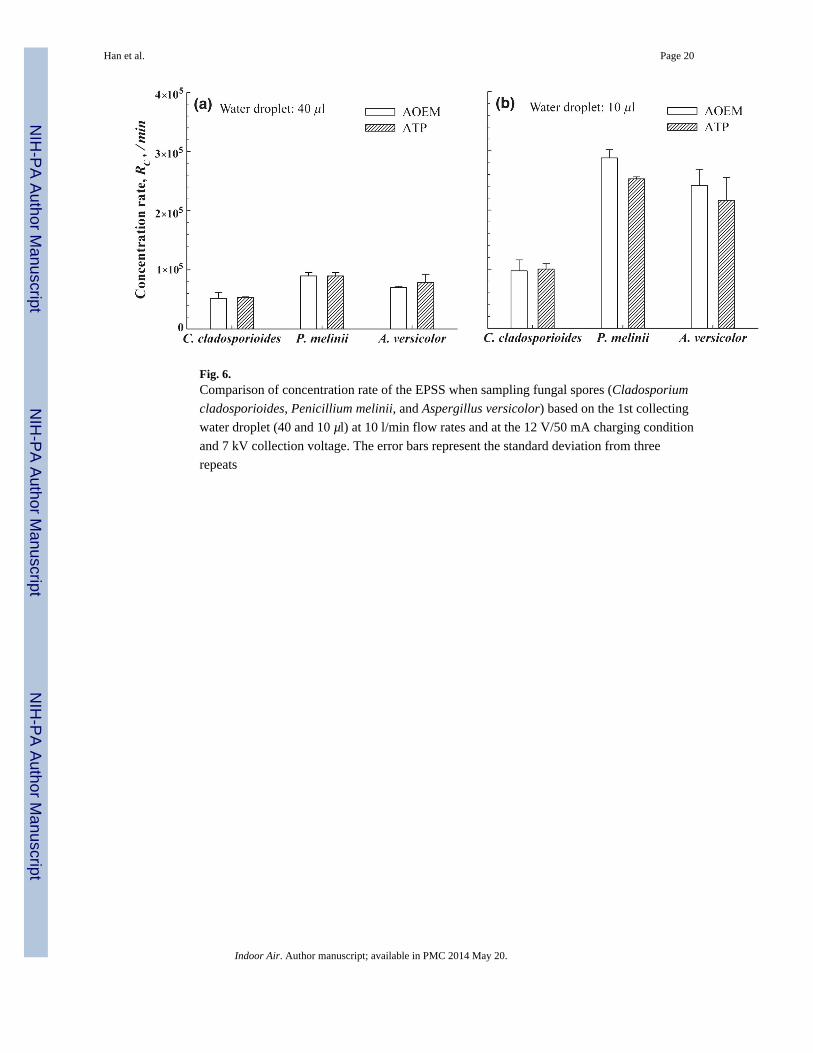
Fig. 6.Comparison of concentration rate of the EPSS when sampling fungal spores (Cladosporium
cladosporioides, Penicillium melinii, and Aspergillus versicolor) based on the 1st collecting
water droplet (40 and 10 μl) at 10 l/min flow rates and at the 12 V/50 mA charging condition
and 7 kV collection voltage. The error bars represent the standard deviation from three
repeats
Han et al. Page 20
Indoor Air. Author manuscript; available in PMC 2014 May 20.
NIH
-PA
Author M
anuscriptN
IH-P
A A
uthor Manuscript
NIH
-PA
Author M
anuscript
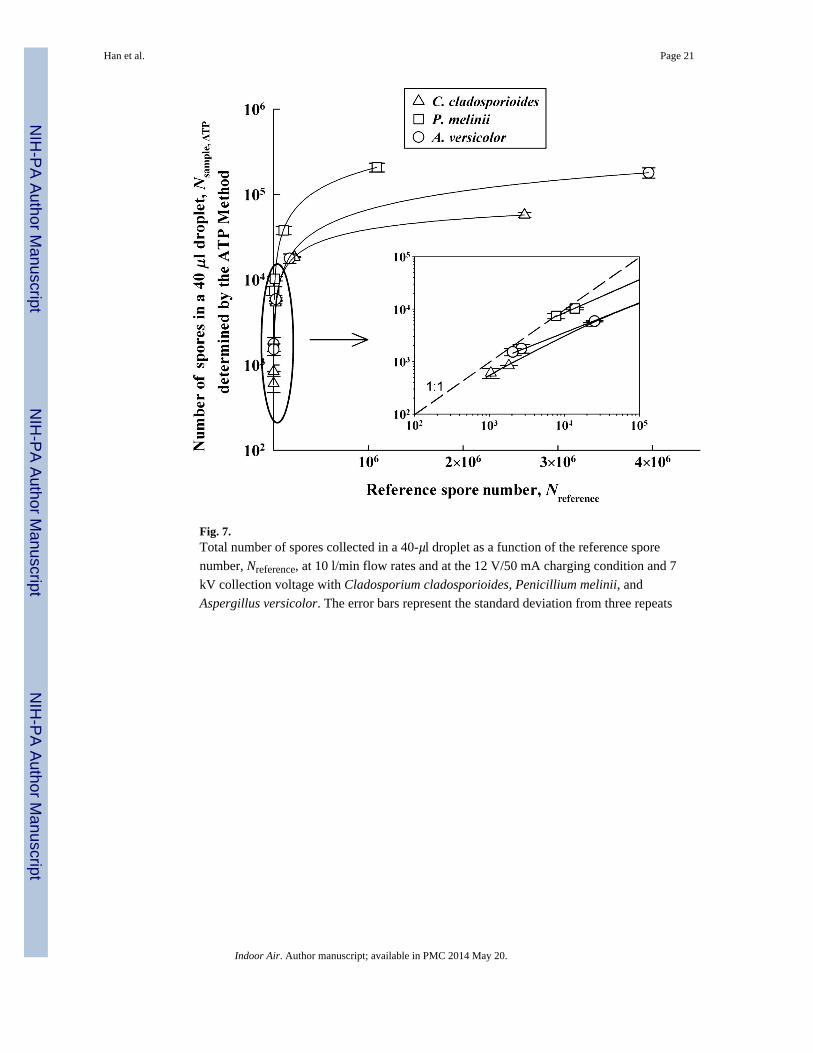
Fig. 7.Total number of spores collected in a 40-μl droplet as a function of the reference spore
number, Nreference, at 10 l/min flow rates and at the 12 V/50 mA charging condition and 7
kV collection voltage with Cladosporium cladosporioides, Penicillium melinii, and
Aspergillus versicolor. The error bars represent the standard deviation from three repeats
Han et al. Page 21
Indoor Air. Author manuscript; available in PMC 2014 May 20.
NIH
-PA
Author M
anuscriptN
IH-P
A A
uthor Manuscript
NIH
-PA
Author M
anuscript
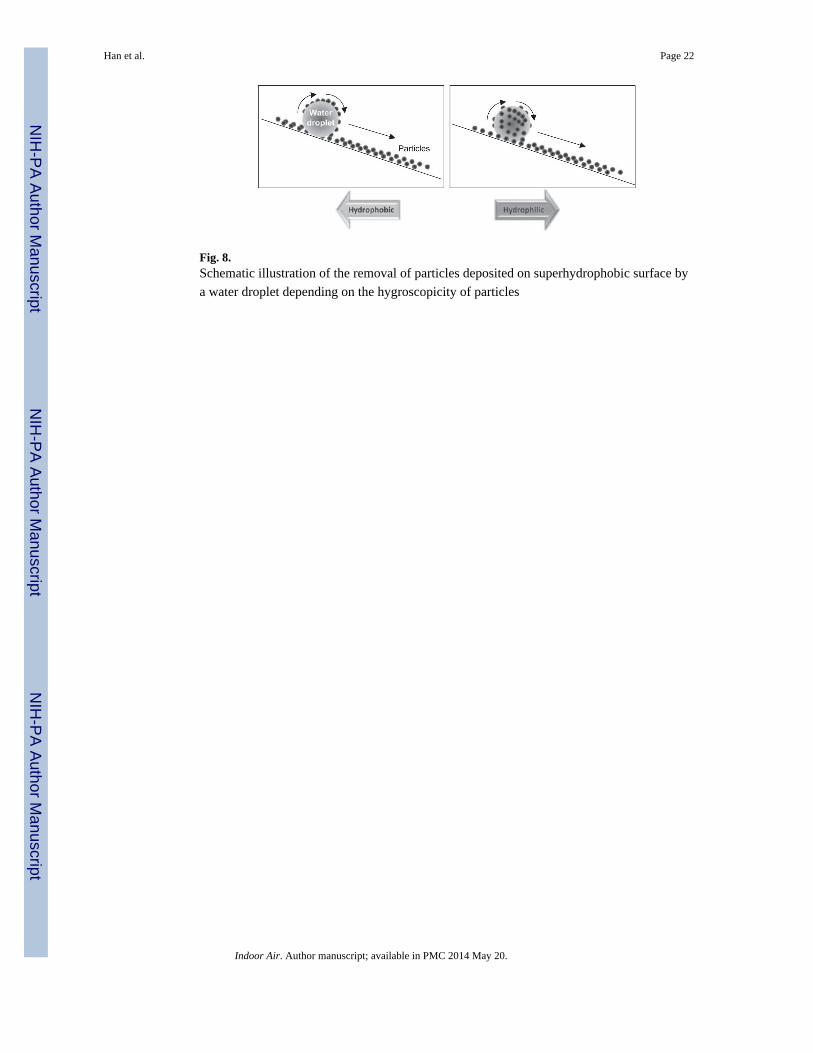
Fig. 8.Schematic illustration of the removal of particles deposited on superhydrophobic surface by
a water droplet depending on the hygroscopicity of particles
Han et al. Page 22
Indoor Air. Author manuscript; available in PMC 2014 May 20.
NIH
-PA
Author M
anuscriptN
IH-P
A A
uthor Manuscript
NIH
-PA
Author M
anuscript
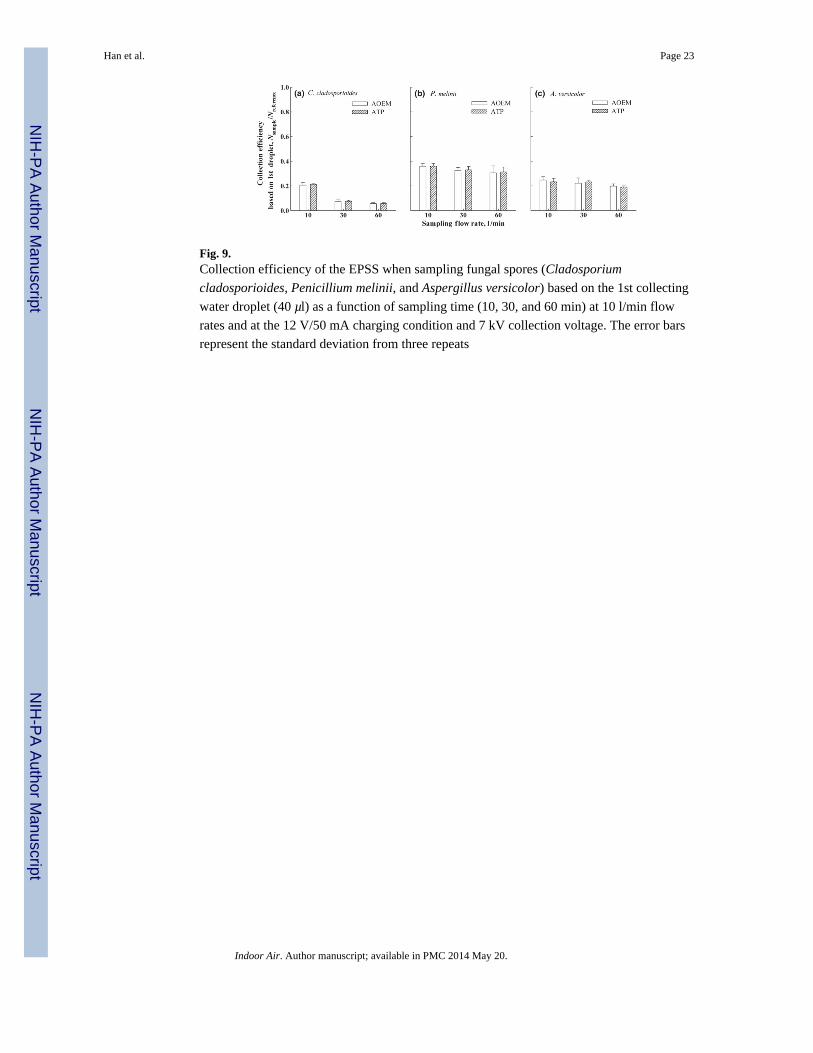
Fig. 9.Collection efficiency of the EPSS when sampling fungal spores (Cladosporium
cladosporioides, Penicillium melinii, and Aspergillus versicolor) based on the 1st collecting
water droplet (40 μl) as a function of sampling time (10, 30, and 60 min) at 10 l/min flow
rates and at the 12 V/50 mA charging condition and 7 kV collection voltage. The error bars
represent the standard deviation from three repeats
Han et al. Page 23
Indoor Air. Author manuscript; available in PMC 2014 May 20.
NIH
-PA
Author M
anuscriptN
IH-P
A A
uthor Manuscript
NIH
-PA
Author M
anuscript