Embed Size (px)
Citation preview

Low cerebral blood flow is associated with lower memoryfunction in metabolic syndrome
Alex C Birdsill, BSA,B, Cynthia M Carlsson, MDA,B, Auriel A Willette, PhDC, Ozioma COkonkwo, PhDA,B, Sterling C Johnson, PhDA,B, Guofan Xu, MD, PhDA,B, Jennifer M Oh,BSA,B, Catherine L Gallagher, MDB,D,E, Rebecca L Koscik, PhDF, Erin M Jonaitis, PhDF,Bruce P Hermann, PhDF, Asenath LaRue, PhDF, Howard A Rowley, MDB,G, Sanjay Asthana,MDA,B, Mark A Sager, MDB,F, and Barbara B Bendlin, PhDA,B,*
AGeriatric Research, Education and Clinical Center (GRECC), William S. Middleton MemorialVeteran’s Hospital, Madison, WI, USABWisconsin Alzheimer’s Disease Research Center, Department of Medicine, University ofWisconsin, Madison, WI, USACNational Institute on Aging, Baltimore MD, USADWilliam S. Middleton Memorial V. A. Hospital, Madison, Wisconsin, U.S.AEDepartment of Neurology, University of Wisconsin, Madison, WI, USAFWisconsin Alzheimer’s Institute, University of Wisconsin School of Medicine and Public Health,Madison, USAGUniversity of Wisconsin School of Medicine and Public Health, Department of Radiology,Madison, WI, USA
AbstractBackground—Metabolic syndrome (MetS)—a cluster of cardiovascular risk factors—is linkedwith cognitive decline and dementia. However, the brain changes underlying this link arepresently unknown. In this study, we tested the relationship between MetS, cerebral blood flow(CBF), white matter hyperintensity (WMH) burden and gray matter (GM) volume in cognitivelyhealthy late middleaged adults. Additionally, we assessed the extent to which MetS was associatedwith cognitive performance.
Methods and Results—Late middle-aged adults from the Wisconsin Registry for Alzheimer’sPrevention (N=69, mean age=60.4 yrs) underwent a fasting blood draw, arterial spin labelingperfusion MRI, T1-weighted MRI, T2FLAIR MRI, and neuropsychological testing. MetS wasdefined as abnormalities on 3 or more factors, including: abdominal obesity, triglycerides, HDL-cholesterol, blood pressure, and fasting glucose.
Mean GM CBF was 15% lower in MetS compared to controls. Voxel-wise image analysisindicated that the MetS group had lower CBF across a large portion of the cortical surface, withthe exception of medial and inferior parts of the occipital and temporal lobes. The MetS group alsohad lower immediate memory function; a mediation analysis indicated this relationship was
Corresponding Author: Barbara Bendlin, PhD, Assistant Professor, University of Wisconsin, School of Medicine and Public Health,J5/1M Clinical Science Center, MC 2420, 600 Highland Avenue, Madison, WI 53792, Phone: (608) 265-2483, Fax: (608) 265-3091,[email protected]
NIH Public AccessAuthor ManuscriptObesity (Silver Spring). Author manuscript; available in PMC 2014 January 01.
Published in final edited form as:Obesity (Silver Spring). 2013 July ; 21(7): 1313–1320. doi:10.1002/oby.20170.
NIH
-PA
Author M
anuscriptN
IH-P
A A
uthor Manuscript
NIH
-PA
Author M
anuscript

partially mediated by CBF. Among the MetS factors, abdominal obesity and elevated triglycerideswere most strongly associated with lower CBF.
Conclusions—The results underscore the importance of reducing the number of cardiovascularrisk factors for maintaining CBF and cognition in an aging population.
Keywordscerebral blood flow; brain; magnetic resonance imaging; metabolic syndrome; cognitive function
IntroductionMetabolic syndrome (MetS) refers to a cluster of cardiovascular risk factors that often occurtogether and reflect an increased risk for type 2 diabetes. Five core risk factors contribute tothe clinical identification of MetS: abdominal obesity, high triglycerides, low HDLcholesterol, hypertension, and high fasting glucose (1). A diagnosis of MetS is made whenthree or more factors are present. It is estimated that 34% of American adults have MetS,and while the condition is increasingly identified in younger adults, the prevalence of MetSincreases sharply in middle age(2). At the same time, the US population is aging(3), aphenomenon accompanied by an increased prevalence of dementia, in particularAlzheimer’s disease (AD). The current epidemic of MetS in middle age and the projectedepidemic of AD in old age converge in findings that MetS and individual MetS factorsoccurring in middle-age are associated with increased risk of cognitive decline and AD(4–6). In fact, several studies suggest that midlife may be a critical period when cardiovascularrisk factors influence cognitive aging trajectories (4, 7, 8).
While several potentially complementary mechanisms have been proposed for linking MetSand its comprising factors to cognitive decline(9), little is known about the midlife brainchanges that occur in people with MetS that may adversely impact cognition beyond normalaging. The factors comprising MetS are known cerebrovascular risk factors and abnormaltriglycerides, HDL, blood pressure, and obesity have been linked to decreases in cerebralblood flow (CBF)(10–13). Recent studies have also identified global and regional CBFreductions in people with mild cognitive impairment (MCI) and AD(14), suggesting cerebralhypoperfusion as a possible mechanism for neural damage and cognitive decline.
Thus, the goal of the present study was to assess the extent to which MetS is associated withCBF differences in midlife and examine the role of cerebral perfusion as a potentialmechanism for structural brain alteration and cognitive decline. Middle-aged participantswere recruited from the Wisconsin Registry for Alzheimer’s Prevention (WRAP) cohort(15) to undergo magnetic resonance imaging (MRI) sensitive to CBF, and brain scans thatindex regional gray matter (GM) volume and white matter lesion burden. We hypothesizedthat people with MetS would have lower CBF, lower GM volume, higher WMH burden, andlower cognitive performance compared to people without MetS. We also expected thatdifferences between the MetS group and controls in cognition, GM volume and WMHlesion load would be explained by differences in CBF.
MethodsSubjects
Seventy-five participants were recruited from WRAP, a registry of cognitively normal adultswho are followed longitudinally and comprise a cohort whose members either have a familyhistory of late onset AD or no family history of AD(15). A positive family history wasdefined as having one or both parents with autopsy-confirmed or probable AD as defined byNINCDSADRDA research criteria (16). The inclusion criteria for this study consisted of:
Birdsill et al. Page 2
Obesity (Silver Spring). Author manuscript; available in PMC 2014 January 01.
NIH
-PA
Author M
anuscriptN
IH-P
A A
uthor Manuscript
NIH
-PA
Author M
anuscript

normal cognitive function determined by neuropsychological evaluation, nocontraindications for MRI and a subsequent normal MRI scan, no current diagnosis of majorpsychiatric disease or other major medical conditions (e.g., myocardial infarction, or recenthistory of cancer), and no history of head trauma. All participants underwent a fasting blooddraw, MRI, and neuropsychological testing. Four participants were excluded because ofabnormal radiological findings from the reviewing radiologist (HAR). Two participantswere excluded because of scan artifact, leaving 69 participants in the study. Subjectdemographics can be found in Table 1. The University of Wisconsin Institutional ReviewBoard approved all study procedures and each participant provided signed informed consentbefore participation.
Cognitive testingAs part of their participation in WRAP, participants received at least one comprehensiveneuropsychological assessment(15). On average, neuropsychological testing occurred withinten months of the MRI scan (M= 0.82 years, SD = 0.60 years). Time between testing andMRI did not significantly differ between the MetS group and the control group, t = 0.91, p= .37. The neuropsychological battery(15) tested cognitive function in the domains ofmemory, attention, executive function, verbal ability, and visuospatial ability. We analyzedfour cognitive factor scores that were determined from a factor analytic study of the WRAPneuropsychological battery and adapted from work published in Dowling et al.(17):Immediate Memory (Rey Auditory Verbal Learning Test(18), Trials 1 and 2), VerbalLearning & Memory (Rey Auditory Verbal Learning Test(18), Trials 3–5 and DelayedRecall Trial), Working Memory (Wechsler Adult Intelligence Scale – 3rd edition(19), DigitSpan, Arithmetic, and Letter-Numbering Sequencing subtests), Speed & Flexibility(interference trial from the Stroop Test(20), and Trail Making Test A and B(21)). Thesefactors were selected for analysis because they represent domains of cognitive skill that maybe affected in preclinical stages of AD (22). The speed and flexibility factor score wasunavailable for one participant. Cognitive analyses used unadjusted factor scores but withage as a covariate.
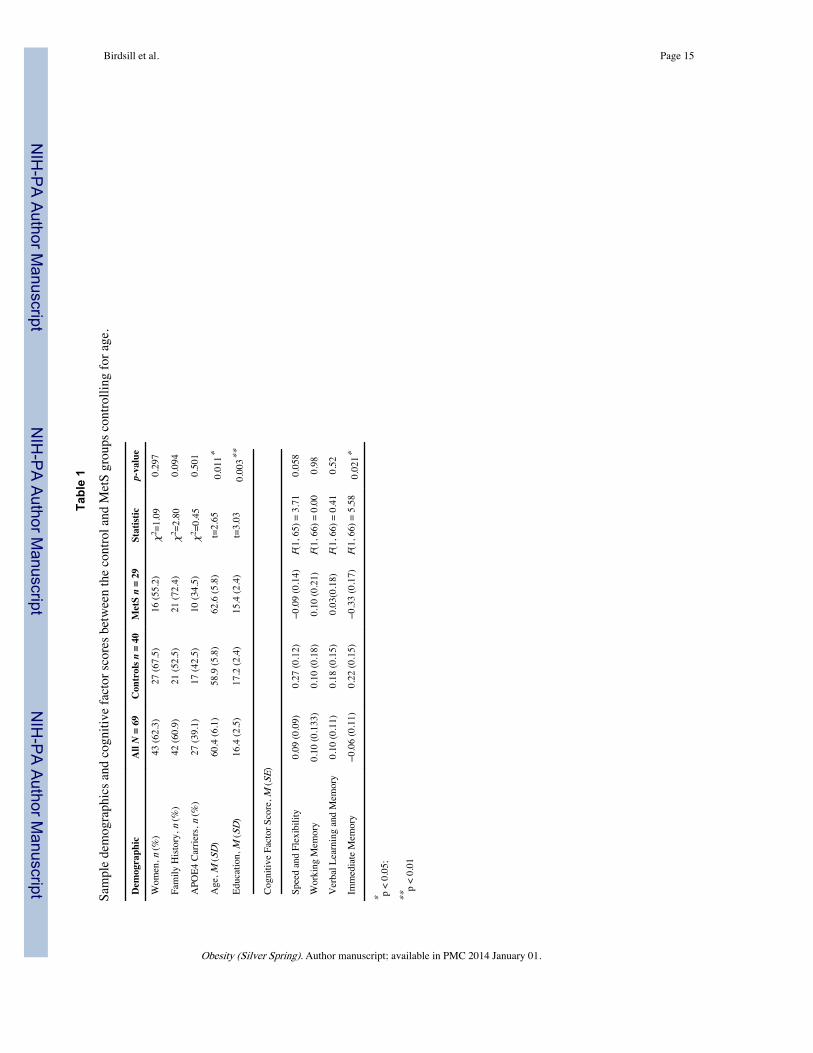
MetS factorsMetS was determined according to consensus criteria published in 2009(1). The criteriainclude the following: abdominal obesity > 102cm for men, >88cm for women; triglycerides≥ 150 mg/dL; HDL cholesterol < 40 mg/dL in men, and < 50 mg/DL in women; bloodpressure ≥ 130/85 mmHg; fasting glucose ≥ 100 mg/dL. The use of medication to treat highblood pressure, elevated triglycerides, elevated glucose or low HDL also indicated thepresence of the respective MetS factor. Participants who exceeded criteria on 3 or morefactors (n = 29) were included in the MetS group while the rest of the sample (n = 40) wereconsidered controls. The percentages of participants that met criteria on each factor in theMetS group and the control group are listed in Table 2.
Brain Imaging AcquisitionMR scanning was performed on a General Electric 3.0 Tesla Discovery MR750 (Waukesha,WI) MRI system with an 8-channel head coil and parallel imaging (ASSET).
A T1-weighted volume was acquired in the axial plane with a 3D fast spoiled gradient-echo(3D EFGRE FSPGR) sequence using the following parameters: TI = 450 ms; TR = 8.1 ms;TE = 3.2 ms; flip angle = 12°; acquisition matrix = 256 × 256 × 156 mm, FOV = 260 mm;slice thickness = 1.0 mm.
A T2-weighted fluid attenuated inversion recovery (FLAIR) sequence was acquired in thesagittal plane using the following parameters: TI = 1868 ms; TR = 6000 ms; TE = 123 ms;
Birdsill et al. Page 3
Obesity (Silver Spring). Author manuscript; available in PMC 2014 January 01.
NIH
-PA
Author M
anuscriptN
IH-P
A A
uthor Manuscript
NIH
-PA
Author M
anuscript

flip angle = 90°; acquisition matrix = 256 x 256 x 100 mm, FOV = 256 mm; slice thickness= 2.0 mm yielding a voxel resolution of 1 mm x 1 mm x 2 mm.
Resting CBF assessments were made using background-suppressed pseudo-continuous ASL(pcASL)(23, 24), featuring a 3D fast spin echo spiral sequence that utilizes a stack ofvariabledensity spiral 4ms-readout and 8 interleaves. Scan parameters were TR = 6000 ms;TE = 21 ms; FOV = 240 x 240 x 160 mm; slice thickness = 4 mm no gap; matrix size=128 x128; NEX=3; and labeling RF amplitude=0.24 mG. Multi-slice spin labeling wasimplemented using a single coil that eliminates off-resonance errors(25). Post-labeling delaywas 1525 ms for 40 participants and 2025 ms for 29 participants and was entered as acovariate in all analyses utilizing pcASL scans. The distribution of inversion time was notdifferent between MetS and controls. The pcASL scan included 3 averaged acquisitions,each consisting of a control image subtracted from a labeled image. The sequence alsoincluded a fluid-suppressed proton density (PD) acquisition, with the same imagingsequence/image slab location as the pcASL but without the RF labeling preparation, forCBF flow quantitation and image registration. In order to reduce variability in the CBFassessment, participants fasted for a minimum 4-hours prior to scan, abstaining from food,tobacco, caffeine, and medications with vasomodulatory properties. We have previouslyreported excellent test-retest reliability (r > 0.95) of this pcASL procedure(26).
pcASL processingTo derive quantitative CBF maps, sensitivity maps were first created that represent imagesensitivity to water at each voxel and are a function of the PD image, saturation time, T1image and assumed tissue water concentration. CBF is then calculated using the density ofbrain tissue, the labeling efficiency, the post-labeling delay, the labeling duration, the T1 ofarterial blood, the density of water in the blood, and the signal intensities in the labeled andcontrol images. Equations can be found in Xu et al.(26)
The averaged quantified CBF maps were brought into normalized space by first registeringthe PD map to the T1 volume and applying the derived transformation matrix to the CBFmap using SPM8 (www.fil.ion.ucl.ac.uk/spm), bringing the CBF maps into the space of theT1 volumes. In a similar fashion the T1 volume was then normalized to the MontrealNeurological Institute (MNI) standard space and the derived transformation matrix appliedto the CBF map. Finally, the normalized CBF images were smoothed with a 8mm kernel inSPM8.
To derive mean gray matter CBF, the ICBM probabilistic GM map available in SPM(thresholded at 0.30) was applied to the CBF maps in MNI space and the mean voxel valuewas extracted using MarsBaR (http://marsbar.sourceforge.net). Mean CBF values werescaled to 50 ml/min/100g.
Between and within subject noise was accounted for by using a reference cluster as acovariate in all voxel-wise analyses and mean CBF statistical analyses(27). The referencecluster consisted of 549, 2 x 2 x 2 mm voxels centered in the left middle temporal gyrus, in aregion where there was no difference in CBF between the MetS group (M = 35.13, SE =1.68) and the control group (M = 37.92, SE = 1.42), F = 1.52, p = 0.22. The region wasderived via a data-driven method developed for normalizing [(18)F]FDG Positron EmissionTomography scans(28). The raw values from the reference region were extracted withMarsBaR.
T1-weighted volumetricProcessing of the T1-weighted images was performed using a six-class segmentationprocessing stream in SPM8. Processing involved bias correction and iterative normalization
Birdsill et al. Page 4
Obesity (Silver Spring). Author manuscript; available in PMC 2014 January 01.
NIH
-PA
Author M
anuscriptN
IH-P
A A
uthor Manuscript
NIH
-PA
Author M
anuscript

and segmentation of the original anatomic images(29) into distinct tissue classes (graymatter, white matter, cerebrospinal fluid, skull, fat tissue, and image background) usingspatial prior information. GM tissue segments were normalized to MNI template space via a12-parameter affine transformation and nonlinear deformation (with a warp frequency cutoffof 25). The segmented and normalized GM maps were “modulated”, which involves scalingthe final GM maps by the amount of contraction or expansion required to warp the images tothe template. The final result was a GM probability map for each participant in which thetotal amount of GM remained the same as in the original images. The spatially normalizedGM maps were smoothed using an 8-mm Gaussian kernel before being entered into thestatistical analysis. The volume of the SPM8 GM segmentation was divided by intracranialvolume (ICV) to create a total GM volume ratio variable.
ICV was calculated to scale for differences in head size in the GM and WMH analyses usinga “reverse brain masking” method(30). First, summing the gray, white and CSF ICBMprobability maps created an ICV probability map. Then, the inverse deformation fieldresulting from unified segmentation on each subject image was applied to the ICVprobability map, in order to produce an ICV mask in native space. A threshold of 90% wasapplied to this subject specific ICV probability map and the total volume was extracted.
T2FLAIR ProcessingTotal WMH lesion volume was calculated using the lesion segmentation toolbox inSPM8(31). The toolbox seeds lesions based on spatial probability from T1 images andhyperintense outliers on T2FLAIR images. The initial threshold was set at 0.30 and is usedto create the binary conservative lesion belief map from the GM lesion belief map. Next, agrowth algorithm grows these seeds from the conservative lesion belief map toward aprobabilistic liberal lesion belief map from GM, WM, and CSF. Lastly, we used a thresholdof 1.00 on the resulting lesion belief map. The resulting WMH volume was divided by ICVto give a ratio (WMHr). For voxel-wise WMH analysis, probability lesion belief maps werenormalized to MNI space and smoothed with a 10mm Gaussian kernel.
Statistical analysesWith the exception of the voxel-wise image analysis conducted in SPM8, statistical analyseswere carried out in IBM SPSS version 20.0 (Chicago, IL). Demographic differencesbetween groups were assessed with t-tests for continuous variables and χ2 tests forcategorical variables. The effect of APOE4 and parental family history on the brain indicesand cognitive function were assessed using ANCOVA. Age was used as a covariate in alltests involving WMHr, GM volume, or cognition.
To test the hypothesis that MetS is associated with changes in CBF, WMH, GM volume,and cognitive factor scores, ANCOVA was utilized. Each model used MetS status entered asthe independent variable and a brain measure or cognitive factor score as the dependentvariable. As a follow-up analysis, the sum of present MetS factors was used in linearregression to predict CBF in order to better understand how the clustering of MetS factorsaffects CBF. To determine the regional voxel-wise brain differences in CBF, WMHs andGM volume between MetS and control, ANCOVA was utilized in SPM8. To minimize type1 error, all voxel-wise analyses controlled for multiple comparisons using FWE p < .05.Age, sex, and ICV were used as covariates in WMH and GM volume voxel-wise analyses.Age, sex, reference region, and inversion time were used as covariates in voxel-wise CBFanalyses. Voxel-wise GM volume analyses were restricted using an absolute threshold of0.10. CBF voxel-wise analyses were restricted using a GM mask created by thresholding theICBM probabilistic GM map by 0.3. WMH voxel-wise analyses were restricted using a WMmask created by thresholding the ICBM probabilistic WM map by 0.3.
Birdsill et al. Page 5
Obesity (Silver Spring). Author manuscript; available in PMC 2014 January 01.
NIH
-PA
Author M
anuscriptN
IH-P
A A
uthor Manuscript
NIH
-PA
Author M
anuscript

The hypothesis that differences in CBF were associated with differences in WMHr, GMvolume ratio, and cognitive factor scores was tested using linear correlations betweenreference cluster adjusted CBF, WMHr, GM volume ratio, and cognitive factor scorespartialing out age and inversion time.
Next, to test the extent to which MetS factors affected CBF, we used a single linearregression model with each MetS factor status (abdominal obesity, triglycerides, HDLcholesterol, blood pressure, and fasting glucose) entered as an independent variable andmean CBF as the dependent variable controlling for the reference cluster and inversion time.Collinearity was assessed within the linear regression model using the tolerance statistic,which represents the proportion of variance explained by a factor that is not related to theother factors in the model (32).
Lastly, the hypothesis that CBF would mediate differences in cognition found between MetSand controls was tested using mediator analysis(33) performed in the PROCESS macro forSPSS (www.afhyes.com). CBF was adjusted for reference cluster and inversion time andage was used as a covariate in the mediation model. The direct and indirect effects werecalculated and significance was determined using bootstrapping (k = 5000) with 95%confidence intervals.
ResultsDemographic and Brain Measures
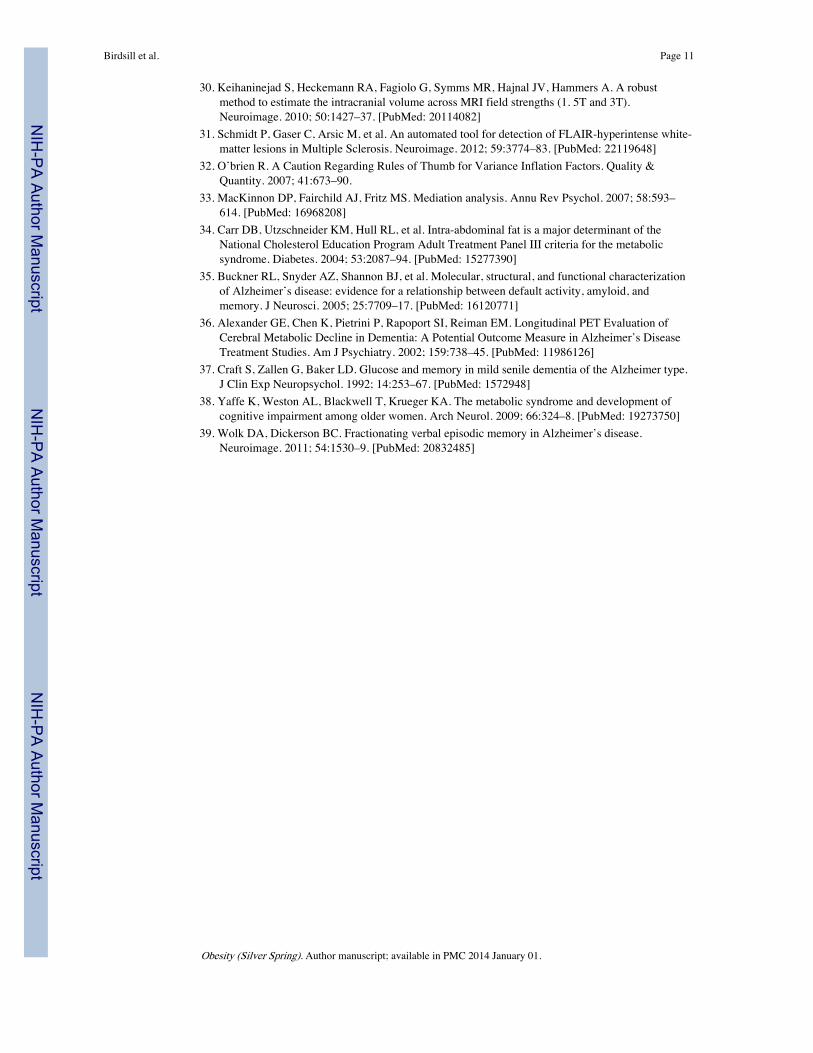
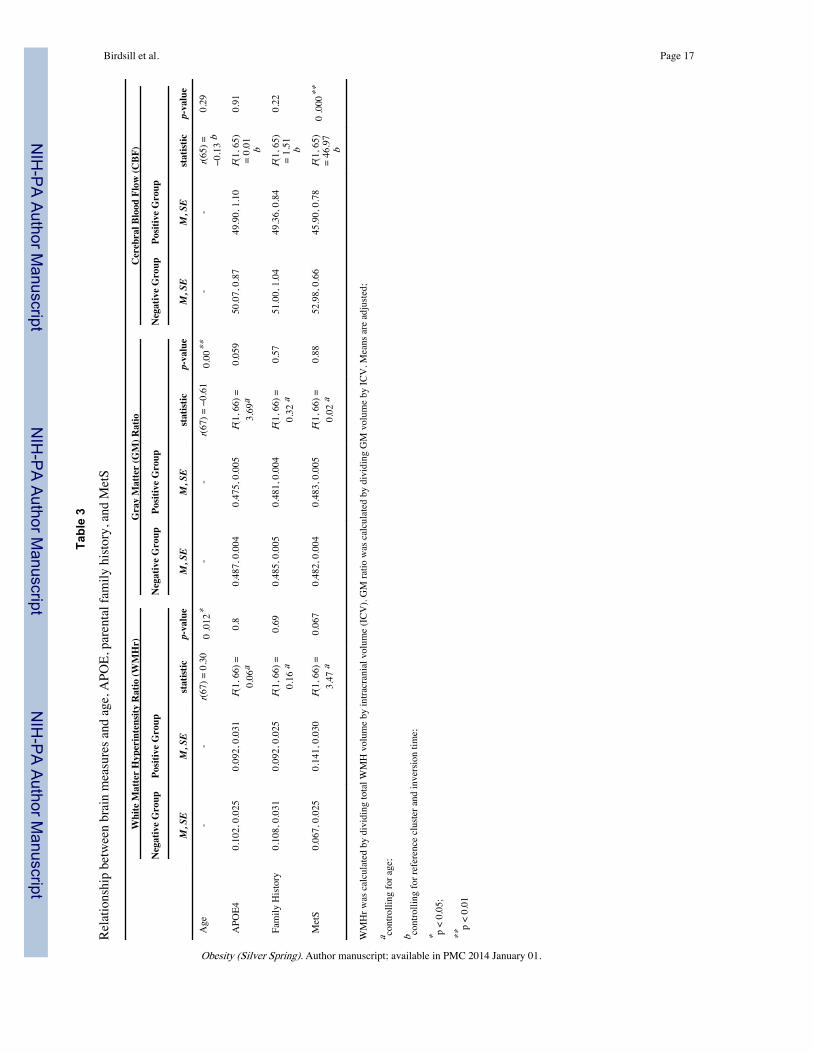
There were no differences between the MetS and the control group on sex, APOE4, orparental family history. MetS participants were 3.6 years older on average and had 1.8 feweryears of education than controls. Participant demographics between control and MetSgroups are given in Table 1. With increasing age, WMHr increased and GM volume ratiodecreased. Age did not have an effect on CBF in this age range. APOE4 carriers did notdiffer in WMHr or CBF compared to non-APOE4 carriers. APOE4 carriers had marginallylower GM volume ratio compared to non-carriers. Parental family history did not have aneffect on brain indices in this sample. Table 3 shows the results of the tests performed withbrain indices. In addition, no associations were noted between CBF, WMHr, or GM volumeratio.
WMHWhile controlling for age, WMHr was marginally higher in the MetS group compared to thecontrol group (Table 3). Voxel-wise analyses of WMH probability maps indicated noregional differences between MetS and controls.
GM VolumeThe MetS and control groups did not differ on GM volume ratio controlling for age (Table3). A voxel-wise analysis of GM comparing MetS to controls revealed no significantregional volume differences between the two groups.
CBFTotal GM CBF was 15% lower in the MetS group compared to the control group (Table 3).As shown in Figure 1, possessing more MetS factors was associated with increasingly lowerCBF, r(65) = 0.31, p < 0.001.
In order to determine how total GM CBF was predicted by the MetS factors, all of thefactors were entered as independent variables into a linear regression model with CBF as thedependent variable. The resulting model (Table 4) shows that waist and triglycerides were
Birdsill et al. Page 6
Obesity (Silver Spring). Author manuscript; available in PMC 2014 January 01.
NIH
-PA
Author M
anuscriptN
IH-P
A A
uthor Manuscript
NIH
-PA
Author M
anuscript

significant predictors and glucose was near significance. Collinearity analysis in this modeldemonstrated that each factor largely had an independent effect on CBF that was not relatedto the other factors.
A voxel-wise CBF analysis showed that the MetS group had lower CBF in the medial andlateral aspects of frontal and parietal lobe GM, and lateral areas of the temporal and occipitallobe GM (Figure 2).
CognitionThe MetS group (M = −0.33, SE = 0.17) had a significantly lower immediate memory factorscore compared to the control group (M = 0.22, SE = 0.15), F(1, 66) = 5.58, p = 0.021. Thespeed and flexibility factor score was marginally lower for the MetS group (M = −0.092, SE= 0.140) compared to the control group (M = 0.267, SE = 0.117), F(1, 65) = 3.71, p = 0.058.
Total GM CBF, WMHr, and GM volume ratio were also used to predict cognitive functioncontrolling for age. Correlation analysis showed that participants with lower CBF had lowerimmediate memory factor scores (r = 0.37, p = 0.002). There was a trend of higher WMHrbeing associated with lower immediate memory factor scores (r = −0.22, p = 0.070). Noneof the other factor scores were correlated with CBF, WMHr, or GM volume ratio.
Finally, based on the finding that MetS participants differed from controls on both CBF andimmediate memory, we conducted a mediation analysis that tested the extent to which CBFmediated the relationship between MetS and lower immediate memory function. We foundthat CBF was a significant mediator between MetS and immediate memory (Figure 3). Thedirect effect of MetS on immediate memory was estimated to be r = −0.17, while the indirecteffect of MetS on immediate memory accounted by CBF was estimated to be r = −0.41; 95% CI [−0.82, −0.08].
ConclusionsThe metabolic syndrome is increasingly recognized as contributing to adverse healthoutcomes, including increased risk for cardiovascular disease, type 2 diabetes and, morerecently, cognitive decline(6). The purpose of this study was to examine the effect of MetSon brain health and cognition in middle-aged adults. In particular, the study aimed todetermine the effect of MetS on CBF, and determine the extent to which CBF is associatedwith structural gray and white matter alterations and cognitive differences. We found thatCBF is compromised in MetS, and both MetS and CBF are related to lower memoryperformance. Furthermore, the results of the mediation analysis indicate that CBF partiallymediates the relationship between MetS and memory performance.
While several studies point toward midlife cardiovascular risk in predicting cognitivedecline and dementia later in life (4, 7, 8), little is known about the midlife brain changesthat may underlie such cognitive changes. Cardiovascular risk factors are associated withdecreased cerebral perfusion (10–13). As an extension of these findings, our study foundthat CBF is compromised in participants with MetS. Indeed, having an increasing number ofMetS factors was associated with decreasing cerebral perfusion.
Regarding the individual contributions of the metabolic risk factors making up MetS, lowerCBF was most robustly associated with abdominal obesity, and to a lesser extenttriglycerides and fasting glucose. This finding is in line with recent studies suggesting thatobesity may be the major underlying pathophysiology in metabolic syndrome(34). Largersample sizes will be needed in future studies to further parse the independent effects offactors.
Birdsill et al. Page 7
Obesity (Silver Spring). Author manuscript; available in PMC 2014 January 01.
NIH
-PA
Author M
anuscriptN
IH-P
A A
uthor Manuscript
NIH
-PA
Author M
anuscript

A voxel-wise comparison of CBF between MetS and controls showed that perfusion waslower in medial and lateral frontal and parietal lobes, and lateral areas of the temporal andoccipital lobes. These brain regions are supplied primarily by branches of the internalcarotid arteries. While Iit is unknown whether our participants were showing lower CBF dueto differences in neural requirements, or due to vascular insufficiency. , the incidence ofocclusion and atherosclerosis is more common in the carotid system than the vertebral-basilar system(34), suggesting that the pattern of reduced CBF observed in MetS was due toarterial disease rather than a decrease in metabolic function. Furthermore, among patientswith transient ischemic attack and stroke, metabolic syndrome is associated with moresevere intracranial arterial stenosis and diabetes is more frequent with stenosis of the internalcarotid arteries than in the vertebral-basilar system(35). The interaction between MetS riskfactors and the structural and hemodynamic factors that vary by vascular location needs tobe investigated.
Given the increased interest in altered brain metabolism in aging, and Alzheimer’s disease inparticular(35–37), it will be of paramount importance to understand the mechanisms thatunderlie the observed differences in CBF found in this study. Further studies utilizing newlydeveloped MR technology, for example PCVIPR (3D phase contrast vastly undersampledisotropic projection reconstruction) will provide flow measurements from large vessels, andwill help clarify the contribution of flow to perfusion measurements and other blood basedMR imaging (e.g. fMRI and resting BOLD). Likewise, complementary imaging using FDG-PET is expected to shed light on the relationship between cardiovascular risk factors, inparticular altered insulin signaling, and altered metabolic demand.
In consideration of the effect of MetS on structural brain changes, we found little evidencefor an effect of MetS on either white matter lesion load or gray matter volume. Analysesusing measures from the whole brain, and those using a voxel-wise approach, did notsuggest that MetS at mid-life is associated with significant structural brain alteration.
While MetS has been associated with cognitive decline in older adults(38), this study showsthat cognitive differences can be measured as early as midlife. Additionally, for the firsttime, this study significantly identified CBF as a partial mediator between MetS andcognitive performance. While suggestive, further work will be needed to determine whetherlower CBF is responsible for the decreased immediate memory performance or is aconsequence of subtle neural injury which underlies both the reduced CBF demand andaltered cognitive performance.
Immediate memory as measured on initial trials of word list learning reflects the operationof multiple cognitive processes, including auditory verbal working memory, strategicprocessing, and semantic encoding(39). These processes, as well as cognitive speed andflexibility, are relevant to the broad category of executive function, and current findingssuggest that, at least in midlife, the cognitive footprint of MetS and/or lowered CBF may bemost readily apparent on aspects of memory that are dependent on executive skills.
There are a few limitations that should be noted. This study is cross-sectional, andlongitudinal studies are needed to determine cognitive decline. This study recruitedparticipants from an established registry for Alzheimer’s research, potentially limiting thegeneralizability of these results. Another limitation is the sample size. While we successfullymeasured the independent contributions of individual risk factors, a larger sample wouldprovide more power to observe the effects of single risk factors. Additionally, the samplesize relative to the heterogeneity of WMH volumes and regional distribution may haverestrained WMH analyses. The sample size also precluded analyses on the effects ofmedication, which is an interesting area of study and expected to shed light on the efficacy
Birdsill et al. Page 8
Obesity (Silver Spring). Author manuscript; available in PMC 2014 January 01.
NIH
-PA
Author M
anuscriptN
IH-P
A A
uthor Manuscript
NIH
-PA
Author M
anuscript

of interventions for cognitive decline. At the same time, it should be noted that one of thestrongest predictors of CBF was abdominal obesity, which is the only factor lacking a drugintervention. Determining the effect of medications, and accounting for their use instatistical models may better reveal the effects of some of the MetS factors on CBF. Thecross-sectional design and sample size also limited any analysis on the duration of MetS orconsisting factors, which could modulate the results presented in this study. Finally, weconsistently observed effects of MetS across analyses; although, type 1 error is possible andthese results will need replication in additional samples.
In summary, this study suggests that reducing the number of metabolic risk factors may beimportant in preserving CBF and cognitive health.
AcknowledgmentsThe authors gratefully acknowledge Nancy Davenport-Sis, Amy Hawley, and the support of researchers and staff atthe Waisman Center, University of Wisconsin-Madison, for their assistance in recruitment, data collection, and dataanalysis. Above all, we wish to thank our dedicated volunteers for their participation in this research.
Funding Sources
This project was supported by the Alzheimer’s Association, NIRG-09-132626, and in part by the National Instituteon Aging (R01 AG027161 [MAS], ADRC P50 AG033514 [SA]), and the University of Wisconsin Institute forClinical and Translational Research, funded through a National Center for Research Resources/National Institutesof Health Clinical and Translational Science Award, 1UL1RR025011. The project was also facilitated by thefacilities and resources at the Geriatric Research, Education, and Clinical Center (GRECC) of the William S.Middleton Memorial Veterans Hospital, Madison, WI. GRECC MS # 2012-XX. The funders had no role in studydesign, data collection and analysis, decision to publish, or preparation of the manuscript.
References1. Alberti KG, Eckel RH, Grundy SM, et al. Harmonizing the metabolic syndrome: a joint interim
statement of the International Diabetes Federation Task Force on Epidemiology and Prevention;National Heart, Lung, and Blood Institute; American Heart Association; World Heart Federation;International Atherosclerosis Society; and International Association for the Study of Obesity.Circulation. 2009; 120:1640–5. [PubMed: 19805654]
2. Ervin, RB. National health statistics reports; no 13. National Center for Health Statistics;Hyattsville, MD: 2009. Prevalence of metabolic syndrome among adults 20 years of age and over,by sex, age, race and ethnicity, and body mass index: United States, 2003–2006. 2009.
3. Centers for Disease Control and Prevention and The Merck Company Foundation. The State ofAging and Health in America, 2007. The Merck Company Foundation; Whitehouse Station, N.J:2007.
4. Kivipelto M, Ngandu T, Laatikainen T, Winblad B, Soininen H, Tuomilehto J. Risk score for theprediction of dementia risk in 20 years among middle aged people: a longitudinal, population-basedstudy. Lancet Neurol. 2006; 5:735–41. [PubMed: 16914401]
5. Vanhanen M, Koivisto K, Moilanen L, et al. Association of metabolic syndrome with Alzheimerdisease. Neurology. 2006; 67:843–7. [PubMed: 16966548]
6. Yaffe K, Kanaya A, Lindquist K, et al. The metabolic syndrome, inflammation, and risk ofcognitive decline. Jama. 2004; 292:2237–42. [PubMed: 15536110]
7. Fitzpatrick AL, Kuller LH, Lopez OL, et al. Midlife and late-life obesity and the risk of dementia:cardiovascular health study. Arch Neurol. 2009; 66:336–42. [PubMed: 19273752]
8. Xu W, Qiu C, Gatz M, Pedersen NL, Johansson B, Fratiglioni L. Mid- and late-life diabetes inrelation to the risk of dementia: a population-based twin study. Diabetes. 2009; 58:71–7. [PubMed:18952836]
9. Frisardi V, Solfrizzi V, Seripa D, et al. Metabolic-cognitive syndrome: a cross-talk betweenmetabolic syndrome and Alzheimer’s disease. Ageing Res Rev. 2010; 9:399–417. [PubMed:20444434]
Birdsill et al. Page 9
Obesity (Silver Spring). Author manuscript; available in PMC 2014 January 01.
NIH
-PA
Author M
anuscriptN
IH-P
A A
uthor Manuscript
NIH
-PA
Author M
anuscript

10. Rogers RL, Meyer JS, McClintic K, Mortel KF. Reducing Hypertriglyceridemia in Elderly Patientswith Cerebrovascular Disease Stabilizes or Improves Cognition and Cerebral Perfusion.Angiology. 1989; 40:260–9. [PubMed: 2705633]
11. Muller M, van der Graaf Y, Visseren FL, Mali WP, Geerlings MI. Hypertension and longitudinalchanges in cerebral blood flow: The SMART-MR study. Ann Neurol. 2012
12. Carlsson CM, Xu G, Wen Z, et al. Effects of Atorvastatin on Cerebral Blood Flow in Middle-AgedAdults at Risk for Alzheimer’s Disease: A Pilot Study. Curr Alzheimer Res. 2011 Epub ahead ofprint.
13. Willeumier KC, Taylor DV, Amen DG. Elevated BMI is associated with decreased blood flow inthe prefrontal cortex using SPECT imaging in healthy adults. Obesity (Silver Spring). 2011;19:1095–7. [PubMed: 21311507]
14. Johnson NA, Jahng GH, Weiner MW, et al. Pattern of cerebral hypoperfusion in Alzheimer diseaseand mild cognitive impairment measured with arterial spin-labeling MR imaging: initialexperience. Radiology. 2005; 234:851–9. [PubMed: 15734937]
15. Sager MA, Hermann B, La Rue A. Middle-aged children of persons with Alzheimer’s disease:APOE genotypes and cognitive function in the Wisconsin Registry for Alzheimer’s Prevention. JGeriatr Psychiatry Neurol. 2005; 18:245–9. [PubMed: 16306248]
16. McKhann G, Drachman D, Folstein M, Katzman R, Price D, Stadlan EM. Clinical diagnosis ofAlzheimer’s disease: report of the NINCDS-ADRDA Work Group under the auspices ofDepartment of Health and Human Services Task Force on Alzheimer’s Disease. Neurology. 1984;34:939–44. [PubMed: 6610841]
17. Dowling NM, Hermann B, La Rue A, Sager MA. Latent structure and factorial invariance of aneuropsychological test battery for the study of preclinical Alzheimer’s disease. Neuropsychology.2010; 24:742–56. [PubMed: 21038965]
18. Spreen, O.; Strauss, E. A compendium of neuropsychological tests: administration, norms, andcommentary. 2. Oxford University Press; New York: 1998.
19. Wechsler, D. WAIS-III: Wechsler Adult Intelligence Scale. Psychological Corporation; 1997.20. Trenerry, MR. Stroop Neuropsychological Screening Test Manual. Psychological Assessment
Resources; 1989.21. Reitan, RM.; Wolfson, D. The Halstead-Reitan Neuropsychological Test Battery: Theory and
Clinical Interpretation. Neuropsychology Press; 1993.22. Backman L, Jones S, Berger AK, Laukka EJ, Small BJ. Cognitive impairment in preclinical
Alzheimer’s disease: a meta-analysis. Neuropsychology. 2005; 19:520–31. [PubMed: 16060827]23. Ye FQ, Frank JA, Weinberger DR, McLaughlin AC. Noise reduction in 3D perfusion imaging by
attenuating the static signal in arterial spin tagging (ASSIST). Magn Reson Med. 2000; 44:92–100.[PubMed: 10893526]
24. Dai W, Garcia D, de Bazelaire C, Alsop DC. Continuous flow-driven inversion for arterial spinlabeling using pulsed radio frequency and gradient fields. Magn Reson Med. 2008; 60:1488–97.[PubMed: 19025913]
25. Garcia DM, Duhamel G, Alsop DC. Efficiency of inversion pulses for background suppressedarterial spin labeling. Magn Reson Med. 2005; 54:366–72. [PubMed: 16032674]
26. Xu G, Rowley HA, Wu G, et al. Reliability and precision of pseudo-continuous arterial spinlabeling perfusion MRI on 3. 0 T and comparison with 15O-water PET in elderly subjects at riskfor Alzheimer’s disease. NMR Biomed. 2010; 23:286–93. [PubMed: 19953503]
27. Tosun D, Mojabi P, Weiner MW, Schuff N. Joint analysis of structural and perfusion MRI forcognitive assessment and classification of Alzheimer’s disease and normal aging. Neuroimage.2010; 52:186–97. [PubMed: 20406691]
28. Yakushev I, Hammers A, Fellgiebel A, et al. SPM-based count normalization provides excellentdiscrimination of mild Alzheimer’s disease and amnestic mild cognitive impairment from healthyaging. Neuroimage. 2009; 44:43–50. [PubMed: 18691659]
29. Ashburner J, Friston KJ. Unified segmentation. Neuroimage. 2005; 26:839–51. [PubMed:15955494]
Birdsill et al. Page 10
Obesity (Silver Spring). Author manuscript; available in PMC 2014 January 01.
NIH
-PA
Author M
anuscriptN
IH-P
A A
uthor Manuscript
NIH
-PA
Author M
anuscript
30. Keihaninejad S, Heckemann RA, Fagiolo G, Symms MR, Hajnal JV, Hammers A. A robustmethod to estimate the intracranial volume across MRI field strengths (1. 5T and 3T).Neuroimage. 2010; 50:1427–37. [PubMed: 20114082]
31. Schmidt P, Gaser C, Arsic M, et al. An automated tool for detection of FLAIR-hyperintense white-matter lesions in Multiple Sclerosis. Neuroimage. 2012; 59:3774–83. [PubMed: 22119648]
32. O’brien R. A Caution Regarding Rules of Thumb for Variance Inflation Factors. Quality &Quantity. 2007; 41:673–90.
33. MacKinnon DP, Fairchild AJ, Fritz MS. Mediation analysis. Annu Rev Psychol. 2007; 58:593–614. [PubMed: 16968208]
34. Carr DB, Utzschneider KM, Hull RL, et al. Intra-abdominal fat is a major determinant of theNational Cholesterol Education Program Adult Treatment Panel III criteria for the metabolicsyndrome. Diabetes. 2004; 53:2087–94. [PubMed: 15277390]
35. Buckner RL, Snyder AZ, Shannon BJ, et al. Molecular, structural, and functional characterizationof Alzheimer’s disease: evidence for a relationship between default activity, amyloid, andmemory. J Neurosci. 2005; 25:7709–17. [PubMed: 16120771]
36. Alexander GE, Chen K, Pietrini P, Rapoport SI, Reiman EM. Longitudinal PET Evaluation ofCerebral Metabolic Decline in Dementia: A Potential Outcome Measure in Alzheimer’s DiseaseTreatment Studies. Am J Psychiatry. 2002; 159:738–45. [PubMed: 11986126]
37. Craft S, Zallen G, Baker LD. Glucose and memory in mild senile dementia of the Alzheimer type.J Clin Exp Neuropsychol. 1992; 14:253–67. [PubMed: 1572948]
38. Yaffe K, Weston AL, Blackwell T, Krueger KA. The metabolic syndrome and development ofcognitive impairment among older women. Arch Neurol. 2009; 66:324–8. [PubMed: 19273750]
39. Wolk DA, Dickerson BC. Fractionating verbal episodic memory in Alzheimer’s disease.Neuroimage. 2011; 54:1530–9. [PubMed: 20832485]
Birdsill et al. Page 11
Obesity (Silver Spring). Author manuscript; available in PMC 2014 January 01.
NIH
-PA
Author M
anuscriptN
IH-P
A A
uthor Manuscript
NIH
-PA
Author M
anuscript

Figure 1.Mean CBF is displayed by groups defined by the number of MetS factors present in anindividual. CBF is adjusted by reference cluster and inversion time.
Birdsill et al. Page 12
Obesity (Silver Spring). Author manuscript; available in PMC 2014 January 01.
NIH
-PA
Author M
anuscriptN
IH-P
A A
uthor Manuscript
NIH
-PA
Author M
anuscript

Figure 2.Participants with metabolic syndrome showed significantly lower CBF in large portions ofthe cortical surface of the frontal and parietal lobes, and the lateral and superior portions ofthe temporal and occipital lobes. Voxel-wise results are shown here at p < 0.05, FWEcorrected, controlling for age, sex, and reference cluster. The color of the overlay reflects thesize of the t-statistic.
Birdsill et al. Page 13
Obesity (Silver Spring). Author manuscript; available in PMC 2014 January 01.
NIH
-PA
Author M
anuscriptN
IH-P
A A
uthor Manuscript
NIH
-PA
Author M
anuscript

Figure 3.The first model displays the total effect, c, between MetS and immediate memory. Thesecond uses CBF as a mediator that is partially accounting for the effect between MetS andimmediate memory. The indirect effect, ab = −0.41, is the portion of the effect accounted forby CBF. Significance of the mediation was determined using bootstrapping (k = 5000) with95% confidence intervals of the indirect effect [−0.82, − 0.08]. Age, reference cluster, andinversion time were controlled.
Birdsill et al. Page 14
Obesity (Silver Spring). Author manuscript; available in PMC 2014 January 01.
NIH
-PA
Author M
anuscriptN
IH-P
A A
uthor Manuscript
NIH
-PA
Author M
anuscript
NIH
-PA
Author M
anuscriptN
IH-P
A A
uthor Manuscript
NIH
-PA
Author M
anuscript
Birdsill et al. Page 15
Tabl
e 1
Sam
ple
dem
ogra
phic
s and
cog
nitiv
e fa
ctor
scor
es b
etw
een
the
cont
rol a
nd M
etS
grou
ps c
ontro
lling
for a
ge.
Dem
ogra
phic
All
N =
69
Con
trol
s n =
40
Met
S n
= 29
Stat
istic
p-va
lue
Wom
en, n
(%)
43 (6
2.3)
27 (6
7.5)
16 (5
5.2)
χ2 =
1.09
0.29
7
Fam
ily H
istor
y, n
(%)
42 (6
0.9)
21 (5
2.5)
21 (7
2.4)
χ2 =
2.80
0.09
4
APO
E4 C
arrie
rs, n
(%)
27 (3
9.1)
17 (4
2.5)
10 (3
4.5)
χ2 =
0.45
0.50
1
Age
, M (S
D)
60.4
(6.1
)58
.9 (5
.8)
62.6
(5.8
)t=
2.65
0.01
1*
Educ
atio
n, M
(SD
)16
.4 (2
.5)
17.2
(2.4
)15
.4 (2
.4)
t=3.
030.
003*
*
Cogn
itive
Fac
tor S
core
, M (S
E)
Spee
d an
d Fl
exib
ility
0.09
(0.0
9)0.
27 (0
.12)
−0.0
9 (0
.14)
F(1,
65)
= 3
.71
0.05
8
Wor
king
Mem
ory
0.10
(0.1
33)
0.10
(0.1
8)0.
10 (0
.21)
F(1,
66)
= 0
.00
0.98
Ver
bal L
earn
ing
and
Mem
ory
0.10
(0.1
1)0.
18 (0
.15)
0.03
(0.1
8)F(
1, 6
6) =
0.4
10.
52
Imm
edia
te M
emor
y−0
.06
(0.1
1)0.
22 (0
.15)
−0.3
3 (0
.17)
F(1,
66)
= 5
.58
0.02
1*
* p <
0.05
;
**p
< 0.
01
Obesity (Silver Spring). Author manuscript; available in PMC 2014 January 01.
NIH
-PA
Author M
anuscriptN
IH-P
A A
uthor Manuscript
NIH
-PA
Author M
anuscript
Birdsill et al. Page 16
Table 2
Distribution of MetS factors in the sample (n, %)
All (N = 69) MetS (n = 29) Controls (n = 40)
High Waist 30, 43% 23, 79% 7, 17%
High Triglycerides 19, 28% 14, 48% 5, 13%
Low HDL 29, 42% 21, 72% 8, 20%
Hypertension 42, 61% 27, 83% 15, 38%
High Glucose 26, 37% 21, 72% 5, 13%
Obesity (Silver Spring). Author manuscript; available in PMC 2014 January 01.
NIH
-PA
Author M
anuscriptN
IH-P
A A
uthor Manuscript
NIH
-PA
Author M
anuscript
Birdsill et al. Page 17
Tabl
e 3
Rela
tions
hip
betw
een
brai
n m
easu
res a
nd a
ge, A
POE,
par
enta
l fam
ily h
istor
y, a
nd M
etS
Whi
te M
atte
r H
yper
inte
nsity
Rat
io (W
MH
r)G
ray
Mat
ter
(GM
) Rat
ioC
ereb
ral B
lood
Flo
w (C
BF)
Neg
ativ
e G
roup
Posit
ive
Gro
upN
egat
ive
Gro
upPo
sitiv
e G
roup
Neg
ativ
e G
roup
Posit
ive
Gro
up
M, S
EM
, SE
stat
istic
p-va
lue
M, S
EM
, SE
stat
istic
p-va
lue
M, S
EM
, SE
stat
istic
p-va
lue
Age
--
r(67)
= 0
.30
0 .0
12*
--
r(67)
= −
0.61
0.00
**-
-r(6
5) =
−0.1
3 b
0.29
APO
E40.
102,
0.0
250.
092,
0.0
31F(
1, 6
6) =
0.06
a0.
80.
487,
0.0
040.
475,
0.0
05F(
1, 6
6) =
3.69
a0.
059
50.0
7, 0
.87
49.9
0, 1
.10
F(1,
65)
= 0.
01 b
0.91
Fam
ily H
istor
y0.
108,
0.0
310.
092,
0.0
25F(
1, 6
6) =
0.16
a0.
690.
485,
0.0
050.
481,
0.0
04F(
1, 6
6) =
0.32
a0.
5751
.00,
1.0
449
.36,
0.8
4F(
1, 6
5)=
1.51 b
0.22
Met
S0.
067,
0.0
250.
141,
0.0
30F(
1, 6
6) =
3.47
a0.
067
0.48
2, 0
.004
0.48
3, 0
.005
F(1,
66)
=0.
02 a
0.88
52.9
8, 0
.66
45.9
0, 0
.78
F(1,
65)
= 46
.97
b
0 .0
00**
WM
Hr w
as c
alcu
late
d by
div
idin
g to
tal W
MH
vol
ume
by in
tracr
ania
l vol
ume
(ICV
). G
M ra
tio w
as c
alcu
late
d by
div
idin
g G
M v
olum
e by
ICV
. Mea
ns a
re a
djus
ted;
a cont
rolli
ng fo
r age
;
b cont
rolli
ng fo
r ref
eren
ce c
luste
r and
inve
rsio
n tim
e;
* p <
0.05
;
**p
< 0.
01
Obesity (Silver Spring). Author manuscript; available in PMC 2014 January 01.

NIH
-PA
Author M
anuscriptN
IH-P
A A
uthor Manuscript
NIH
-PA
Author M
anuscript
Birdsill et al. Page 18
Table 4
Linear regression model with MetS factors predicting mean CBF. R = 0.69, F = 11.65, p < 0.001
Standardized coefficients Collinearity
Beta t p tolerance
High Waist −0.34 −3.33 0.001** 0.79
High Triglycerides −0.32 −3.38 0.001** 0.94
Low HDL −0.13 −1.36 0.18 0.86
Hypertension −0.09 −0.93 0.36 0.83
High Glucose −0.19 −1.89 0.064 0.81
Controlling reference cluster and inversion time;
**p < 0.01; type III sums of squares
Obesity (Silver Spring). Author manuscript; available in PMC 2014 January 01.