Embed Size (px)
Citation preview

Nigeria Economic Performance Assessment
February 2006
This publication was produced by Nathan Associates Inc. for review by the United States Agency for International Development.


Nigeria Economic Performance Assessment
DISCLAIMER
The authors’ views expressed in this publication do not necessarily reflect the views of the United States Agency for International Development or the United States Government.

Sponsored by the Economic Growth office of USAID’s Bureau of Economic Growth, Agriculture and Trade (EGAT), and implemented by Nathan Associates Inc. under Contract No. PCE-I-00-00-00013-00, Task Order 004, the Country Analytical Support (CAS) Project, 2004–2006, has developed a standard methodology for producing analytical reports to provide a clear and concise evaluation of economic growth performance in designated host countries. These reports are tailored to meet the needs of USAID missions and regional bureaus for country specific analysis. Each report contains
⎯ A synthesis of data drawn from numerous sources, including World Bank publications and other international data sets currently used by USAID for economic growth analysis, as well as accessible host-country data sources;
⎯ International benchmarking to assess country performance in comparison to similar countries and groups of countries;
⎯ An easy-to-read analytic narrative that highlights areas in which a country’s performance is particularly strong or weak, thereby assisting in the identification of future programming priorities.
Under the CAS project, Nathan Associates will also respond to mission requests for in-depth sector studies to examine more thoroughly particular issues identified by the data analysis in these country reports.
The authors of this report are Rose Mary Garcia, Richard Kohl, Ann Ruengsorn, and Julia Zislin.
The CTO for this project is Yoon Lee. USAID missions and bureaus may seek assistance and funding for CAS studies by contacting Rita Aggarwal, USAID/EGAT/EG Activity Manager for the CAS project at [email protected].
Electronic copies of reports and materials relating to the CAS project are available at www.nathaninc.com. For further information or hard copies of CAS publications, please contact
Bruce Bolnick Chief of Party, CAS Project Nathan Associates Inc. [email protected]

Contents Highlights of Nigeria’s Performance iii
Nigeria: Notable Strengths and Weaknesses – Selected Indicators iv
1. Introduction 1
2. Overview of the Economy 3
Growth Performance 3
Poverty and Inequality 5
Economic Structure 7
Demography and Environment 8
Gender 8
3. Private Sector Enabling Environment 11
Fiscal and Monetary Policy 11
Business Environment 13
Financial Sector 15
External Sector 17
Economic Infrastructure 21
Science and Technology 23
4. Pro-Poor Growth Environment 25
Health 25
Education 27
Employment and Workforce 28
Agriculture 30
Appendix. Indicators

I I C O N T E N T S
Illustrations
Figures Figure 2-1. Real GDP Growth, percent 4 Figure 2-2. GDP Per Capita, current US dollars 4 Figure 2-3. Percent of Population below Minimum Dietary Energy Consumption 7 Figure 2-4. Gross Male-to-Female Enrollment Ratio, All Levels 9 Figure 3-1. Inflation Rate 12 Figure 3-2. Corruption Perception Index 14 Figure 3-3. Monetization, Broad Money Supply (M2) as a Percent of GDP 15 Figure 3-4. Domestic Credit to the Private Sector as a Percent of GDP 16 Figure 3-5. Top Three Exports as a Percent of Total Exports (3-digit SITC) 18 Figure 3-6. Current Account Balance as a Percent of GDP 19 Figure 3-7. Debt Service Ratio as a Percent of Exports 20 Figure 3-8. Telephone Density, Fixed Line and Mobile, per 1,000 People 22 Figure 4-1. Life Expectancy at Birth 26 Figure 4-2. Public Health Expenditure as Percent of GDP 27 Figure 4-3. Net Primary Enrollment, Female to Male, percent 28 Figure 4-4. Female Labor Force Participation Rate 29 Figure 4-5. Agricultural Policy Costs Index 31
Table Table 1-1. Topic Coverage 2

HIGHLIGHTS OF NIGERIA’S PERFORMANCE
Economic Growth
The Nigerian economy is recovering from two decades of stagnation. Real GDP growth averaged 5.4 percent during the period 2000–2004 and needs to improve further to help reduce the high poverty levels.
Poverty Fifty-five percent of the population lives on less than one dollar per day. This is one of the highest poverty rates in sub-Saharan Africa.
Gender Gender disparities in Nigeria are great and show up in both education and health.
Fiscal and Monetary Policy
New macroeconomic policies have resulted in declining expenditures-to-GDP ratios, a budget surplus in 2004, and an increase in foreign reserves. Inflation remains in the double digits.
Business Environment
Corruption is rampant, though recent government efforts had made modest improvements. Rule of law and regulatory quality are weak. The poor business environment is a severe constraint to doing business.
Financial Sector Domestic credit to the private sector is strong. The banking system seems to be efficient with interest rate differentials of 6.5 percent.
External Sector Primary indicators conceal important structural problems, including a heavy dependence on oil exports, protectionism, and a distorted foreign exchange market. With the recent approval of debt relief by the Paris club, debt sustainability does not appear to be a problem.
Economic Infrastructure
Very poor quality infrastructure continues to hamper growth, though recent improvements are impressive. Electricity is the top concern.
Health Nigeria’s health situation is extremely troubling. Reproductive health indicators and HIV/AIDS are of particular concern. Domestic health spending is woefully inadequate and implementation is poor.
Education The education system needs great improvement in Nigeria as in much of sub-Saharan Africa. Female enrollment is adequate by regional standards, but low in absolute terms. The system is characterized by unqualified teachers, limited pupil–teacher contact, high pupil–teacher ratio, and a lack of materials.
Employment and Workforce
Women’s rate of workforce participation mirrors the gender disparities of other indicators. Growth in non-oil sectors has been volatile, hampering job creation. Unemployment remains high. Labor laws, however, are favorable for job creation.
Agriculture The agriculture sector performs below potential. Growth is not expected to continue in the long term unless productivity-boosting methods and technology are introduced. Poor infrastructure also plays a role in decreasing export potential. The historical maintenance of an overvalued exchange rate related to high oil-export revenues and Dutch Disease have substantially hampered agricultural exports.
Note: The methodology used for comparative benchmarking is explained in the appendix.

I V
NIGERIA: NOTABLE STRENGTHS AND WEAKNESSES—SELECTED INDICATORSa
Indicators Strengths Weaknesses
Growth Performance
Growth of labor productivity
Share of gross fixed investment to GDP, current prices
Poverty and Inequality
Population living in on less than $1 PPP per day, percent
Gender
Gross enrollment rate, ratio of male to female
Fiscal and Monetary Policy
Overall government budget balance, including grants, % GDP
Inflation rate, percent
Business Environment
Corruption perception index
Ease of doing business ranking
Regulatory quality index
Rule of law index
Financial Sector
Domestic credit to the private sector, % GDP
Interest rate spread, percent
External Sector
Concentration of exports, % top 3 goods (3-digit SITC) of total exports
Debt service ratio, % exports
Economic Infrastructure
Quality of infrastructure index – electricity
Health
Life expectancy at birth, years

V
Indicators Strengths Weaknesses
HIV prevalence, %
Public health expenditure, % of GDP
Education
Net enrollment rate – female, %
Youth literacy rate, %
Employment and Workforce
Rigidity of employment index
Unemployment rate, %
Agriculture
Agricultural policy costs index
Crop production index
a The chart identifies selective indicators for which Nigeria’s performance is particularly strong or weak relative to the benchmark standards; details are discussed in the text. The separate Data Supplement for Nigeria presents a full tabulation of the data examined for this report, including the international benchmark data, along with technical notes on the data sources and definitions.


1. Introduction This paper is one of a series of Economic Performance Assessments prepared for the EGAT Bureau to provide USAID missions and regional bureaus with a concise evaluation of a broad range of indicators relating to economic growth performance in designated host countries. The report draws on a variety of international data sources1 and uses international benchmarking against reference group averages and comparator countries (Ghana and Cameroon) to identify major constraints, trends, and opportunities for strengthening growth and reducing poverty.
The methodology used here is analogous to examining an automobile dashboard to see which gauges are signaling problems. Sometimes a blinking light has obvious implications—such as the need to fill the fuel tank. In other cases, it may be necessary to have a mechanic probe more deeply to assess the source of the trouble and discern the best course of action.2 Similarly, the Economic Performance Assessment is based on an examination of key economic and social indicators, to see which ones are signaling problems. In some cases a “blinking” indicator has clear implications, while in other instances a detailed study may be needed to investigate the problems more fully and identify an appropriate course for programmatic action.
The analysis is organized around two mutually supportive goals: transformational growth and poverty reduction.3 Rapid and broad-based growth is the most powerful instrument for poverty reduction. At the same time, measures aimed at reducing poverty and lessening inequality can help to underpin rapid and sustainable growth. These interactions create the potential for stimulating a virtuous cycle of economic transformation and human development.
Transformational growth requires a high level of investment and rising productivity. This is achieved by establishing a strong enabling environment for private sector development, involving multiple elements: macroeconomic stability; a sound legal and regulatory system, including secure contract and property rights; effective control of corruption; a sound and efficient financial system; openness to trade and investment; sustainable debt management;
1 Sources include the latest data from USAID’s internal Economic and Social Database, and from readily accessible public information sources. This database is compiled and maintained by the Development Information Service, under PPC/CDIE. It is accessible to staff through the USAID intranet.
2 Sometimes, too, the problem is faulty wiring to the indicator—analogous here to faulty data. 3 In USAID’s white paper U.S. Foreign Aid: Meeting the Challenges of the Twenty-first Century (January
2004), transformational growth is a central strategic objective, both for its innate importance as a development goal and because growth is the most powerful engine for poverty reduction.

2 N I G E R I A E C O N O M I C P E R F O R M A N C E A S S E S S M E N T
investment in education, health, and workforce skills; infrastructure development; and sustainable use of natural resources.
In turn, the impact of growth on poverty depends on policies and programs that create opportunities and build capabilities for the poor. We call this the pro-poor growth environment.4 Here, too, many elements are involved, including effective education and health systems; policies facilitating job creation; agricultural development (in countries where the poor depend predominantly on farming); dismantling barriers to micro and small enterprise development; and progress toward gender equity.
The present evaluation of these conditions must be interpreted with caution. A concise analysis of this sort cannot provide a definitive diagnosis of economic problems, or simple answers to questions about programmatic priorities. Instead, the aim of the analysis is to spot signs of serious problems for economic growth, based on a review of selected indicators, subject to limits of data availability and quality. The results should provide insight about potential paths for USAID intervention, to complement on-the-ground knowledge and further in-depth studies.
The remainder of the report discusses the most important results of the diagnostic analysis, in three sections: Overview of the Economy; Private Sector Enabling Environment; and Pro-Poor Growth Environment. Table 1-1 summarizes the topic coverage. The appendix provides a brief explanation of the criteria used for selecting indicators, the benchmarking methodology, and a table showing the full set of indicators examined for this report.
Table 1-1 Topic Coverage
Overview of the Economy Private Sector Enabling Environment
Pro-Poor Growth Environment
• Growth Performance
• Poverty and Inequality
• Economic Structure
• Demographic and Environmental Conditions
• Gender
• Fiscal and Monetary Policy
• Business Environment
• Financial Sector
• External Sector
• Economic Infrastructure
• Science and Technology
• Health
• Education
• Employment and Workforce
• Agriculture
4 A comprehensive poverty reduction strategy also requires programs to reduce the vulnerability of the poor to natural and economic shocks. This aspect is not covered in the template because the focus is economic growth programs. In addition, it is difficult to find meaningful and readily available indicators of vulnerability to use in the template.

2. Overview of the Economy This section reviews basic information on Nigeria’s macroeconomic performance, poverty and inequality, economic structure, demographic and environmental conditions, and indicators of gender equity.5 Some of the indicators cited here are descriptive rather than analytical and are included to provide context for the performance analysis.
GROWTH PERFORMANCE Nigeria’s economic performance is improving because of the elected government’s steady implementation over the past 20 months of its homegrown reform program, which in many aspects is consistent with the recommendations of the IMF (Figure 2-1).
Real GDP increased by about 6 percent in 2004, faster than in either Ghana or Cameroon. Although the growth rate was lower than in 2003 (10.9 percent), growth was more diversified, while the strong 2003 performance was attributable largely to a surge in oil revenues. In 2004 the growth rate of non-oil sectors increased to 7.4 percent, compared with 4.4 percent in 2003.6 The economy grew at an average of 5.4 percent between 2000 and 2004, below the range predicted by the regression benchmark and slightly lower than the average for low-income sub-Saharan Africa (LI-SSA). With an annual population growth rate of about 2.5 percent, the GDP growth rate is not sufficient to alleviate poverty, one of Nigeria’s most pressing problems.
The economy still suffers from two decades of poor economic performance after the collapse of oil prices in the early 1980s, when a series of military dictatorships ignored prudent macroeconomic policies and the state’s infrastructure. Despite steady economic growth since the return to civilian rule in 1999, 2004 per capita income was only $500 (in current U.S. dollars)—one-quarter of the mid-1970s levels (Figure 2-2).7
5 The separate Data Supplement provides a full tabulation of the data for Nigeria and the international benchmarks, including indicators not discussed in the text, as well as technical notes for each indicator. The supplement also provides data for Kenya and South Africa at the request of the Nigeria mission.
6 IMF, “Country Focus: Reforming Nigeria’s Pension System.” October 17, 2005, Volume 34, No. 19. See http://www.imf.org/external/pubs/ft/survey/2005/101705.pdf.
7 United States Department of State, Background Notes, Nigeria, version 8/05. See http://www.state.gov/r/pa/ei/bgn/2836.htm.

4 N I G E R I A E C O N O M I C P E R F O R M A N C E A S S E S S M E N T
Figure 2-1 Real GDP Growth, percent
Nigerian economic growth has been volatile because of oil market fluctuations.
Time Series
0.02.04.06.08.0
10.012.0
2000 2001 2002 2003 2004
Year Nigeria Data 2000 5.4 2001 3.1 2002 1.5 2003 10.9 2004 6.1 Summary for 2000–2004 Five-year average 5.4 Trend growth rate N/A
6.1
4.85.3 5.5
4.3
5.9
0
1
2
3
4
5
6
7
8
Nigeria LI-SSA Low Income Ghana Cameroon
Perc
ent C
hang
e
Expected value and margin of error
Source: Nigeria Data from IMF Press Release No. 05/229; time series and benchmark data from World Economic Outlook database.
Figure 2-2 GDP Per Capita, current US dollars
Per capita GDP has been on the rise, but has not yet reached the levels of the 1970s.
Time Series Global Standing
0100200300400500600
2000 2001 2002 2003 2004
Year Nigeria Data 2000 357.2 2001 362.4 2002 341.0 2003 409.8 2004 500.0 Summary for 2000–2004 Five-year average 394.1 Trend growth rate 8.3
419.4500.0
407.1 433.7
831.5
0
100
200
300
400
500
600
700
800
900
Nigeria LI-SSA Low Income Ghana Cameroon
U.S
. Dol
lars
Highest-five average
121NGA
52,714
Lowest-five average
Source: World Economic Outlook database. CAS Code: 11p2

O V E R V I E W O F T H E E C O N O M Y 5
Labor productivity continues to be a concern. Nigeria had average productivity growth of 1.2 percent in 2000–2004. This average is below the rate of 1.9 percent found in the LI-SSA countries, 2.0 percent in low income countries as a whole, 1.7 percent in Ghana, and 2.2 percent in Cameroon. Fixed capital investment, however, was strong. Investment averaged 23.4 percent of GDP from 2000 to 2004, well above the regression benchmark of 18.1 percent and the LI-SSA average of 19.2 percent, and higher than the levels found in the comparator countries. This strong performance needs to be treated with caution, however, because it is likely that much of this investment is concentrated in the oil industry. The level of private investment, at 13.2 percent of GDP in 2004, signals weak prospects for growth and job creation, suggesting the need to focus on improving the business environment (see section on Business Environment).
Nigeria’s main challenges are to reduce poverty, diversify the economy away from crude oil and gas exports toward more labor-intensive sectors, and improve basic health and education for the poorest half of the population. According to the World Bank, Nigeria needs to grow at a rate of 7–8 percent a year to cut poverty in half by 2015.8 Oil production is not labor intensive, and in a country with high unemployment and poverty, special efforts are necessary to promote growth in sectors that will create employment. Factors leading to higher growth outside the oil sector include improving the quality and reliability of infrastructure and reducing corruption.
POVERTY AND INEQUALITY Poverty is an acute problem in Nigeria. An estimated 70 million people of a total population of 136 million (55 percent) live on less than one dollar a day in purchasing power parity terms. This gives Nigeria the third-largest number of poor in the world, after China and India.9 The rate is substantially higher than that predicted by the regression benchmark (35.1 percent) or by the poverty rate in Cameroon (17.0 percent). According to the World Bank’s Country Partnership Strategy, poor Nigerians live predominantly in rural areas, in the north, and are likely to be female, very young, or elderly.
Nigeria’s oil and gas wealth has done little to alleviate poverty. The economy’s reliance on oil for export earnings and government revenue has hurt the poor in several ways. First, oil income has increased economic volatility in growth, inflation, and the exchange rate, and the poor are the least able to protect themselves against these fluctuations. Compounding this volatility has been instability in government revenues, which has been translated into shifting government policies and services. Second, there is strong, though not conclusive, evidence of Dutch Disease in Nigeria—that is, that oil export earnings have created a chronic tendency towards exchange rate overvaluation, crowding out manufacturing and especially agriculture, the latter being the sector where many of the poor are found. Third, the oil industry is not labor intensive and employs few unskilled workers. Fourth, oil revenues have fostered inequality and a rent-seeking political economy, undermining transparency and accountability and leading to conflict, often violent,
8 World Bank, Country Partnership Strategy for the Federal Republic of Nigeria (2005–2009), Report No. 32412-NG, June 2005.
9 Ibid.

6 N I G E R I A E C O N O M I C P E R F O R M A N C E A S S E S S M E N T
over the allocation of oil revenues. As with purely economic volatility, the burden of these problems falls disproportionately on the poor.10
The data do not show clearly whether poverty has declined in the past five years; as the IMF notes in the 2004 Article IV, some recent surveys show a decline, but these are not strictly comparable with past surveys, and other social indicators have not improved much. The more negative interpretation is consistent with the UNDP’s Human Poverty Index, which shows an increase in poverty from 34.0 percent to 38.8 percent during the period 2001 to 2003.11 This rate is higher than in Ghana (26.0 percent) and Cameroon (37.9 percent), but lower than the LI-SSA average (45.0 percent) and the regression benchmark for a country with Nigeria’s characteristics (45.8 percent). The Northwest region in particular suffers from a lack of educational resources, health infrastructure, and access to clean water.12
Nigeria’s National Economic Empowerment and Development Strategy (NEEDS) has recently been accepted in as the country’s Poverty Reduction Strategy Paper (PRSP); nonetheless, no recent reliable data are available on income inequality. In 1997 (the latest available data), the ratio of the income share of the highest 10 percent to the lowest 10 percent was 24.9, indicating serious inequality. The government and donors may want to focus on improving data availability to monitor poverty problems better.
On the positive side, only 9 percent of the population consumes fewer calories than the minimum required for normal energy consumption, implying that most of the poor are subsistence farmers able to grow enough food for their own consumption (Figure 2-3). This performance is substantially better than in LI-SSA (33 percent, on average) or Cameroon (25 percent) and somewhat better than in Ghana (13 percent).
Poverty is a serious problem in Nigeria and tops the country’s list of policy priorities. The country has prudently saved much of the oil windfall it has earned from high prices in recent years and has benefited from debt reductions. Donor assistance in spending these resources wisely and transparently to create sustainable improvement in livelihoods can contribute to achieving its Millennium Development goals; the recent creation of a virtual poverty fund that tracks poverty-reducing spending is a step forward.
10 Ross, Michael, “Nigeria’s Oil Sector and the Poor,” prepared for DFID’s Nigeria: Drivers of Change program May 23, 2003.
11 Human Poverty Index ranges from 0 (for no deprivation) to 100 (for extreme deprivation). 12 World Bank, Country Partnership Strategy for the Federal Republic of Nigeria (2005–2009).

O V E R V I E W O F T H E E C O N O M Y 7
Figure 2-3 Percent of Population below Minimum Dietary Energy Consumption
Rates of energy consumption are lower than benchmark values.
Global Standing
9.0
33.028.0
13.0
25.0
35.8
0
5
10
15
20
25
30
35
40
45
50
Nigeria LI-SSA Low Income Ghana Cameroon
Perc
ent
Expected value and margin of errorHighest-five average
3.0
NGA
66.0
Lowest-five average
Source: WDI 2005. CAS Code: 12s1
ECONOMIC STRUCTURE Nigeria’s economy is heavily industrialized for an African country, with an average of nearly 50 percent of GDP attributed to industry during the period 1999 to 2004. For 2004, industry accounted for approximately 56.9 percent of GDP, significantly higher than the LI-SSA average (21.2 percent) and the shares in Ghana (24.9 percent) and Cameroon (16.7 percent). The industrialization rate, however, reflects the importance of crude oil and natural gas production in Nigeria. In 2004, services accounted for only 26.5 percent of GDP, substantially below all benchmarks—the LI-SSA average was 41.9 percent and the values for Ghana and Cameroon were both slightly higher than 39 percent.
In 2003 a sharp rise in oil production contributed to a decline in the share of agriculture as a percent of GDP—from 29 percent in 2003 to 16 percent in 2004. The more recent figure is much lower than the regression benchmark (34.7 percent), the LI-SSA average (31.7 percent), or than in Ghana (35.8 percent) or Cameroon (44.2 percent). According to the Food and Agriculture Organization of the United Nations, 30 percent of the economically active Nigerian population was employed in agriculture in 2004, a figure that is largely unchanged from the previous two years.13 Donors may want to consider supporting programs that diversify the economy and support nonfarm employment in rural areas, though for such programs to be effective and
13 FAO, Statistical Year Book 2004, Vol. 1-1. See http://www.fao.org/es/ess/yearbook/vol_1_1/pdf/a03.pdf.

8 N I G E R I A E C O N O M I C P E R F O R M A N C E A S S E S S M E N T
sustainable they must be combined with macroeconomic policies that address the tendency toward an overvalued currency.
DEMOGRAPHY AND ENVIRONMENT Nigeria is the most populous country in sub-Saharan Africa, with an estimated 136 million people, nearly triple the population of South Africa and more than one-fifth of the continent’s total population. Population growth averaged 2.4 percent from 1999 to 2003. This is a faster rate than the average for LI-SSA (2.3 percent) and the latest figures for Ghana (1.8 percent) and Cameroon (2.0 percent). The high age-dependency ratio (0.86 dependents per worker) reflects very high fertility rates, which approach six births per woman over her lifetime,14 slightly higher than the sub-Saharan Africa average of 5.5.
Although Nigeria’s urbanization numbers are not out of line with benchmarks, urbanization is a problem. Urbanization increased from 43.2 percent to 46.6 percent between 1999 and 2003, which is roughly equivalent to what is predicted by the regression benchmark, much higher than the LI-SSA average and lower than the 51.2 percent in Cameroon. Urbanization largely reflects the lack of viable opportunities in rural areas and has resulted in growing urban poverty and unemployment.
The problems associated with urbanization help explain some of the serious environmental issues confronting Nigeria; for example, garbage and waste disposal problems in Lagos have aggravated longstanding problems of seasonal flooding and sewage backup. More generally, Nigeria’s Environmental Sustainable Index15 score of 45.4 shows that the country’s environment is suffering degradation as much as the rest of Africa, with scores of 44.9 for LI-SSA on average, 52.8 for Ghana, and 52.5 for Cameroon. Improvements are needed in environmental governance, reducing pollution stress, environmental health, and water quality.
GENDER Gender indicators point to severe inequities in Nigeria, not unlike in the rest of LI-SSA. The gender gap in adult literacy has an important effect on growth potential because maternal education is strongly related to children’s health, education, and nutrition. In Nigeria, the male literacy rate (74.4 percent) is 1.25 times higher than the female rate (59.4 percent). In comparative terms, the gender literacy differential in Nigeria is considerably better than the average ratio of 1.44 for LI-SSA and similar to those of Ghana (1.24) and Cameroon (1.29). In schooling, Nigeria’s performance is worse than all the benchmarks (Figure 2-4).
The most recent estimate of the male gross enrollment rate is 1.25 times higher than that for females. This disparity is higher than in LI-SSA (1.20), Ghana (1.16), and Cameroon (1.20). Both
14 WDI 2005. 15 The Environmental Sustainability Index ranges from 0 (for poor) to 100 (for excellent).

O V E R V I E W O F T H E E C O N O M Y 9
literacy and enrollment indicators appear to be substantially worse in the predominantly Muslim north and in rural areas.16
Figure 2-4 Male-to-Female Gross Enrollment Ratio, All Levels
Nigerian girls are less likely to get an education than boys.
Global Standing
1.19
1.25
1.20
1.16
1.20
1.1
1.1
1.1
1.2
1.2
1.2
1.2
1.2
1.3
Nigeria LI-SSA Low Income Ghana Cameroon
Rat
io M
ale:
Fem
ale
Highest-five average
0.8
NGA
1.7
Lowest-five average
Source: Nigeria data from Human Development Report 2005; benchmark data from Human Development Report 2004. CAS Code: 15p2
Another sign of gender disadvantage is seen in the life expectancy indicator. In most of the world, women live longer than men—in many socially developed countries, by five years or more. In Nigeria, however, life expectancy is nearly identical for both women and men (at just over 43 years), with a 0.99 ratio of men’s life expectancy to women’s; the average ratio for the LI-SSA countries is 0.95, the same level found in most of the comparator countries.
Gender equity is important not only as a matter of basic human rights, but also because better opportunities and capabilities for women have positive implications for growth and productivity. USAID programs targeting primary school enrollment and literacy for girls have been successful in other low-income countries in Africa and elsewhere and could have a positive impact in Nigeria.17
16 AFROL News, “Gender Profiles: Nigeria,” See http://www.afrol.com/Categories/Women/profiles/nigeria_women.htm.
17 The Country Partnership Strategy lists gender as a cross-cutting issue.


3. Private Sector Enabling Environment This section reviews indicators for the enabling environment for rapid and efficient growth of the private sector. Sound fiscal and monetary policies are essential for macroeconomic stability, which is a necessary (though not sufficient) condition for sustained growth. A dynamic market economy also depends on institutional foundations such as secure property rights, an effective system for enforcing contracts, and a regulatory environment that does not impose undue barriers on business activities. Financial institutions play a major role in mobilizing and allocating saving, facilitating transactions, and creating instruments for risk management. Access to the global economy is another factor of a good enabling environment because the external sector is a large source of potential markets, modern inputs, technology, and finance, as well as competitive pressure for efficiency and rising productivity. Equally important is development of the physical infrastructure to support production and trade. Finally, developing countries need to adapt and apply science and technology to attract investment, improve competitiveness, and stimulate productivity growth.
FISCAL AND MONETARY POLICY After the 2003 elections, the Nigerian government established two main economic objectives (1) macroeconomic stability and (2) reducing vulnerability to oil price shocks. To achieve these objectives, since early 2004 the government has put into reserves any oil revenues received above US$25 per barrel. The government also instituted measures to increase domestic oil production and reduce the price subsidy on domestic crude oil. These factors and rising world oil prices caused oil revenues to surge. At the same time, public spending was reduced from 47.0 percent of GDP in 2001 to 35.4 percent in 2004. These actions resulted in a budget surplus of 7.7 percent of GDP for 2004, up from deficits of 4–5 percent of GDP
18 IMF Press Release “IMF Executive Board Approves a Two-Year Policy Support Instrument for Nigeria. See http://www.imf.org/external/np/sec/pr/2005/pr05229.htm
IMF Program Status for Nigeria
The IMF recently approved a two-year Policy Support Instrument (PSI) for Nigeria to assist in the nation’s economic reform efforts. The PSI framework is designed for low-income countries that seek IMF advice, monitoring, and endorsement of their policies. Nigeria’s PSI is based on the National Economic Empowerment and Development Strategy (NEEDS), Nigeria’s poverty reduction strategy. The PSI aims to help Nigeria develop a sound policy framework, including prudent macroeconomic policies, strengthening institutions, and a governance structure conducive to private sector development. The latest Article IV review was completed in August 2005, at which time IMF executive board commended Nigerian authorities for the country’s strong economic performance in 2004 under the homegrown reform program articulated in NEEDS.18

12 N I G E R I A E C O N O M I C P E R F O R M A N C E A S S E S S M E N T
in 2002–2003.19 This puts Nigeria in a much better fiscal position than Ghana (3.6 percent deficit), Cameroon (0.7 percent deficit),20 and LI-SSA (4.6 percent average).21
Nigerian monetary policy has had twin goals: (1) progressively reduce inflation and (2) limit the appreciation of the currency, the naira, caused by rising oil export revenues. Money supply growth declined from an annual rate of 24.1 percent in 2003 to 14.0 percent in 2004,22 which puts the rate of growth of the money supply slightly below the LI-SSA average of 15.4 percent. Tighter monetary policy, along with fiscal restraint and the policy of putting oil revenues into reserves, helped the Central Bank of Nigeria reduce inflation from an average of 18.5 percent in 2001–2003 to 10.1 percent in 2004.23 Though Nigeria’s inflation rate is now in the range of Ghana’s (12.6 percent), it remains high in comparison to the 7.5 percent regression benchmark and 8.0 percent LI-SSA average (Figure 3-1).
Figure 3-1 Inflation Rate
Inflation gains need to be consolidated and improved upon. Time Series Global Standing
0.0
5.0
10.0
15.0
20.0
25.0
2000 2001 2002 2003 2004
Year Nigeria Data
2000 6.9 2001 18.0 2002 13.7 2003 23.8 2004 10.1 Summary for 2000–2004 Five-year average 14.5 Trend growth rate N/A
8.0 7.6
12.6
0.3
10.1
7.5
0
2
4
6
8
10
12
14
Nigeria LI-SSA Low Income Ghana Cameroon
Per
cent
Expected value and margin of errorHighest-five average
-2.7
NGA
82.3
Lowest-five average
Source: Most recent Nigeria data from IMF Press Release No, 05/229; time series and benchmark data from the World Economic Outlook database. CAS Code: 21p4
19 Nigeria reports fiscal data for the federal, state, and local governments. The fiscal figures considered here are for consolidated government because of the importance of state governance in Nigeria.
20 In 2005 the WDI adopted a new system for classifying fiscal data, even though most developing countries still use the old classification. Consequently the WDI database has fiscal data for very few developing countries; because of the small sample size, most of the group averages derived from WDI are not meaningful. In this section, comparisons are based on absolute standards, or benchmarks derived from 2004 WDI data, as well as figures for Ghana and Cameroon.
21 Nigeria’s reported expenditure levels are substantially higher than the average for LI-SSA (20.1 percent) and the levels of the comparator countries, but this comparison is misleading because the Nigerian figures cover three tiers of government—central, state, and local—and the comparator countries present only central government statistics.
22 The data on the composition of money supply growth do not add up, casting doubt on their reliability. 23 Inflation is a Millennium Challenge Account indicator.

P R I V A T E S E C T O R E N A B L I N G E N V I R O N M E N T 13
Since 1981, the share of oil in government revenues has fluctuated from 56 percent to 86 percent, largely a result of movements in oil prices. This volatility has created instability in spending on social programs, resulting in inadequate health and educational services and a problem of sustainability. Instability in central government revenues and expenditures is made worse by Nigeria’s federal system of intergovernmental finance wherein each of the 36 states and 774 local governments receives direct allocations from the central government. With the new administration, macroeconomic policies have been managed more wisely than in previous periods of high oil prices—all three tiers of government have adhered to conservative oil price-based fiscal rule, leading to budget surpluses in 2004 and 2005. Beginning in 2004, the government began setting aside oil windfalls to finance future expenditure.24 Unfortunately, only a handful of states have been successful in using similar mechanisms to smooth out their petroleum revenue.
BUSINESS ENVIRONMENT Institutional barriers to doing business, including corruption in government, are critical determinants of private sector development and prospects for sustainable growth. On most indicators of the business environment, though not all, Nigeria scores very poorly.
Corruption is the foremost problem. According to the Transparency International Corruption Perception Index,25 Nigeria is the sixth most corrupt nation in the world (Figure 3-2). Although Nigeria’s score of 1.9 is a slight improvement over its previous score, in relative ranking it means that Nigeria is more corrupt than LI-SSA on average, Ghana, or Cameroon. The steady improvement in Nigeria’s score from 1.0 in 2000 is a result of the government’s concerted efforts to combat corruption, which include engaging in an anticorruption campaign, introducing a public awareness campaign, confiscating stolen funds from Swiss bank accounts, taking steps to make the government budget process and transfers to state and local governments more transparent, and beginning to implement the Extractive Industries Transparency Initiative.26 But any score below 3.0 means that corruption is rampant and pervasive at nearly every level of the economy and has become deeply embedded in the culture. In Nigeria it has deep roots in the use of government oil revenues for political patronage and as payback for campaign financing. Many Nigerians are increasingly discouraged by slow progress on fundamental transparency issues.
The legal system and the rule of law are also ineffective. Nigeria scores -1.44 on the Rule of Law Index, worse than the average of -1.00 for LI-SSA and scores of -0.16 for Ghana and -1.0 for Cameroon, though better than the regression benchmark of -1.6 for a country with Nigeria’s characteristics.27 The court system in particular does not function well as a check on the other branches of government and remains highly politicized. It is far from independent. Similarly,
24 IMF, “Nigeria: Request for a Two-year Policy Instrument,” Country Report No. 05/432, December 2005.
25 The Corruption Perception Index ranges from 1 (for most perceived corruption) to 10 (for least perceived corruption).
26 World Bank, “Country Partnership Strategy for the Federal Republic of Nigeria (2005-2009),” and IMF, “Nigeria: 2005 Article IV Consultation,” Country Report No. 05/302, August 2005.
27 Rule of Law Index ranges in value from -2.5 (for poor) to 2.5 (for excellent). Rule of Law Index is a Millennium Challenge Account Indicator.

14 N I G E R I A E C O N O M I C P E R F O R M A N C E A S S E S S M E N T
Nigeria performs poorly on the Regulatory Quality Index (scoring -1.28).28 Here again, Nigeria’s score is below the average for LI-SSA (-0.77) and scores for Ghana (-0.28) and Cameroon (-0.71). Improvements in these two areas are necessary to encourage investment, both domestic and foreign, and to ensure long-term non-oil growth.
Figure 3-2 Corruption Perception Index
Corruption appears to have improved slightly but remains a major problem and discourages investment outside oil.
Time Series Global Standing
0.0
0.5
1.0
1.5
2.0
2001 2002 2003 2004 2005
Year Nigeria Data 2001 1.0 2002 1.6 2003 1.4 2004 1.6 2005 1.9 Summary for 2001–2005
Five year average 1.5 Trend growth rate 13.7
2.3
3.5
2.2
2.3
1.9
1.1
0.0 0.5 1.0 1.5 2.0 2.5 3.0 3.5 4.0 4.5 5.0
Nigeria
LI-SSA
Low Income
Ghana
Cameroon
Expected value and margin of error
1 (Most perceived corruption) - 10 (Least perceived corruption)Highest-five average
1.6
NGA
9.5
Lowest-five average
Source: Transparency International. CAS Code: 22p1
Given the poor scores on the other business environment indicators, it is surprising that Nigeria ranks high on the Ease of Doing Business Ranking (94th out of 155), substantially better than the average ranking of 126.9 for LI-SSA and Cameroon’s ranking of 130. This high ranking is attributable to flexibility in the labor markets, ease of getting credit, and investor protection. Nigeria does rank behind Ghana (82nd) and needs to try to improve its performance at least to those levels. Nigeria’s notable weakness is in registering property, where both the number of procedures and time involved are excessive. Improvement is also needed to reduce the time needed to enforce a contract.
The business environment indicators convey a consistent message: institutional constraints severely impair private sector development. Consequently, programs to control corruption, improve transparency and the judicial system, and promote institutional reform should continue to be the principal focus of donor agencies and the government (as they have been for the current administration).
28 Regulatory Quality Index ranges in value from -2.5 (for poor) to 2.5 (for excellent).

P R I V A T E S E C T O R E N A B L I N G E N V I R O N M E N T 15
FINANCIAL SECTOR A sound and efficient financial sector is a key to mobilizing savings, fostering productive investment, and improving risk management. Overall, the financial sector in Nigeria is efficient; however, regulatory improvements are necessary.
The money supply–to-GDP ratio is a principal indicator of the degree of monetization of the economy and the size and depth of the banking sector. Nigeria’s economy is well monetized, with a broad money supply (M2) of 23.6 percent of GDP in 2004 (Figure 3-3). This ratio is above the LI-SSA average (21.6 percent) and Cameroon’s rate (18.6 percent). The higher rate of 26.5 percent in Ghana indicates that there is potential for improvement in Nigeria.
The banking sector also seems efficient and well developed by African standards. Nigeria’s interest rate spread has decreased steadily during the past four years and reached 6.5 percent in 2004. This is below all the comparator values: the regression benchmark value was 12.0 percent, the LI-SSA average is 12.9 percent, and the rate in Cameroon was 13.0 percent. The five-year average real interest rate of 4.8 for 1999–2003 is also a sign of efficiency and competition in the banking sector, particularly when compared to LI-SSA (with an average spread of 13.7 percent). Nigeria’s score on the Legal Rights of Borrowers Index was 7 in 2004 on a scale of 0 (worst) to 10 (best), implying a more advanced financial legal framework than those of Ghana (5) and Cameroon (4) and the average in LI-SSA (4).
Figure 3-3 Monetization, Broad Money Supply (M2) as a Percent of GDP
The Nigerian economy is well monetized. Time Series Global Standing
0.05.0
10.015.020.025.030.0
2000 2001 2002 2003 2004
Year Nigeria Data 2000 20.3 2001 22.0 2002 25.9 2003 23.8 2004 23.6 Summary for 2000–2004
Five-year average 23.1 Trend growth rate 3.9
21.623.8
26.5
18.6
23.6
0
5
10
15
20
25
30
Nigeria LI-SSA Low Income Ghana Cameroon
Per
cent
Highest-five average
4.8
NGA
188.2
Lowest-five average
Source: Nigeria data from most recent IMF Article IV; benchmark data from WDI 2005. CAS Code: 23p3
The picture painted by these indicators, however, misses some important aspects of the banking system—undercapitalization and unsound banking practices. As the IMF notes in its 2005 Article IV report: “The presence of unsound banks with poor governance practices, such as widespread

16 N I G E R I A E C O N O M I C P E R F O R M A N C E A S S E S S M E N T
insider lending, misreporting, and systemic under provisioning, has compromised the effectiveness of monetary policy, undermined public confidence, and discouraged financial intermediation, savings, and investment.” The government is improving bank capitalization through a combination of consolidation, closing weak banks, and raising capital. At the same time, it is taking measures to strengthen the supervisory and regulatory structure. The government needs to proceed with these measures in a way and at a pace that maintain confidence in banking.
Domestic credit to the private sector has been strong at 15.7 percent of GDP in 2003 (Figure 3-4). This level is above all benchmarks—the average for the LI-SSA region and the values for Ghana and Cameroon.29 As in much of Africa, however, credit is available mostly for the largest and most well-established enterprises; more needs to be done to expand credit availability to SMEs and microenterprises.
Figure 3-4 Domestic Credit to the Private Sector as a Percent of GDP
Domestic credit to the private sector is relatively high but more needs to be available to SMEs. Time Series Global Standing
0.0
5.0
10.0
15.0
20.0
1999 2000 2001 2002 2003
Year Nigeria Data 1999 14.0 2000 13.6 2001 15.4 2002 16.6 2003 15.7 Summary for 1999–2003
Five-year average 15.0 Trend growth rate 4.4
8.3
11.4 11.810.2
15.7
0
2
4
6
8
10
12
14
16
18
Nigeria LI-SSA Low Income Ghana Cameroon
Per
cent
Highest-five average
1.6
NGA
171.0
Lowest-five average
Source: WDI 2005. CAS Code: 23p1
Nigeria’s stock market capitalization of 16.3 percent of GDP is low compared to all benchmarks —Ghana with 18.7 percent, LI-SSA with a 17.5 percent average, and the regression benchmark of 17.0 percent. Improved stock market performance could provide additional sources of capital for private investment and could help increase competition for the banking sector, putting pressure on banks to improve efficiency.
29 Regression estimate is not used for benchmarking here due to high standard errors.

P R I V A T E S E C T O R E N A B L I N G E N V I R O N M E N T 17
EXTERNAL SECTOR Fundamental changes in international commerce and finance, including reduced transport costs, advances in telecommunications technology, and lower policy barriers, have fueled a rapid increase in global integration over the past 25 years. The international flow of goods and services, capital, technology, ideas, and people offers great opportunities for Nigeria to boost growth and reduce poverty by stimulating productivity and efficiency, providing access to new markets and ideas, and expanding the range of consumer choice. Globalization also creates new challenges in the need for institutions, policies, and regulations to take full advantage of international markets; develop cost-effective approaches to cope with adjustment costs; and establish systems for monitoring and mitigating the associated risks.
International Trade and the Current Account Nigeria’s ratio of trade to GDP in current U.S. dollars rose steadily from 67.2 percent in 2001 to 79.1 percent of GDP in 2004. The value is above the regression benchmark of 35.0 percent, the LI-SSA average of 59.7 percent, and Cameroon’s trade volume of 50.9 percent of GDP, but below Ghana’s 92.6 percent. At first glance, this level of trade volume appears healthy; however, there are reasons for concern. First, the increase in trade is largely a result of rising oil prices and oil export volumes. According to the IMF Article IV consultation, Nigeria’s average oil price received rose from $25 in 2002 to a projected $49 for 2005; and domestic oil production increased from 2.0 to 2.5 million barrels per day. Second, Nigeria retains one of the highest levels of trade protection in the world in the form of tariffs and import bans, creating an antiexport bias only partially mitigated by export promotion policies.30 Consequently, Nigeria scores a 5 (the worst score) on the Trade Policy Index, higher than the 4 average for LI-SSA and the 4 for Ghana (although on par with 5 for Cameroon).31
Finally, Nigeria’s exports are extremely concentrated, with the top three export product groups (according to the SITC Rev. 3 three-digit classification) accounting for 99.0 percent of exports in 2004, basically unchanged in the past five years (Figure 3-5). This level of concentration is higher than that of Ghana (61.3 percent) and Cameroon (67.6 percent), countries that also rely heavily on natural resources. In fact, crude oil and natural gas account for 97.5 percent of Nigerian exports. Despite export-promotion schemes, non-oil export performance remains weak, and the schemes have failed to achieve much development of the agricultural and manufacturing sectors (discussed in the Economic Structure section). The problem could be partially attributed to an overvalued currency (as discussed in the External Sector section).
30 IMF, “Nigeria: Selected Issues and Statistical Appendix,” Country Report No. 05/303, August 2005. 31 Trade Policy Index is a Millennium Challenge Account Indicator.

18 N I G E R I A E C O N O M I C P E R F O R M A N C E A S S E S S M E N T
Figure 3-5 Top Three Exports as a Percent of Total Exports (3-digit SITC)
Nigeria’s exports are extremely concentrated, even in comparison to other resource-dependent nations.
99.0
61.367.6
0
10
20
30
40
50
60
70
80
90
100
Nigeria Ghana Cameroon
Perc
ent
Source: United Nations Comtrade database. CAS Code: 24s1
Nigeria’s current account balance fluctuates with oil prices and oil revenues. The current account fell from a surplus of 10.5 percent of GDP in 2000 to a deficit of 11.0 percent in 2002, but with the increase in oil prices and the volume of exports after 2002, Nigeria’s current account rebounded to a surplus of 4.6 percent in 2004 (Figure 3-6). The non-oil current account has also improved.32 Although oil prices are expected to remain high in the short term, diversifying exports is necessary for long-term stability and growth. Planned reductions in protectionism need to be implemented to weaken the antiexport bias and encourage Nigerian industry to become more competitive.33
32 IMF, “Nigeria: Selected Issues and Statistical Appendix.” 33 According to the IMF Article IV, as of July 2005, the government of Nigeria planned to engage in
tariff reform, but other reforms need to follow.

P R I V A T E S E C T O R E N A B L I N G E N V I R O N M E N T 19
Figure 3-6 Current Account Balance as a Percent of GDP
Fluctuations in Nigeria’s current account are largely attributed to world oil prices and demand. Time Series Global Standing
-15
-10
-5
0
5
10
15
2000 2001 2002 2003 2004
Year Nigeria Data 2000 10.5 2001 3.0 2002 -11.0 2003 -2.7 2004 4.6 Summary for 2000-2004
Five-year average 0.9 Trend growth rate N/A
3.3
4.6
-4.3
-5.6
0.3
-8
-6
-4
-2
0
2
4
6
Nigeria LI-SSA Low Income Ghana Cameroon
Perc
ent
Expected value and margin of error
Highest-five average
-27.8
NGA
18.0
Lowest-five average
Note: Data for Cameroon were not reported in the WDI 2005.
Source: Nigeria data from IMF Article IV and IMF Press Release No. 05/229; benchmark data from WDI 2005. CAS Code: 24p2
International Financing and External Debt Foreign direct investment (FDI) is high by regional standards. In 2004, FDI accounted for 6.3 percent of GDP, and the benchmark values were all below 2.0. These levels need to be viewed in a larger context, however, because FDI and foreign companies’ participation in sectors besides oil and gas have been low. Nigerian authorities, however, did report about $2 billion in new FDI in the non-oil economy in 2004.34 Continued improvement in the business environment, as discussed earlier, is needed to attract foreign investment to manufacturing and non-oil industry.
Nigeria’s external debt situation has improved because the country has benefited from forgiveness of substantial public debt. Following IMF approval of the two-year PSI, on October 20, 2005, Nigeria signed an agreement with the Paris Club eliminating 60 percent of Nigeria’s debt to the club.35 The debt relief is equivalent to US$18 billion in real terms. Before the relief, in 2003 (the latest data available), the present value of debt stood at 75.9 percent of GNI, above all benchmarks—the regression estimate of 58.7 percent of GNI (though with high standard errors), the LI-SSA average (65.6 percent), and Cameroon’s and Ghana’s 52.8 percent and 38.0 percent, respectively (Figure 3-7).
34 IMF, “Nigeria: Selected Issues and Statistical Appendix,” and “Nigeria: 2005 Article IV Consultation.” 35 Paris Club, Press Release, Nigeria, October 20, 2005. See
http://www.clubdeparis.org/en/news/page_detail_news.php?FICHIER=com11297988840.

20 N I G E R I A E C O N O M I C P E R F O R M A N C E A S S E S S M E N T
Figure 3-7 Debt Service Ratio as a Percent of Exports
Debt service ratio is low and will decline further because of the Paris Club debt relief agreement. Time Series Global Standing
05
101520253035
2001 2002 2003 2004
Year Nigeria Data 2001 29.7 2002 15.6 2003 10.3 2004 7.8
Summary for 2001–2004 Four-year average 15.9 Trend growth rate -35.8
10.4 10.4
14.7
7.8
12.8
0
2
4
6
8
10
12
14
16
18
20
Nigeria LI-SSA Low Income Ghana Cameroon
Perc
ent
Expected value and margin of error Highest-five average
0.9
NGA
61.5
Lowest-five average
Note: data for Cameroon are not reported in the WDI.
Source: Nigeria data from IMF Article IV; benchmark data from WDI 2005 . CAS Code: 24p3
The debt service ratio in 2004 stood at 7.8 percent of exports, down from 29.7 percent in 2001 because of the rise of exports and an earlier debt rescheduling. The current service ratio is below all available benchmarks and will fall even further after the debt relief takes effect. A reduction in debt reduces capital flight and increases investment and growth.36 The government of Nigeria needs to capitalize on the newly freed-up resources to put funds back into the productive economy, stimulate growth, and reduce poverty.
Because of Nigeria’s oil wealth, foreign aid plays a relatively small role in external financing, averaging 0.6 percent of GNI in 1999–2003. This level is substantially below the regression benchmark (15.7 percent), the LI-SSA average (12.4 percent), and aid flows to Ghana (12.2 percent) and Cameroon (7.5 percent).
Foreign Exchange Nigeria’s foreign exchange reserves have risen, thanks in large part to the policy of setting aside excess oil export earnings, and appear to be sufficient to protect the stability of the currency. Central bank reserves rose from 3.9 months of imports in 2002 to 5.8 months in 2004. The level of reserves exceeded the respective benchmark regression estimate (5.3 months), average reserves in the LI-SSA (4.1 months), and reserves in Ghana (4.1 months).
36 Nigerians hold substantial amounts of money abroad (World Bank, “Country Partnership Study for the Federal Republic of Nigeria (2005–2009).”

P R I V A T E S E C T O R E N A B L I N G E N V I R O N M E N T 21
Nigeria is one of a handful of countries with multiple exchange markets. The Dutch Auction System (DAS) was introduced in 2002 to replace the Interbank Foreign Exchange Market.37 The Interbank Foreign Exchange Market, however, has not yet been phased out. The spread between the interbank and DAS exchange rates was small (just 0.2 percent) in 2004 (funds between the markets are not transferable), while the parallel market premium remained above 5 percent.38 Much of the informal economy can access foreign exchange only through the parallel market.39 Multiple markets distort exchange rates and allow for currency arbitrage. A wholesale auction system to unify retail DAS and interbank rates will be introduced in early 2006, but additional reforms are needed to reduce the size of the parallel market. Making the foreign exchange market more accessible to all may reduce the size of the parallel market, and thus its distortionary effect. Donor attention to the reform process may be warranted.
The naira—the Nigerian currency—has undergone substantial real depreciation since mid-1980, including a depreciation in 1999.40 Despite the depreciation and the relative stability in the real effective exchange rate over the past five years (as reported in the data supplement), there are signs that the currency is still overvalued—Nigerian non-oil exports are virtually nonexistent, despite export-promotion schemes; Nigeria is a net importer of consumer goods, including food; and agricultural and non-oil industrial production have stagnated. An overvalued currency is common for resource-rich countries because of large inflows of foreign exchange. Although agricultural and industrial production are also adversely affected by the poor business environment, inadequate infrastructure, the high cost of doing business, and a history of misguided policy, the overvalued currency plays an important role in explaining the poor performance of Nigeria’s non-oil sectors.
ECONOMIC INFRASTRUCTURE A country needs good physical infrastructure—for transportation, communications, power, and information technology—to strengthen competitiveness and expand productive capacity. Nigeria’s infrastructure is of poor quality by any absolute standard, even if it is better than average for Africa, and constrains business; in a recent World Bank Survey, manufacturing firms ranked infrastructure as their most severe business constraint.41 Nevertheless, the quality of infrastructure has improved notably as the country has begun to recover from years of military rule and neglected investments.
The overall Infrastructure Quality Index42 for Nigeria was 2.7 in 2005, slightly above the LI-SSA average (2.4) and Cameroon’s ranking (2.5), but below Ghana’s (2.9). It is a marked
37 Central Bank of Nigeria, Press Release 2002 No. 3, “Press Briefing on the State of Nigerian Economy with Particular Reference to Exchange Rate and Reserve Management,” August 2002.
38 IMF, “Nigeria: 2005 Article IV Consultation.” 39 U.S. Department of State, “Background Note: Nigeria.” 40 Based on historical data for Real Effective Exchange Rate (REER), WDI 2005. 41 IMF, “Nigeria: Selected Issues and Statistical Appendix.” 42 Infrastructure Quality Index ranges in value from 1 (poorly developed and inefficient) to 7 (among the
best in the world).

22 N I G E R I A E C O N O M I C P E R F O R M A N C E A S S E S S M E N T
improvement over Nigeria’s score of 1.8 in 2004. The disaggregated index shows that electricity continues to be a major problem despite substantial improvement. Service is inconsistent and the loss of electricity remains common. Most businesses that can afford their own generators have them, which adds a substantial fixed and operating tax to the cost of doing business.
Telephone density improved dramatically in the period 1999–2003, rising from 4.4 to 32.5 lines per 1,000 people. Much of this increase is attributable to cell phones (Figure 3-8). The communication system, however, lags behind the LI-SSA average (37.9 lines per 1,000 people), and those of Ghana (49.1 lines) and Cameroon (49.7 lines). Similarly, Internet usage increased from 0.7 to 6.1 users per 1,000 from 2000 to 2003, above Cameroon’s rate (3.8 users) and the LI-SSA average (4.3 users), but below Ghana’s Internet usage rate (7.8 users).
Figure 3-8 Telephone Density, Fixed Line and Mobile, per 1,000 People
Telephone density is low, even by regional benchmarks, despite recent improvements. Time Series Global Standing
05
101520253035
1999 2000 2001 2002 2003
Year Nigeria Data 1999 4.4 2000 4.6 2001 8.0 2002 19.2 2003 32.5 Summary for 1999–2003
Five-year average 13.7 Trend growth rate 72.3
37.944.5
49.1 49.7
32.5
23.0
0
10
20
30
40
50
60
Nigeria LI-SSA Low Income Ghana Cameroon
Peo
ple
Expected value and margin of error
Highest-five average
9.8
NGA
1,686
Lowest-five average
Source: WDI 2005. CAS Code: 25p3
Government reform programs, with plans for major reforms in the power and transportation sectors, aim to resolve the problems of infrastructure.43 If experience is any guide, however, these programs will not succeed unless the problem of corruption in large infrastructure projects is addressed. As poor infrastructure hinders growth and productive activity outside the oil sector, more donor intervention to rehabilitate and expand market-supporting infrastructure is needed.
43 IMF, “Nigeria: Selected Issues and Statistical Appendix,” and World Bank, “Country Partnership Strategy for Federal Republic of Nigeria (2005-2009).”

P R I V A T E S E C T O R E N A B L I N G E N V I R O N M E N T 23
SCIENCE AND TECHNOLOGY Science and technology are central elements of a dynamic growth process, because technical knowledge is a driving force for rising productivity and competitiveness. Even for low-income countries such as Nigeria, transformational development increasingly depends on acquiring and adapting technology from the global economy and applying it in ways that are appropriate to their level of development. The inability to access and use technology prevents an economy from gaining the benefits of globalization.
Unfortunately, few international indicators of science and technology are available for judging performance in lower-income countries such as Nigeria. The only standard indicator available is the FDI Technology Transfer Index.44 Nigeria’s score of 4.7 is identical to the regression benchmark and LI-SSA average. Ghana’s FDI Technology Transfer Index is higher (5.4), while Cameroon’s is lower (3.4). For Nigeria, encouraging foreign investment will likely result in increased use of technology.
In the absence of the standard indicators, performance in science is hard to judge. Nonstandard data sources show that Nigeria scores below Ghana and Cameroon on the Availability of Scientists and Engineers Index, and on par with Cameroon, but below Ghana, on the Quality of Scientific Research Institutions Index.45 This poor performance is linked directly to deficiencies in Nigeria’s education system.
Technology is an important element of modern economic growth, and Nigeria should begin to take into account the potential for technology transfer when evaluating projects. The lack of reliable data in itself points to the need for government to improve intellectual capacity and human capital through research and development and education and training.
44 FDI Technology Transfer Index ranges in value from 1 (FDI brings little new technology) to 7 (FDI is an important source of new technology).
45 Both of these indices are from the World Economic Forum Global Competitiveness report 2005-2006. They are not standard Country Analytical Report indicators, but are considered here because of a lack of other data. The Quality of Scientific Research Institutions Index measures executives’ perceptions of the quality of scientific research institutions (from nonexistent to best in the field internationally). Similarly, the Availability of Scientists and Engineers Index measures executives’ perception of the availability of scientists and engineers (from nonexistent to widely available).


4. Pro-Poor Growth Environment Rapid growth is the most powerful and dependable instrument for poverty reduction, yet the link from growth to poverty reduction is not mechanical. In some cases, income growth for poor households exceeds the overall rise in per capita income, while in other conditions growth benefits the non-poor far more than the poor. A pro-poor growth environment stems from policies and institutions that improve opportunities and capabilities for the poor while reducing their vulnerabilities. Pro-poor growth is associated with improvements in primary health and education, the creation of jobs and income opportunities, the development of skills, micro-finance, agricultural development (for countries such as Nigeria with large populations of rural poor), and gender equality.46 This section focuses on four of these issues: health, education, employment and the workforce, and agricultural development.
HEALTH The provision of basic health service is a major form of human capital investment and a significant determinant of growth and poverty reduction. Although health programs do not fall under the EGAT bureau, an understanding of health conditions can influence the design of economic growth interventions.
Nigeria’s indicators show very poor performance across the board. Life expectancy is the most common indicator of health conditions in a country, and Nigeria’s was just 44.9 years in 2003, down from 47.5 years in 1999 (Figure 4-1). This level is one of the lowest in the world, below those of Ghana (54.4 years) and Cameroon (48.0 years) as well as the average for LI-SSA (46.2 years). Contributing to Nigeria’s low life expectancy are high rates of HIV/AIDS infection, although these are lower than the catastrophic levels found in some other African countries. The 2003 HIV/AIDS infection rate (5.4 percent) remained almost unchanged from the previous survey year. It is above the LI-SSA average (4.4 percent) and Ghana’s rate (3.1 percent), but below that of Cameroon (6.9 percent). In absolute terms, however, 3.5 million people in Nigeria are infected—10 percent of the world’s total infected population.47
46 Because this report focuses on economic growth performance, it does not cover emergency relief. 47 World Bank, “Country Partnership Study for the Federal Republic of Nigeria (2005-2009).”

26 N I G E R I A E C O N O M I C P E R F O R M A N C E A S S E S S M E N T
Figure 4-1 Life Expectancy at Birth
Nigeria’s life expectancy is exceedingly low. Global Standing
44.9 46.251.8 54.4
48.0
43.8
0
10
20
30
40
50
60
Nigeria LI-SSA Low Income Ghana Cameroon
Yea
rs
Expected value and margin of error
Highest-five average
37.3
NGA
80.5
Lowest-five average
Source: WDI 2005.
Another troubling indicator is the maternal mortality rate: an estimated 800 deaths per 100,000 live births in 2000. This rate is worse than that of Ghana (540 deaths) or Cameroon (730 deaths), yet slightly below the LI-SSA average of 880. This statistic highlights Nigeria’s low score on another health indicator, the percentage of births attended by a skilled health professional. Nigeria’s 35 percent is low relative even to the LI-SSA average of 50 percent and Cameroon’s 60 percent.
One of the main objectives of the World Bank’s Country Partnership Strategy and Nigeria’s NEEDS program is to improve these conditions to meet Millennium Development Goals,48 but the Nigerian government has allocated only 0.66 percent of GDP to health spending in recent years.49 The expenditure is less than one-third the regional average and substantially below the spending in Ghana and Cameroon (Figure 4-2).
All these indicators signal a general problem with health, and women’s health in particular. Furthermore, Nigeria also has a very high rate of female genital mutilation. Poor health conditions impede growth and contribute greatly to the persistence of severe poverty. Although multilateral and bilateral donors have been generous with support such as USAID’s BASICs and COMPASS programs, health problems cannot be addressed in a sustainable way without more funding and initiatives on the part of Nigeria’s government.
48 Ibid. 49 Estimated scores for Millennium Challenge Account indicators for fiscal 2006 are unchanged from the
fiscal 2004 and 2005 values.

P R O - P O O R G R O W T H E N V I R O N M E N T 27
Figure 4-2 Public Health Expenditure as Percent of GDP
Public health expenditure is below all regional benchmarks. Global Standing
2.2
0.7
2.12.3
1.2
0.0
0.5
1.0
1.5
2.0
2.5
Nigeria LI-SSA Low Income Ghana Cameroon
Perc
ent
Source: Millennium Challenge Corporation.
Highest-five average
0.6
NGA
8.7
Lowest-five average
EDUCATION Nigeria’s education system needs great improvement, though most education indicators are in line with or are better than regional benchmarks.
One basic indicator is the net primary enrollment rate, which shows the percentage of primary school age children who are enrolled in school. For Nigeria, the combined net enrollment of 60 percent is slightly lower than regional benchmarks. The LI-SSA average rate is 64 percent, while Ghana’s is 63 percent (data for Cameroon are unavailable). The country’s gender inequities are reflected in its education system, with net female enrollment lower than male (57 percent versus 64 percent), as well as those of all comparator benchmarks (Figure 4-3). These numbers are considerably worse in the Northwest region, where the World Bank estimates that only 34 percent of girls attend school.50 Of the girls enrolled, 66 percent persist to grade 5, exceeding regional benchmarks; yet in absolute terms, with such low enrollment rates, the number of students completing at least grade 5 is low.
Although the quality of education is hard to gauge, the country’s system is characterized by limited pupil-teacher contact, a lack of teaching materials and equipment, teacher absenteeism, and the use of unqualified teachers.51 Nigeria’s pupil–teacher ratio of 45:1 in 2002 (latest estimate), however, is lower than regional averages of 47:1 for LI-SSA and Cameroon’s 57:1.
50 World Bank, “Country Partnership Study for the Federal Republic of Nigeria (2005-2009).” 51 Ibid.

28 N I G E R I A E C O N O M I C P E R F O R M A N C E A S S E S S M E N T
Figure 4-3 Net Primary Enrollment, Female to Male, percent
Female enrollment lags behind male enrollment.
64.067.8
74.9
64.062.259.157.0
67.7
0
10
20
30
40
50
60
70
80
Nigeria LI-SSA Low Income Ghana Cameroon
Per
cent
FemaleMale
Note: Data for Cameroon were not readily available.
Source: Nigeria data from the World Bank Country Partnership Strategy (2005-2009); benchmark data from WDI 2005. CAS Code: 32p1b
Though improvements are needed, certain indicators suggest that the quality of Nigeria’s education is not dire. Nigeria’s youth literacy rate has increased steadily in five years from 85 percent to 89 percent (survey year 2002). This is over 10 percentage points higher than the regional and regression benchmarks and just below Ghana’s 92 percent and Cameroon’s 90 percent.
Education is a cornerstone of development and current and future initiatives must do a better job in addressing the country’s education needs. Programs to retain children past primary school; address gender disparities, especially in rural areas; and provide teacher training should be considered.
EMPLOYMENT AND WORKFORCE Nigeria’s labor force is growing at 2.7 percent per year. Growth has held steady for the past five years and is slightly above the regional and country comparator average of 2.4 percent. Given its large and growing population the economy needs to absorb approximately 1.5 million new workers each year.
Labor force participation is low, with an estimated 75 workers per 100 people of working age (15–64), in line with Cameroon’s figure of 75 percent, but below the LI-SSA average (86 percent) and the regression benchmark (87 percent). Participation by gender reflects the disparities in other social and economic indicators. The labor force participation rate for men is 97 percent, reflecting poverty and the need for every able person to work, while women’s labor force participation is only 54 percent, again highlighting the importance of gender in the Nigerian

P R O - P O O R G R O W T H E N V I R O N M E N T 29
context. Although figures for men are consistent with the LI-SSA average (98 percent), female participation is 20 percentage points below the LI-SSA average and almost 40 percentage points below Ghana’s rate. Furthermore, participation figures for women have not improved in the past five years (Figure 4-4). Involving women in productive activity may yield substantial returns in economic growth.
Figure 4-4 Female Labor Force Participation Rate
Encouraging more women to participate in labor force may yield growth and empower them. Time Series Global Standing
52.0
52.5
53.0
53.5
54.0
1999 2000 2001 2002 2003
Year Nigeria Data 1999 53.1 2000 52.7 2001 53.0 2002 53.3 2003 53.6
Summary for 1999–2003 Five-year average 53.1 Trend growth rate 0.3
57.191.373.075.653.6
0
10
20
30
40
50
60
70
80
90
100
Nigeria LI-SSA Low Income Ghana Cameroon
Per
cent
Highest-five average
21.5
NGA
97.0
Lowest-five average
Source: WDI 2005. CAS Code: 33p1c
The government of Nigeria conservatively estimates unemployment to be 10.8 percent, but the World Bank estimates a range of 40–50 percent in key urban centers and among new graduates.52 Nigeria’s labor laws and regulations are favorable for job creation, though, and present an opportunity to address imbalances. The World Bank’s Rigidity of Employment Index53 measures the difficulty faced by firms in hiring and firing workers. Nigeria’s 2005 score of 38 is a marked improvement over its 2004 score of 44 and reflects the government’s policy efforts in this regard. Nigeria’s score is lower than the LI-SSA average of 64.5 and Cameroon’s 56, but does not quite match Ghana’s score of 34 in terms of labor market flexibility.
Promoting business expansion in non-oil sectors, entrepreneurial activity, and a diversified workforce will help create employment and further growth.
52 Ibid. 53 The index is scaled from 0 (least rigidity) to 100 (highest rigidity).

30 N I G E R I A E C O N O M I C P E R F O R M A N C E A S S E S S M E N T
AGRICULTURE Nigeria’s economy does not rely heavily on agricultural output, and agriculture’s role in the economy has declined steadily. Agriculture contributed 16 percent to GDP in 2004, down 10 percent from 2003 (primarily because of the oil boom) and well below LI-SSA’s 32 percent average.
Agricultural production and export performance have been poor and show little sign of improvement. This is due to a multitude of factors: the overvalued currency and poor business climate discussed above, as well as poor policies specific to the sector, such as unfavorable domestic pricing policies. In the period 1999–2003, agricultural export growth rates fluctuated, but the average rate of growth was –1 percent per annum for the five-year period.54 The value added per agricultural worker in Nigeria averaged $807 (in constant 1995 dollars) during the five years to 2003—significantly higher than the $250 average of LI-SSA or Ghana’s $346,and considerably lower than Cameroon’s $1,215. The growth of added value in agriculture is in line with regional benchmarks (4.1 percent compared to the LI-SSA 4.2 percent average), but is unlikely to be sustainable. According to the World Bank, the driving factor has been increased land use rather than improvements in technology. As land fertility declines, growth will subside unless productivity-enhancing technologies are adopted.55
Because fluctuations in oil prices can affect the relative share of agriculture in value, it is particularly important to look at quantity in Nigeria. The Index of Crop Production, defined to equal 100 for the period 1999–2001, rose to only 105 by 2004—barely 1 percent per year on average. In the same period, Nigeria’s performance on the similar Index of Livestock Production reached a level of 109, from 100 for the period 1999-2001. The values for the indices are in line with or are higher than the average for LI-SSA (105 for crops and 107 for livestock), but in absolute terms, they are still poor.
According to the World Economic Forum, Nigeria scores 2.8 on an indicator of policy costs on agriculture,56 below the average of 3.5 for LI-SSA and significantly lower than Ghana’s 4.5. This indicates sizeable room for policy improvements (Figure 4-5).
54 Food and Agricultural Organization of the United Nations, FAO Stat 2005, http://faostat.fao.org/faostat/collections?version=ext&hasbulk=0&subset=agriculture.
55 World Bank, “Country Partnership Study for the Federal Republic of Nigeria (2005-2009).” 56 Index ranges from 1 (for poor) to 7 (for excellent).
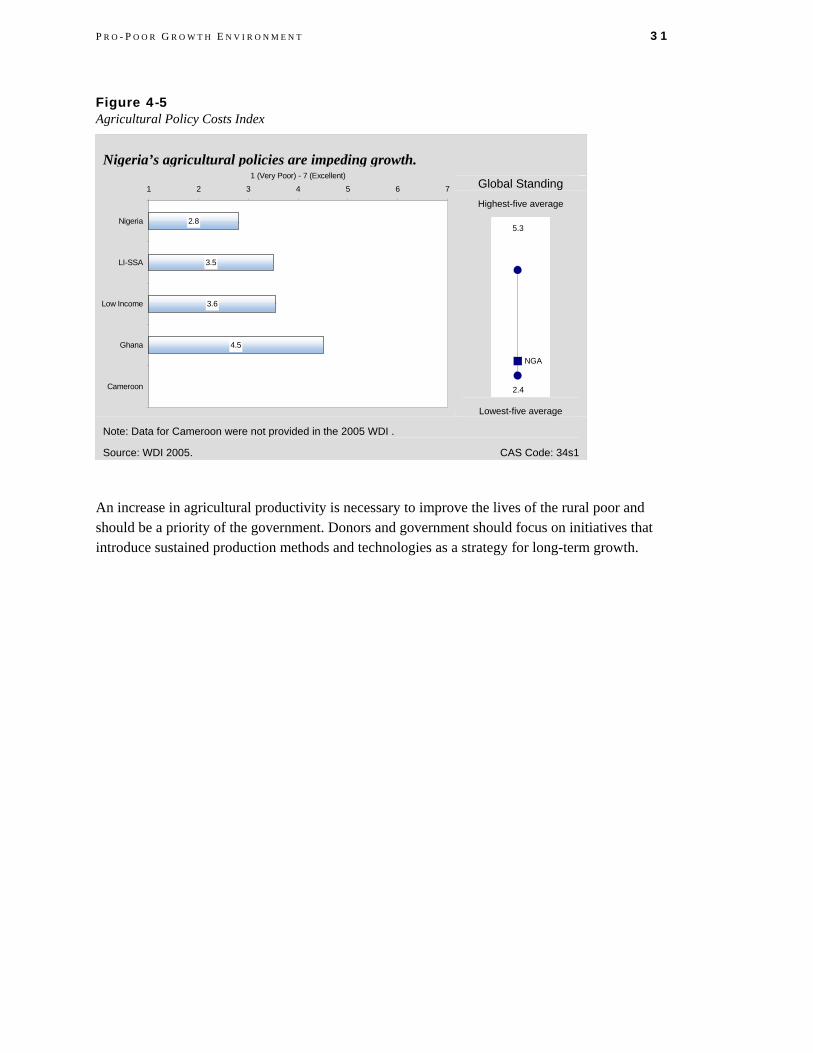
P R O - P O O R G R O W T H E N V I R O N M E N T 31
Figure 4-5 Agricultural Policy Costs Index
Nigeria’s agricultural policies are impeding growth. Global Standing
Highest-five average
2.4
NGA
5.3
Lowest-five average
Note: Data for Cameroon were not provided in the 2005 WDI .
Source: WDI 2005. CAS Code: 34s1
An increase in agricultural productivity is necessary to improve the lives of the rural poor and should be a priority of the government. Donors and government should focus on initiatives that introduce sustained production methods and technologies as a strategy for long-term growth.
3.6
4.5
3.5
2.8
1 2 3 4 5 6 7
Nigeria
LI-SSA
Low Income
Ghana
Cameroon
1 (Very Poor) - 7 (Excellent)


Appendix. Indicators CRITERIA FOR SELECTING INDICATORS The economic performance evaluation is designed to balance the need for broad coverage and diagnostic value on the one hand and the requirement for brevity and clarity on the other. The analysis covers 15 economic growth–related topics and just over 100 variables. For the sake of brevity, the write-up in the text highlights issues for which the “dashboard lights” appear to be signaling problems that suggest possible priorities for USAID intervention. The accompanying table provides a full list of the indicators examined for this report. The separate Data Supplement contains the complete data set for Nigeria, including data for the benchmark comparisons, and technical notes for every indicator.
For each topic, the analysis begins with a screening of primary performance indicators. These Level I indicators are selected to answer the question: Is the country performing well or not in this area? Level I indicators also include descriptive variables such as per capita income, poverty head count, and the age dependency rate.
Where Level I indicators suggest weak performance, the analysis proceeds to analyze a limited set of diagnostic supporting indicators. These Level II indicators provide additional details or shed light on why the primary indicators may be weak. For example, if economic growth is poor, one can examine data on investment and productivity as diagnostic indicators. If a country performs poorly on educational achievement as measured by the youth literacy rate, one can examine determinants such as expenditure on primary education and the pupil–teacher ratio.57
The indicators have been selected on the basis of the following criteria. Each must be accessible through USAID’s Economic and Social Database or convenient public sources, particularly on the Internet. They should be available for a large number of countries, including most USAID client states, to support the benchmarking analysis. The data should be sufficiently timely to support an assessment of country performance that is suitable for strategic planning purposes. Data quality is another consideration. For example, subjective survey responses are used only when actual measurements are not available. Aside from a few descriptive variables, the indicators must also be useful for diagnostic purposes. Preference is given to measures that are widely used, such as Millennium Development Goal indicators, or evaluation data used by the Millennium Challenge Corporation. Finally, an effort has been made to minimize redundancy. If two indicators provide similar information, preference is given to the one that is simplest to understand or most widely used. For example, both the Gini coefficient and the share of income
57 Deeper analysis of the topic using more detailed data (Level III) is beyond the scope of this series.

A - 2 A P P E N D I X
accruing to the poorest 20 percent of households can be used to gauge income inequality. We use the income share because it is simpler and more sensitive to changes.
BENCHMARKING METHODOLOGY Comparative benchmarking is the main tool used to evaluate each indicator. The analysis draws on several criteria rather than a single mechanical rule. The starting point is a comparison of performance in Nigeria relative to the average for countries in the same income group and region —in this case, sub-Saharan African countries with low income.58 For added perspective, three other comparisons are examined: (1) the global average for this income group; (2) respective values for two comparator countries selected by the Nigeria mission (Ghana and Cameroon); and (3) the average of the five best- and five worst-performing countries globally. Most comparisons are framed in terms of values for the latest year of data available. Five-year trends are also taken into account where this information sheds light on the performance assessment.59
For selected variables, a second source of benchmark values uses statistical regression analysis to establish an expected value for the indicator, controlling for income and regional effects.60 This approach has three advantages. First, the benchmark is customized to Nigeria’s specific level of income. Second, the comparison does not depend on the exact choice of reference group. Third, the methodology allows quantifying the margin of error and establishing a “normal band” for a country with Nigeria’s characteristics. An observed value falling outside this band on the side of poor performance signals a serious problem.61
Finally, when relevant, Nigeria’s performance is weighed against absolute standards. For example, if the Corruption Perception Index for a given country is below 3.0, this is a sign of serious economic governance problems, regardless of the regional comparisons or regression result.
58 Income groups as defined by the World Bank for 2005. For this study, the average is defined in terms of the mean; future studies will use the median instead, because the values are not distorted by outliers.
59 The five-year trends are computed by fitting a log-linear regression line through the data points. The alternative of computing average growth from the end points produces aberrant results when one or both of those points diverges from the underlying trend.
60 This is a cross-sectional OLS regression using data for all developing countries. For any indicator Y, the regression equation takes the form: Y (or ln Y, as relevant) = a + b * ln PCI + c * Region + error – where PCI is per capita income in PPP$, and Region is a set of 0-1 dummy variables indicating the region in which each country is located. After estimates are obtained for the parameters a, b and c, the predicted value for Nigeria is computed by plugging in Nigeria-specific values for PCI and Region. Where applicable, the regression also controls for population size and petroleum exports (as a percentage of GDP).
61 This report uses a margin of error of 0.66 times the standard error of estimate (adjusted for heteroskedasticity, where appropriate). With this value, 25 percent of the observations should fall outside the normal range on the side of poor performance (and 25 percent on the side of good performance). Some regressions produce a very large standard error, giving a “normal band” that is too wide to provide a discerning test of good or bad performance.

I N D I C A T O R S A - 3
INDICATORS Levela MDG, MCA, or EcGovb CAS Code
Overview of the Economy
Growth Performance
Per capita GDP, $PPP I 11P1
Per capita GDP, current US$ I 11P2
Real GDP growth I 11P3
Growth of labor productivity II 11S1
Investment Productivity - Incremental Capital-Output Ratio (ICOR) II 11S2
Gross fixed investment, % GDP II 11S3
Gross fixed private investment, % GDP II 11S4
Poverty and Inequality
Human poverty index I 12P1
Income-share, poorest 20% I 12P2
Population living on less than $1 PPP per day I MDG 12P3
Poverty headcount, by national poverty line I MDG 12P4
PRSP Status I EcGov 12P5
Population below minimum dietary energy consumption II MDG 12S1
Poverty gap at $1 PPP a day II 12S2
Economic Structure
Labor force structure I 13P1
Output structure I 13P2
Demography and Environment
Adult literacy rate I 14P1
Age dependency rate I 14P2
Environmental sustainable index I 14P3
Population size and growth I 14P4
Urbanization rate I 14P5
Gender
Adult literacy rate, ratio of male to female I MDG 15P1
Gross enrollment rate, all levels, ratio of male to female I MDG 15P2
Life expectancy at birth, ratio of male to female I 15P3
Private Sector Enabling Environment
Fiscal and Monetary Policy
Govt. expenditure, % GDP I EcGov 21P1
Govt. revenue, % GDP I EcGov 21P2
Growth in the money supply I EcGov 21P3
Inflation rate I MCA 21P4
Overall govt. budget balance, including grants, % GDP I EcGov 21P5
Composition of govt. expenditure II 21S1
Composition of govt. revenue II 21S2
Composition of money supply growth II 21S3

A - 4 A P P E N D I X
Levela MDG, MCA, or EcGovb CAS Code
Business Environment
Corruption perception index I EcGov 22P1
Doing business composite index I EcGov 22P2
Rule of law index I MCA / EcGov 22P3
Cost of starting a business, % GNI per capita II MCA / EcGov 22S1
Procedures to enforce contract II EcGov 22S2
Procedures to register property II EcGov 22S3
Procedures to start a business II EcGov 22S4
Time to enforce a contract II EcGov 22S5
Time to register property II EcGov 22S6
Time to start a business II EcGov 22S7
Financial Sector
Domestic credit to private sector, % GDP I 23P1
Interest rate spread I 23P2
Money supply, % GDP I 23P3
Stock market capitalization rate, % of GDP I 23P4
Cost to create collateral II 23S1
Country credit rating II 23S2
Legal rights of borrowers and lenders index II 23S3
Real interest rate I 23S4
External Sector
Aid , % GNI I 24P1
Current account balance, % GDP I 24P2
Debt service ratio, % exports I MDG 24P3
Export growth of goods and services I 24P4
Foreign direct investment, % GDP I 24P5
Gross international reserves, months of imports I EcGov 24P6
Gross private capital inflows, % GDP I 24P7
Present value of debt, % GNI I 24P8
Remittance receipts, % exports I 24P9
Trade, % GDP I 24P10
Concentration of exports II 24S1
Inward FDI potential index II 24S2
Net barter terms of trade II 24S3
Real effective exchange rate II EcGov 24S4
Structure of merchandise exports II 24S5
Trade policy index II MCA / EcGov 24S6
Economic Infrastructure
Internet users per 1,000 people I MDG 25P1
Overall infrastructure quality I EcGov 25P2
Telephone density, fixed line and mobile I MDG 25P3
Quality of infrastructure – railroads, ports, air transport, and electricity II 25S1

I N D I C A T O R S A - 5
Levela MDG, MCA, or EcGovb CAS Code
Telephone cost, average local call II 25S2
Science and Technology
Expenditure for R&D, % GNI I 26P1
FDI and technology transfer index I 26P2
Patent applications filed by residents I 26P3
Pro-Poor Growth Environment
Health
HIV prevalence I 31P1
Life expectancy at birth I 31P2
Maternal mortality rate I MDG 31P3
Access to improved sanitation II MDG 31S1
Access to improved water source II MDG 31S2
Births attended by skilled health personnel II MDG 31S3
Child immunization rate II 31S4
Prevalence of child malnutrition (weight for age) II 31S5
Public health expenditure, % GDP II EcGov 31S6
Education
Net primary enrollment rate I MDG 32P1
Persistence in school to grade 5 I MDG 32P2
Youth literacy rate I 32P3
Education expenditure, primary, % GDP II MCA/ EcGov 32S1
Expenditure per student, % GDP per capita – primary, secondary, and tertiary II EcGov 32S2
Pupil-teacher ratio, primary school II 32S3
Employment & Workforce
Labor force participation rate, females, males, total I 33P1
Rigidity of employment index I EcGov 33P2
Size and growth of the labor force I 33P3
Unemployment rate I 33P4
Agriculture
Agriculture value added per worker I 34P1
Cereal yield I 34P2
Growth in agricultural value-added I 34P3
Agricultural policy costs index II EcGov 34S1
Crop production index II 34S2
Livestock production index II 34S3
a Level I— primary performance indicators Level II—supporting diagnostic indicators
b MDG— Millennium Development Goal indicator MCA— Millennium Challenge Account indicator EcGov—Major indicators of Economic Governance, which is defined in USAID’s Strategic Management Interim Guidance to include “microeconomic and macroeconomic policy and institutional frameworks and operations for economic stability, efficiency, and growth.” The term therefore encompasses indicators of fiscal and monetary management, trade and exchange rate policy, legal and regulatory systems affecting the business environment, infrastructure quality, and budget allocations.