Embed Size (px)
Citation preview
Nigeria
Education for All 2015 National Review
This report was prepared by the relevant national authorities in view of the World Education Forum (Incheon, Republic of Korea, 19‐22 May 2015). It was submitted in response to UNESCO’s invitation to its Member States to assess progress made since 2000 towards achieving Education for All (EFA). The views and opinions expressed in this document are those of the authors and do not commit UNESCO. The designations employed and the presentation of material do not imply the expression of any opinion whatsoever on the part of UNESCO concerning the legal status of any country, territory, city or area or of its authorities, or concerning the delimitation of its frontiers or boundaries. The paper can be cited with the following reference: “Education for All 2015 National Review Report: Nigeria”. For further information, please contact: [email protected]
FEDERAL MINISTRY OF EDUCATION
Education For All
A Collective Responsibility
NIGERIA EFA REVIEW REPORT
2000-2014
Strides and Milestones
i
FOREWORD
In the year 2000 when Member States took stock of their performance in providing education, they were reminded by UNESCO that the Education for All (EFA) agenda had to be re-ignited with a new date set for its attainment. The Government of Nigeria have since then gone all out to meet the renewed target of 2015. As a result, policies have been adjusted and in some cases totally reformed, and programmes have been embedded in the already filled creatively and locally-relevant activities that the education sector had embarked upon. This review opportunity, offered by UNESCO to take stock of all of these activities from 2000-2014 is one that the Government of Nigeria welcome. The reason is simple: it has enabled the Government to look back, take note of the impacts, and fall-outs from a number of policies, as well as the reform initiatives that have been put in place.
The multifaceted nature of the EFA process has made it imperative that a multi-pronged approach is adopted. This means that other institutions within and outside the education sector have roles to play in the process. In the preparation of this report therefore, all MDAs connected with the EFA delivery process within education have been involved. Programmes offered outside the education sectors which are also targeted at delivering mass education both at the formal and non –formal sector have been collated as well.
Findings have shown brave steps taken and milestones reached on all of the EFA goals. Firstly, policies have been reviewed to capture the recognition of early child care development and education (ECCDE) as the most fundamental investment in basic education. This has led to expanding the basic education cycle to include one more year to accommodate the compulsory participation of children of 0 - 5years in formal primary schools through the linkage created. This bold step is to recognize the inability of most parents to afford care at that level, thereby bringing ECCDE into the EFA process.
Secondly, the determination to sensitize and strengthen delivery processes by training teachers professionally to enhance access has been carried out by relevant agencies.
Thirdly, the vocationalisation of national curriculum is another bold step taken to recognize the importance of EFA Goals 3 which has been difficult for the country and other Member States to interpret and implement.
Enrolment at primary and junior secondary levels has greatly increased. However, transition and completion rates have remained below 70% and this is still a thorny issue requiring greater attention which is being aggressively addressed through the special intervention of the Federal Government in the establishment of Almajiri schools nationwide.
It must be noted that International Development Partners (IDPs) have been strong allies in education delivery in Nigeria. The direction of thinking and support that the country will
ii
require in post-2015 have been shown and it is envisaged that the country will continue to enjoy the support of IDPs in the future focus on learning outcomes and activities that will lead to achieving the EFA goals.
This report is arranged in sections that capture each EFA goal and ends with a section on Way Forward that points out the steps that we need to take to re-ignite delivery for the entire Basic Education process while focusing on the area where gaps have been identified. We call on all States Ministries of Education (MoEs) to take this review seriously as education remains on the concurrent legislative list and the bulk of responsibilities for its efficient delivery still majorly lie with States and their local governments. We invite all to be committed to a renewed impetus to EFA.
Finally, we want to recognize UNESCO for initiating this review and other actions that have guided the global community on education delivery. On this note, I am pleased to present this report to the public.
Dr. Mallam Ibrahim Shekarau Honourable Minister of Education
iii
Acknowledgement
The production of the ‘Nigerian EFA Review Report 2000-2014: Strides and Milestones’ could
not have been accomplished without the encouragement and support of many. The EFA Branch,
Basic Education Division, Basic and Secondary Education Department, would like to
acknowledge and appreciate them all for their time and effort.
This report highlights initiatives/interventions made by Government at various levels, by the
International Development Partners and other relevant EFA Stakeholders in the march towards
the attainment of the Six EFA Goals by 2015.
Our genuine appreciation goes particularly to the Honourable Minister of Education, Dr. Mallam
Ibrahim Shekarau, and the Permanent Secretary, Dr. MacJohn Nwaobiala, who gave us the
necessary encouragement, inspiration and support for the successful production of this report.
We would like to warmly thank the Director, Basic and Secondary Education Department, Barr.
D. C. Uwaezuoke and the Deputy Director, Basic Education Division, Mrs. O. A. Ariba, for their
special assistance, guidance and support.
The Branch would like to acknowledge the role of UNESCO for initiating this stock-taking
process and for providing the framework upon which the process was accomplished. Same goes
to our Colleagues at the Nigerian National Commission for UNESCO (NATCOM UNESCO),
particularly the Secretary General (SG), Mrs. Magdalene Anene-Maidoh, for her personal
involvement.
We appreciate FME Branches and Departments such as the Gender Education Branch,
HIV/AIDS Branch, the NEMIS and Education Planning and Research for providing relevant
inputs into the production. In a similar vein, we are also grateful to FME Agencies, Parastatals
and the Civil Society Organisations, such as UBEC, NMEC, NCNE, NTI, TRCN, NCCE,
ACTIONAID, CSACEFA etc. for their inputs.
iv
Finally, special thanks to all those who worked tirelessly and supported the Branch in various
areas to produce this Report such as our expert consultants, led by Dr. Rosemary Nwangwu, for
producing the draft Report.
Mr. Kalu Kalu-Obasi
National Coordinator, EFA
v
EXECUTIVE SUMMARY
The National Policy on Education (NPE) first published in 1977 and revised in 1981, 1995 and
1998, 2004 and 2006, provides for a 6-3-3-4 structure for the education sector. This translates
into six years of primary schooling, three years of junior secondary, three years of senior
secondary and four years of tertiary education. In a further review in 2013, an additional one year
was included to make for the formal inclusion of pre-primary education into primary education.
The subsequent first ten years are therefore treated as a continuum of 10-year basic schooling
which is offered in a seamless manner. The basic education structure includes adult and non-
formal education programmes, Almajiri education programmes and education for out-of-school
children and youths. In Nigeria, education falls under the items on the concurrent legislative
listing meaning that both Federal and State governments can pass laws on it. However, basic and
secondary education as well as adult and non-formal education is managed by States and Local
Government Areas.
One of the very serious challenges in the way of documenting the progress achieved towards the
EFA goals within the Nigerian context is the paucity, and in some cases, the complete absence of
data required for such an exercise. The 2002 Global Monitoring Report (GMR) documented that
Nigeria was one of the countries in Sub-Saharan Africa without data on Universal Primary
Education (UPE). The Report shows that Nigeria had no data on Gross Enrolment Ratio (GER),
and Net Enrolment Ratio (NER), and that the country is one of the 11 African countries at
serious risk of not achieving the goal. The exercise to analyse progress towards the goal of
universal primary education (UPE) has been based on country net enrolment ratios, and these
countries had NERs less than 80%.
The UBE programme is an expression of the desire of the Government of Nigeria to fight
poverty and reinforce participatory democracy by raising the level of awareness and general
education of the entire citizenry. The UBEC Law which was subsequently enacted in 2004
stipulates that “Every Government in Nigeria shall provide free, compulsory and universal basic
education for every child of primary and junior secondary age” (UBE Act 2004). Accordingly
“Federal Government’s intervention under this Act shall only be assistance to the States and
vi
Local Governments in Nigeria for the purpose of uniform and qualitative basic education
throughout Nigeria”
The high level launch of the EFA campaign in 1999 injected a ripple of activities into the EFA
environment giving it the impetus to identify and mobilize its stakeholders and review
implementation strategies. There are institutions charged with the primary responsibility of
delivering on Nigeria’s EFA commitment. The institutions are the Universal Basic Education
Commission (UBEC), the National Commission for Nomadic Education (NCNE) and the
National Commission for Mass Literacy, Adult and Non-formal Education (NMEC). There are
other institutions whose services are also connected with the successful delivery of the EFA.
These include the National Teachers’ Institute (NTI), Nigerian Education and Research
Development Council (NERDC), the National Commission for Colleges of Education (NCCE)
and the Teachers’ Registration Council of Nigeria (TRCN).
Early Childhood Care and Development Education (ECCDE)
There has been an appreciable increase in the number of ECCDE centres established to provide
solid foundation as well as smooth transition from pre-primary schools to primary schools. In
2009, the number of public ECCDE centres across the country was 20,698 (35% of 58,595 total
primary schools). This has increased significantly to 30,901 in 2013 (50% of 61,305 total
primary schools). The increase has impacted positively on the number of pupils enrolled into the
ECCDE programmes.
Most of the set targets are yet to be met. However, quality remains an issue that Government has
begun to focus attention on through mounting specialised programmes to professionalise
teaching at this level and formally including a one-year programme in the initial six years that
the primary education component of basic education was. Some of the challenges at this level
include:
i. Access to ECCE and pre-primary is low due to poor government funding and relative
high cost of private provision;
ii. linkage in the public sector between ECCDE and primary education is inadequate;
iii. There is inadequate data on enrolment in ECCDE centres/pre-primary schools;
vii
iv. There is dearth of learning and instructional materials due to high cost of imported ECCE
materials and absence of a vibrant local fabrication industry;
v. There are inadequate numbers of qualified ECCE teachers/caregivers and most lack the
specialized methodologies and skills needed for work with young children;
vi. None or irregular monitoring of the ECCDE centres;
vii. Publicly-owned institutions are yet to dispense ECCE for children with special needs;
viii. Lack of synergy among the line Ministries and Agencies involved in the implementation
of the ECD Policy;
ix. Poverty – Most parents cannot afford to send their children to ECCDE centres;
x. Low level of awareness of the policy on ECCDE among ECCDE policy/decision makers
and practitioners;
xi. Inadequate sensitization/advocacy on ECCDE;
xii. Most public schools are yet to comply with UBEC directive of establishing ECCDE in
their schools; and
xiii. Poor commitment on the part of the States to access UBEC intervention fund.
Universalization of primary education
To demonstrate the commitment of Government towards the delivery of EFA in Nigeria, an EFA
Unit was created within the office of the Minister of Education and a National Coordinator was
appointed in February 2002. The Unit was given the mandate to coordinate the activities of the
National EFA Forum, facilitate the preparation of a fully participatory National Action Plan
(NAP) for EFA, and to ensure institutional linkages with all stakeholders in the EFA enterprise
within and outside Nigeria. The creation of this Unit marked the beginning of the process of
coordination, planning, and assessment of EFA.
Access to basic education has improved. Between 2009 and 2013, the number of primary schools
in Nigeria rose from 58,595 to 61,305, an increase of 5 per cent. At the Junior Secondary School
(JSS) level, the number of schools increased from 10,410 in 2009 to 11,874 in 2013. Although
progress has been made in basic education provision at primary and junior secondary levels,
much more remains to be done, both in quantity and quality. The quality of education given at

viii
basic education level is still adjudged below standard as evidenced in the products of this level
(SER, 2013).
i. Participation in primary education is still low in comparison with primary school age
population, with enrolment being particularly problematic, especially in some of the
Northern States.
ii. The high quality of the national school curriculum is undermined by the generally
low quality of teachers to implement it, translating into low levels of learning
achievement.
iii. Infrastructure and furniture are inadequate and in dilapidated states; sanitary facilities
and toilets are inadequate.
iv. The system of collecting comprehensive, relevant data for planning is weak.
v. There are social and cultural barriers that are hindrances to female participation.
vi. Lack of enforcement of the UBE Act, 2004 on enrollment and retention.
vii. Non-accessing of FGN intervention funds by some SUBEBS.
viii. Child labour.
ix. Poverty.
x. Insecurity issues, especially in parts of the Northern States.
Meeting the learning needs of youths and adults
Government has responded to the challenge of meeting the learning needs of youth and adults by vocationalizing the new senior secondary school curriculum which became effective in the 2011/2012 academic session. Challenges include the need to embark on programmes that will:
i. Enhance the image and visibility of TVET and the rating of skills; ii. Establish strong recognition and standards;
iii. Strengthen certification through the National Vocational Qualifications Framework; iv. Continued vocationalisation of all levels of education; v. Enhanced funding; and
vi. Enlisting the support of the private sector.
Improving adult literacy Institutional frameworks for delivering literacy have been strengthened considerably. Partnerships have also increased in the provision of non-formal education. However, some of those challenges confronting Nigeria are discussed below.
ix
i. Payment of facilitators – Despite spirited attempts to set mobilized funds for the payment
of facilitators, this challenge has remained intractable. As long as this challenge is not
met, it will remain difficult, indeed, impossible to operationalise literacy classes at the
community level;
ii. Scaling up literacy programmes is also a challenge as oftentimes projects stop at the pilot
even when such pilots have been successful; and
iii. Data collection, storage and usage in monitoring literacy delivery and participation is
another area of great challenge.
Gender parity and equality Excellent milestones have been recorded in this goal. These include education opportunities that
have been purposively created to enhance the participation of girls and women in education.
However, these achievements notwithstanding, a number of challenges need to be addressed.
These include:
i. Non-adoption of the Child Right Act in some Northern States affects the enrolment of girls in
school and their rights to basic education.
ii. Inadequate learning materials and infrastructure in Nigerian schools to promote girl friendly
school environment.
iii. Inadequate number of qualified teachers especially female teachers who serve as role models
to girls in communities.
iv. Lack of political will and sustainability of educational policies which largely affect
implementation.
v. Poverty of families who cannot afford to send their wards to school especially girls who
serve as income generators for their respective families greatly affects enrolment and
retention in schools.
vi. Recent trend in insecurity in some parts of Nigeria which threaten to derail the progress so
far made in the education of girls, especially in the North East.
Quality for education
The number of qualified teachers multiplied more than six times from 2010 to 2011 with planned
gradual projections for 2012 and 2013. The implication of the increase between 2010 and 2011
was the reduction of the teacher-pupil ratio from 1:42 to 1:25 as provided for by NPE.
x
However, the 2013 State of Education Report, describes teacher quantities as problematic with
teacher gaps for attaining the EFA goals placed at several thousands. While some States like
Bauchi, Benue, Gombe, and Plateau recorded increase in the number of teachers employed in
primary schools between 2010/2011 and 2011/2012, others such as Delta, Imo, Jigawa, and
Yobe experienced a decline in number of teachers within the period. In the same period at the
junior secondary level, more additional teachers were recorded.
Teacher requirements for fundamental subjects showed a big gap in almost all areas. The number
of primary school teachers required in fundamental subjects (English, Mathematics, and
Language of the Immediate Environment) was by far more than the available teachers in most of
the States.
Way forward
The Government of Nigeria is already focusing on the critical areas outlined in the section which
are being embedded into new initiatives being introduced in the UBE programme. It is expected
that policy focus on learning outcomes in order to address the gaps observed in education
provision. Towards this end, early childhood care and education is receiving adequate attention
in recognition of the head start it provides in overall learning. It is also expected that skills will
dominate the post 2015 agenda for Nigeria to build on the extensive introduction of skills into
the secondary education curriculum while adequate attention would be required to enhance
transition and completion rates, as well as quality.
xi
LIST OF ACRONYMS
AGEI - African Girls Education Initiative
AMAC - Abuja Municipal Area Council
ARI - Acute Respiratory Infection
CBCC - Community-Based Childhood Care
CRA - Convention on the Rights of the Child
CSACEFA - Civil Society Action Coalition on Education For All
CSOs - Civil Society Organizations
DFID - Department for International Development
DHS - Demographic Health Survey
ECC - Early Childhood Care
ECCDE - Early Childhood Care and Education
ECD - Early Child Development
EFA - Education for All
EMIS - Education Management Information System
FCT - Federal Capital Territory
FGN - Federal Government of Nigeria
FME - Federal Ministry of Education
FSLT - First School Leaving Certificate
FTTSS - Female Teachers Training Scholarship Scheme
GAR - Gross Attendance Ratio
GEM - Girls Education Movement
GEP - Girls Education Project
GER - Gross Enrolment Rate/Gender Equality Rate/Girls Education Retention
GIR - Gross Intake Rate
GMR - Global Monitoring Report
GPI - Gender Parity Index
HIV/AIDS - Human Immunodeficiency Virus/Acquired Immune Deficiency Syndrome
ICT - Information Communication Technology
IDP - International Development Partners
xii
IECCC - Integrated Early Childhood Consultative Committee
IECD - Integrated Early Childhood Development
JICA - Japan International Corporation Agency
JSS - Junior Secondary School
LGEA - Local Government Education Authority
MDGs - Millennium Development Goals
MICS - Multiple Indicator Cluster Survey
NAP - National Action Plan
NAR - Net Attendance Ratio
NCE - Nigeria Certificate of Education
NCCE - National Commission for Colleges of Education
NCNE - National Commission for Nomadic Education
NDHS - National Demographic and Health Survey
NEEDS - National Economic Empowerment and Development Strategy
NEFAF - National Education For All Forum
NEMIS - National Education Management Information System
NER - Net Enrolment Rate
NERDC - Nigerian Educational Research and Development Council
NGOs - Non-Governmental Organizations
NMEC - National Mass Education Commission
NICT - National Information Communication Technology
NICTs - New Information and Communication Technologies
NPC - National Population Commission
NPE - National Policy on Education
NTI - Nigeria Training Institute
OMEP - Organisation Mondiale Education Lé Prescolaire (World Organisation for
Early Childhood Education)
PMTCT - Preventive-Mother-to-child Transmission
PTR - Pupil Teacher Ratio
SAGEN+ - Strategy for the Acceleration of Girls Education
SBMC - School-Based Management Committee
xiii
SbTD - School Based Teachers Development
SEFAF - State Education For All Forum
SER - State of Education Report
SESOP - State Education Sector Operational Plan
SSA - Sub-Saharan African
SSS - Senior Secondary School
SUBEB - State Universal Basic Education Board
TC II - Teachers Certificate Grade II
TRCN - Teachers’ Registration Council of Nigeria
TVET - Technical and Vocational Education and Training
UBE - Universal Basic Education
UBEC - Universal Basic Education Commission
UBEP - Universal Basic Education Programme
UIS - United Nations Institute for Statistics
UN - United Nations
UNESCO - United Nations Educational, Scientific and Cultural Organization
UNFPA - United Nations Population Fund
UNICEF - United Nations Children’s Fund
U5MR - Under Five Mortality Rate
UPE - Universal Primary Education
USAID - United States Agency for International Development
WEF - World Education Forum
xiv
Table of Contents
Foreword ….……………………………………………………………………………….. i
Acknowledgement ………………………………………………………….................... ii
Contents ………………………………………………………………………............
Executive Summary ………………………………………………………………………..
Section I: Introduction ……………………………………………………………………..
Description of country’s context ………………………………………………….
The Nigeria Education system ………………………………………..……………
Nigeria Early starts in Basic Education ……………………………………………
History of universal primary Education in Nigeria ………………………………...
Nigeria’s commitment to EFA ..................................................................................
Institutions responsible for implementing EFA ……………………………………
Section 2: Main EFA Challenges in 2000 an2d Targets for 2015 …………………………
2.1 Overall EFA stature and challenges in 20020 ………………………………….
2.2 National Targets for 2015 ………………………………………….…………..
2.3 Strategy for achieving each of the EFA goal …..................................................
Section 3: Progress towards EFA Goals in 2015 ………………………………………….
1. Introduction ……………………………………………………………………...
2. Support programmes in the Fed Min of Education ……………………………..
3.1: Expanding ECCE ……………………………………………………………..
1. Introduction ……………………………………………………………………...
2. Progress According to EFA targets &strategies ………………………………...
3. Constraints ……………………………………………………………………….
4. National EFA Progress indicators ……………………………………………….
5. Progress and Achievements ……………………………………………………..
6. Key issues & Challenges ………………………………………………………...
7. Conclusion ………………………………………………………………………
3.2: Universal Primary/Basic Education …………………………………………..
1. Introduction ……………………………………………………………………..
2. Progress According to EFA targets and Strategies ……………………………...
xv
3. Recent achievement and impacts of EFA Goal 2 ……………………………….
4. Nomadic Education Programme and EFA Goal 2 ………………………………
5. Almajiri Education Programme .......................................................................
6. Key issues and challenges for basic Education in Nigeria ………………………
7. Overall lesson leant with regard to EFA with regard to
EFA Goal 2 since 2000 ...……………………………………………………….
3.3: Meeting the learning Needs youths and Adults ……………………………...
1. Introduction ……………………………………………………………………...
2. Progress in EFA Goals 3 ………………………………………………………...
3. Main EFA Challenges for Goal 3 ………………………………………………..
4. Out-of School Children ………………………………………………………….
5. Drop-out from the formal Education system ……………………………………
6. Strategic imperatives for meeting EFA Goal 3 ………………………………….
7. Enhanced in age and visibility for TVET ……………………………………….
8. Recognition and standards ………………………………………………………
9. Certification ……………………………………………………………………..
10. Vacationalisation of Education at all levels ……………………………………
11. Enhanced funding ……………………………………………………………...
12. Companies must a role …………………………………………………………
3.4: Improving Adult Literacy ……………………………………………………
1. Introduction ……………………………………………………………………...
2. Progress made to non-formal and Adult Education …………………………….
3. Achievement …………………………………………………………………….
4. Other Progress towards EFA Goal 4 ……………………………………………
5. Challenges ……………………………………………………………………….
6. Way forward …………………………………………………………………….
3.5: Gender Parity and Equality in Education …………………………………….
1. Introduction ……………………………………………………………………...
2. Antecedent/situation Analysis …………………………………………………...
3. National EFA Gender Related indictors across Educational levels ……………..
4. Post Basic –Senior Secondary level ……………………………………………..
xvi
5. TVET …………………………………………………………………………….
6. Adult and Non-formal Education ……………………………………………….
7. Teachers …………………………………………………………………………
8. Progress made towards EFA Goal 5 …………………………………………….
9. Challenges ……………………………………………………………………….
3.6: Quality of Education ………………………………………………………….
1. Introduction ……………………………………………………………………...
2. Early Childhood care &Education (ECCE) ……………………………………..
3. Availability of Teachers …………………………………………………………
4. Transition Rate …………………………………………………………………..
5. Completion Rate ………………………………………………………………...
6. Pupil Teacher Ratio in basic Education …………………………………………
7. Teacher Quality ………………………………………………………………….
8. Quality in Basic Education 2009-2012 ………………………………………….
9. Enrolment in primary Education ………………………………………………...
10. Learning Achievements in UBE ……………………………………………….
11. Teacher issues in Basic Education ……………………………………………..
12. Infrastructure …………………………………………………………………...
13. Conclusion ……………………………………………………………………...
Section 4: Implementation EFA Strategies ………………………………………………...
1. Introduction ……………………………………………………………………...
2. Some Strategies used to implement EFA in Nigeria ……………………………
3. Some key Reforms influenced by EFA …………………………………………
4. Success …………………………………………………………………………..
5. Effectiveness of National Strategies …………………………………………….
6. Constraints ……………………………………………………………………….
7. Solutions …………………………………………………………………………
8. Conclusion ……………………………………………………………………….
Sections 5: Financing Basic Education in Nigeria …………………………………………
1. Introductions …………………………………………………………………….
2. Finding and other financial issues ……………………………………………….
xvii
3 .Accumulated un-Accessed funds ………………………………………………..
4. Debt Relief Gains ………………………………………………………………..
5. Education Related MDGs ……………………………………………………….
6. Conditional Grants Scheme ……………………………………………………...
7. Sources of Fund ………………………………………………………………...
8. Release of the UBE Fund ………………………………………………………
9. Community Self- initiative ……………………………………………………...
10. Challenges in financing Basic Education in Nigeria …………………………..
11. Possible solutions ………………………………………………………………
Section Six: Protest for post 2015 ………………………………………………………….
1. Introduction ……………………………………………………………………..
2. Access …………………………………………………………………………...
3. Quality …………………………………………………………………………...
4. Equity ……………………………………………………………………………
5. Conclusion ………………………………………………………………………
Reference …………………………………………………………………………………...
Production team ……………………………………………………………………………
Figures
Fig 1.1: Nigeria Map showing its neighboring countries ………………………….
Fig 1.2: Formal education in Nigeria ………………………………………………
Fig 1.3: Allocation of UBE intervention funds …………………………………….
Fig 3.1.1: Number of ECCDE Centers 2009-2013 ………………………………...
Fig 3.1.2: ECCDE/Preprimary Enrolment in Public and Private
School 2006-2010 ………………………………………………………
Fig 3.1.3: Percentage increase in ECCDE Nomadic
Schools 2009-2012 ……………………………………………………..
Fig 3.1.4: National HIV Prevalence Rate …………………………………………
Fig 3.1.5: HIV/ AIDS Prevalence Rate by State …………………………………..
Fig 3.1.6: ECCDE Enrollment Trend from 2009-2013 ……………………………
Fig 3.1.7: Trend in ECCDE ……………………………………………………….
xviii
Fig 3.1.8: Total ECCDE as % of school going population from 2009-2013……….
Fig 3.1.9: Pre-primary enrolments by ownership………………………………………
Fig 3.1.10: Survival Rate in ECCDE, 2009-2013……………………………………..
Fig 3.1.11a: Trained Teachers in Public School…………………………………………
Fig 3.1.11b: Trained Teachers in Private Schools……………………………………….
Fig 3.1.12: Trend in % Qualified teachers in ECCDE, 2010-2013………………………
Fig 3.1.13 Pupil Teacher Ratio (PTR) in Public and private Pre-school: 2007-2008……
Fig 3.1.14a Trend in Pupil-Teacher Ratio in ECCDE, 2009-2013……………………….
Fig 3.1.14b Trend in Pupil Qualified Teacher Ratio in ECCDE, 2010-2013…………….
Fig 3.2.1: Enrolment in Junior Secondary Schools by Gender, 2000-2010………………
Fig 3.2.2: Enrolment in Junior Secondary Schools by Gender, 2000-2010………………
Fig 3.2.3: Total Enrolment in Public Primary and Junior
Secondary Schools, 2000-2008 ........................................................................
Fig 3.2.4: Enrolment in public Primary and Junior Secondary
Schools, 2009-2013 .......................................................................……..
Fig 3.2.5: Public Primary and JSS Enrolment Trend from 2009-2013……………………
Fig 3.2.6: Trends in Public Primary and JSS Schools 2009-2013…………………………
Fig 3.5.1: Enrolments in Public and Private Pre-primary Schools
in Nigeria by Gender ..............................................................................…
Fig 3.5.2: ECCE Gender Parity Index, 2009-2013………………………………………..
Fig 3.5.3: Primary Enrolment by School and Gender,2009-2011/2012…………………..
Fig 3.5.4: JSS Enrolment by School and Gender 2009/2010-2011/2012………………….
Fig 3.5.5: Gender Parity Index, 2009-2013………………………………………………...
Fig 3.5.6: JSS Gender Parity Index, 2009-2013……………………………………………
Fig 3.5.7: National % Annual Completion Rate by Gender …………………….....
Fig 3.5.8: Distribution of Enrolment at the SS level by Gender .…………………..
Fig 3.5.9: Gender Disparity in Technical College
Enrolment, 2010-2011 ………………….................................................
Fig 3.5.10: Enrolment into Non-Formal Education by
Gender, 2001-2011 ………………........................................................
Fig 3.5.11: Summary of learners Enrolment by programmes for 2011 ……………
xix
Fig 3.5.12: General Summary of Literacy Level by Gender & Zones ……………
Fig 3.5.13: Teachers in Public and Private
Pre-primary Schools by Gender, 2006-2010 …...................................
Fig 3.5.14: Distribution of Qualified Teachers Gender, 2011 ………………….....
Fig 3.6.1: Teachers in Public &Private Pre-primary
Schools by Genders, 2006-2010 …….......................................................................
Fig 3.6.2: Teachers in Private Primary School by
Qualification and Gender, 2006-2010 ......................................................
Fig 3.6.3: National % Annual Completion rate by Gender ……………………......
Fig 3.6.4: National Retention Rate Basic Education ……………………………
Fig 3.6.5: Improved Quality of Education 2010-2013 ………………………….....
Fig 3.6.6a: Trained Teachers in Public Schools ……………………………….......
Fig 3.6.6b: Trained Teachers in Private Schools ……………………………….....
Fig 3.6.7: Pupil Teacher Ratio (PTR) in Public and
Private Schools, 2007-2008 ………..........................................................................
Fig 3.6.8a: Trend in Pupil Teacher Ratio in ECCDE, 2009-2013 …………….......
Fig 3.6.8b: Trend in Pupil Qualified Teacher Ratio
in ECCDE, 2010-2013 ……………….................................................
Fig 3.6.9: Enrolment in primary School by Gender, 2009-2012…………………..
Fig 3.6.10: Number of Teachers and Staff Trained 2009-2013 ……………………
Fig 3.6.11: Total Number of Classrooms Renovated ………………………………
Fig 3.6.12: Number of Instructional Materials from 2009-2013 ……………………
Fig 3.6.13: Number of Computer and Science Kits, 2009-2012 ……………………
Tables
Table 3.1.1: Number of Public ECCDE Centre, 2009-2013 .....................................
Table 3.1.2: ECCDE/Preprimary Enrolment in Public &
Private Schools 2006-2007 ..................................................................
Table 3.1.3: ECCDE enrolment for 2011-2013 ........................................................
Table 3.1.4: Percentage increase in ECD Nomadic Schools ....................................
Table 3.1.5: National prevalence Rate of HIV/AIDS 1991-2012 .......................
xx
Table 3.1.6: HIV/AIDS Prevalence Rate by State 2012 ..........................................
Table 3.1.7: Pre-primary enrolment by ownership 2009-2010 ........................
Table 3.1.8: Early Child Care Development Centre by
Area Councils (FCT) ........................................................................
Table 3.1.9: Percentage of Trained Teaches in Pre-primary Education ...................
Table 3.1.10: Pupil Teacher Ratio y (PTR) in public and private
Pre-schools 2007-2008 ........................................................................
Table 3.2.1: Enrolment in Primary school by Gender, 2000-2010 .......................
Table 3.2.3: Enrolment Gender in Junior Secondary by Gender, 2000-2010 .........
Table 3.2.4: Pupils enrolment in the Nomadic Schools ...................................
Table 3.2.5: Mobile Collapsible Classroom acquired by national commission
for nomadic Education since inception ..............................................
Table 3.2.6: Number of Nomadic Schools constructed over the years ..................
Table 3.2.7: Teacher Trained over the years ...........................................................
Table 3.2.8: Curriculum and book production for Nomadic Schools
over the years .......................................................................................
Table 3.3.1: Gender Disparity in Technical College Enrolment (2020/2011) ..........
Table 3.3.2: Primary enrolment by school Classrooms, Streams
(2008-2010) ...................................................................................
Table 3.3.3: Percentage of out-of –School Children in Nigeria state by
State Companion .......................................................................
Table 3.3.4: 2010 Enrolment, Relation and completion Rates in various levels
of Education ........................................................................................
Table 3.4.1: 2010 Estimated Populations by Ages and sex ..................................
Table 3.4.2: 2010 National Literacy Rates of Youths and adult ......................
Table 3.4.3: Summary of learner Enrolments by Programme for 2011 ...................
Table 3.4.4: Advocacy visits to States and results achieved ...................................
Table 3.4.5: Summary of statistics of the training by jones from
April-May 2013 ...................................................................................
Table 3.5.1: Enrolment in Public and Private Pre-primary Schools in
Nigeria by Gender ......................................................................
xxi
Table 3.5.2: ECCE Gender Parity Index, (2009-2013) ..................................
Table 3.5.3: Primary Enrolment by School and Gender, 2009/10-2011/12 .........
Table 3.5.4 JSS Enrolment by school and 009/2010-2011/12 .....................
Table 3.5.5: Primary Gender Parity index, 2009-2013 .................................
Table 3.5.6: JSS Gender Parity index, 2009-2013 .............................................
Table 3.5.7: National % Annual Completion Rate by Gender .....................
Table 3.5.8: Number of Schools, population of 15-17 year olds,
Enrolment, GER and GER and GPI for senior Secondary
Schools by State 2011-2012 ..........................................................
Table 3.5.9: Gender Disparity in technical Colleges Enrolment, 2010-2011 .........
Table 3.5.10: Technical College Enrolment by Programme ...................................
Table 3.5.11: Enrolment into Non-formal Education by Gender 2001-2011 .........
Table 3.5.12: Summary of learner Enrolment by programme for 2011 ..................
Table 3.5.13: General Summary of literacy by Gender and Zones ......................
Table 3.5.14: Teaches in Public and Private Pre-primary Schools
by Gender:2006-2010 .......................................................................
Table 3.6.1: Teaches in Public and Private Pre-primary Schools
by Gender: 2006-2010 ........................................................................
Table 3.6.2: Teaches in private Primary School by Qualification and
Gender 2006-2010 ......................................................................
Table 3.6.3: National Summary of Teaches in JSS by Gender,
2006-2010 ..................................................................................
Table 3.6.4: National % Annual Completion Rate by Gender ......................
Table 3.6.5: National Retention Rate Basic Education .........................................
Table 3.6.6: Improved quality of Education, 2010-2013 .......................................
Table 3.6.7: Percentage of trained teaches in Pre-primary Education ...................
Table 3.6.8: Pupil teaches Ration (PTR) in Public and private
Pre-school 2007/08 ..............................................................................
Table 3.6.9: Enrolment in primary school by Gender, 2009-2013 ..........................
Table 3.6.10: 2001 National Assessment .................................................................
Table 3.6.11: 2003 National Assessment .................................................................
xxii
Table 3.6.12: 2006 National Assessment .................................................................
Table 3.6.13: 2011 National Assessment .................................................................
Table 3.6.14: Summary of Deliverables 2009-2012 (from
Matching grants finals) ......................................................................
Table 4.1: Summary of DRGS Appropriation to Education sector
forum 2006-2013 ..................................................................................
Table 4.2: MDGs-DRGs funds for Education Sector: funding
Trend of MDGs/DRGs Appropriation of Education
sector from 2006-2013 ........................................................................
1
Section 1: Introduction
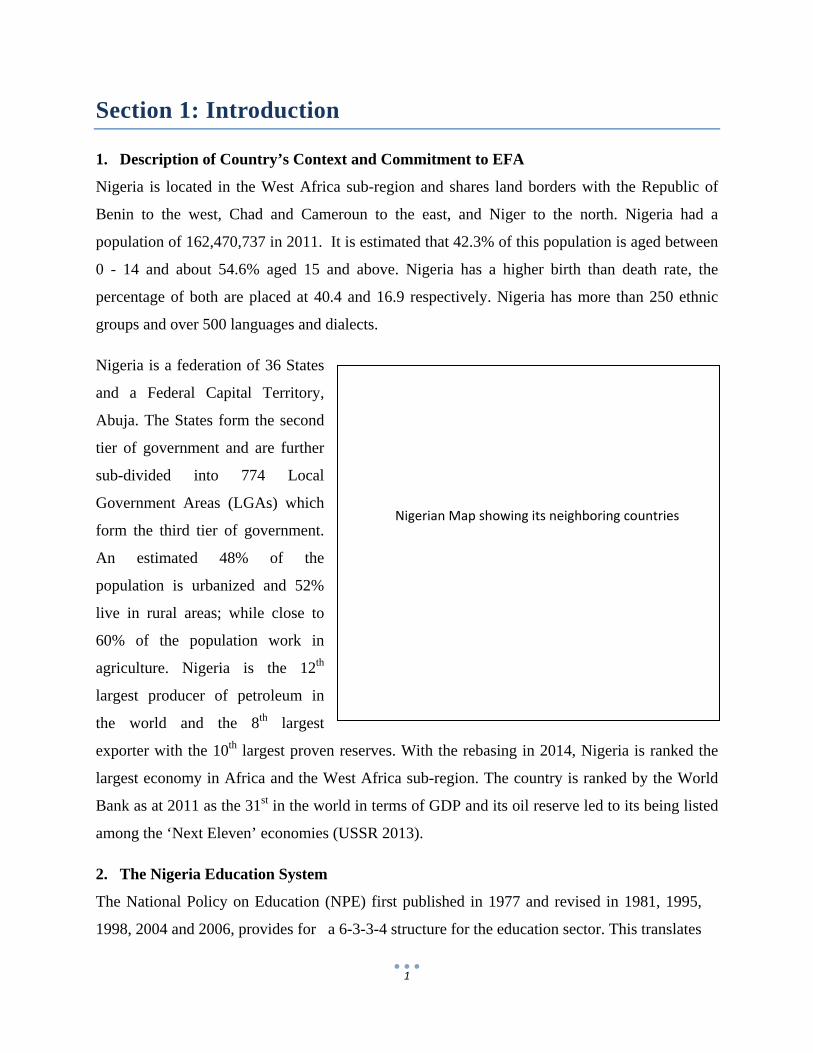
1. Description of Country’s Context and Commitment to EFA
Nigeria is located in the West Africa sub-region and shares land borders with the Republic of
Benin to the west, Chad and Cameroun to the east, and Niger to the north. Nigeria had a
population of 162,470,737 in 2011. It is estimated that 42.3% of this population is aged between
0 - 14 and about 54.6% aged 15 and above. Nigeria has a higher birth than death rate, the
percentage of both are placed at 40.4 and 16.9 respectively. Nigeria has more than 250 ethnic
groups and over 500 languages and dialects.
Nigeria is a federation of 36 States
and a Federal Capital Territory,
Abuja. The States form the second
tier of government and are further
sub-divided into 774 Local
Government Areas (LGAs) which
form the third tier of government.
An estimated 48% of the
population is urbanized and 52%
live in rural areas; while close to
60% of the population work in
agriculture. Nigeria is the 12th
largest producer of petroleum in
the world and the 8th largest
exporter with the 10th largest proven reserves. With the rebasing in 2014, Nigeria is ranked the
largest economy in Africa and the West Africa sub-region. The country is ranked by the World
Bank as at 2011 as the 31st in the world in terms of GDP and its oil reserve led to its being listed
among the ‘Next Eleven’ economies (USSR 2013).
2. The Nigeria Education System
The National Policy on Education (NPE) first published in 1977 and revised in 1981, 1995,
1998, 2004 and 2006, provides for a 6-3-3-4 structure for the education sector. This translates
Nigerian Map showing its neighboring countries
2
into six years of primary schooling, three years of junior secondary, three years of senior
secondary and four years of tertiary education. In a further review in 2013, an additional one
year was included to make for the formal inclusion of pre-primary education into primary
education. The subsequent first ten years are therefore treated as a continuum of 10-year basic
schooling which is offered in a seamless manner. This is the basis for the Universal Basic
Education (UBE) programme. As noted in the report of the Presidential Task Team on
Education (PTTE) led by a retired UNESCO Regional Director, Professor Pai Obanya, the
revisions in the policy over time were made in response to trends at the global and pan-
African levels (EFA-Education for All, MDGs-Millennium Development Goals, African
Education Decades etc.) and also in response to evolutions in national development goals
(VISION 2010, NEEDS, VISION 20-20-20, in particular). The Policy has been subjected to
revisions on a regular basis. The 6-3-3-4 structure is in itself an attempt to align with global
and pan-African trends that aim at compulsory education up to the end of junior secondary
schooling (PTTE, 2011: 15).
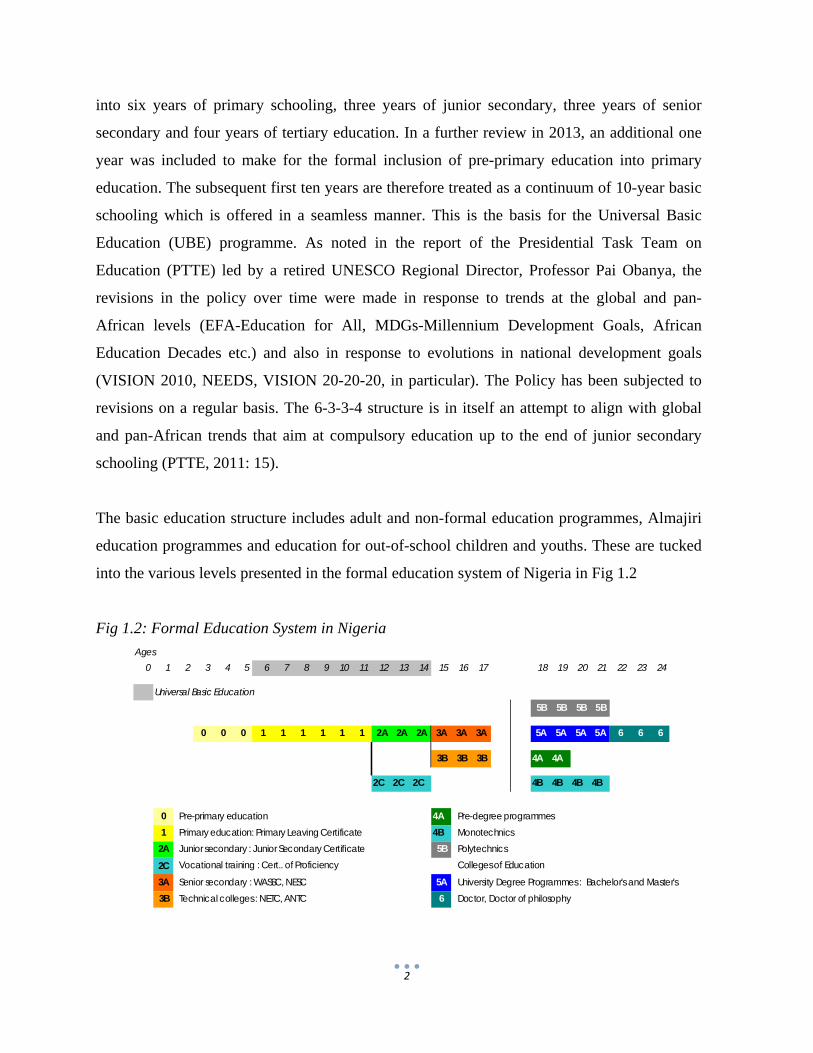
The basic education structure includes adult and non-formal education programmes, Almajiri
education programmes and education for out-of-school children and youths. These are tucked
into the various levels presented in the formal education system of Nigeria in Fig 1.2
Fig 1.2: Formal Education System in Nigeria
Ages0 1 2 3 4 5 6 7 8 9 10 11 12 13 14 15 16 17 18 19 20 21 22 23 24
Universal Basic Education5B 5B 5B 5B
0 0 0 1 1 1 1 1 1 2A 2A 2A 3A 3A 3A 5A 5A 5A 5A 6 6 6
3B 3B 3B 4A 4A
2C 2C 2C 4B 4B 4B 4B
0 Pre-primary education 4A Pre-degree programmes1 Primary education: Primary Leaving Certificate 4B Monotechnics
2A Junior secondary : Junior Secondary Certificate 5B Polytechnics
2C Vocational training : Cert.. of Proficiency Colleges of Education
3A Senior secondary : WASSC, NESC 5A University Degree Programmes : Bachelor's and Master's3B Technical colleges : NETC, ANTC 6 Doctor, Doctor of philosophy
3
In Nigeria, education falls under the items on the concurrent legislative listing meaning that both
federal and state governments can pass laws on it. However, basic and secondary education as
well as adult and non-formal education is managed by states and local government areas. The
federal government however, owns and manages 104 Unity Colleges which serve the purpose of
its name and as a model for states to emulate.
The National Council on Education (NCE) chaired by the Honourable Minister of Education is
the highest decision making body in education. The Council is made up of all State
Commissioners of Education and approves all decisions in education.
3. Nigeria’s Early Starts In Basic Education
One of the very serious challenges in the way of documenting the progress achieved towards the
EFA Goal(s) within the Nigerian context is the paucity, and in some cases, the complete absence
of data required for such an exercise. The 2002 Global Monitoring Report (GMR) shows that
Nigeria was one of the countries in Sub-Saharan Africa without data on Universal Primary
Education (UPE). The Report shows that Nigeria had no data on Gross Enrolment Ratio (GER),
and Net Enrolment Ratio (NER), and that the country is one of 11 African countries at serious
risk of not achieving the goal. The exercise to analyse progress towards the goal of universal
primary education (UPE) has been based on country net enrolment ratios, and these countries
had NERs less than 80%.
4. History Of Universal Primary Education In Nigeria
In Nigeria, even colonial Nigeria, successive governments have recognized the importance of
primary education as the foundation of the education system. Attempts at universalizing primary
education in Nigeria date back to the 1950s when the Macpherson Constitution of 1951 made
education a regional matter. Each of the regions-Eastern Region, Western Region, and Northern
Region- henceforth was free to enact laws and make polices on education. In 1952, the Minister
of Education, Western Region, Hon. S.O. Awokoya, in a sessional paper, announced a policy of
“expansion and reorientation” (Oni,2008). The policy of expansion, a six-year free primary
education program which was designed to make education free and compulsory, was to start in
1955. On January 17, 1955, the Government of Western Region launched the six-year free
primary education scheme with 392,859 children in 6274 schools participating.
4
In 1953 the Eastern Regional Government announced its intention to introduce free universal
four-year junior primary education covering Infant 1, Infant 2, Standard 1 and Standard 2. The
government later changed it to an eight-year free primary education programme. The scheme
which was launched in 1957 failed in just one year after it started because of lack of proper
planning. The government had no other option than to change to free, universal primary
education for the first two years. Pupil enrolment which was 904,235 in 1956 went up to
1,209,167 in 1957. Lagos, a federal territory, started universal primary education in 1957 with
50,182 pupils in 96 schools participating. The Northern Regional Government did not initiate a
commensurate programme of universal primary education.
Sixteen years after independence, in September 1976, the then General Olusegun Obasanjo,
Head of State and Commander-in-Chief of the Armed Forces, launched the Universal Primary
Education(UPE) scheme, at Oke Suna Primary School, Lagos. With effect from that date,
primary education was to become not only free, but in addition, universal in all the then 19 States
of the federation. The scheme was to become compulsory in 1979. Two million, three hundred
thousand (2,300,000) children were projected to be enrolled in primary 1. Projection of
additional teaching staff and classrooms was put at 59,500 and 36,000 respectively.
In 1989, to further ensure that the UPE is accessed by the hard- to-reach nomadic populations,
the then Military President, General Ibrahim Badamasi Babangida established an education
programme for nomads by Decree 41 of 1989 now Act N20 LFN. The provision of the
programme led to the establishment of the National Commission for Nomadic Education
(NCNE) to implement the programme in the country.
Another attempt at universalizing primary education was made when on Thursday, September
30, 1999, Nigeria’s former civilian president, Chief Olusegun Obasanjo, launched the Universal
Basic Education (UBE) programme at Shehu Kangiwa Square, Sokoto, Sokoto State. The
scheme comprised six-year primary education for all children of school age, and three years of
junior secondary education.
5
Unfortunately, these attempts at universalizing primary education in Nigeria have not yielded the
expected results. As Oni (2008) puts it, “…there has been no time that all children of school age
planned for have been in school and benefitted from primary education”. Oni argues that the
failure of the UPE of 1976 was one of the reasons for the introduction of the UBE.
Between 1992 and 2000, government had intensified efforts to increase access to schooling. In
1992, the gross primary school intake in Nigeria for both boys and girls was 14,805 937(Oni,
2008). The number rose to 16,190,947 in 1995 but dropped to 14,078,474 in 1996. By 1998, it
picked up again to 17,305,991 and rose to 22,143,090 in 2000.
5. Nigeria’s Commitment to EFA
The UBE programme is an expression of the desire of the Government of Nigeria to fight
poverty and reinforce participatory democracy by raising the level of awareness and general
education of the entire citizenry. The programme affirms Nigeria’s response and commitment to
the Jomtien Declaration (1990) as well as the Delhi Declaration (1993) which requires stringent
efforts by the E9 countries1 to drastically reduce illiteracy within the shortest possible time
frame; the Durban Statement of Commitment (1998) and the OAU Decade of Education in
Africa (1997 – 2006) requiring African states to generalize access to quality basic education as a
foundation stone for sustainable socio-economic development of the continent.2 The UBE
programme was launched in September 1999 in Sokoto, ahead of the Dakar Summit and it
represents the country’s strategy and most viable opportunity for achieving Education for All
(EFA) (Okoro, 2009) The first batch of primary one pupils for the programme was enrolled
nation-wide in the 2000/2001 academic session.
The UBEC Law which was subsequently enacted in 2004 stipulates that “Every Government in
Nigeria shall provide free, compulsory and universal basic education for every child of primary
and junior secondary age” (UBE Act 2004). Accordingly “Federal Government’s intervention
under this Act shall only be an assistance to the States and Local Governments in Nigeria for the
purpose of uniform and qualitative basic education throughout Nigeria”
1 E9 Countries are the nine most populous countries in the world with the highest number of illiterate population. 2 Federal Ministry of Education: ‘The Nigerian National action Plan for Implementing the Dakar Framework, August, 2001.
6
i. Objectives of the UBE Programme
The objectives of the UBE programme are to:
develop in the entire citizenry a strong consciousness for education and a strong
commitment to its vigorous promotion;
provide free, universal basic education for every Nigerian child of school-going age;
reduce drastically the incidence of drop-out from the formal school system (through
improved relevance, quality and efficiency);
cater for the learning needs of young persons who, for one reason or another, have
had to interrupt their schooling, through appropriate forms of complementary
approaches to the provision and promotion of basic education;
Ensure the acquisition of appropriate levels of literacy, numeracy, manipulative,
communicative and life skills, as well as the ethical, moral, and civic values needed
for laying a solid foundation for lifelong learning.
ii. Scope of the Universal Basic Education Programme
The scope of the UBE programme communicates the expanded vision of basic education and
includes:
Programmes and initiatives for early childhood care, education and development;
Programmes and initiatives for the acquisition of functional literacy, numeracy and life
skills, especially for adults ( persons aged 15 and above);
Out-of-school, non-formal programmes for the updating of knowledge and skills for
persons who left school before acquiring the basics needed for lifelong learning;
Special programmes of encouragement to all marginalized groups: girls and women,
nomadic populations, out-of-school youth and the almajiris;
Non-formal skills and apprenticeship training for adolescents and youth, who have not
had the benefit of formal education;
The formal school system from the beginning of primary education to the end of the
junior secondary school (Pai Obanya, 2009).
7
iii. The Universal Basic Education Policy
The UBE Act and the National Policy on Education (revised 2004) provide the legal and policy
framework for the implementation of the UBE programme. Some of the policy initiatives in
place as a result of the law are:
It compels every Government in Nigeria to provide compulsory, free, universal basic
education for every child of primary and junior secondary school age.
Services in public primary and junior secondary schools are free of charge. Penalties are
prescribed for persons who charge or receive fees in respect of primary and junior
secondary education in public schools.
Parents have a duty to ensure the education of their children by enrolling them as well as
making sure they complete the basic education cycle. Penalties are prescribed for non-
compliance.
Transition from primary to junior secondary (JSS) shall be automatic, as basic education
terminates at the JSS level. Emphasis is placed on effective continuous assessment while
final examination and certification will be at the end of nine-year basic education
programme.
The secondary education system is structured in such a way that the JSS component is
disarticulated from the Senior Secondary (SSS).
Notwithstanding the statutory responsibility of states and local governments to provide
primary and secondary education the Act provides for Federal Government’s intervention
in basic education as assistance to the States and Local Governments for the purpose of
maintaining uniform and qualitative basic education throughout Nigeria.
Provision is made to finance the Universal Basic Education programme from:
- Federal Government block grant of not less than 2% of its Consolidated Revenue
Fund;
- Funds or contributions in form of Federal guaranteed credits; and
- Local and international donor grants.
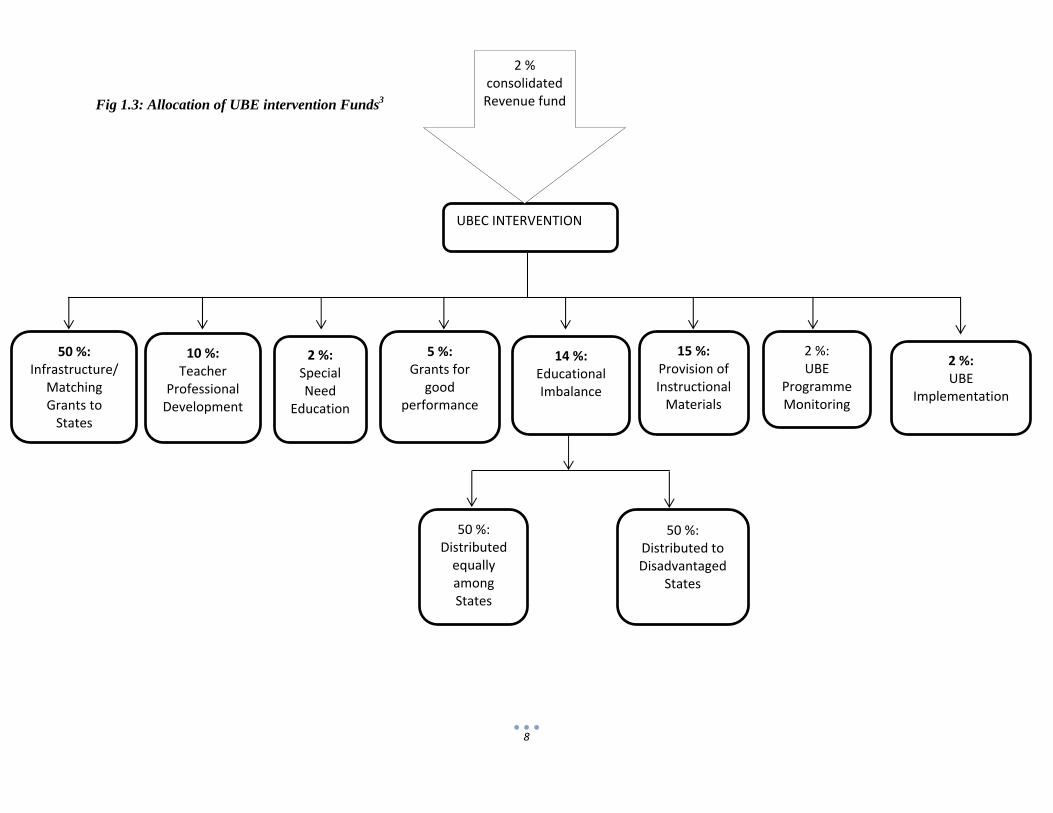
iv. UBE Intervention Fund
Nigeria further committed to implementing the elaborate programme that the UBE is by creating
the UBE Intervention Fund, as it is called. The UBE intervention fund is in two parts: the
8
UBEC INTERVENTION
50 %: Infrastructure/
Matching Grants to States
10 %: Teacher
Professional Development
2 %: Special Need
Education
5 %: Grants for
good performance
15 %: Provision of Instructional Materials
2 %: UBE
Programme Monitoring
14 %: Educational Imbalance
2 %: UBE
Implementation
50 %: Distributed equally among States
50 %: Distributed to Disadvantaged
States
Fig 1.3: Allocation of UBE intervention Funds3
2 % consolidated Revenue fund
9
intervention fund and the matching grant. Regarded as potentially and significantly important,
the fund is fed through a 2% charge on Federal Government revenue. Its use is restricted to
broadening access, improving quality, and ensuring equity in basic education, but not for
payment of teachers’ salaries and overhead costs. The intervention fund is divided equally
between the 36 states and Federal Capital Territory (FCT) regardless of population, educational
development, poverty levels or overall commitment to universal basic education.
The second part of the fund is known as the matching grant, and constitutes 50% of the 2%
Consolidated Revenue Fund (CRF). This fund can only be accessed under certain conditions by
States and FCT, Abuja. Of particular interest is that equal counterpart funding from the state
government is required to access the matching - grant component of the federal money.
To ensure a fair spread and effective utilisation of the fund to all levels and components of basic
education, the Federal Executive Council approved a sharing formula for the 2% Consolidated
Revenue Fund (January, 2005). This is graphically illustrated in figure 1.3.
To enhance synergy and transparency in implementation, the UBE Law stipulates that before any
State Universal Basic Education Board (SUBEB) embarks on any of the UBE projects, both
Universal Basic Education Commission (UBEC) and SUBEB must agree on the particular needs
of the State upon which implementation must focus. To that effect, a Memorandum of
Understanding (MOU) spelling-out the details is signed by both parties for execution by SUBEB.
Included in the MOU is a clause to ensure that misused, misapplied or diverted funds are
recovered through appropriate means, including suspension or outright stoppage of grants to
such defaulting states. This clause, despite having been acceded to by all the states, remain a clog
in the ability of States to access the UBE fund as most States are unable to satisfy the provision.
6. Institutions Responsible For Implementing EFA
There are institutions charged with the primary responsibility of delivering on Nigeria’s EFA
commitment. These institutions have the responsibility for implementing the national policies in
such a manner that goals are attained within established milestones and overall timeframe. The
institutions are the Universal Basic Education Commission (UBEC), the National Commission
for Nomadic Education (NCNE) and the National Commission for Mass Literacy, Adult and
Non-formal Education (NMEC). There are other institutions whose services are also connected
10
with the successful delivery of the EFA. These include the National Teachers’ Institute (NTI),
Nigerian Education and Research Development Council (NERDC), the National Commission for
Colleges of Education (NCCE) and the Teachers’ Registration Council of Nigeria (TRCN).
11
Section 2: Main EFA Challenges in 2000 and Targets for 2015
2.1 Overall EFA situation and Challenges in 2000
A.) Overall EFA Situation in 2000
Efforts towards achieving the Jomtien targets were minimized by a number of cross-cutting
constraints which included inadequate public enlightenment and social mobilization; a dearth of
data as well as inadequate and inaccurate data for planning and monitoring purposes; poor
learning environments and facilities; inadequate numbers of teachers generally and qualified
teachers specifically with overcrowded classrooms and poor teacher/pupils ratios; a burgeoning
population which, coupled with poor data, made for a disaster in planning; inability to achieve
any form of gender parity in enrolment, retention, achievement, completion rates as well as in
teacher recruitment; inadequate funding; and poor management of human, material and financial
resources.
B.) Challenges in 2000
The process of developing a National Action Plan (NAP) highlighted some of the challenges the
Nigerian government faced:
Reviewing the policy for ECCD was a major challenge which government faced in its bid
to overcome the failures of not providing wide-scale access to early childhood care and
development opportunities.
The proper take-off of the UBE scheme, including the building of ownership at all levels
was another challenge that needed to be addressed in providing for the formal and non-
formal basic education to Nigerians.
The new and additional resources required to support such an ambitious programme as
EFA was enormous. Government was able to show, by prioritizing education in 2000,
that it intended to move significant emphasis, priority and resources into EFA.
Government started making progress in the refurbishment of infrastructure and facilities.
Sustaining this momentum, while mobilizing civil society, the private sector and
12
international development partners in the resources drive, was a central challenge for the
new millennium.
Breaking down the barriers to access, retention, participation and achievement of girls
and women education represented a serious challenge. This was particularly important in
the light of the gender targets of 2005 and 2015.
Meeting the needs of excluded and vulnerable groups in the inclusive concept of EFA
represented a significant challenge.
Development of genuine partnerships and collaboration with civil society, the private
sector and development partners posed another challenge. Integrating the work on
education within wider multi-sectoral issues through the Poverty Reduction Strategy
Plans (PRSPs) and the Comprehensive Development Framework in the context of
globalization presented challenges that required new and innovative approaches.
The threat posed by the HIV/AIDS pandemic was significant. Rapid and proactive
linkages and synergies with the work of NACA in planning for, and mitigating the
impact of HIV/AIDS in education were initial steps in addressing the huge challenge the
virus presented.
The lack of data and its impact on the development of effective monitoring, evaluation
and impact assessment systems must be underscored. In its National response to this
challenge, government established the Nigerian Education Management Information
System (NEMIS) Policy in 2007.
Teacher shortfall, the need for capacity building and the emphasis on building up teacher
status and professionalism was another challenge that needed to be tackled if the
programmes on education were to be successful.
13
2.2 National Targets for 2015
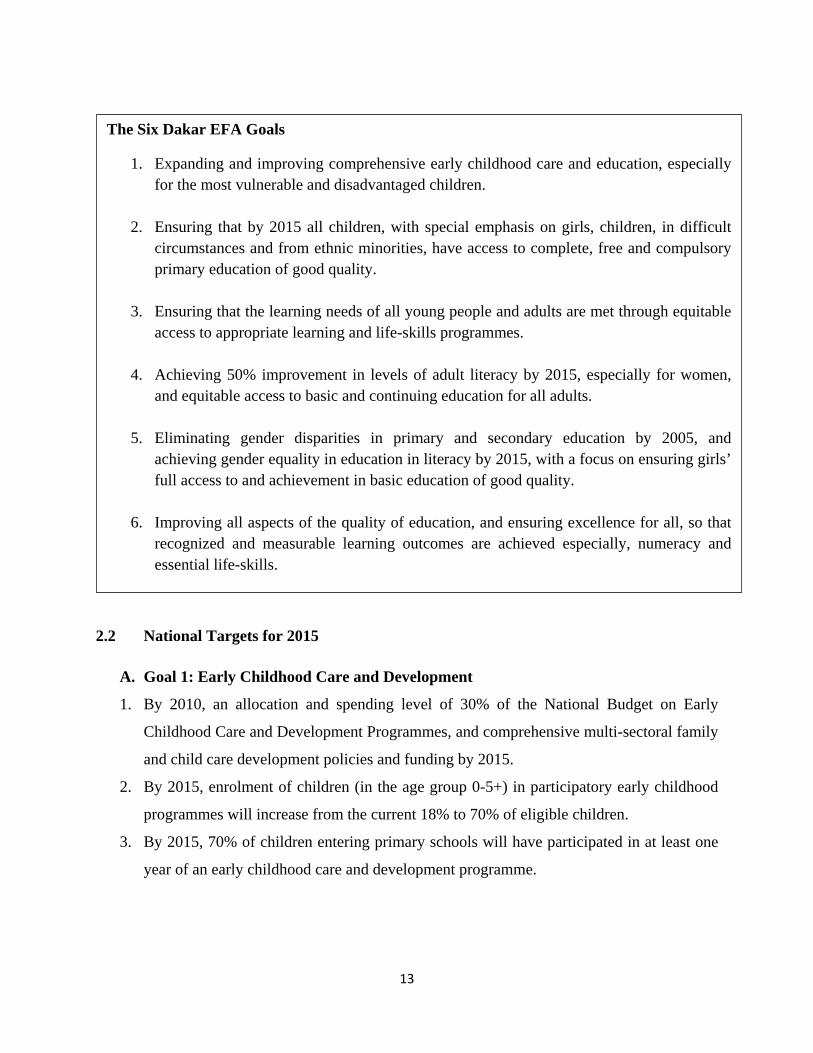
A. Goal 1: Early Childhood Care and Development
1. By 2010, an allocation and spending level of 30% of the National Budget on Early
Childhood Care and Development Programmes, and comprehensive multi-sectoral family
and child care development policies and funding by 2015.
2. By 2015, enrolment of children (in the age group 0-5+) in participatory early childhood
programmes will increase from the current 18% to 70% of eligible children.
3. By 2015, 70% of children entering primary schools will have participated in at least one
year of an early childhood care and development programme.
The Six Dakar EFA Goals
1. Expanding and improving comprehensive early childhood care and education, especially for the most vulnerable and disadvantaged children.
2. Ensuring that by 2015 all children, with special emphasis on girls, children, in difficult circumstances and from ethnic minorities, have access to complete, free and compulsory primary education of good quality.
3. Ensuring that the learning needs of all young people and adults are met through equitable access to appropriate learning and life-skills programmes.
4. Achieving 50% improvement in levels of adult literacy by 2015, especially for women, and equitable access to basic and continuing education for all adults.
5. Eliminating gender disparities in primary and secondary education by 2005, and achieving gender equality in education in literacy by 2015, with a focus on ensuring girls’ full access to and achievement in basic education of good quality.
6. Improving all aspects of the quality of education, and ensuring excellence for all, so that recognized and measurable learning outcomes are achieved especially, numeracy and essential life-skills.
14
4. By 2005, 50% of parents will be sensitized and fully aware of prevention practices in
relation to HIV/AIDS and by 2015, 70% of parents will have been educated in
comprehensive childcare practice.
5. By 2015, the reduction by 30% of the number of children born with developmental
delays and disabilities.
B. Goal 2: Universal Basic Education (UBE)
i.) Primary Education
1. By 2006, 100% of all children of official school-going age (6-11) will be enrolled
fulltime in primary school or an equivalent education programme, including all school
entry-age girls
2. By 2010, improvement of completion rates by 30% to an overall rate exceeding 90% of
those in schools.
3. By 2015, all children of primary school age (girls as well as boys) will be enrolled in
primary school or its equivalent.
4. By 2015, there will be a 50% increase in the number of children with disabilities
mainstreamed into primary school.
5. By 2015, transition rate from primary to junior secondary school will be 90%.
6. By 2015, 80% of children up to the age of 15 will be enrolled in school or an equivalent
education programme.
7. By 2015, the percentage of working children of school age will be reduced by 80% and
access to relevant basic education will be provided for those still working.
ii.) Junior Secondary Education
1. By 2010, 95% of youth and adults will have access to information, education and services
necessary to reduce their vulnerability to HIV/AIDS.
2. Provision of access to the children, on an incremental basis of 10% each year, to junior
secondary school from 50% in 2001 to 100% by 2006.
3. By 2015, 80% of youth and adult aged 15+ will attain national standards set for literacy,
numeracy and problem solving with gender parity.
15
4. By 2015, all young people and adults will have access to formal and non-formal life-long
education.
C. Goal 3
In 2000, this goal had no target set for its attainment for 2015.
D. Goal 4
Adult Literacy and Non-Formal Education
1. By 2002, the development of access programmes for all out-of-school youth, including
pregnant girls and young mothers.
2. By 2003, the mainstreaming of alternative participatory approaches to adult literacy.
3. By 2010, the progressive recruitment and training of an additional 260,000 adult literacy
instructors.
4. By 2010, the provision, through renovation of existing facilities and new construction of
an additional 100,000 training centres for the delivery of adult literacy classes and centres
for nomadic education.
5. By 2015, a reduction by half (25 million) of illiterates in Nigeria.
E. Goal 5: Eliminating Gender Disparities through the Education of Women and Girls
1. By 2005, reduction of gender disparity in enrollment by 10% to 0.9% in all education
programmes.
2. By 2015, 95% of girls of primary school age will be enrolled in primary school or its
equivalent.
3. By 2015, 80% of girls up to the age of 15 will be enrolled in a school-based or equivalent
learning/education programme.
4. By 2015, 80% of all girls and women will have access to relevant basic education, with a
special focus on hawkers, housekeepers, and groups of hard to reach women and girls.
5. By 2015, 80% of all girls and women aged 15+ will attain national standards set for
literacy, numeracy, and problem-solving.
16
6. By 2015, flexible access to relevant programmes of education will be provided to
disadvantaged groups such as pregnant girls and young mothers, including through use of
New Information and Communication Technologies (NICTs) in women Education
Centres.
F. Goal 6
i. Quality and Relevance of Learning
1. By 2002, the review of national curricula to ensure clearly defined, context specific and
appropriate learning outcomes (including such areas as child rights, health and nutrition,
livelihoods, HIV/AIDS education) and clear mechanisms to achievement.
2. The development of capacity, by 2002, for the generation of appropriate and up-to-date
data on all aspects of enrolment, learning and outcomes in order to monitor quality.
3. By 2010, 80% of learning resources will be relevant to learners, gender sensitive, and be
in language and form which teachers and learners can relate to.
4. Development of a multi-sectoral approach to learning that ensures access, through
NICTs, to wide and increasingly relevant range of learning and information
opportunities.
5. Reduction of regional disparities, by 2010, of current pupil/teacher ratios such that pre-
primary and primary levels are 1:20 and primary and junior secondary 1:40.
6. Improvement in resource availability including ratios of textbook access of 1:1 by 2010.
7. By 2015, all teachers of primary and above levels have the minimum qualification of the
Nigeria Certificate of Education (NCE)
8. By 2015, the status and quality of life of learners will be increased through a 70%
reduction in malnutrition; the achievement of full immunization, and the development of
actions through the poverty reduction strategies that raise the standard of living of
Nigerians to an acceptable level to enable effective engagement in quality programmes.
ii. Resource mobilization
a) An increase, by 2015, of the percentage of the national budget expended on education to
26% as recommended by UNESCO
17
b) Continued leveraging of resources through Restructuring of Nigeria’s external debt and
as a result of the development of holistic poverty Reduction Strategy process for the
country.
c) Commitment to the National EFA Action Plan as part of the process of leveraging
additional international resources as promised at the Dakar Summit
d) Continued engagement with civil society and the private sector to generate inputs in
support of the education programme.
G. General
Human Capacity for UBE Delivery
Government recognized the huge investment which was necessary to ensure that capacity needed
to deliver the UBE Programme was in place before 2015, especially in the areas of teacher
capacity development, supervision, monitoring and evaluation, as well as schools and
educational system management. For this reason, government proposed and committed itself to
achieving the following target:
By 2015, Nigeria will have the human resource base necessary to manage and implement
the UBE Scheme.
2.3 Strategy for achieving each of the EFA Goals
1. Goal 1: Early Childhood Care and Development
a) Modification of the UBE Bill such that ECCE will form the bedrock of Nigeria’s
education programme.
b) Proactive government encouragement of private sector and civil society-based ECCD
service providers through the poverty reduction strategies of the Government and through
direct funding of their programmes.
c) Community mobilisation through multi-sectoral committees at all levels and through the
National EFA Forum (NEFAF).
d) Use of Information and Communication Technologies (ICT) (radio, television and
computer-based systems) to enhance and increase access.
e) Investment in training – especially in the provision of training leading to the Nigerian
Certificate in Education (Pre-Primary) National Certificate on Education (NCE).
18
f) Funding, in disadvantaged areas, to support the setting up of community-based ECCD
centres and initiatives.
g) Provision, by 2005, of infrastructural base necessary to enable smooth transition of
children from ECCD programmes into primary education etc.
2. Goal 2
i. Primary Education
a) Increase, by 2015, public expenditure to 26% as recommended by UNESCO from
current levels of under 10%.
b) Capacity building and investment to enhance managerial, analytical and administrative
capacities
c) Improved performance through active involvement of civil society in schools
management through local communities, and in inspection through community
participation – using PTAs, NGOs and other community associations.
d) Provision, with increased resources, of necessary infrastructure to accommodate and
provide quality learning for pupils.
ii. Junior Secondary Education
a) Increase access to basic education opportunities through the UBE Scheme, both for
formal, and non – formal, as well as life – long education opportunities that enable
disadvantaged groups’ access over time.
b) Increase in learner centered and relevant curriculum and pedagogical approaches which
enhance learning and increase attainment levels.
c) Provision of adequate quality assurance mechanisms through capacity enhancement of
the inspectorate function and increased civil society and community capacity for, and
involvement in, monitoring and evaluation.
3. Goal 3
In 2000, this goal had no strategies set for its attainment come 2015.
4. Goal 4
Adult Literacy and Non – Formal Education
19
a) Increase resources allocated to trainer and instructor recruitment and training
b) Enhanced remuneration to ensure recruitment and retention of appropriately qualified
personnel.
c) Professionalism to be entrenched as the approach to adult literacy and non - formal
training and instruction.
d) Significant increases in resource allocation to meet the needs of non-formal training,
including the provision of basic kits, mobilisation equipment, transportation to reach
remote and disadvantaged groups, and focus on community based learning.
e) Encouragement of the introduction and development of participatory approaches to
learning which emphasize community and learner ownership and which can be delivered
at reduced costs.
f) The development of flexible access programmes for out-of-school youth.
g) The inclusion of curriculum content which encourages peace, mutual respect and cultural
tolerance and understanding.
h) The integration of learning within non-formal settings into the formal context, thus
enabling learning to switch into formal opportunities.
i) The use of NICTs (radio, television, computer-based technologies, and solar power
technologies) to enable access to those in remote contexts as well as those with access to
basic social infrastructure.
j) Civil society involvement and support in the development of community-based
programmes.
k) Increased mobilisation for attendance.
l) Development of pedagogy and programmes which ensure appropriate learning which will
increase completion and success rates.
m) Development of schemes that provide alternative income sources as part of the strategies
for addressing poverty reduction.
n) Extensive use of NICTs to provide access to learners across great distance and in hard-to-
reach areas.
o) Development, funding and encouragement of civil society and community based adult
literacy initiatives.
20
p) A continuing programme of collaboration with international development partners in
delivering innovation and flexible programmes, especially for the vulnerable and
disadvantaged groups.
5. Goal 5: Eliminating Gender Disparities through the Education of Women and Girls
a) Development of awareness and sensitization programmes which target women and girls for
formal and non-formal education opportunities.
b) Development of curriculum content which enhance respect for women and children.
c) The inclusion of curriculum content which encourages peace, mutual respect and cultural
tolerance and understanding.
d) Conduct gender audit by 2003 to determine the extent and pattern of disparities in order to
develop programmes to address the needs of all children and adult.
e) Provision of necessary facilities (such as toilets) which increase retention of women and girls
in schools through improved learning environments.
f) Provision of flexible programmes of access for children which target the mainstreaming of
young girls into formal education.
g) Development advocacy programmes which seek to mitigate the effects of cultural practices
on the attendance of women and girls to educational programmes.
h) Employing strategies and involving civil society organizations in awareness building, civic
training and programmes that highlight the role and importance of women and girl-child
education.
i) Introduction of strategies, as part of Nigeria’s Poverty Reduction Programmes, which will
focus on alternative income sources and enhance family earning while reducing dependence
on child labour.
j) Developing programmes of awareness and training which address cultural impediments and
harmful traditional practices which adversely affect the ability of women and girls gaining
and sustaining access to educational opportunities.
k) Progressive move to the legal and practical removal of discriminatory laws, harmful
traditional practices and cultural barriers to women and girl-child access to education,
including those within schools, such as sexual harassment.
21
l) Increased relevance and appropriateness of learning such that it leads to productive
functional learning that is also gender sensitive.
m) Involvement of international development partners in the introduction of NICTs that focus on
increasing access to, sound learning achievement of, women and girls.
n) Expansion of programmes which are currently running which focus on gender-related
disparities and which assist in reduction of disparities by 2015, including emphasis on
increased and targeted female teacher recruitment to serve as role models as well as inclusion
in governance system for education.
o) The development, by 2005, of clear indicators of progress that enable monitoring instruments
to be designed to monitor progress with targets for delivery.
6. Goal 6: Quality and Relevance of Learning
a) Provision of revised and relevant curriculum.
b) Expansion of the provision of quality learning environments for education.
c) Investment in the development of teacher capacity, including provisions for training,
retraining and upgrading qualifications to NCE level.
d) Increased emphasis on culturally sensitive, relevant and appropriate curriculum content.
e) The inclusion of curriculum content which encourages peace, mutual respect and cultural
tolerance and understanding.
f) Provision of resources to facilitate adequate improvement of basic infrastructure and learning
materials.
g) Inclusion of all multi-sectoral issues (around health, nutrition, sanitation, HIV/AIDS etc.) in
curricula for all systems from ECCD through formal and non-formal education through the
UBE scheme.
h) Programmes designed to improve cognitive and analytical skills and which increase learner
participation.
i) Commitment to the enhancement and professionalism of teaching through capacity building
programmes and packages of remunerations which recognize the central role of teachers in
our national development programme.
j) Greater civil society and community involvement in monitoring and evaluation as a
mechanism for feeding into the improved quality loops.
22
k) Development, through EMIS and ESA, of data generation and capacity for proper planning,
monitoring, evaluation and impact assessment of education in Nigeria.
7. General
Human capacity for UBE Delivery
a) Continued expansion of teacher training opportunities and increasing conversion of existing
TC II Certificate teachers to the NCE qualification; achieving 100% by 2015 (specific targets
including the need for an additional 500,000 teachers and instructors to deliver the formal
and non-formal components of UBE by 2015).
b) Complete analysis of the potential impact of HIV/AIDS on teacher supply and take actions to
redress any shortfalls in the projected numbers required.
c) Continued programme of enhancement status and professionalism for teachers through
training and retraining, reviews to current remuneration packages and enhanced career
opportunities.
d) Programmes designed to address the capacity needs for schools and educational
management, ranging from interventions directed at School Heads, Teachers, support staff
and community-based committees and agents of civil society to enhance educational resource
management.
e) Building the capacity of the Inspectorate Services to improve quality.
f) Engaging civil society partners in the roles of quality assurance, monitoring, evaluation and
impact assessment at all levels.
23
Section 3: Progress towards EFA Goals in 2015
Introduction
To ensure the right to basic education, the Dakar Frame Work called upon governments to develop responsive participatory and accountable systems of educational governance and management.
The Dakar Framework encouraged government to:
Develop comprehensive national education plans, linked to national poverty elimination and development strategies;
Strengthen the capacity to monitor education progress;
Engage civil society in policy making and monitoring;
Improve regulatory frameworks for the provision of education; and
Decentralize educational management.
i. Comprehensive National Education Plans
Nigeria has developed a comprehensive national educational plan that spells out the national objectives of education at all the levels of education-Early Child Care and Education, Primary, Junior Secondary, Senior Secondary, and Tertiary. The plan also spells out the objectives of each level of education and the curriculum to achieve those objectives.
ii. Establishment of Education Management Information System (EMIS)
The Dakar Framework identified improved capacity for monitoring of performance in the education system as fundamental. Nigeria sought to achieve this through the establishment of Education Management Information System (EMIS). The EMIS is being strengthened for the collection, integration, processing, maintenance and dissemination of data and information to support decision making, policy analysis and formulation, planning, monitoring and management at all levels of the education system.
iii. Engagement of Civil Society in Policy-making and Monitoring
In the quest to achieve the objectives of EFA and MDGs, the Government of Nigeria has been working in active collaboration with International Development Partners (IDPs) such as UNICEF, DFID, UNESCO, USAID, JICA, World Bank as well as Civil Society Organizations (CSOs) and Non-governmental Organizations (NGOs) to achieve the EFA/UBE goals. The role of IDPs, CSOs and NGOs have been most evident in the area of girls-child education.
iv. Improved Regulatory Framework for the Provision of Education
Since governments have an obligation under international treaties to ensure that children, youth, and adults receive adequate education, the Dakar Framework for Action paid attention to regulatory frameworks for the provision of education. Nigeria has regulations governing
24
registration of non-government schools. However, such regulations usually involve meeting teacher qualification requirements but in practice private schools, especially low budget ones, often rely on under-qualified teachers on temporary contracts. The situation is worsened by a lack of ongoing and effective supervision, and corruption which makes it possible for private providers to get away with substandard and inadequate provisions.
v. Decentralization of Educational Management To promote participation and accountability, the Dakar Framework suggested that countries move towards more decentralized educational management. Countries are being encouraged to undertake programs to decentralize financial, political, and administrative responsibilities for education. In Nigeria, the powers of local governments in relation to delivery of education remain limited. Decentralization holds much promise in making schools more responsive to local education needs. In particular, school-based management - the most far-reaching form of decentralization - has received considerable attention in recent years. To strengthen management at micro level, the National Council on Education in 2005 approved the establishment of School-Based Management Committees in all public schools. While majority of States have complied with this policy, SBMCs have so far made little or no discernible impact on improving the quality of deliverables to learners in many of the States. The creation of School-Based Management Committees is aimed at giving the committees responsibility for key functions such as hiring, paying, and supervision of teachers and monitoring of student attendance. The aim is to increase enrolment, especially in poor rural areas, and to give parents a stronger voice in school administration.
25
3:1 – Expanding ECCE
EFA GOAL 1
1. Introduction
Gradually, nations all over the world have come to a common understanding that the foundations
laid in the “first thousand days of a child’s life are critical for the child’s future (EFA GMR,
2013/4) and that investing in early childhood care and development brings high returns later in
life. Education statistics show that ECCDE is only available to a few. To address this gap, EFA
goal 1 seeks to “Expand and improve comprehensive early childhood care and education,
especially, for the most vulnerable and disadvantaged children”. For the purpose of this National
EFA 2000 - 2014 Review, this section will focus on the progress made by Nigeria, towards
expanding Early Childhood Care and Education (ECCE). The challenges to the attainment of
Goal 1 by 2015 will also be highlighted.
2. Progress According to EFA Targets and Strategies
According to the strategies set for achieving this goal as stated in Section 1, some of the
following have been put in place:
a) Modification of the UBE Act such that the ECCDE will form the bedrock of Nigeria’s
education programme
As demonstrated in the policy analysis in the preceding section, this target has been met. The
UBE Act of 2004 made the necessary provisions for the accommodation of Early Childhood
Education within the framework of basic education. Moreover, the “National Policy for
Integrated Early Childhood Development” (IECD) of October 2007 emphasizes the importance
of inter – sectoral collaboration to enable the Nigerian child appropriate all its rights as stipulated
in the Convention on the Rights of the Child (CRC). Against this backdrop, the 2013 edition of
the National Policy on Education provides a structure for the education system which starts with
Expanding and improving comprehensive early childhood care and education, especially for the most vulnerable
and disadvantaged children.
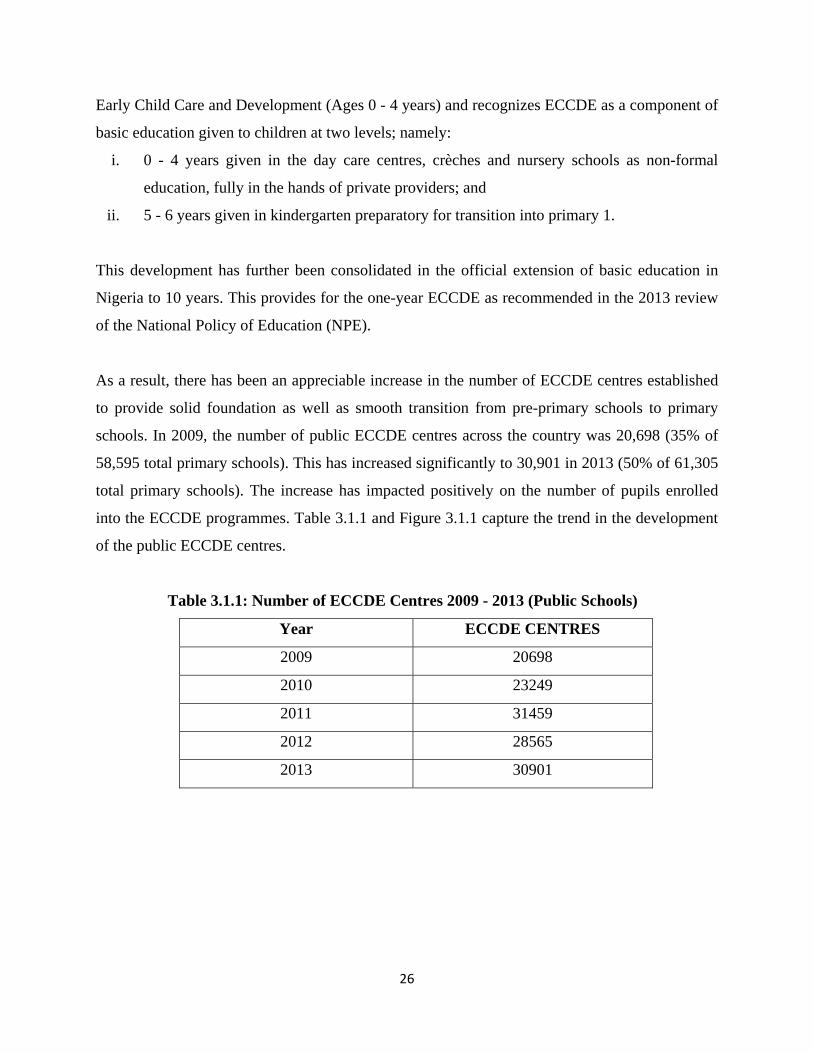
26
Early Child Care and Development (Ages 0 - 4 years) and recognizes ECCDE as a component of
basic education given to children at two levels; namely:
i. 0 - 4 years given in the day care centres, crèches and nursery schools as non-formal
education, fully in the hands of private providers; and
ii. 5 - 6 years given in kindergarten preparatory for transition into primary 1.
This development has further been consolidated in the official extension of basic education in
Nigeria to 10 years. This provides for the one-year ECCDE as recommended in the 2013 review
of the National Policy of Education (NPE).
As a result, there has been an appreciable increase in the number of ECCDE centres established
to provide solid foundation as well as smooth transition from pre-primary schools to primary
schools. In 2009, the number of public ECCDE centres across the country was 20,698 (35% of
58,595 total primary schools). This has increased significantly to 30,901 in 2013 (50% of 61,305
total primary schools). The increase has impacted positively on the number of pupils enrolled
into the ECCDE programmes. Table 3.1.1 and Figure 3.1.1 capture the trend in the development
of the public ECCDE centres.
Table 3.1.1: Number of ECCDE Centres 2009 - 2013 (Public Schools)
Year ECCDE CENTRES
2009 20698
2010 23249
2011 31459
2012 28565
2013 30901
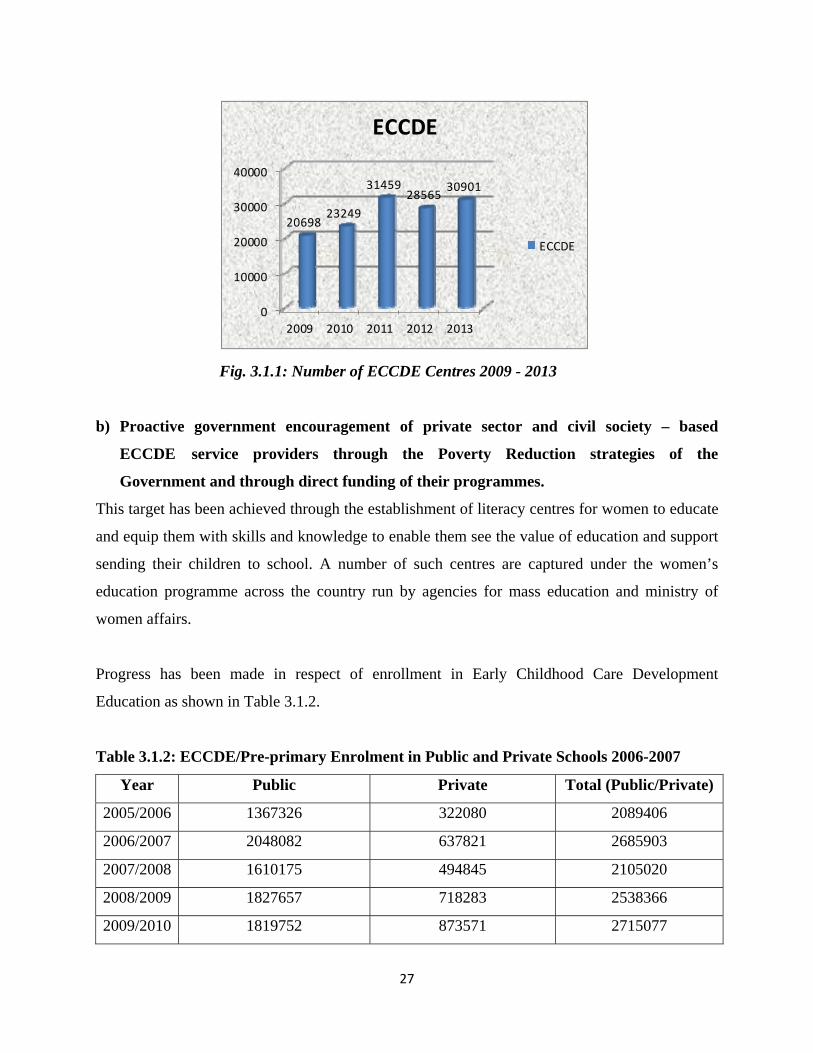
27
Fig. 3.1.1: Number of ECCDE Centres 2009 - 2013
b) Proactive government encouragement of private sector and civil society – based
ECCDE service providers through the Poverty Reduction strategies of the
Government and through direct funding of their programmes.
This target has been achieved through the establishment of literacy centres for women to educate
and equip them with skills and knowledge to enable them see the value of education and support
sending their children to school. A number of such centres are captured under the women’s
education programme across the country run by agencies for mass education and ministry of
women affairs.
Progress has been made in respect of enrollment in Early Childhood Care Development
Education as shown in Table 3.1.2.
Table 3.1.2: ECCDE/Pre-primary Enrolment in Public and Private Schools 2006-2007
Year Public Private Total (Public/Private)
2005/2006 1367326 322080 2089406
2006/2007 2048082 637821 2685903
2007/2008 1610175 494845 2105020
2008/2009 1827657 718283 2538366
2009/2010 1819752 873571 2715077
0
10000
20000
30000
40000
2009 2010 2011 2012 2013
2069823249
3145928565
30901
ECCDE
ECCDE
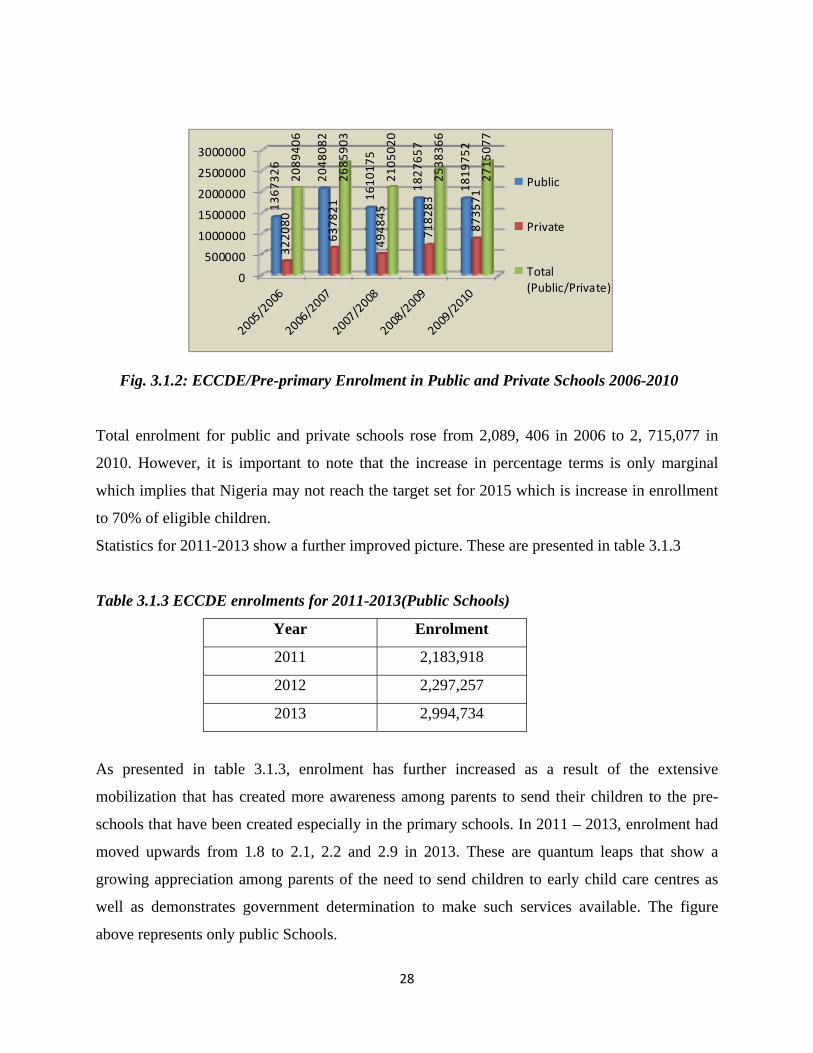
28
Fig. 3.1.2: ECCDE/Pre-primary Enrolment in Public and Private Schools 2006-2010
Total enrolment for public and private schools rose from 2,089, 406 in 2006 to 2, 715,077 in
2010. However, it is important to note that the increase in percentage terms is only marginal
which implies that Nigeria may not reach the target set for 2015 which is increase in enrollment
to 70% of eligible children.
Statistics for 2011-2013 show a further improved picture. These are presented in table 3.1.3
Table 3.1.3 ECCDE enrolments for 2011-2013(Public Schools)
Year Enrolment
2011 2,183,918
2012 2,297,257
2013 2,994,734
As presented in table 3.1.3, enrolment has further increased as a result of the extensive
mobilization that has created more awareness among parents to send their children to the pre-
schools that have been created especially in the primary schools. In 2011 – 2013, enrolment had
moved upwards from 1.8 to 2.1, 2.2 and 2.9 in 2013. These are quantum leaps that show a
growing appreciation among parents of the need to send children to early child care centres as
well as demonstrates government determination to make such services available. The figure
above represents only public Schools.
0
500000
1000000
1500000
2000000
2500000
3000000
1367326
2048082
1610175
1827657
1819752
322080
637821
494845
718283
873571
2089406
2685903
2105020
2538366
2715077
Public
Private
Total(Public/Private)
29
c) Investment in training, especially in the provision and update on training leading to the
Nigerian Certificate of Education (NCE) Pre -primary
To ensure that professionals eventually take over the running of ECCDE centres in the country,
Early Childhood Care and Education has been infused into the NCE curriculum, specially
developed by the National Commission for Colleges of Education for use in the training of
ECCDE teachers and care-givers in Nigeria. Consequent upon this development, the institutional
structure of most conventional Colleges of Education in Nigeria gives a pride of place to the
School of Early Childhood Care and Primary Education with two departments:
(i) Department of Early Childhood Care and Education, and
(ii) Department of Primary Education.
d) Funding in disadvantaged areas, to support the setting up of community – based
ECCDE centres and initiatives.
Five percent of the funds allocated to the Universal Basic Education Commission is made
available for the funding of ECCDE initiatives. Funds are also made available for capacity
building for care – givers.
The Nigerian Government has also shifted emphasis in the provision of infrastructural facilities
for ECCDE to disadvantaged areas and hard to reach Community – based Childhood Care
(CBCC) which were established in five pilot states; namely, Niger, Bauchi, Ekiti, Rivers and
Osun. Two communities in each of the States benefitted from the CBCC infrastructural provision
project.
e) Early Childhood Care Development and Education (ECCDE) in Nomadic School
ECCD Services have been established for the hard to reach communities such as the Nomads and
Migrant fishermen. Against this backdrop, the National Commission for Nomadic Education
embarked on advocacy, sensitization and mobilization on access to ECD for nomads. The
outcome is the appreciable increase by almost 50% of ECD – institutionalized Nomadic Schools.
The Commission in partnership with the Pastoral Resolve (PARE), Pastoralist Development
Initiative (PDI) and Organisation Mondiale Education Lé Prescolaire (World Organisation for
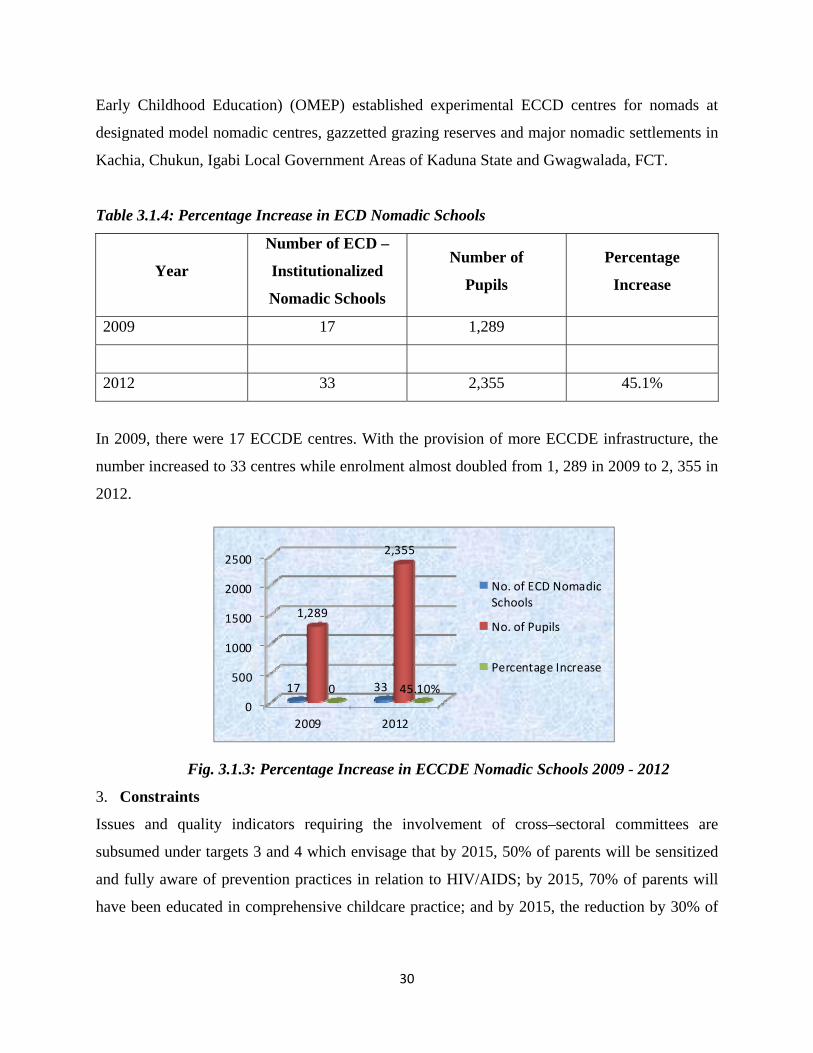
30
Early Childhood Education) (OMEP) established experimental ECCD centres for nomads at
designated model nomadic centres, gazzetted grazing reserves and major nomadic settlements in
Kachia, Chukun, Igabi Local Government Areas of Kaduna State and Gwagwalada, FCT.
Table 3.1.4: Percentage Increase in ECD Nomadic Schools
Year
Number of ECD –
Institutionalized
Nomadic Schools
Number of
Pupils
Percentage
Increase
2009 17 1,289
2012 33 2,355 45.1%
In 2009, there were 17 ECCDE centres. With the provision of more ECCDE infrastructure, the
number increased to 33 centres while enrolment almost doubled from 1, 289 in 2009 to 2, 355 in
2012.
Fig. 3.1.3: Percentage Increase in ECCDE Nomadic Schools 2009 - 2012
3. Constraints
Issues and quality indicators requiring the involvement of cross–sectoral committees are
subsumed under targets 3 and 4 which envisage that by 2015, 50% of parents will be sensitized
and fully aware of prevention practices in relation to HIV/AIDS; by 2015, 70% of parents will
have been educated in comprehensive childcare practice; and by 2015, the reduction by 30% of
0
500
1000
1500
2000
2500
2009 2012
17 33
1,289
2,355
0 45.10%
No. of ECD NomadicSchools
No. of Pupils
Percentage Increase
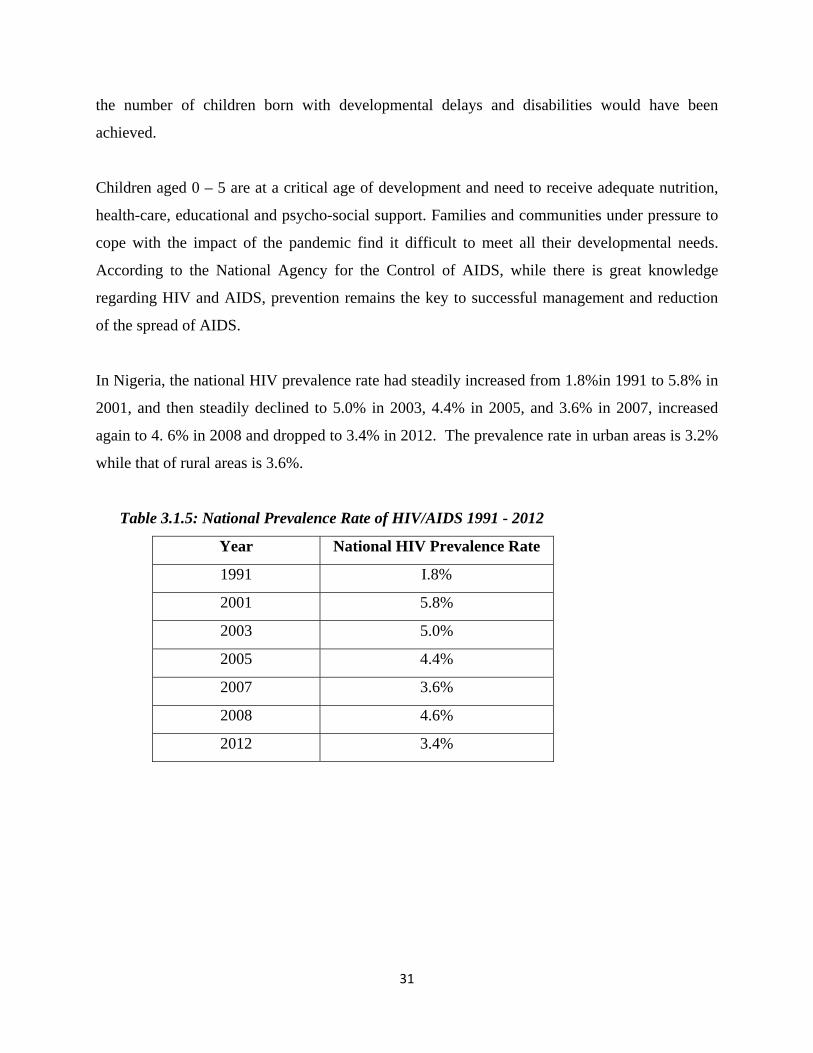
31
the number of children born with developmental delays and disabilities would have been
achieved.
Children aged 0 – 5 are at a critical age of development and need to receive adequate nutrition,
health-care, educational and psycho-social support. Families and communities under pressure to
cope with the impact of the pandemic find it difficult to meet all their developmental needs.
According to the National Agency for the Control of AIDS, while there is great knowledge
regarding HIV and AIDS, prevention remains the key to successful management and reduction
of the spread of AIDS.
In Nigeria, the national HIV prevalence rate had steadily increased from 1.8%in 1991 to 5.8% in
2001, and then steadily declined to 5.0% in 2003, 4.4% in 2005, and 3.6% in 2007, increased
again to 4. 6% in 2008 and dropped to 3.4% in 2012. The prevalence rate in urban areas is 3.2%
while that of rural areas is 3.6%.
Table 3.1.5: National Prevalence Rate of HIV/AIDS 1991 - 2012
Year National HIV Prevalence Rate
1991 I.8%
2001 5.8%
2003 5.0%
2005 4.4%
2007 3.6%
2008 4.6%
2012 3.4%
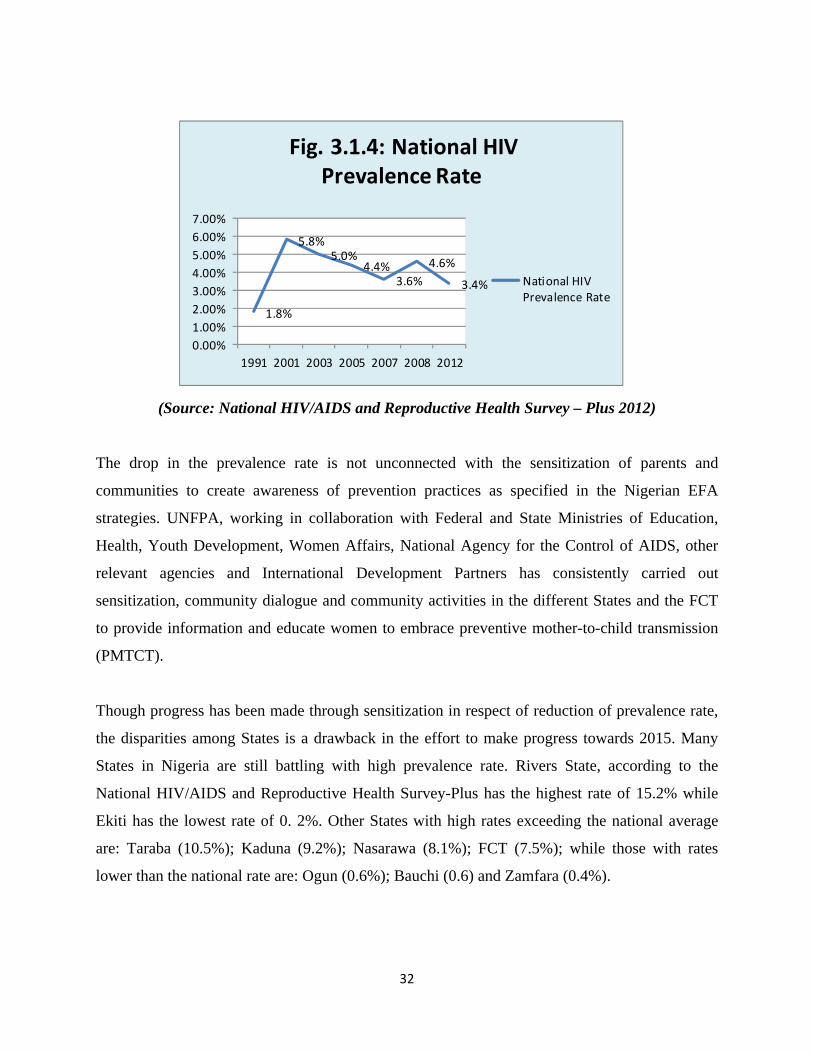
32
(Source: National HIV/AIDS and Reproductive Health Survey – Plus 2012)
The drop in the prevalence rate is not unconnected with the sensitization of parents and
communities to create awareness of prevention practices as specified in the Nigerian EFA
strategies. UNFPA, working in collaboration with Federal and State Ministries of Education,
Health, Youth Development, Women Affairs, National Agency for the Control of AIDS, other
relevant agencies and International Development Partners has consistently carried out
sensitization, community dialogue and community activities in the different States and the FCT
to provide information and educate women to embrace preventive mother-to-child transmission
(PMTCT).
Though progress has been made through sensitization in respect of reduction of prevalence rate,
the disparities among States is a drawback in the effort to make progress towards 2015. Many
States in Nigeria are still battling with high prevalence rate. Rivers State, according to the
National HIV/AIDS and Reproductive Health Survey-Plus has the highest rate of 15.2% while
Ekiti has the lowest rate of 0. 2%. Other States with high rates exceeding the national average
are: Taraba (10.5%); Kaduna (9.2%); Nasarawa (8.1%); FCT (7.5%); while those with rates
lower than the national rate are: Ogun (0.6%); Bauchi (0.6) and Zamfara (0.4%).
1.8%
5.8%5.0%
4.4%3.6%
4.6%
3.4%
0.00%
1.00%
2.00%
3.00%
4.00%
5.00%
6.00%
7.00%
1991 2001 2003 2005 2007 2008 2012
Fig. 3.1.4: National HIV Prevalence Rate
National HIVPrevalence Rate
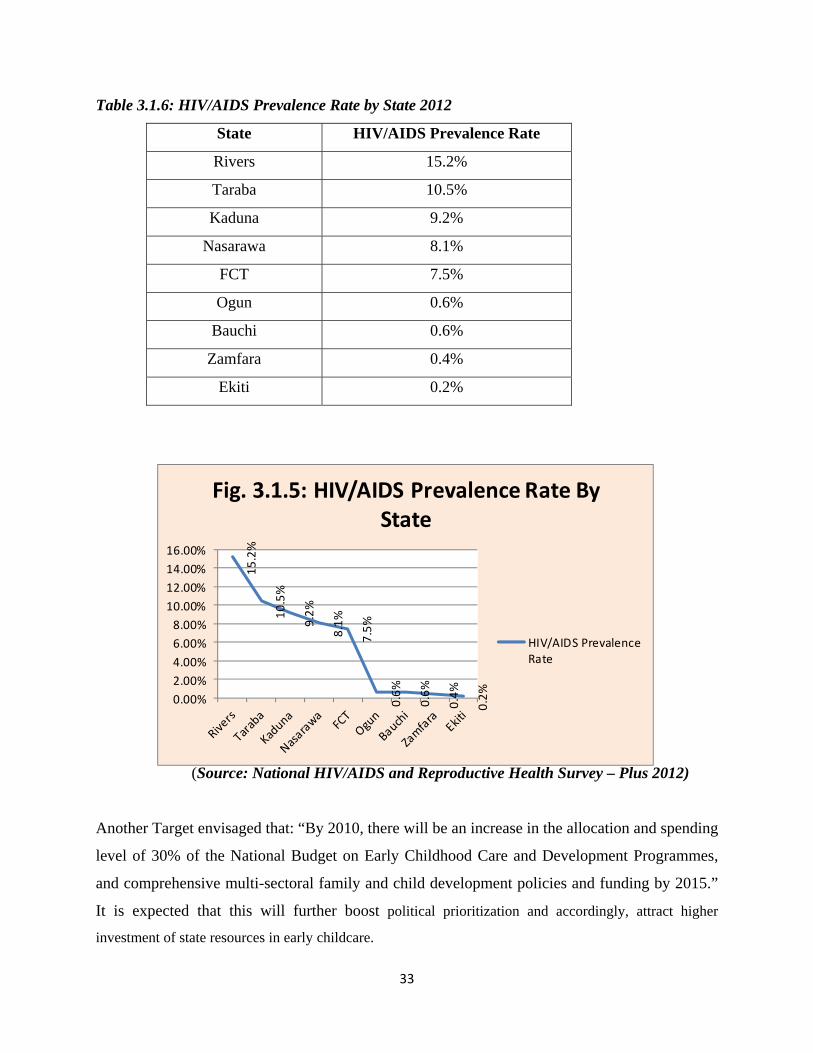
33
Table 3.1.6: HIV/AIDS Prevalence Rate by State 2012
State HIV/AIDS Prevalence Rate
Rivers 15.2%
Taraba 10.5%
Kaduna 9.2%
Nasarawa 8.1%
FCT 7.5%
Ogun 0.6%
Bauchi 0.6%
Zamfara 0.4%
Ekiti 0.2%
(Source: National HIV/AIDS and Reproductive Health Survey – Plus 2012)
Another Target envisaged that: “By 2010, there will be an increase in the allocation and spending
level of 30% of the National Budget on Early Childhood Care and Development Programmes,
and comprehensive multi-sectoral family and child development policies and funding by 2015.”
It is expected that this will further boost political prioritization and accordingly, attract higher
investment of state resources in early childcare.
15.2%
10.5%
9.2%
8.1%
7.5%
0.6%
0.6%
0.4%
0.2%
0.00%
2.00%
4.00%
6.00%
8.00%
10.00%
12.00%
14.00%
16.00%
Fig. 3.1.5: HIV/AIDS Prevalence Rate By State
HIV/AIDS PrevalenceRate
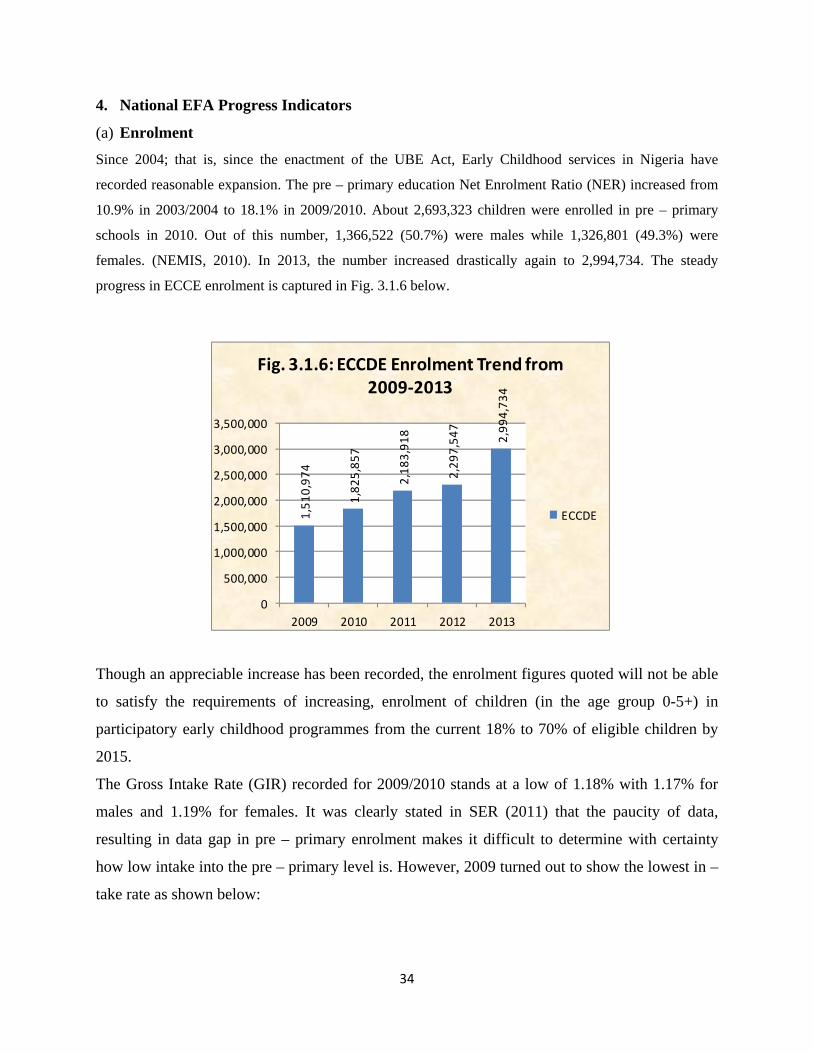
34
4. National EFA Progress Indicators
(a) Enrolment
Since 2004; that is, since the enactment of the UBE Act, Early Childhood services in Nigeria have
recorded reasonable expansion. The pre – primary education Net Enrolment Ratio (NER) increased from
10.9% in 2003/2004 to 18.1% in 2009/2010. About 2,693,323 children were enrolled in pre – primary
schools in 2010. Out of this number, 1,366,522 (50.7%) were males while 1,326,801 (49.3%) were
females. (NEMIS, 2010). In 2013, the number increased drastically again to 2,994,734. The steady
progress in ECCE enrolment is captured in Fig. 3.1.6 below.
Though an appreciable increase has been recorded, the enrolment figures quoted will not be able
to satisfy the requirements of increasing, enrolment of children (in the age group 0-5+) in
participatory early childhood programmes from the current 18% to 70% of eligible children by
2015.
The Gross Intake Rate (GIR) recorded for 2009/2010 stands at a low of 1.18% with 1.17% for
males and 1.19% for females. It was clearly stated in SER (2011) that the paucity of data,
resulting in data gap in pre – primary enrolment makes it difficult to determine with certainty
how low intake into the pre – primary level is. However, 2009 turned out to show the lowest in –
take rate as shown below:
1,510,974
1,825,857
2,183,918
2,297,547
2,994,734
0
500,000
1,000,000
1,500,000
2,000,000
2,500,000
3,000,000
3,500,000
2009 2010 2011 2012 2013
Fig. 3.1.6: ECCDE Enrolment Trend from 2009‐2013
ECCDE
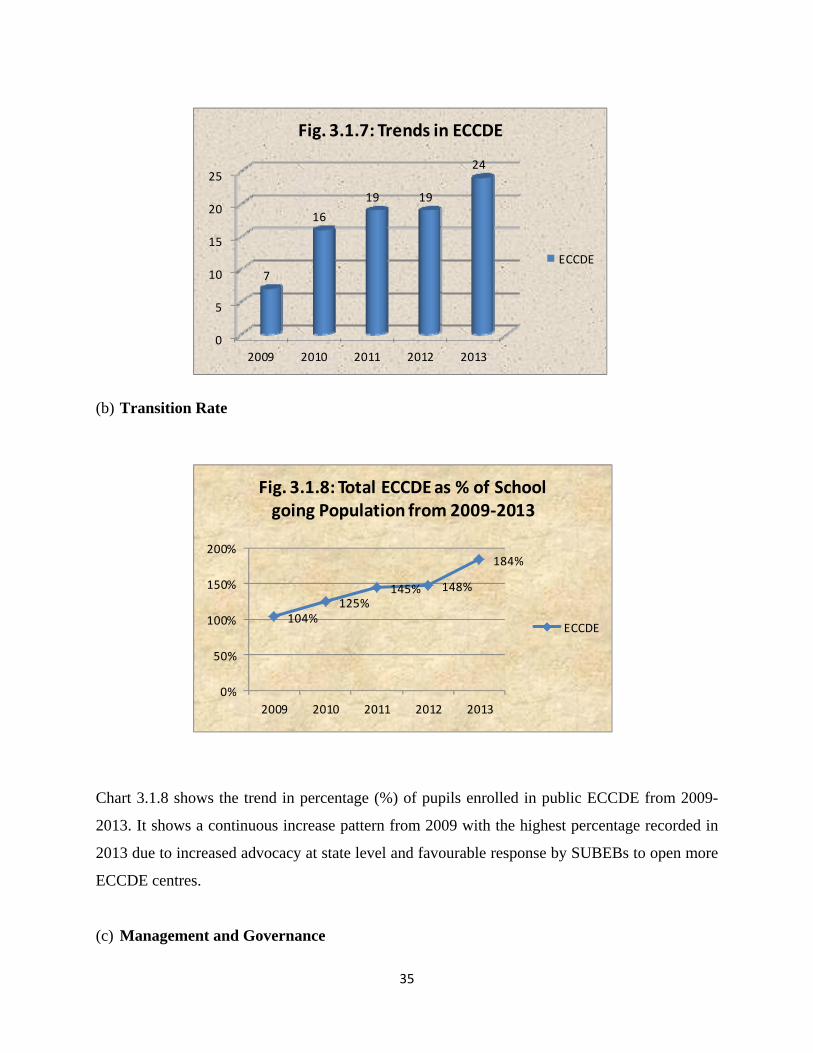
35
(b) Transition Rate
Chart 3.1.8 shows the trend in percentage (%) of pupils enrolled in public ECCDE from 2009-
2013. It shows a continuous increase pattern from 2009 with the highest percentage recorded in
2013 due to increased advocacy at state level and favourable response by SUBEBs to open more
ECCDE centres.
(c) Management and Governance
0
5
10
15
20
25
2009 2010 2011 2012 2013
7
16
19 19
24
Fig. 3.1.7: Trends in ECCDE
ECCDE
104%125%
145% 148%
184%
0%
50%
100%
150%
200%
2009 2010 2011 2012 2013
Fig. 3.1.8: Total ECCDE as % of School going Population from 2009‐2013
ECCDE
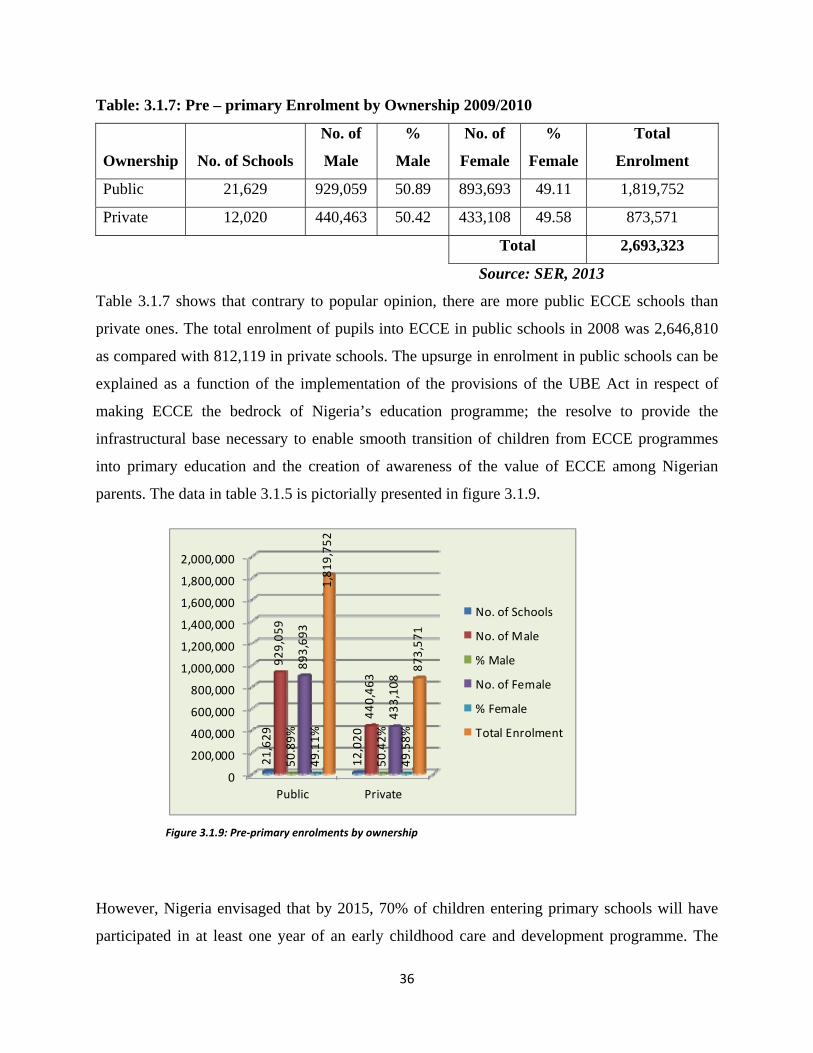
36
Table: 3.1.7: Pre – primary Enrolment by Ownership 2009/2010
Ownership
No. of Schools
No. of
Male
%
Male
No. of
Female
%
Female
Total
Enrolment
Public 21,629 929,059 50.89 893,693 49.11 1,819,752
Private 12,020 440,463 50.42 433,108 49.58 873,571
Total 2,693,323
Source: SER, 2013
Table 3.1.7 shows that contrary to popular opinion, there are more public ECCE schools than
private ones. The total enrolment of pupils into ECCE in public schools in 2008 was 2,646,810
as compared with 812,119 in private schools. The upsurge in enrolment in public schools can be
explained as a function of the implementation of the provisions of the UBE Act in respect of
making ECCE the bedrock of Nigeria’s education programme; the resolve to provide the
infrastructural base necessary to enable smooth transition of children from ECCE programmes
into primary education and the creation of awareness of the value of ECCE among Nigerian
parents. The data in table 3.1.5 is pictorially presented in figure 3.1.9.
However, Nigeria envisaged that by 2015, 70% of children entering primary schools will have
participated in at least one year of an early childhood care and development programme. The
0
200,000
400,000
600,000
800,000
1,000,000
1,200,000
1,400,000
1,600,000
1,800,000
2,000,000
Public Private
21,629
12,020
929,059
440,463
50.89%
50.42%
893,693
433,108
49.11%
49.58%
1,819,752
873,571
No. of Schools
No. of Male
% Male
No. of Female
% Female
Total Enrolment
Figure 3.1.9: Pre‐primary enrolments by ownership
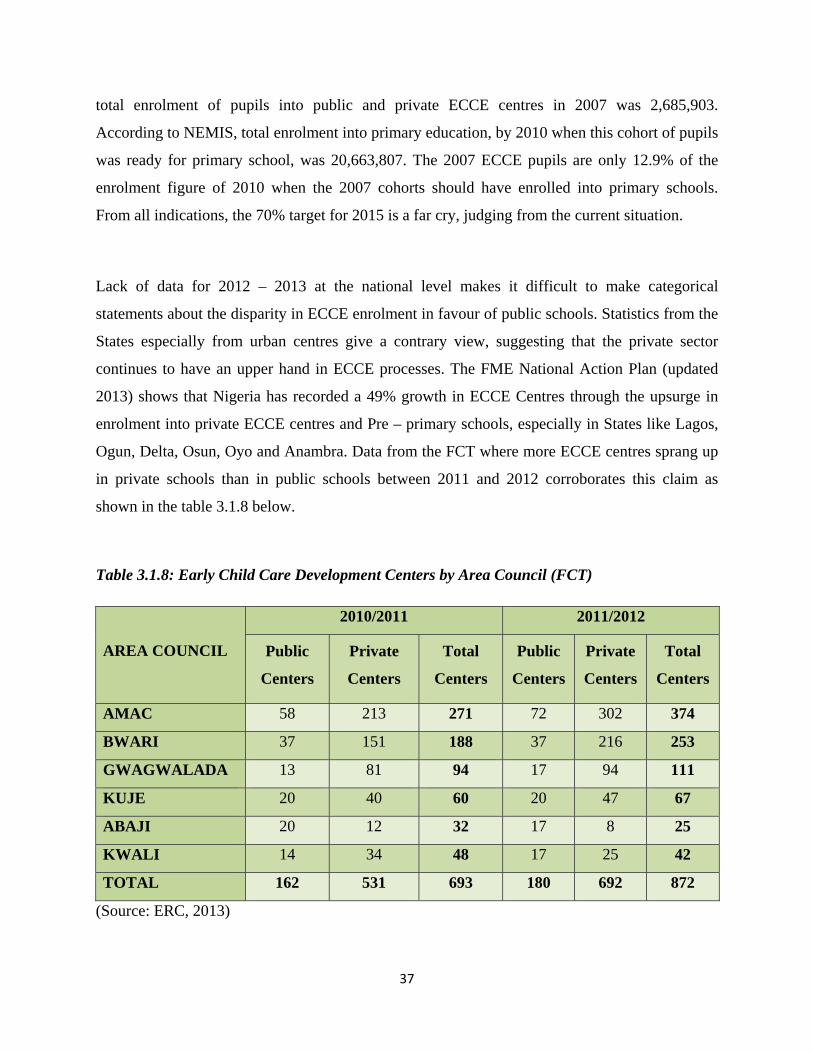
37
total enrolment of pupils into public and private ECCE centres in 2007 was 2,685,903.
According to NEMIS, total enrolment into primary education, by 2010 when this cohort of pupils
was ready for primary school, was 20,663,807. The 2007 ECCE pupils are only 12.9% of the
enrolment figure of 2010 when the 2007 cohorts should have enrolled into primary schools.
From all indications, the 70% target for 2015 is a far cry, judging from the current situation.
Lack of data for 2012 – 2013 at the national level makes it difficult to make categorical
statements about the disparity in ECCE enrolment in favour of public schools. Statistics from the
States especially from urban centres give a contrary view, suggesting that the private sector
continues to have an upper hand in ECCE processes. The FME National Action Plan (updated
2013) shows that Nigeria has recorded a 49% growth in ECCE Centres through the upsurge in
enrolment into private ECCE centres and Pre – primary schools, especially in States like Lagos,
Ogun, Delta, Osun, Oyo and Anambra. Data from the FCT where more ECCE centres sprang up
in private schools than in public schools between 2011 and 2012 corroborates this claim as
shown in the table 3.1.8 below.
Table 3.1.8: Early Child Care Development Centers by Area Council (FCT)
AREA COUNCIL
2010/2011 2011/2012
Public
Centers
Private
Centers
Total
Centers
Public
Centers
Private
Centers
Total
Centers
AMAC 58 213 271 72 302 374
BWARI 37 151 188 37 216 253
GWAGWALADA 13 81 94 17 94 111
KUJE 20 40 60 20 47 67
ABAJI 20 12 32 17 8 25
KWALI 14 34 48 17 25 42
TOTAL 162 531 693 180 692 872
(Source: ERC, 2013)
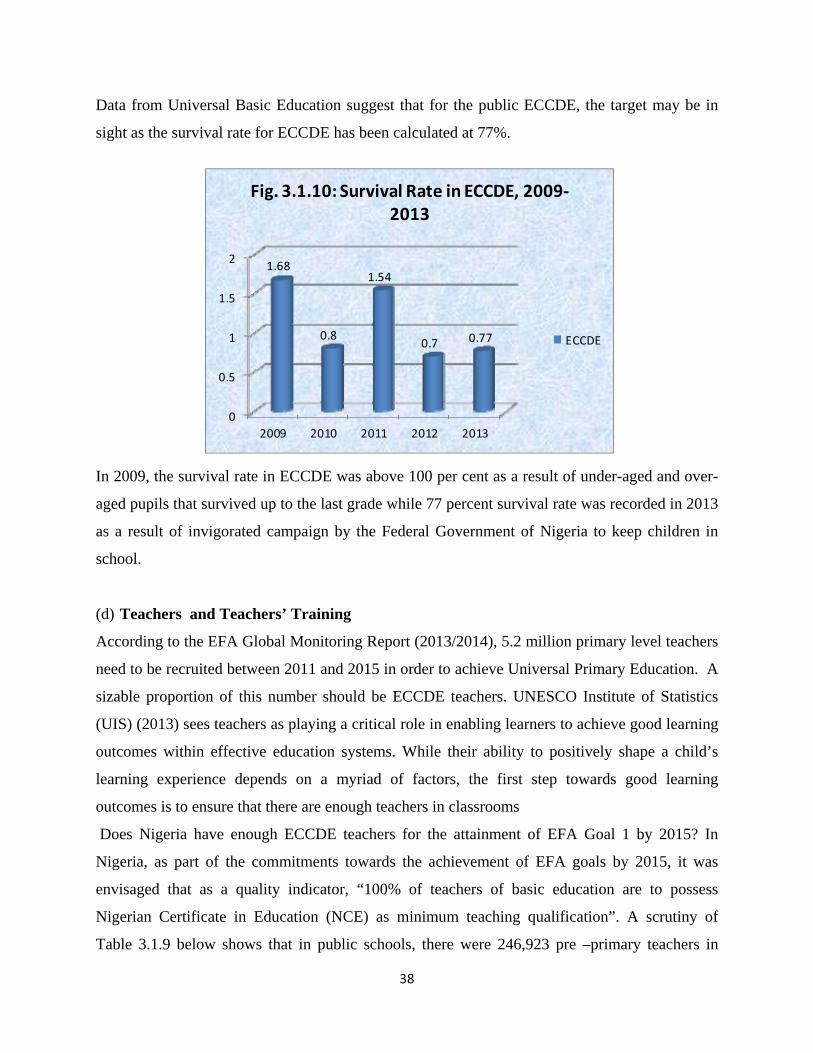
38
Data from Universal Basic Education suggest that for the public ECCDE, the target may be in
sight as the survival rate for ECCDE has been calculated at 77%.
In 2009, the survival rate in ECCDE was above 100 per cent as a result of under-aged and over-
aged pupils that survived up to the last grade while 77 percent survival rate was recorded in 2013
as a result of invigorated campaign by the Federal Government of Nigeria to keep children in
school.
(d) Teachers and Teachers’ Training
According to the EFA Global Monitoring Report (2013/2014), 5.2 million primary level teachers
need to be recruited between 2011 and 2015 in order to achieve Universal Primary Education. A
sizable proportion of this number should be ECCDE teachers. UNESCO Institute of Statistics
(UIS) (2013) sees teachers as playing a critical role in enabling learners to achieve good learning
outcomes within effective education systems. While their ability to positively shape a child’s
learning experience depends on a myriad of factors, the first step towards good learning
outcomes is to ensure that there are enough teachers in classrooms
Does Nigeria have enough ECCDE teachers for the attainment of EFA Goal 1 by 2015? In
Nigeria, as part of the commitments towards the achievement of EFA goals by 2015, it was
envisaged that as a quality indicator, “100% of teachers of basic education are to possess
Nigerian Certificate in Education (NCE) as minimum teaching qualification”. A scrutiny of
Table 3.1.9 below shows that in public schools, there were 246,923 pre –primary teachers in
0
0.5
1
1.5
2
2009 2010 2011 2012 2013
1.68
0.8
1.54
0.7 0.77
Fig. 3.1.10: Survival Rate in ECCDE, 2009‐2013
ECCDE
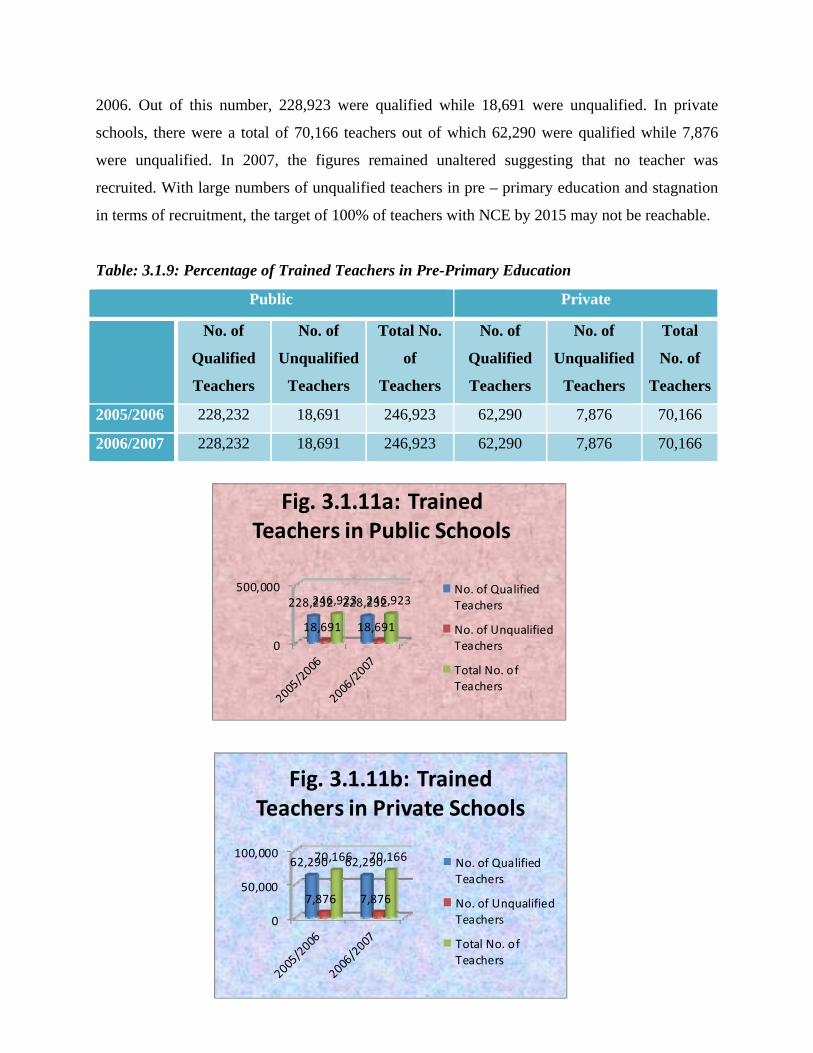
39
2006. Out of this number, 228,923 were qualified while 18,691 were unqualified. In private
schools, there were a total of 70,166 teachers out of which 62,290 were qualified while 7,876
were unqualified. In 2007, the figures remained unaltered suggesting that no teacher was
recruited. With large numbers of unqualified teachers in pre – primary education and stagnation
in terms of recruitment, the target of 100% of teachers with NCE by 2015 may not be reachable.
Table: 3.1.9: Percentage of Trained Teachers in Pre-Primary Education
Public Private
No. of
Qualified
Teachers
No. of
Unqualified
Teachers
Total No.
of
Teachers
No. of
Qualified
Teachers
No. of
Unqualified
Teachers
Total
No. of
Teachers
2005/2006 228,232 18,691 246,923 62,290 7,876 70,166
2006/2007 228,232 18,691 246,923 62,290 7,876 70,166
0
500,000228,232 228,232
18,691 18,691
246,923 246,923
Fig. 3.1.11a: Trained Teachers in Public Schools
No. of QualifiedTeachers
No. of UnqualifiedTeachers
Total No. ofTeachers
0
50,000
100,00062,290 62,290
7,876 7,876
70,166 70,166
Fig. 3.1.11b: Trained Teachers in Private Schools
No. of QualifiedTeachers
No. of UnqualifiedTeachers
Total No. ofTeachers
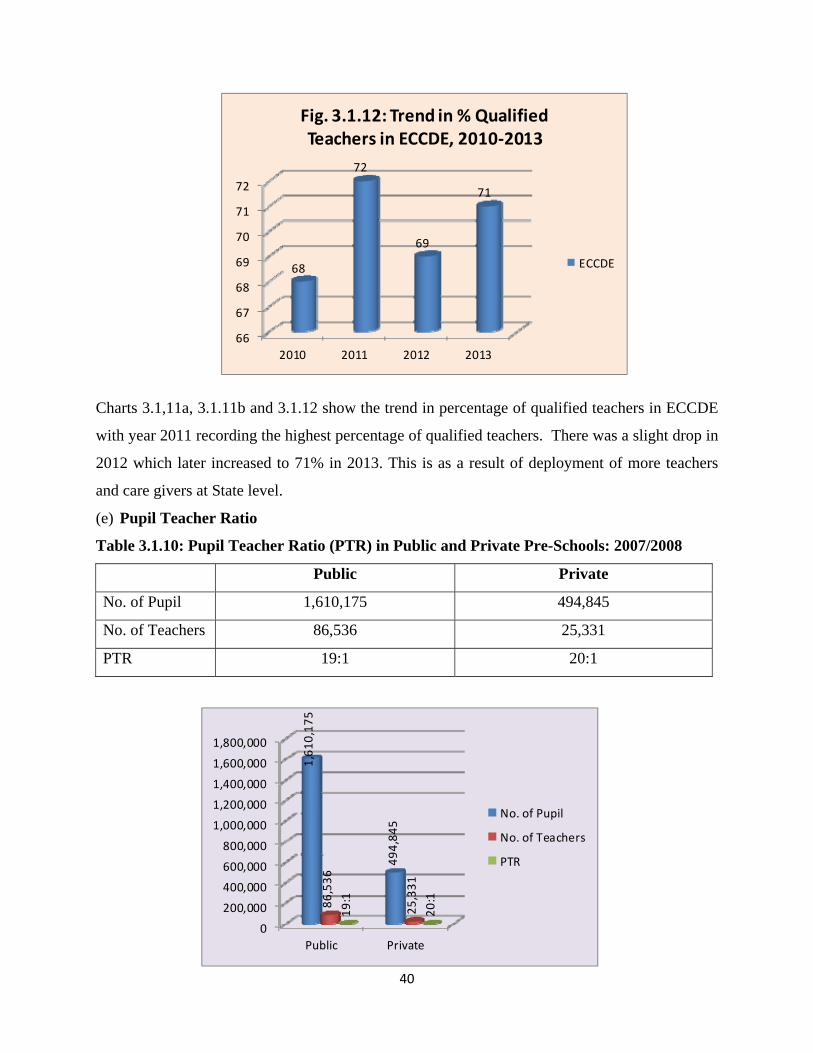
40
Charts 3.1,11a, 3.1.11b and 3.1.12 show the trend in percentage of qualified teachers in ECCDE
with year 2011 recording the highest percentage of qualified teachers. There was a slight drop in
2012 which later increased to 71% in 2013. This is as a result of deployment of more teachers
and care givers at State level.
(e) Pupil Teacher Ratio
Table 3.1.10: Pupil Teacher Ratio (PTR) in Public and Private Pre-Schools: 2007/2008
Public Private
No. of Pupil 1,610,175 494,845
No. of Teachers 86,536 25,331
PTR 19:1 20:1
0
200,000
400,000
600,000
800,000
1,000,000
1,200,000
1,400,000
1,600,000
1,800,000
Public Private
1,610,175
494,845
86,536
25,331
19:1
20:1
No. of Pupil
No. of Teachers
PTR
66
67
68
69
70
71
72
2010 2011 2012 2013
68
72
69
71
Fig. 3.1.12: Trend in % Qualified Teachers in ECCDE, 2010‐2013
ECCDE
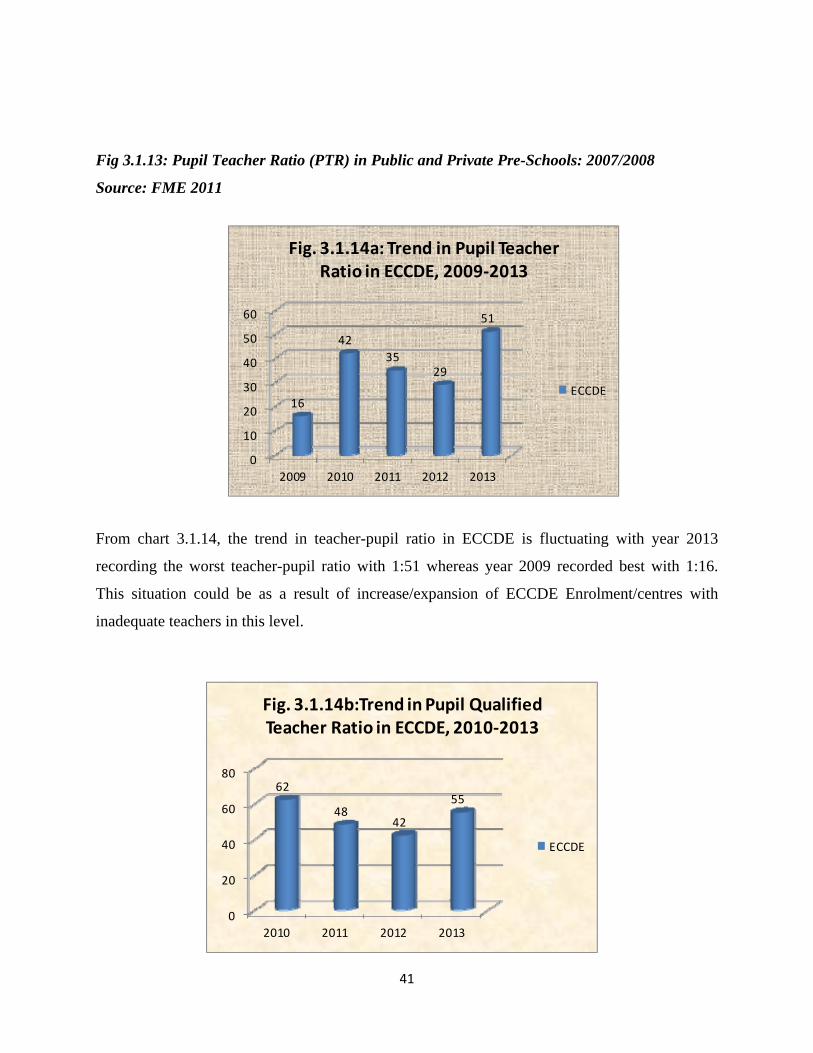
41
Fig 3.1.13: Pupil Teacher Ratio (PTR) in Public and Private Pre-Schools: 2007/2008
Source: FME 2011
From chart 3.1.14, the trend in teacher-pupil ratio in ECCDE is fluctuating with year 2013
recording the worst teacher-pupil ratio with 1:51 whereas year 2009 recorded best with 1:16.
This situation could be as a result of increase/expansion of ECCDE Enrolment/centres with
inadequate teachers in this level.
0
10
20
30
40
50
60
2009 2010 2011 2012 2013
16
42
3529
51
Fig. 3.1.14a: Trend in Pupil Teacher Ratio in ECCDE, 2009‐2013
ECCDE
0
20
40
60
80
2010 2011 2012 2013
62
4842
55
Fig. 3.1.14b:Trend in Pupil Qualified Teacher Ratio in ECCDE, 2010‐2013
ECCDE
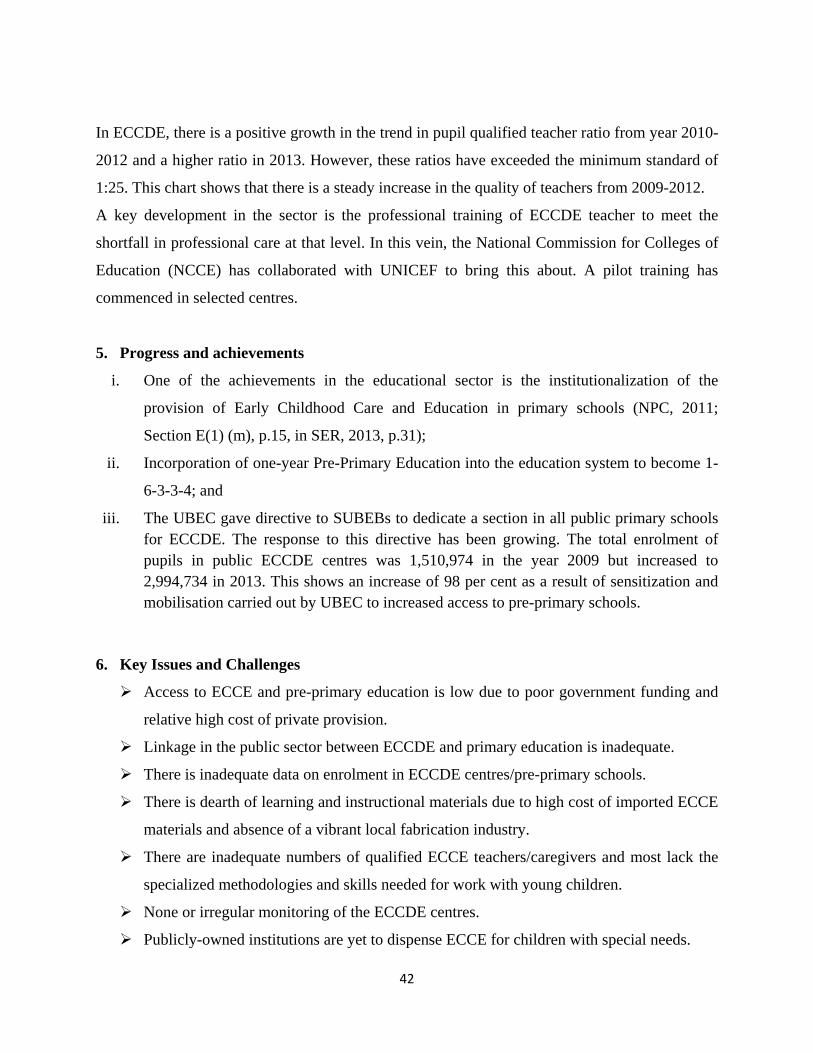
42
In ECCDE, there is a positive growth in the trend in pupil qualified teacher ratio from year 2010-
2012 and a higher ratio in 2013. However, these ratios have exceeded the minimum standard of
1:25. This chart shows that there is a steady increase in the quality of teachers from 2009-2012.
A key development in the sector is the professional training of ECCDE teacher to meet the
shortfall in professional care at that level. In this vein, the National Commission for Colleges of
Education (NCCE) has collaborated with UNICEF to bring this about. A pilot training has
commenced in selected centres.
5. Progress and achievements
i. One of the achievements in the educational sector is the institutionalization of the
provision of Early Childhood Care and Education in primary schools (NPC, 2011;
Section E(1) (m), p.15, in SER, 2013, p.31);
ii. Incorporation of one-year Pre-Primary Education into the education system to become 1-
6-3-3-4; and
iii. The UBEC gave directive to SUBEBs to dedicate a section in all public primary schools for ECCDE. The response to this directive has been growing. The total enrolment of pupils in public ECCDE centres was 1,510,974 in the year 2009 but increased to 2,994,734 in 2013. This shows an increase of 98 per cent as a result of sensitization and mobilisation carried out by UBEC to increased access to pre-primary schools.
6. Key Issues and Challenges
Access to ECCE and pre-primary education is low due to poor government funding and
relative high cost of private provision.
Linkage in the public sector between ECCDE and primary education is inadequate.
There is inadequate data on enrolment in ECCDE centres/pre-primary schools.
There is dearth of learning and instructional materials due to high cost of imported ECCE
materials and absence of a vibrant local fabrication industry.
There are inadequate numbers of qualified ECCE teachers/caregivers and most lack the
specialized methodologies and skills needed for work with young children.
None or irregular monitoring of the ECCDE centres.
Publicly-owned institutions are yet to dispense ECCE for children with special needs.
43
Lack of synergy among the line Ministries and Agencies involved in the implementation
of the ECD Policy.
Low level of awareness of the policy on ECCDE among ECCDE policy/decision makers
and practitioners.
Inadequate sensitization/advocacy on ECCDE.
Most public schools are yet to comply with UBEC directive of establishing ECCDE in
their schools.
Poor commitment on the part of the state government to access UBEC intervention fund.
Lack of data for 2012- 2013 at the national level makes it difficult to make categorical
statements about the disparity in ECCE enrolment in favour of public school.
7. Conclusion
Early childhood care, education and development is critical to the provision of quality basic
education. Although government and stakeholders recognize the critical importance of this
component of basic education, it is yet to receive the kind of attention that recognition demands.
All the policy statements that are needed to back up an efficient and robust implementation have
been put in place. Political will and the appropriate strategies are needed drive implementation.
44
Ensuring that by 2015 all children, particularly girls, children in difficult circumstances and those belonging to ethnic
minorities, have access to and complete, free and compulsory primary education of
good quality.
3.2 – Universalizing Primary/Basic Education
GOAL 2
1. Introduction
“The enactment of the 2004 UBE Act gave birth to the Universal Basic Education Commission
(UBEC) and UBE program which serves as the Federal Government vehicle for achieving EFA
Goal 2 and MDGs Goal 2 of Universal Primary Education (UPE). The UBE Act has put in place
regulations to ensure orderly development of basic education in Nigeria as well as ensure that all
children of school age are enrolled, attend and complete basic education, which presently cover
seven (7) years universal primary education and three (3) years of junior secondary education
totaling ten (10) years uninterrupted basic education.
The Universal Basic Education programme in Nigeria has the following components:
(10-year) continuing education which is broken into three (3) components as follows (1-6-3):
i. Early Child Care Development Education (ECCDE) - 0 - 5 years
ii. Primary Education - 6 - 11 year
iii. Junior Secondary Education - 12-15 years
Basic education administration and management in Nigeria is the responsibility of Local
Education Authorities (LGEAs) under the supervision of State Universal Basic Education Boards
(SUBEBs) and the Universal Basic Education Commission (UBEC) at the federal level. Since
the launching of the UBE programme in 1999, reasonable progress has been made especially in
respect of children’s enrolment in schools.
There is free and compulsory basic education for all children of school going age.
45
Provision of mid-day meals in some States to enhance children’s access to retention and
completion of school cycle.
A parent who does not enroll his/her child/ward in school contravenes section 2 (2) of the
UBE Act, and therefore, commits an offence.
Children have a fundamental right to free primary schooling of good quality. This is to say that
EFA Goal 2 has access, equity and quality dimensions. Unfortunately, deep-rooted inequalities
linked to wealth, gender, ethnicity, language and location are still major barriers to universal
primary education. These reasons among others are responsible for the large number of out-of-
school children in the country. Notwithstanding the challenges, government has put in place
initiatives aimed at ensuring that out-of-school children get into school. Accordingly, the
Almajiri Education programme, the Girl Child Education programmes, in addition to other
projects targeted at other identified vulnerable groups, are well on course.
.
The UBE Commission operates as an intervention, coordinating and monitoring agency to
progressively improve the capacity of States, Local Government Agencies and Communities in
the provision of unfettered access to high quality basic education in Nigeria. In the actualization
of these responsibilities, Federal Government through the Universal Basic Education
Commission (UBEC) has put in huge investments in the areas of basic education access, quality
and equity. To ensure the realization of this noble mission, UBEC presents periodic progress
reports on the implementation of the universal basic education.
2. Progress according to EFA Targets and Strategies
The National Action Plan (NAP) set targets and strategies used to ensure that access to basic
education is achieved by 2015.
a) Post-Dakar Framework for Action: 1999 to 2005
According to the 2011 State of Education Report, government policy on basic education “is to
ensure a seamless transition from pre-primary to primary school level through its pre-primary
education programme”. The basic education component of the education system comprising
Early Childhood Care and Education, primary and junior secondary, remain the most significant
foundation years for effective participation in learning. Attention was focused on issues such as
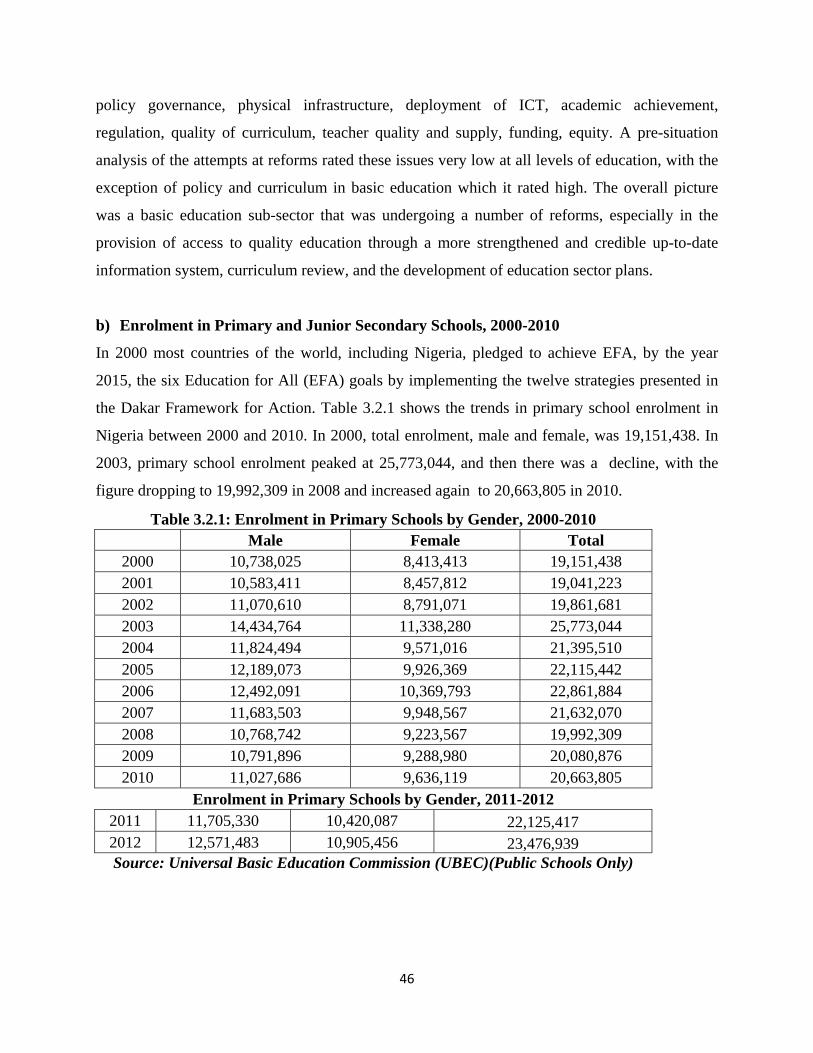
46
policy governance, physical infrastructure, deployment of ICT, academic achievement,
regulation, quality of curriculum, teacher quality and supply, funding, equity. A pre-situation
analysis of the attempts at reforms rated these issues very low at all levels of education, with the
exception of policy and curriculum in basic education which it rated high. The overall picture
was a basic education sub-sector that was undergoing a number of reforms, especially in the
provision of access to quality education through a more strengthened and credible up-to-date
information system, curriculum review, and the development of education sector plans.
b) Enrolment in Primary and Junior Secondary Schools, 2000-2010
In 2000 most countries of the world, including Nigeria, pledged to achieve EFA, by the year
2015, the six Education for All (EFA) goals by implementing the twelve strategies presented in
the Dakar Framework for Action. Table 3.2.1 shows the trends in primary school enrolment in
Nigeria between 2000 and 2010. In 2000, total enrolment, male and female, was 19,151,438. In
2003, primary school enrolment peaked at 25,773,044, and then there was a decline, with the
figure dropping to 19,992,309 in 2008 and increased again to 20,663,805 in 2010.
Table 3.2.1: Enrolment in Primary Schools by Gender, 2000-2010 Male Female Total
2000 10,738,025 8,413,413 19,151,438 2001 10,583,411 8,457,812 19,041,223 2002 11,070,610 8,791,071 19,861,681 2003 14,434,764 11,338,280 25,773,044 2004 11,824,494 9,571,016 21,395,510 2005 12,189,073 9,926,369 22,115,442 2006 12,492,091 10,369,793 22,861,884 2007 11,683,503 9,948,567 21,632,070 2008 10,768,742 9,223,567 19,992,309 2009 10,791,896 9,288,980 20,080,876 2010 11,027,686 9,636,119 20,663,805
Enrolment in Primary Schools by Gender, 2011-2012 2011 11,705,330 10,420,087 22,125,417 2012 12,571,483 10,905,456 23,476,939 Source: Universal Basic Education Commission (UBEC)(Public Schools Only)
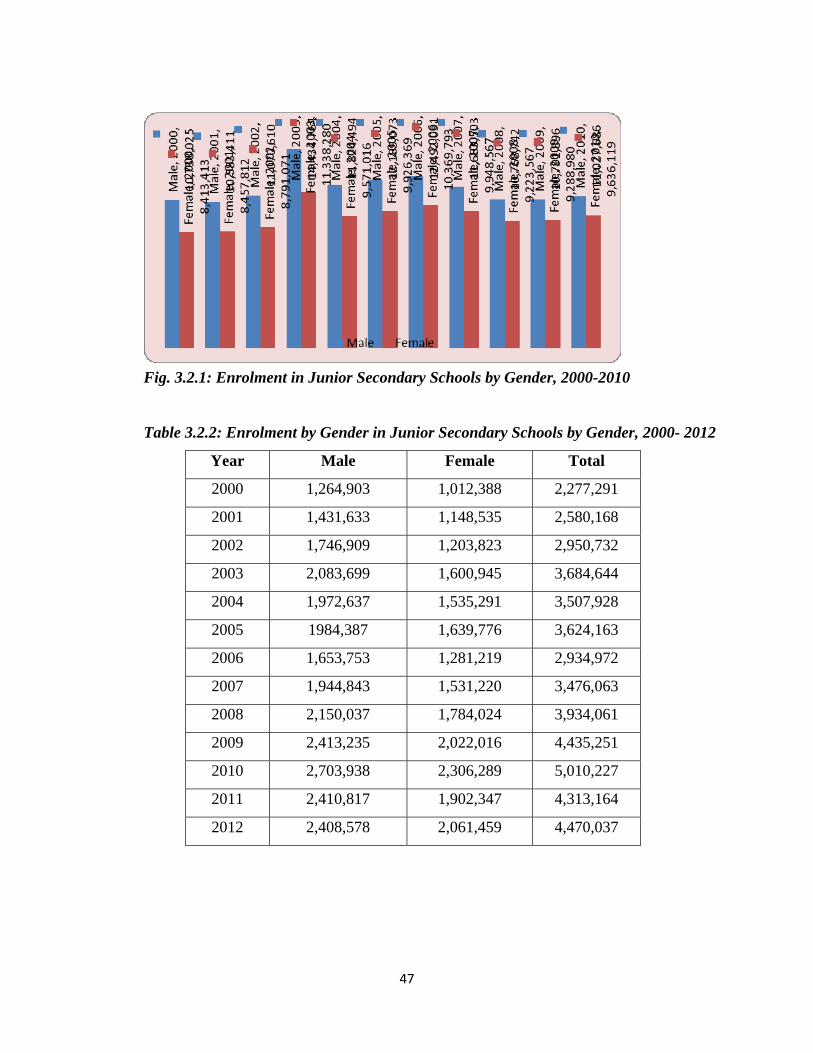
47
Fig. 3.2.1: Enrolment in Junior Secondary Schools by Gender, 2000-2010
Table 3.2.2: Enrolment by Gender in Junior Secondary Schools by Gender, 2000- 2012
Year Male Female Total
2000 1,264,903 1,012,388 2,277,291
2001 1,431,633 1,148,535 2,580,168
2002 1,746,909 1,203,823 2,950,732
2003 2,083,699 1,600,945 3,684,644
2004 1,972,637 1,535,291 3,507,928
2005 1984,387 1,639,776 3,624,163
2006 1,653,753 1,281,219 2,934,972
2007 1,944,843 1,531,220 3,476,063
2008 2,150,037 1,784,024 3,934,061
2009 2,413,235 2,022,016 4,435,251
2010 2,703,938 2,306,289 5,010,227
2011 2,410,817 1,902,347 4,313,164
2012 2,408,578 2,061,459 4,470,037
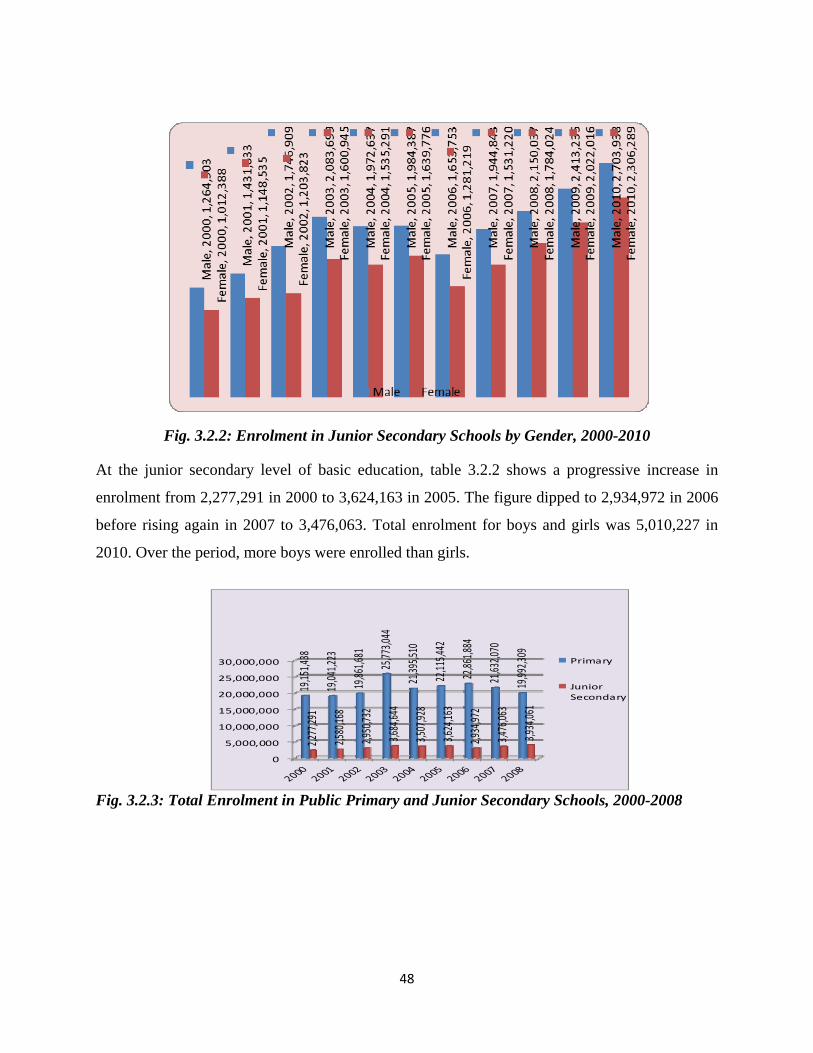
48
Fig. 3.2.2: Enrolment in Junior Secondary Schools by Gender, 2000-2010
At the junior secondary level of basic education, table 3.2.2 shows a progressive increase in
enrolment from 2,277,291 in 2000 to 3,624,163 in 2005. The figure dipped to 2,934,972 in 2006
before rising again in 2007 to 3,476,063. Total enrolment for boys and girls was 5,010,227 in
2010. Over the period, more boys were enrolled than girls.
Fig. 3.2.3: Total Enrolment in Public Primary and Junior Secondary Schools, 2000-2008
0
5,000,000
10,000,000
15,000,000
20,000,000
25,000,000
30,000,000
19,15
1,43
8
19,041
,223
19,861
,681
25,773
,044
21,39
5,51
0
22,115
,442
22,86
1,88
4
21,63
2,07
0
19,99
2,30
9
2,277
,291
2,580
,168
2,950
,732
3,684
,644
3,507
,928
3,62
4,163
2,93
4,972
3,47
6,063
3,934
,061
Primary
JuniorSecondary
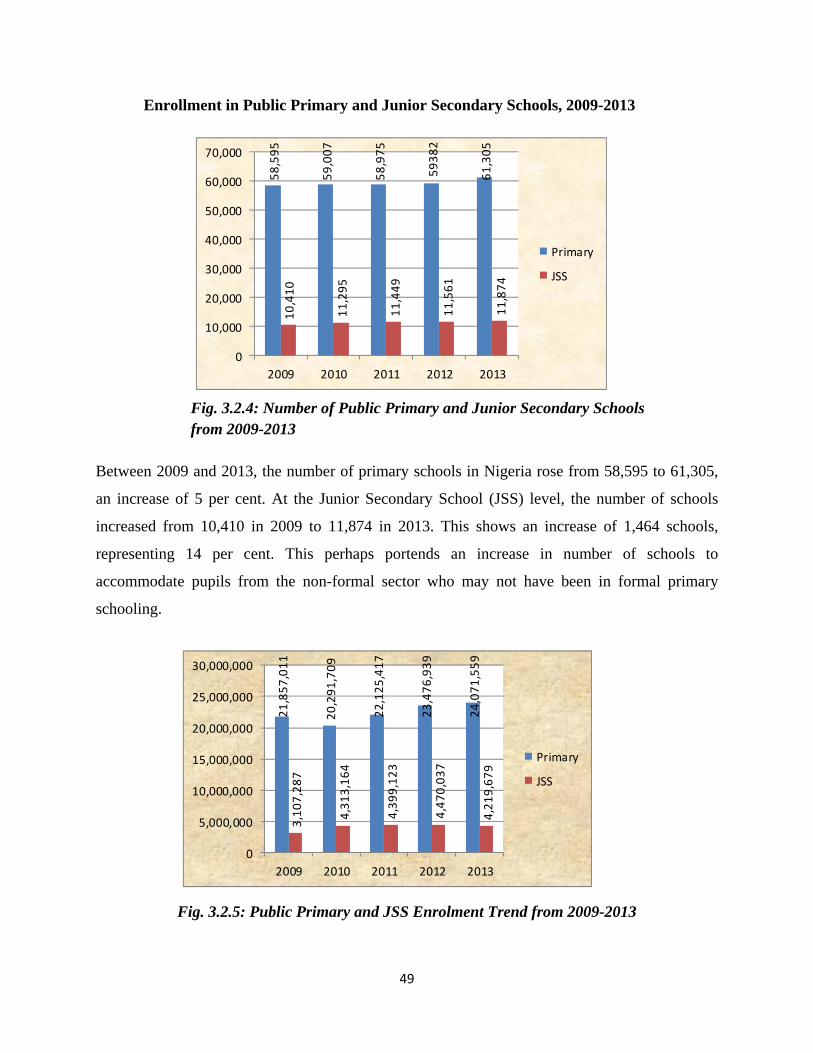
49
Enrollment in Public Primary and Junior Secondary Schools, 2009-2013
Fig. 3.2.4: Number of Public Primary and Junior Secondary Schools from 2009-2013
Between 2009 and 2013, the number of primary schools in Nigeria rose from 58,595 to 61,305,
an increase of 5 per cent. At the Junior Secondary School (JSS) level, the number of schools
increased from 10,410 in 2009 to 11,874 in 2013. This shows an increase of 1,464 schools,
representing 14 per cent. This perhaps portends an increase in number of schools to
accommodate pupils from the non-formal sector who may not have been in formal primary
schooling.
Fig. 3.2.5: Public Primary and JSS Enrolment Trend from 2009-2013
58,595
59,007
58,975
59382
61,305
10,410
11,295
11,449
11,561
11,874
0
10,000
20,000
30,000
40,000
50,000
60,000
70,000
2009 2010 2011 2012 2013
Primary
JSS21,857,011
20,291,709
22,125,417
23,476,939
24,071,559
3,107,287
4,313,164
4,399,123
4,470,037
4,219,679
0
5,000,000
10,000,000
15,000,000
20,000,000
25,000,000
30,000,000
2009 2010 2011 2012 2013
Primary
JSS
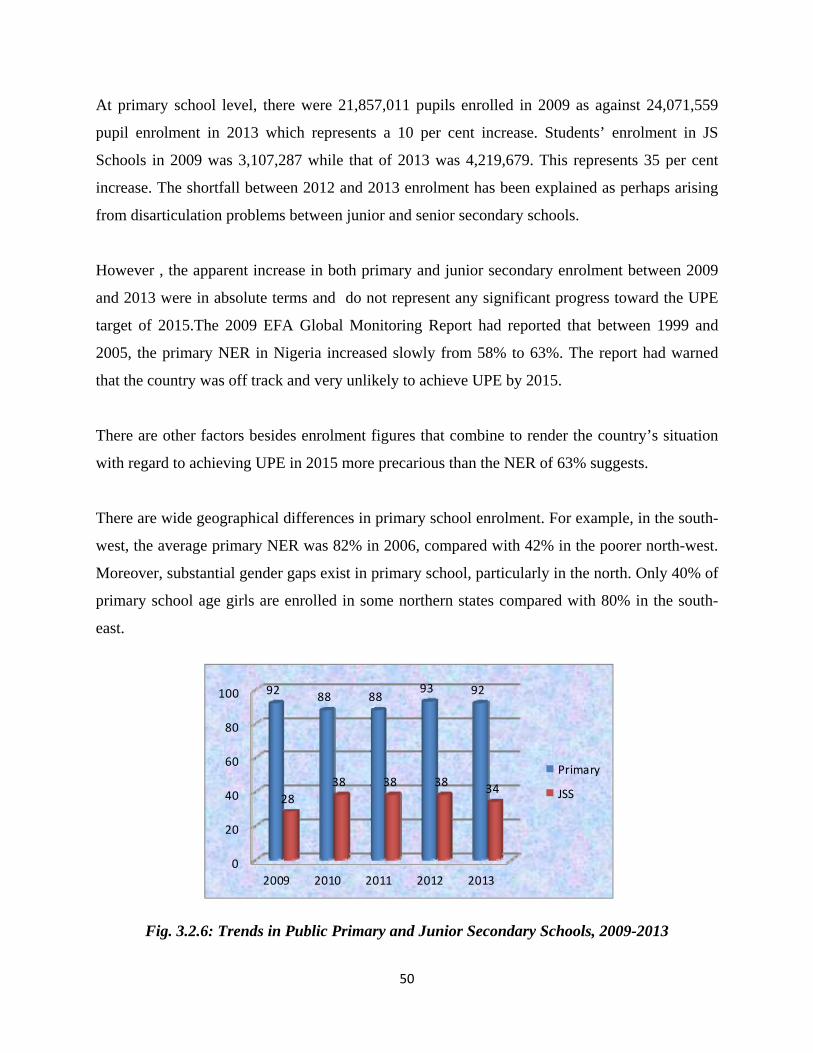
50
At primary school level, there were 21,857,011 pupils enrolled in 2009 as against 24,071,559
pupil enrolment in 2013 which represents a 10 per cent increase. Students’ enrolment in JS
Schools in 2009 was 3,107,287 while that of 2013 was 4,219,679. This represents 35 per cent
increase. The shortfall between 2012 and 2013 enrolment has been explained as perhaps arising
from disarticulation problems between junior and senior secondary schools.
However , the apparent increase in both primary and junior secondary enrolment between 2009
and 2013 were in absolute terms and do not represent any significant progress toward the UPE
target of 2015.The 2009 EFA Global Monitoring Report had reported that between 1999 and
2005, the primary NER in Nigeria increased slowly from 58% to 63%. The report had warned
that the country was off track and very unlikely to achieve UPE by 2015.
There are other factors besides enrolment figures that combine to render the country’s situation
with regard to achieving UPE in 2015 more precarious than the NER of 63% suggests.
There are wide geographical differences in primary school enrolment. For example, in the south-
west, the average primary NER was 82% in 2006, compared with 42% in the poorer north-west.
Moreover, substantial gender gaps exist in primary school, particularly in the north. Only 40% of
primary school age girls are enrolled in some northern states compared with 80% in the south-
east.
Fig. 3.2.6: Trends in Public Primary and Junior Secondary Schools, 2009-2013
0
20
40
60
80
100
2009 2010 2011 2012 2013
9288 88
93 92
28
38 38 3834
Primary
JSS
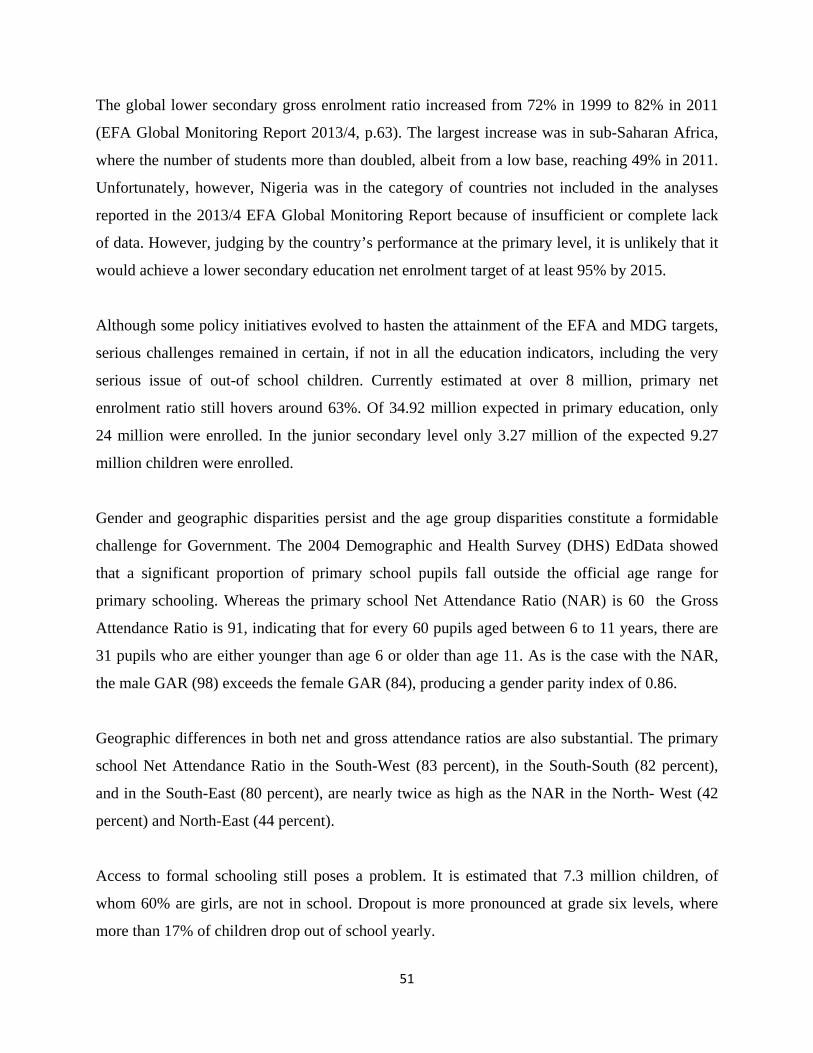
51
The global lower secondary gross enrolment ratio increased from 72% in 1999 to 82% in 2011
(EFA Global Monitoring Report 2013/4, p.63). The largest increase was in sub-Saharan Africa,
where the number of students more than doubled, albeit from a low base, reaching 49% in 2011.
Unfortunately, however, Nigeria was in the category of countries not included in the analyses
reported in the 2013/4 EFA Global Monitoring Report because of insufficient or complete lack
of data. However, judging by the country’s performance at the primary level, it is unlikely that it
would achieve a lower secondary education net enrolment target of at least 95% by 2015.
Although some policy initiatives evolved to hasten the attainment of the EFA and MDG targets,
serious challenges remained in certain, if not in all the education indicators, including the very
serious issue of out-of school children. Currently estimated at over 8 million, primary net
enrolment ratio still hovers around 63%. Of 34.92 million expected in primary education, only
24 million were enrolled. In the junior secondary level only 3.27 million of the expected 9.27
million children were enrolled.
Gender and geographic disparities persist and the age group disparities constitute a formidable
challenge for Government. The 2004 Demographic and Health Survey (DHS) EdData showed
that a significant proportion of primary school pupils fall outside the official age range for
primary schooling. Whereas the primary school Net Attendance Ratio (NAR) is 60 the Gross
Attendance Ratio is 91, indicating that for every 60 pupils aged between 6 to 11 years, there are
31 pupils who are either younger than age 6 or older than age 11. As is the case with the NAR,
the male GAR (98) exceeds the female GAR (84), producing a gender parity index of 0.86.
Geographic differences in both net and gross attendance ratios are also substantial. The primary
school Net Attendance Ratio in the South-West (83 percent), in the South-South (82 percent),
and in the South-East (80 percent), are nearly twice as high as the NAR in the North- West (42
percent) and North-East (44 percent).
Access to formal schooling still poses a problem. It is estimated that 7.3 million children, of
whom 60% are girls, are not in school. Dropout is more pronounced at grade six levels, where
more than 17% of children drop out of school yearly.
52
The drop-out issue has multifarious dimensions, the most significant of which are: early marriage
for girls in the North, boys and girls engagement in income generating activities to supplement
household income in the South Eastern and North-Eastern parts of the country, respectively, as
well as in major State capitals. The poor quality of the education system and perceived weak
employment prospects for school and university leavers are also key factors affecting drop-out
and low transition from primary to junior secondary schools.
c) Initiatives towards EFA Goal 2
A major policy development in the primary education sub-stream within the period, according to
the 2011 State of Education Report, was the vocationalization of its curriculum. The pre-
vocational subjects in the primary level include Agriculture, Home Economics, Drawing,
Handicraft, Music and Cultural Activities and Computer Education. At the junior secondary
level, which is the third and final segment of the 9-year basic education program, the vocational
thrust of basic education is consolidated. New vocational education curricula as well as academic
subjects were introduced. The pre-vocational subjects at this level are Agriculture, Business
Studies, Home Economics, Local Crafts, Computer Education, Fine Art and Music.
3. Recent achievements and impact of EFA Goal 2
i. Launch Of Targeted Education Programmes
Almajiri for the north and boys’ education programmes for the South-East and South-South.
These are directed at enhancing enrolment and mobilization of non-formal education structures
for all school age children a cross barriers.
ii. Greater Awareness On Girls’ Education
As a result of increasing government commitment, greater awareness has been created
nationwide on girls' education, with the launch and dissemination of the SAGEN in July 2003
and a pledge by the Federal Ministry of Education to mainstream girls' education into the EFA
Plan. Some States in northern Nigeria have already promulgated edicts to support the promotion
of girls' education. For example, Kano State has prohibited the collection of all forms of fees /
levies in Girls' Secondary Schools. Similarly, Gombe State promulgated an edict against the
53
withdrawal of girls from schools, while Niger, Bauchi and Yobe States have removed financial
disincentives affecting girls' enrolment in secondary schools. Those who have dropped out as a
result of early marriages and/or teenage pregnancy are encouraged to return to school, as is the
case with the Women Day College in Minna, Niger State.
iii. Expanding Partnerships
In support of Strategy for Accelerating Girls' Education in Nigeria (SAGEN), other major
partners are also reinforcing their efforts for girls' education. The World Bank has recently
recruited a focal point for girls education; UNESCO has commissioned research in this area,
United Nations Populations Fund (UNFPA) has been supporting girls' education to ensure that
more girls' remain in school longer and USAID is considering scaling up their work with
Islamiyah schools in Northern Nigeria, as such schools often recruit more girls than boys. The
Ambassador's Girls Schooling Programme (an initiative of USAID) provides US$60 per child
for indigent families. A total of 13 States are targeted with two States per geo-political zone plus
the Federal Capital Territory (FCT). Fifteen pupils per state are to benefit from the programme
with the funds disbursed through NGOs. Furthermore, all the major partners are mainstreaming
gender across their work.
iv. Working with Civil Society
In Nigeria, UNICEF works in close partnership with Civil Society in both formal and non-formal
sub-sectors, including partnership with Civil Society Action Coalition on Education for All
(CSACEFA) – an umbrella organization encompassing NGOs around the country. As a result of
this collaboration, the Nigerian Girls' Education Initiative was created this year and involves
over 20 NGOs operating under Civil Society Action Coalition on Education for All (CSACEFA).
The NGEI forum meets quarterly to synergize plans with NGOs involved in girls' education
around the country. The last meeting this year will benefit from good practice sharing in both
formal and non-formal interventions at the grassroots level. The Non-Governmental
Organization for Literacy Support Services (NOLGASS) operates under Civil Society Action
Coalition on Education for All to coordinate NGOs in Non-Formal Education. There is regular
information sharing, participation in planning, capacity building and in monitoring and
54
evaluation activities. The NGO sector constitutes a good delivery alternative especially in some
parts of the country where access is not easy.
4. The Nomadic Education Programme and EFA Goal 2
Greater commitment to the universalization of access to basic education heightened interest in
the provision of quality basic education to nomadic and other educationally disadvantaged
groups in Nigeria. These segments of the population have serious limitations to equitable access
to basic education through the conventional education system as a result of certain occupational
and socio-cultural peculiarities.
The National Commission for Nomadic Education was established by Vide Cap No: 20 LFN,
2004) to provide education to the nomadic pastoralists and migrant fisher folks whose population
exceeds 9.4 million people and of recent the migrant farmers whose population is yet to be
determined.
Provision of access to quality basic education for nomads and progress towards the EFA Goals 2.
The aim of the Nomadic Education Programme (NEP) is to provide an unfettered access to
quality basic education for nomads; to boost literacy and equip them with skills and
competencies to enhance their well-being and participation in nation building. To effectively
meet this challenge, the NEP utilizes innovative approaches and strategies such as:
i. development and use of relevant curriculum, teaching methods, materials and
infrastructure appropriate to the needs and peculiar circumstances of the target groups;
ii. flexible and responsive school calendar and time scheduling to suit learners;
iii. intensive community sensitization and empowerment to stimulate and sustain programme
support; and
iv. robust collaboration and partnerships with relevant governments, institutions and
organizations in programme development, implementation and evaluation.
The NEP remains one of the key programmes of the Federal Government of Nigeria in its efforts
to attain the EFA goals. In pursuance of its functions, the National Commission for Nomadic
Education (NCNE) has since inception evolved a number of distinct programmes for the
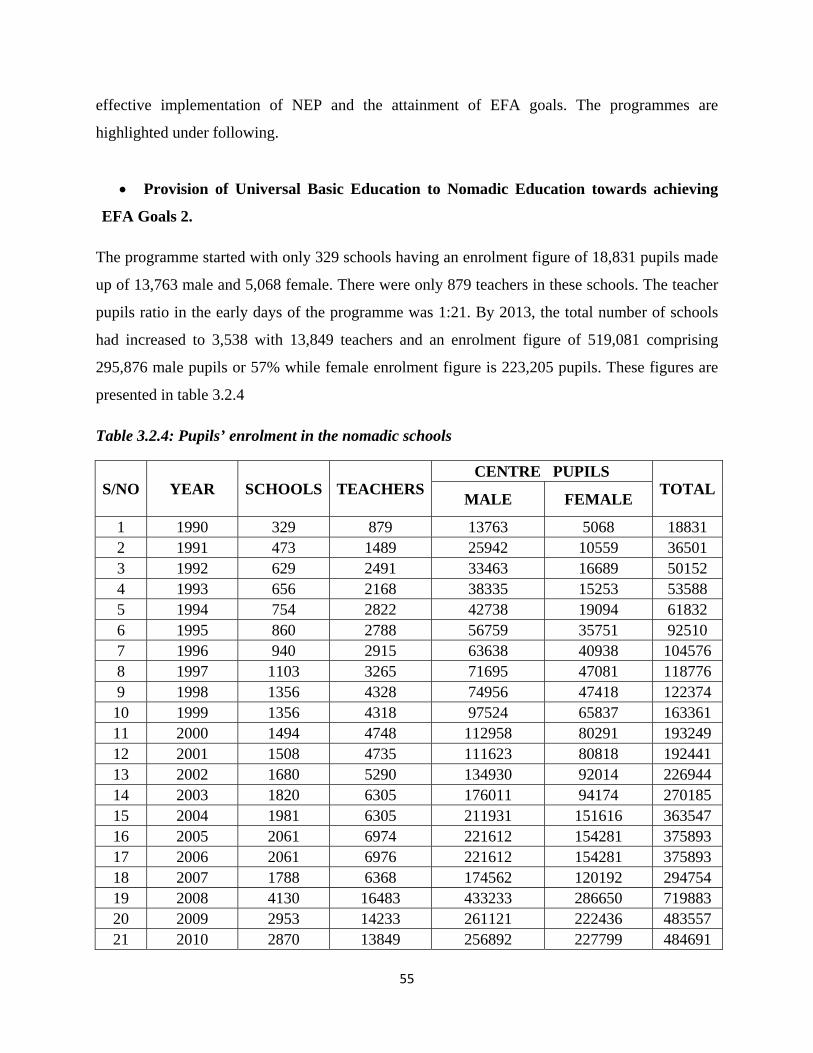
55
effective implementation of NEP and the attainment of EFA goals. The programmes are
highlighted under following.
Provision of Universal Basic Education to Nomadic Education towards achieving
EFA Goals 2.
The programme started with only 329 schools having an enrolment figure of 18,831 pupils made
up of 13,763 male and 5,068 female. There were only 879 teachers in these schools. The teacher
pupils ratio in the early days of the programme was 1:21. By 2013, the total number of schools
had increased to 3,538 with 13,849 teachers and an enrolment figure of 519,081 comprising
295,876 male pupils or 57% while female enrolment figure is 223,205 pupils. These figures are
presented in table 3.2.4
Table 3.2.4: Pupils’ enrolment in the nomadic schools
S/NO
YEAR
SCHOOLS
TEACHERS
CENTRE PUPILS TOTAL
MALE FEMALE
1 1990 329 879 13763 5068 18831 2 1991 473 1489 25942 10559 36501 3 1992 629 2491 33463 16689 50152 4 1993 656 2168 38335 15253 53588 5 1994 754 2822 42738 19094 61832 6 1995 860 2788 56759 35751 92510 7 1996 940 2915 63638 40938 104576 8 1997 1103 3265 71695 47081 118776 9 1998 1356 4328 74956 47418 122374 10 1999 1356 4318 97524 65837 163361 11 2000 1494 4748 112958 80291 193249 12 2001 1508 4735 111623 80818 192441 13 2002 1680 5290 134930 92014 226944 14 2003 1820 6305 176011 94174 270185 15 2004 1981 6305 211931 151616 363547 16 2005 2061 6974 221612 154281 375893 17 2006 2061 6976 221612 154281 375893 18 2007 1788 6368 174562 120192 294754 19 2008 4130 16483 433233 286650 719883 20 2009 2953 14233 261121 222436 483557 21 2010 2870 13849 256892 227799 484691
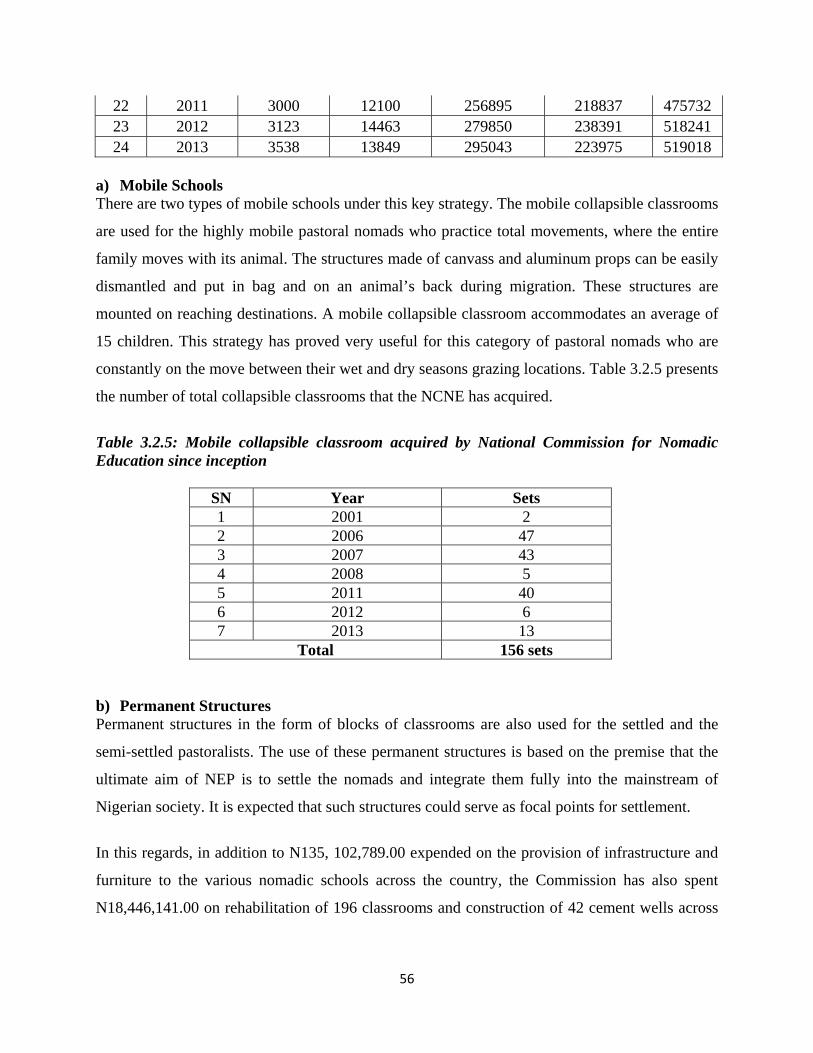
56
22 2011 3000 12100 256895 218837 475732 23 2012 3123 14463 279850 238391 518241 24 2013 3538 13849 295043 223975 519018
a) Mobile Schools There are two types of mobile schools under this key strategy. The mobile collapsible classrooms
are used for the highly mobile pastoral nomads who practice total movements, where the entire
family moves with its animal. The structures made of canvass and aluminum props can be easily
dismantled and put in bag and on an animal’s back during migration. These structures are
mounted on reaching destinations. A mobile collapsible classroom accommodates an average of
15 children. This strategy has proved very useful for this category of pastoral nomads who are
constantly on the move between their wet and dry seasons grazing locations. Table 3.2.5 presents
the number of total collapsible classrooms that the NCNE has acquired.
Table 3.2.5: Mobile collapsible classroom acquired by National Commission for Nomadic Education since inception
SN Year Sets 1 2001 2 2 2006 47 3 2007 43 4 2008 5 5 2011 40 6 2012 6 7 2013 13
Total 156 sets b) Permanent Structures Permanent structures in the form of blocks of classrooms are also used for the settled and the
semi-settled pastoralists. The use of these permanent structures is based on the premise that the
ultimate aim of NEP is to settle the nomads and integrate them fully into the mainstream of
Nigerian society. It is expected that such structures could serve as focal points for settlement.
In this regards, in addition to N135, 102,789.00 expended on the provision of infrastructure and
furniture to the various nomadic schools across the country, the Commission has also spent
N18,446,141.00 on rehabilitation of 196 classrooms and construction of 42 cement wells across
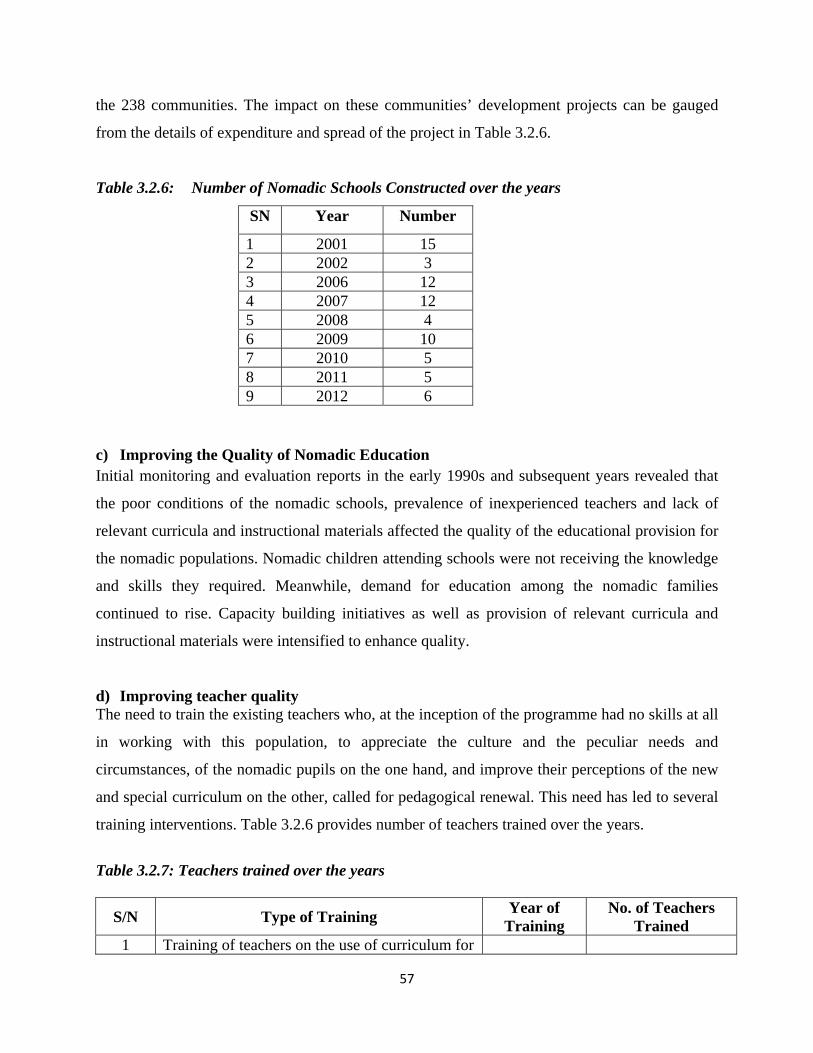
57
the 238 communities. The impact on these communities’ development projects can be gauged
from the details of expenditure and spread of the project in Table 3.2.6.
Table 3.2.6: Number of Nomadic Schools Constructed over the years
SN Year Number
1 2001 15 2 2002 3 3 2006 12 4 2007 12 5 2008 4 6 2009 10 7 2010 5 8 2011 5 9 2012 6
c) Improving the Quality of Nomadic Education Initial monitoring and evaluation reports in the early 1990s and subsequent years revealed that
the poor conditions of the nomadic schools, prevalence of inexperienced teachers and lack of
relevant curricula and instructional materials affected the quality of the educational provision for
the nomadic populations. Nomadic children attending schools were not receiving the knowledge
and skills they required. Meanwhile, demand for education among the nomadic families
continued to rise. Capacity building initiatives as well as provision of relevant curricula and
instructional materials were intensified to enhance quality.
d) Improving teacher quality The need to train the existing teachers who, at the inception of the programme had no skills at all
in working with this population, to appreciate the culture and the peculiar needs and
circumstances, of the nomadic pupils on the one hand, and improve their perceptions of the new
and special curriculum on the other, called for pedagogical renewal. This need has led to several
training interventions. Table 3.2.6 provides number of teachers trained over the years.
Table 3.2.7: Teachers trained over the years
S/N Type of Training Year of
Training No. of Teachers
Trained 1 Training of teachers on the use of curriculum for

58
the education of pastoralists 1999 30 2 Training of teachers on IRI 2006 65 3 Teacher training 2006 67 4 Training of teachers on the use of curriculum for
the education of fisherfolk
2006
155 5 Training of teachers on adapted family life and
HIV/AIDs Education curriculum
2007
48 6 Training of teachers on IRI 2008 70 7 Training of teachers on IRI 2008 520 8 Training of nomadic mentors and monitors on
IRI
2008
63 9 Training of Head-teachers and supervisors on
record keeping
2011
88 10 Training of Head-teachers, classroom teachers
and supervisors on pedagogical skills, record keeping and school management for migrant fisherfolk
2011
60 11 Training of Mentors and Monitors on IRI 2012 60 12 Training of teacher on the use of the reviewed
nomadic curriculum
2014
631 Series of National Teachers’ Orientation workshops were held between 1991 and 2014 for
training of head teachers, teachers, supervisors and coordinators of NEP to familiarize them with
the contents, objectives, peculiarities and expectations of the new nomadic education curricula;
and enhance their knowledge, skills and competences through exposure to new and innovative
teaching methods.
e) Design and Development and Production of Instructional Materials The quality drive of NEP was also approached from the perspective of relevance. The premise on
which this perceptive was based is the belief that the quality of any educational programme
could be measured from its demonstrated relevance to the lives of its target populations since the
essence of education, put simply, is to better the lives of its recipients.
The main objective of this intervention was to produce relevant and qualitative educational
materials that reflect the nomads’ socio-cultural lifestyles and, which draw concrete examples
from their backgrounds and economic activities for use in the nomadic schools. This involved
the development of educational materials from scratch in subject areas in which there were no
existing curricula and instructional materials namely: Fulfulde, Health Education, Islamic
Religious Knowledge and Handicraft. While the national core curriculum was adapted in case of
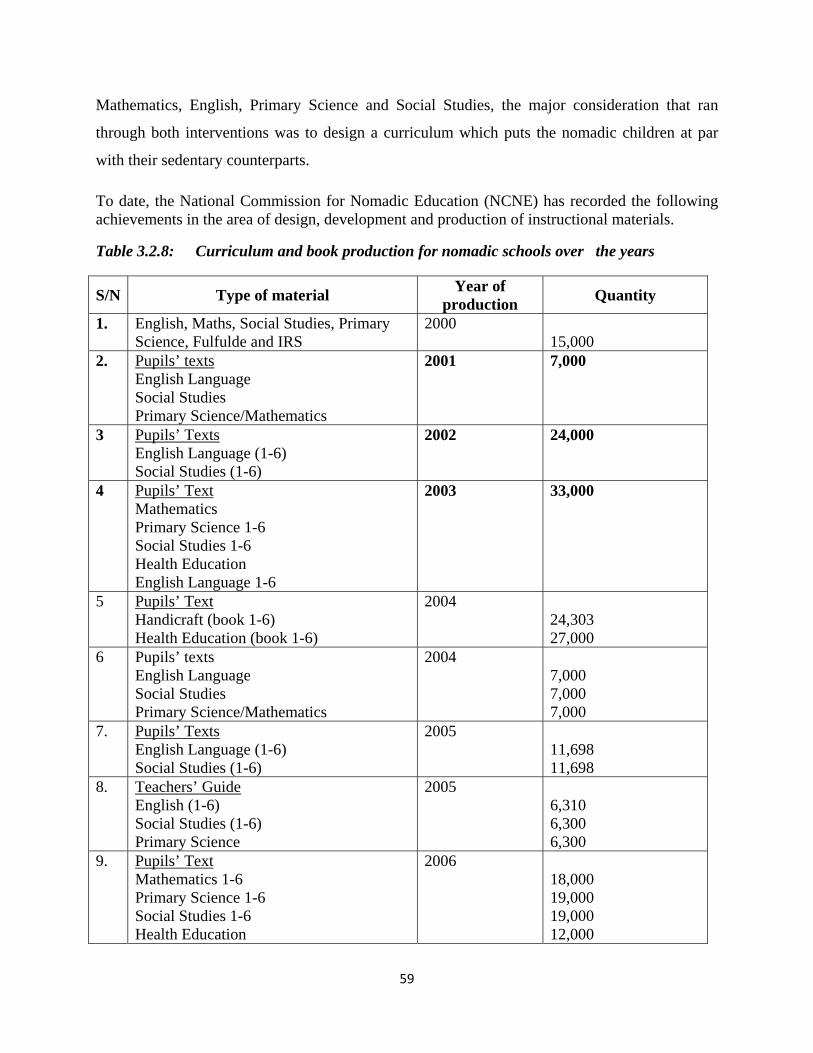
59
Mathematics, English, Primary Science and Social Studies, the major consideration that ran
through both interventions was to design a curriculum which puts the nomadic children at par
with their sedentary counterparts.
To date, the National Commission for Nomadic Education (NCNE) has recorded the following achievements in the area of design, development and production of instructional materials.
Table 3.2.8: Curriculum and book production for nomadic schools over the years
S/N Type of material Year of
production Quantity
1. English, Maths, Social Studies, Primary Science, Fulfulde and IRS
2000 15,000
2. Pupils’ texts English Language Social Studies Primary Science/Mathematics
2001 7,000
3 Pupils’ Texts English Language (1-6) Social Studies (1-6)
2002 24,000
4 Pupils’ Text Mathematics Primary Science 1-6 Social Studies 1-6 Health Education English Language 1-6
2003 33,000
5 Pupils’ Text Handicraft (book 1-6) Health Education (book 1-6)
2004
24,303 27,000
6 Pupils’ texts English Language Social Studies Primary Science/Mathematics
2004 7,000 7,000 7,000
7.
Pupils’ Texts English Language (1-6) Social Studies (1-6)
2005 11,698 11,698
8. Teachers’ Guide English (1-6) Social Studies (1-6) Primary Science
2005 6,310 6,300 6,300
9. Pupils’ Text Mathematics 1-6 Primary Science 1-6 Social Studies 1-6 Health Education
2006 18,000 19,000 19,000 12,000
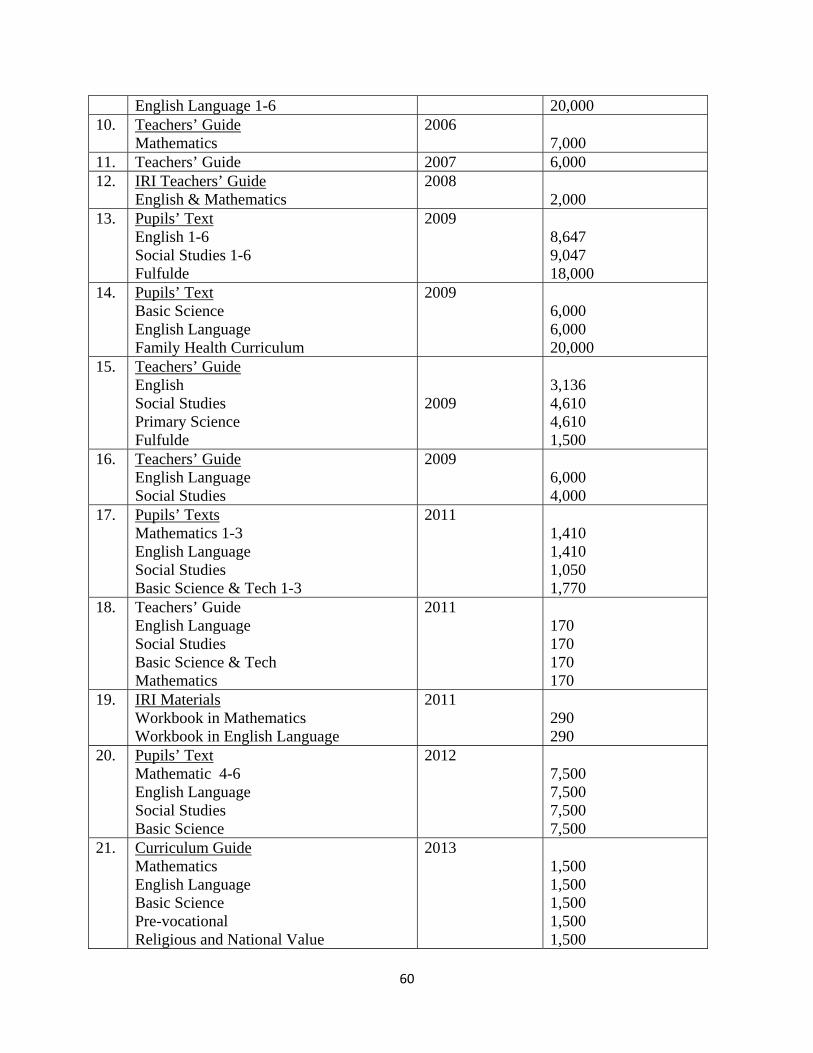
60
English Language 1-6 20,000 10. Teachers’ Guide
Mathematics 2006
7,000 11. Teachers’ Guide 2007 6,000 12. IRI Teachers’ Guide
English & Mathematics 2008
2,000 13. Pupils’ Text
English 1-6 Social Studies 1-6 Fulfulde
2009 8,647 9,047 18,000
14. Pupils’ Text Basic Science English Language Family Health Curriculum
2009 6,000 6,000 20,000
15. Teachers’ Guide English Social Studies Primary Science Fulfulde
2009
3,136 4,610 4,610 1,500
16. Teachers’ Guide English Language Social Studies
2009 6,000 4,000
17. Pupils’ Texts Mathematics 1-3 English Language Social Studies Basic Science & Tech 1-3
2011 1,410 1,410 1,050 1,770
18. Teachers’ Guide English Language Social Studies Basic Science & Tech Mathematics
2011 170 170 170 170
19. IRI Materials Workbook in Mathematics Workbook in English Language
2011 290 290
20. Pupils’ Text Mathematic 4-6 English Language Social Studies Basic Science
2012 7,500 7,500 7,500 7,500
21. Curriculum Guide Mathematics English Language Basic Science Pre-vocational Religious and National Value
2013 1,500 1,500 1,500 1,500 1,500
61
f) Prospects for Post 2015 To reduce the influence of these constraints, NCNE is planning to strengthen the implementation of a number of innovative programmes it embarked upon as responses to enhance the participation of nomads in basic education. The initiatives are as follows:
Selection of more individuals from nomadic backgrounds for training as teachers.
Heightened use of distance learning techniques for improved tuition.
Development and production of more instructional materials to ensure the provision of essential learning packages to nomadic schools.
Seeking new partnerships and greater collaboration with development partners and other stakeholders.
Evolving new strategies to increase community participation and ownership of schools.
Expanding inter-sectoral cooperation efforts with relevant Ministries and Agencies.
Catalyzing new & innovative approaches to NEP.
Expanding the integrated education scheme (model schools) to cover more grazing reserves and fishing ports.
Quality of teaching and learning in the nomadic schools can be improved by continuous capacity building for nomadic teachers.
Developed curricula and instructional materials for ECCD category. Improved teacher capacity and pedagogical renewal. Intensify sensitization campaigns.
The systematic implementation of the Nomadic Education Programme (NEP) since inception has
recorded tremendous achievements. The educational profile of the nomads has increased from
2% to 10% approximately. It could be concluded that from the Nigerian experience of providing
access to basic functional education to the nomads such as nomadic pastoralists, migrant
fisherfolk and migrant farmers, there is no doubt that the right of the Nigerian child to quality
education in the second millennium will be achieved. Considering the current implementation of
Universal Basic Education, (UBE), Education for All (EFA) and MDGs, it is our conviction that
if the current momentum is reinvigorated, sustained and the major constraints of inadequate
funding improved, the Commission would achieve its mandate of broadening access to quality
basic education to the hard- to-reach nomads in Nigeria.
5. Almajiri Education Programme
The Federal Government established the National Almajiri Education Programme as one of the strategies for achieving inclusive basic education programme in Nigeria and to tackle the menace
62
of the over 10 million out-of-school children. The goal of the programme is to ensure that the estimated 9 million Almajiri children are integrated into the UBE programme.
The programme is funded mainly from the UBE funds (derived from the Consolidated Revenue Fund). The Millennium Development Goals Office makes intervention by providing funds for specific projects.
Projects under Almajiri Education Programme involve the construction of 89 (model 1 & 2) schools in 27 States. Of this number, 72 have been completed and handed over to SUBEBs along with furniture.
The programme is being implanted under three models, namely:
i. Integration of Traditional Tsangaya/Qur’anic School within its original location. This entails the provision of the following:
A block of two classrooms and furniture.
Office, Store and Toilets.
Hostel block and Students lockers.
Recitation hall with Store and furniture/mats.
VIP Toilets
Borehole with Overhead-Tank
Gate house
External works and Fencing
ii. Model Almajiri Schools.
This involves establishment of a Model Tsangaya/Qur’anic Schools, with the following facilities:
Two blocks of 6 classrooms
Admin block (offices, 2 nos. laboratories and 2 nos. workshops)
12 nos. Staff accommodation
Hostel block
Toilets laundry
Recitation Hall
63
Mallam’s Residence
Hand-pump borehole
Motorized Borehole with Overhead-Tank
VIP toilets
Kitchen and Dining
External works and fencing
Gate house
iii. Integration of basic education in established of basic education in established lslamiyyah and Ma’ahad Schools. This will involve provision of infrastructure and other facilities based on the needs of specific schools.
A total of 125 boarding and day schools have been constructed with most of these handed over to the States. These are located in 27 States of Federation and the FCT. All these have provided greater access to quality Basic Education to the Almajiri population in the country. With each of the school starting with a minimum capacity of 80pupils, these will increase enrolment by at least 10, 000 pupil per year.
6. Key issues and challenges for basic education in Nigeria
Despite the country’s national objective of providing free and compulsory basic education to all
children of school age, a large number of them remain out of school (2009 EFA GMR, P.62).
This trend is being reversed through government education programmes such as Almajiri
Education project and other similar programmes.
The challenges facing the UBE programme in Nigeria are many and varied. They are not,
however, insurmountable but rather provide opportunities for better planning and re-direction of
the programme towards the achievement of the country’s vision and goals in education. Some of
these challenges are described below:
i. Misinterpretation of the “expanded vision of UBE”
The expanded vision of basic education espoused at Jomtien was in the earlier years reduced to a
simple emphasis on putting more children into school. Most attention and resources thus went
64
into increasing primary school enrolment and reducing gender disparities. Far less attention has
been given to meeting the basic learning needs of adults and out-of-school youth.
ii. Structural defects in implementation mechanism
The trend to create a Parastatal for every development challenge has caught up strongly with the
UBE programme in Nigeria, and this has been further worsened by the non-recognition of UBE
as synonymous with Education for All (EFA). According to Obanya (2009), UBE was originally
conceived as Nigeria’s articulation of EFA, as well as its domestication. Government created a
different organ to plan EFA. This he observed, is “a clear case of discordant dancing to the same
musical tune”. Nigeria’s UBE was originally conceived with the requirements of Jomtien and
Dakar in mind, and therefore there was to be a coordinated response to the challenge of basic
education. This however has not been so, as there are three distinct parastatals for basic
education, the Universal Basic Education Commission, the National Commission for Adult and
Non-Formal Education (NMEC) and the National Commission on Nomadic Education (NCNE).
This unwieldy arrangement is replicated down to the State level.
At the State level, the situation is further compounded by two other phenomena. First, the
primary section of UBE is controlled by the State Universal Basic Education Board (SUBEB),
while the Junior Secondary segment is under the control of a Secondary Education Board.
Second, the Chair of SUBEB is a direct appointee of the State Governor and stands on the same
pedestal as the head of Education Sector in the State – the Commissioner for Education.
Consequently, there is a situation in which a State Universal Basic Education Board is headed by
an ‘Executive Chairman’, who reports directly to the State Governor. By the Act establishing
the SUBEBs, it means that a large bulk of the school system is under the direct control of the
State Universal Education Boards excluding the State Ministries of Education (SMoEs).
iii. Unified curriculum (National Prescription)
In a federation such as Nigeria, a curriculum that fits all sizes should seriously be re-examined.
This places a burden of passivity on States who no longer bother even to localize the curriculum.
It is possible in Nigeria to have a common curriculum and allow for each state to add locally
relevant content to it. This will illustrate a good example of the utility of concurrent
responsibility arrangements as a federation.
65
iv. Funding and other financial Issues
The under-utilized of UBE Funds has become a major challenge in the implementation of the
UBE programme. Several reasons have been given for non-accessibility of the funds:
Insufficient consultation with the states in the design and implementation of the UBE
Programme, including project selection;
Inadequate policy coordination across three tiers of government in the
implementation of the UBE prgramme;
Lack of capacity within States to use funds in accordance with the guidelines;
Complex conditions for accessing the funds and the associated bureaucracy;
Lack of capacity and political will at the federal level to amend guidelines in light of
experience and to drive through disbursements;
The suspension of disbursements due to “sharp practices” in expenditure, which has
occurred in several states;
A lack of willingness of States to give counterpart funding for matching grants.
Pace of disbursement on the part of UBEC which has been subject to major delays.
The fact that quarterly allocations can be rolled over indefinitely does not provide a
strong incentive for State governments to commit their matching funding.
v. Accumulated un-accessed Funds
Funds allocated and not accessed have become another major challenge that confronts the UBE
programme. It is on record that between 2000 and 2008, the sum of N22.6 billion that had been
allocated to some public tertiary institutions, State Ministries of Education and Universal Basic
Education Boards by the Education Trust Fund was not accessed during the period (Mahmood
Yakubu publication 2009).
vi. Establishing actual progress towards UBE
This is a major challenge given the poor quality of data available at both Federal and State
levels. This challenge has both political and technical dimensions. For this reason, projections
based on population figures (like net and gross enrolments) have remained in the realm of
conjectures. At the technical level, the human capacity is seriously deficient. There is even an
attitudinal/ behavioral dimension to the problem, arising from a general apathy towards record
keeping and to use facts and figures for planning and decision-making.
66
There is no doubt that some progress has been made in recent years in this direction in improving
the data profile of the nation. The National Planning Commission in the presidency is
experiencing a turn-around. The Education Management Information System (EMIS) is coming
into the system, though slowly, but somewhat steadily.
vii. Top-down Policy Making Culture
It is quite clear that Nigeria’s Constitution confers the control of primary education to local
governments. The grip that States have on Local governments have not allowed this to happen
in reality. Similarly, the Federal Government has consistently gone beyond its powers of
assistance to the States and Local Governments in Nigeria for purposes of uniform and
qualitative education throughout Nigeria. Major education programmes that touch the lives of
children in the states and local communities have overpowering influence and direction of the
Federal Government even on issues that are best handled at the local level.
Although progress has been made in basic education provision at primary and junior secondary
levels, much more remains to be done, both in quantity and quality. The quality of education
given at basic education level is still adjudged below standard as evidenced in the products of
this level (SER, 2013). The report attributes this to lack of inputs such as qualified teachers,
standard infrastructure, effective methodology of teaching, instructional materials, and effective
supervision. The report states that States need to do more to improve on enrolment, attendance
and transition rates, reduce repetition rates by making sure qualitative teaching goes on in
schools. It recommends the recruitment of qualified teachers and regular retraining to keep them
abreast of their counterparts around the world
The consequences of these issues are summarized as follows:
a) Participation in primary education is still low in comparison with primary school age
population, with enrolment being particularly problematic, especially in some of the
Northern States.
b) The high quality of the national school curriculum is undermined by the generally
low quality of teachers to implement it, translating into low levels of learning
achievement.
67
c) Infrastructure and furniture are inadequate and in dilapidated states; sanitary facilities
and toilets are inadequate.
d) The system of collecting comprehensive, relevant data for planning is weak.
e) There are social and cultural barriers that are hindrances to female participation.
f) Lack of enforcement of the UBE Act, 2004 on enrolment and retention.
g) Non-accessing of FGN intervention funds by some SUBEBS.
h) Child labour.
i) Poverty.
j) Insecurity issues, especially in parts of the Northern States.
7. Overall lessons learnt with regard to EFA Goal 2 since 2000
There has been marked increase in enrollment in primary and junior secondary schools
over the years. This has also been matched with the provision of additional facilities such
as classroom, as well as teaching-learning support materials
The number of public primary schools as at 2010 was 59,007 compared to 2006 with
54,434. This showed an increase of 8.4% of primary schools.
The expansion in infrastructural facilities is as a result of a commitment of government to
increase access to basic education for citizenry.
Non-governmental organization has been key in promoting access to education in
Nigeria. Working in collaboration with the Ministries of Education, SUBEBS, and
International Development Partners (IDPs) they organize diverse programmes to promote
access.
68
3.3 – Meeting the Learning Needs of Youth and Adults
EFA GOAL 3
1. Introduction
EFA Goal 3 which deals with meeting the learning needs of youth and adults is little understood
and neglected more so because no targets were set for it (GMR, 2012). This also leads to this
EFA goal being erroneously interpreted as compensation programmes for those who have missed
out on formal education in their young age. The irony posed by this interpretation of EFA goal 3
- as a make-up for those who have missed out on something - is mentioned as the root cause of
the marginalisation process that actually begins with lack of quality basic and secondary
education as well as early withdrawal of children from school before they can acquire the skills
of survival and continuing learning. As noted in the 2012 GMR, it is very hard to measure skills
because it has been difficult for the international community to systematically quantify skills.
Other thorny issues that complicate the goal are the uncertain completion rate of the junior
secondary education level and the low transition rate from junior to senior secondary education
at which point the bulk of youths from poor families drop out of formal schooling. In addition,
some of the youths may not complete the senior secondary level or may not successfully pass out
of the system.
To this end, the Government of Nigeria made a renewed commitment to meet the learning needs
of out-of-school youths and illiterate adults. The commitment includes provision of skills
acquisition programmes for out-of-school youths and adults literacy and education facilities for
disadvantaged groups such as nomads. However, the provision of these facilities has not been
adequate enough to meet the learning needs of the teeming out-of-school youths and adults.
Along with other bottlenecks, this scenario makes it difficult for Nigeria to achieve EFA Goals 3
and 4 by the target year of 2015.
Ensuring that the learning needs of all young people and adults are met through equitable access to
appropriate learning and life-skills programmers.
69
Recognizing the critical link of EFA goal 3 to technical and vocational education (TVET),
experts posit that this neglect has led to the challenges of exclusion from the development
process for a number of youth and adults who have no access to education or skills.
Specifically concerning EFA goal 3 the world committed to:
... re-affirm the vision of the World Declaration on Education for All
(Jomtien 1990), supported by the Universal Declaration of Human Rights
and the Convention on the Rights of the Child, that all children, young
people and adults have the human right to benefit from an education that
will meet their basic learning needs in the best and fullest sense of the term,
an education that includes learning to know, to do, to live together and to
be. It is an education geared to tapping each individual's talents and
potential and developing learners' personalities, so that they can improve
their lives and transform their societies (Dakar Framework for Action,
2000).
Following the expanded vision in the Dakar Framework for Action, EFA goal 3 sets a
development agenda that derives its potency from adequate emphasis on skills for all. This EFA
goal has however remained largely not understood and little implemented for reasons not far
removed from its vagueness. The resultant difficulty of interpretation has led to the neglect of
goal 3 a situation that further threatens the achievement of EFA in Nigeria. The irony of the
situation is that a sound implementation of EFA goal 3 would provide a significant impetus to
the attainment of the rest of the EFA agenda3.
EFA Goal 3 interpreted literally; conveys the gain to be derived from appropriate combination of
education and skills ultimately translating into enhanced livelihoods and wealth creation. As a
result, technical and vocational education and training (TVET) are major drivers for this goal
being the strand of education that empowers youth and adults with competences and skills for
self-employment and income generation. Infused with a generous dose of enterprise skills,
beneficiaries are most likely thoroughly equipped for life4.
3 Nwangwu, R. E. (2012) EFA goal 3: learning needs and life skills. 4 Nwangwu, op.cit
70
2. Progress in EFA Goal 3
In its commitment towards meeting the learning needs of youths and adults in the country,
government has developed specific programmes that target the youth and adult population.
Each-one–teach–one programme, the Regenerated Freirean Literacy and Empowering
Community Techniques (REFLECT), the Literacy Initiative for Empowerment (LIFE),
which is a UNESCO’s global strategies framework for collaborative action to enhance
literacy efforts in countries that have adult population of more than ten million illiterates.
Another laudable achievement of government is the Literacy by Radio as well as gender
and life skills programmes.
Government has responded to the challenge of meeting the learning needs of youth and
adults by vocationalizing the new senior secondary school curriculum, which became
effective in 2011/2012 academic session. This gesture holds considerable potentials as it
has infused more contents that are technical and offer 35 different trades within the
curriculum. The vocationalised curriculum, offers opportunity to increase access and
offerings in TVE.
To boost enrolment in formal technical colleges, government in 2004 converted all
Federal Government Technical Vocational Schools to Science Technical Colleges. This
successfully increased the demand for placement into the colleges.
More recently, the introduction of Vocational Enterprise Institutes (VEI) and Innovative
Enterprise Institutes (IEI) was to promote school leavers’ employability through re-
skilling, fill the gap created by the low absorptive capacity of existing tertiary institutions
and at the same time broaden access to TVET. Skills that can be offered by emerging
enterprise institutes include, soccer, film making, theatre arts/acting, modeling/fashion
design, Medical/Dental assistant/Technologist, Weaving/dyeing, Nursery
Assistant/Nanny, Beautician/Manicurist etcetera.
Through the support of African Development Bank (ADB), the National Commission
for Nomadic Education (NCNE) developed the capacities of 200 nomadic women on
income generation and entrepreneurship skills (sewing, knitting, yoghurt production,
liquid soap and pomade making) in two (2) nomadic model training centres in Nigeria
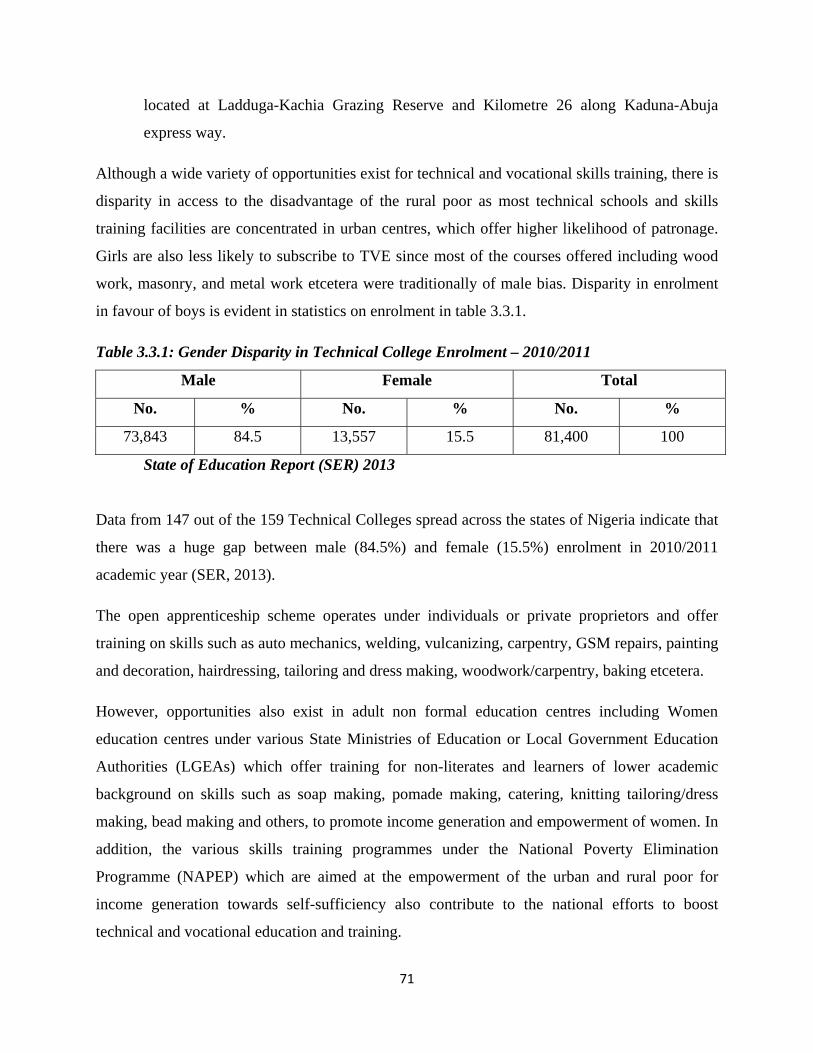
71
located at Ladduga-Kachia Grazing Reserve and Kilometre 26 along Kaduna-Abuja
express way.
Although a wide variety of opportunities exist for technical and vocational skills training, there is
disparity in access to the disadvantage of the rural poor as most technical schools and skills
training facilities are concentrated in urban centres, which offer higher likelihood of patronage.
Girls are also less likely to subscribe to TVE since most of the courses offered including wood
work, masonry, and metal work etcetera were traditionally of male bias. Disparity in enrolment
in favour of boys is evident in statistics on enrolment in table 3.3.1.
Table 3.3.1: Gender Disparity in Technical College Enrolment – 2010/2011
Male Female Total
No. % No. % No. %
73,843 84.5 13,557 15.5 81,400 100
State of Education Report (SER) 2013
Data from 147 out of the 159 Technical Colleges spread across the states of Nigeria indicate that
there was a huge gap between male (84.5%) and female (15.5%) enrolment in 2010/2011
academic year (SER, 2013).
The open apprenticeship scheme operates under individuals or private proprietors and offer
training on skills such as auto mechanics, welding, vulcanizing, carpentry, GSM repairs, painting
and decoration, hairdressing, tailoring and dress making, woodwork/carpentry, baking etcetera.
However, opportunities also exist in adult non formal education centres including Women
education centres under various State Ministries of Education or Local Government Education
Authorities (LGEAs) which offer training for non-literates and learners of lower academic
background on skills such as soap making, pomade making, catering, knitting tailoring/dress
making, bead making and others, to promote income generation and empowerment of women. In
addition, the various skills training programmes under the National Poverty Elimination
Programme (NAPEP) which are aimed at the empowerment of the urban and rural poor for
income generation towards self-sufficiency also contribute to the national efforts to boost
technical and vocational education and training.
72
Other sectors including health and agriculture offer extension services by way of skill training
for enhanced service delivery. There are also training programmes run by the Niger Delta
Development Commission (NDDC) which focus specifically on ameliorating poverty and its
attendant challenges in the oil producing areas. In addition, a number of Development Agencies
including UNDP, NGOs and FBOs also undertake training on various skills areas for Persons
Living Positively with AIDS (PLPWA) as well as urban and rural poor towards income
generation for poverty alleviation.
However, while the scope of opportunities is varied, there is currently no systematized
framework to coordinate activities of different sources of acquisition of skills including those
offered by the Ministry of Niger Delta Affairs (MNDA) and other organizations to address
overlaps, create synergy and maximize resource usage for maximum impact.
3. Main EFA Challenge for Goal 3
The result of the non-implementation of EFA goal 3 for Nigeria is that a number of young people
operate in the informal sector and the system is not yet able to aggregate, support and
mainstream this large reservoir of skills and entrepreneurship in the non-formal sector into local
indigenous trades and industries. The activities of this group, though supporting sub systems and
communities are undocumented, unsupported and little understood. An additional factor is that
the exemplary skills and creativity demonstrated in this sector is poorly patronised, lowly priced
and valued, a fact perhaps accounted for by the often-poor packaging of products. Given that
apprentices who are in a hurry to earn money hurriedly finish these products, the lack of
patronage is not surprising.
The assumption in EFA goal 3 is that a critical mass of knowledge and information is required
for a leap into the development mainstream. This is not the case at the moment. National
statistics show that over 40 million youths and adults in Nigeria are excluded from the
mainstream by lack of education and skills. Perhaps this led to the conclusion drawn in the Dakar
review that quantitative achievements noted in enhanced enrolment over the decade since the
EFA proclamation in 1990 tell nothing of the plight of the millions who are still excluded from
education or of alienated youth and their painful struggle to find a place and retain their values in
changing societies.
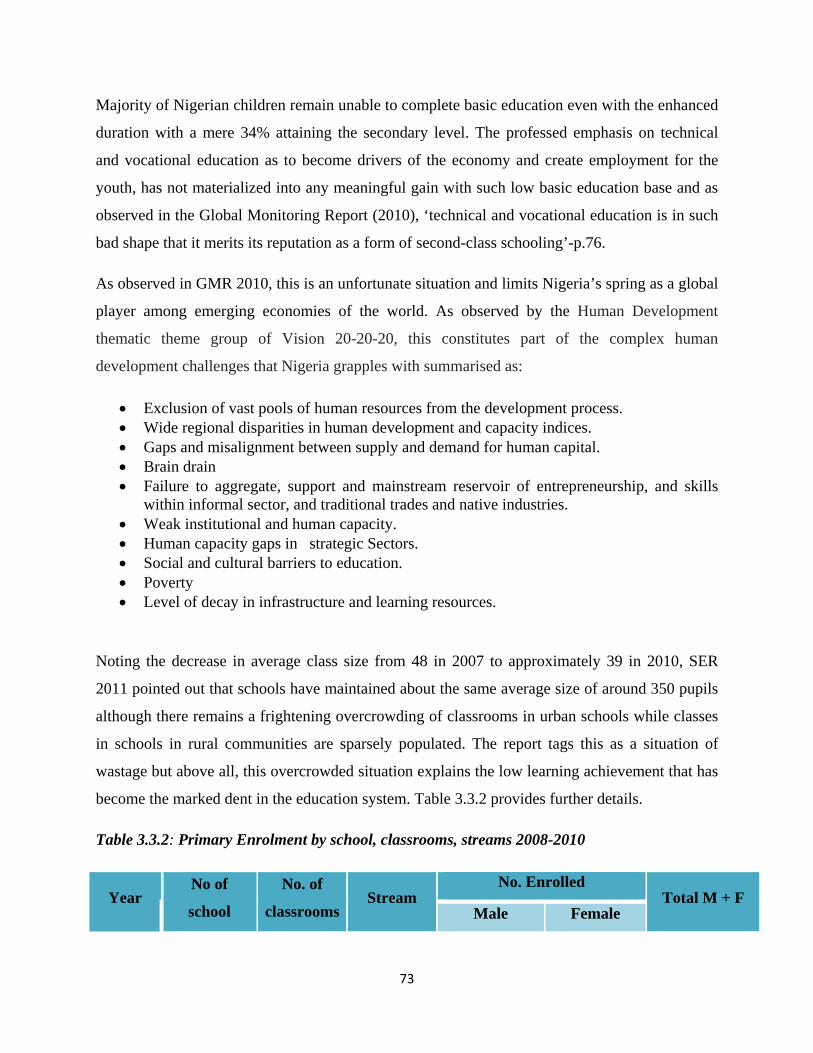
73
Majority of Nigerian children remain unable to complete basic education even with the enhanced
duration with a mere 34% attaining the secondary level. The professed emphasis on technical
and vocational education as to become drivers of the economy and create employment for the
youth, has not materialized into any meaningful gain with such low basic education base and as
observed in the Global Monitoring Report (2010), ‘technical and vocational education is in such
bad shape that it merits its reputation as a form of second-class schooling’-p.76.
As observed in GMR 2010, this is an unfortunate situation and limits Nigeria’s spring as a global
player among emerging economies of the world. As observed by the Human Development
thematic theme group of Vision 20-20-20, this constitutes part of the complex human
development challenges that Nigeria grapples with summarised as:
Exclusion of vast pools of human resources from the development process. Wide regional disparities in human development and capacity indices. Gaps and misalignment between supply and demand for human capital. Brain drain Failure to aggregate, support and mainstream reservoir of entrepreneurship, and skills
within informal sector, and traditional trades and native industries. Weak institutional and human capacity. Human capacity gaps in strategic Sectors. Social and cultural barriers to education. Poverty Level of decay in infrastructure and learning resources.
Noting the decrease in average class size from 48 in 2007 to approximately 39 in 2010, SER
2011 pointed out that schools have maintained about the same average size of around 350 pupils
although there remains a frightening overcrowding of classrooms in urban schools while classes
in schools in rural communities are sparsely populated. The report tags this as a situation of
wastage but above all, this overcrowded situation explains the low learning achievement that has
become the marked dent in the education system. Table 3.3.2 provides further details.
Table 3.3.2: Primary Enrolment by school, classrooms, streams 2008-2010
Year No of
school
No. of
classroomsStream
No. Enrolled Total M + F
Male Female
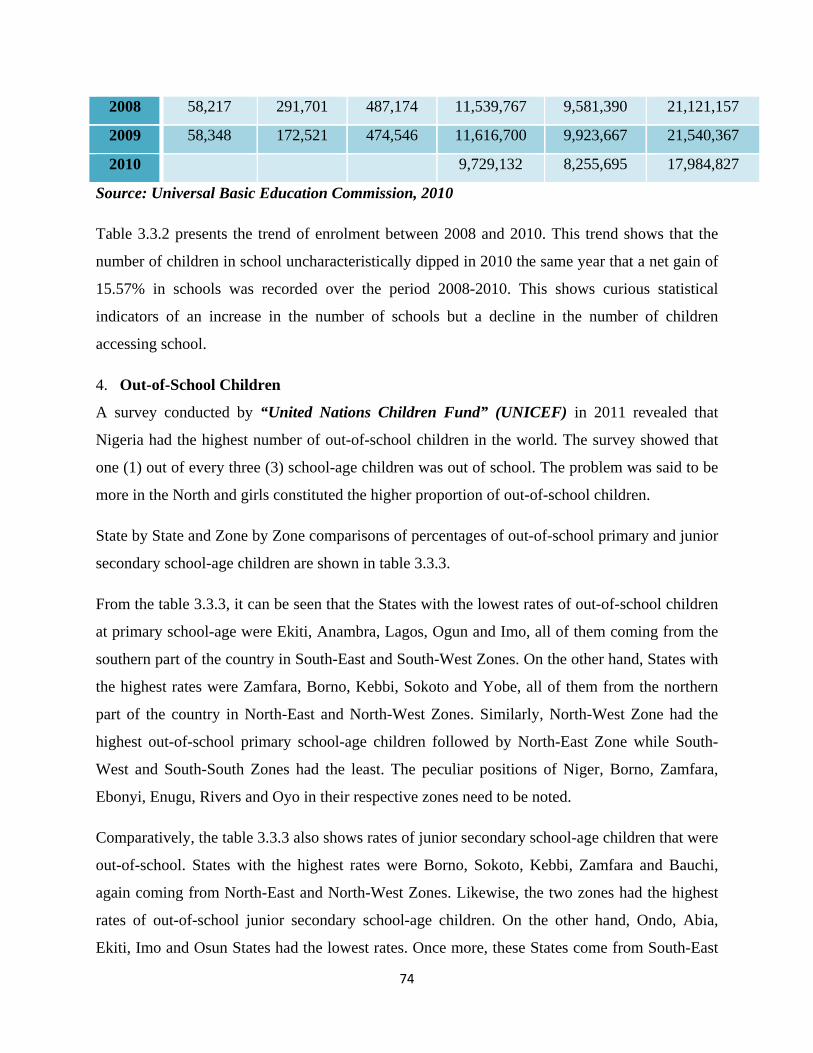
74
2008 58,217 291,701 487,174 11,539,767 9,581,390 21,121,157
2009 58,348 172,521 474,546 11,616,700 9,923,667 21,540,367
2010 9,729,132 8,255,695 17,984,827
Source: Universal Basic Education Commission, 2010
Table 3.3.2 presents the trend of enrolment between 2008 and 2010. This trend shows that the
number of children in school uncharacteristically dipped in 2010 the same year that a net gain of
15.57% in schools was recorded over the period 2008-2010. This shows curious statistical
indicators of an increase in the number of schools but a decline in the number of children
accessing school.
4. Out-of-School Children
A survey conducted by “United Nations Children Fund” (UNICEF) in 2011 revealed that
Nigeria had the highest number of out-of-school children in the world. The survey showed that
one (1) out of every three (3) school-age children was out of school. The problem was said to be
more in the North and girls constituted the higher proportion of out-of-school children.
State by State and Zone by Zone comparisons of percentages of out-of-school primary and junior
secondary school-age children are shown in table 3.3.3.
From the table 3.3.3, it can be seen that the States with the lowest rates of out-of-school children
at primary school-age were Ekiti, Anambra, Lagos, Ogun and Imo, all of them coming from the
southern part of the country in South-East and South-West Zones. On the other hand, States with
the highest rates were Zamfara, Borno, Kebbi, Sokoto and Yobe, all of them from the northern
part of the country in North-East and North-West Zones. Similarly, North-West Zone had the
highest out-of-school primary school-age children followed by North-East Zone while South-
West and South-South Zones had the least. The peculiar positions of Niger, Borno, Zamfara,
Ebonyi, Enugu, Rivers and Oyo in their respective zones need to be noted.
Comparatively, the table 3.3.3 also shows rates of junior secondary school-age children that were
out-of-school. States with the highest rates were Borno, Sokoto, Kebbi, Zamfara and Bauchi,
again coming from North-East and North-West Zones. Likewise, the two zones had the highest
rates of out-of-school junior secondary school-age children. On the other hand, Ondo, Abia,
Ekiti, Imo and Osun States had the lowest rates. Once more, these States come from South-East
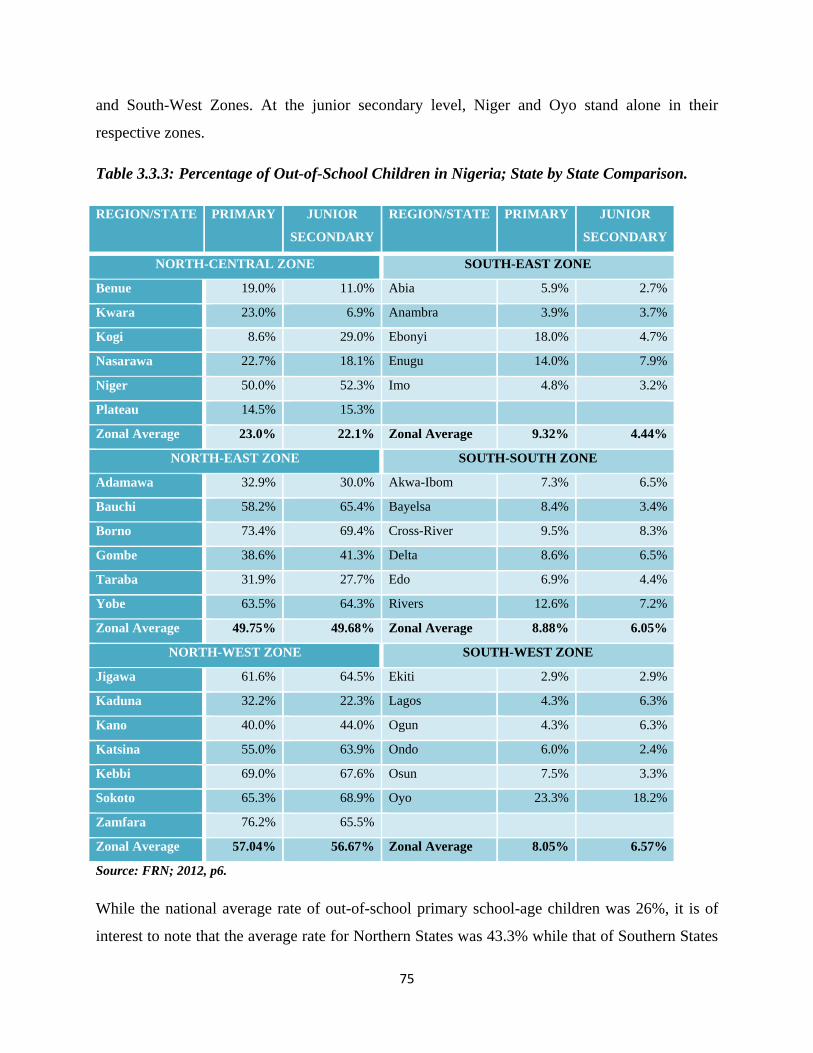
75
and South-West Zones. At the junior secondary level, Niger and Oyo stand alone in their
respective zones.
Table 3.3.3: Percentage of Out-of-School Children in Nigeria; State by State Comparison.
REGION/STATE PRIMARY JUNIOR
SECONDARY
REGION/STATE PRIMARY JUNIOR
SECONDARY
NORTH-CENTRAL ZONE SOUTH-EAST ZONE
Benue 19.0% 11.0% Abia 5.9% 2.7%
Kwara 23.0% 6.9% Anambra 3.9% 3.7%
Kogi 8.6% 29.0% Ebonyi 18.0% 4.7%
Nasarawa 22.7% 18.1% Enugu 14.0% 7.9%
Niger 50.0% 52.3% Imo 4.8% 3.2%
Plateau 14.5% 15.3%
Zonal Average 23.0% 22.1% Zonal Average 9.32% 4.44%
NORTH-EAST ZONE SOUTH-SOUTH ZONE
Adamawa 32.9% 30.0% Akwa-Ibom 7.3% 6.5%
Bauchi 58.2% 65.4% Bayelsa 8.4% 3.4%
Borno 73.4% 69.4% Cross-River 9.5% 8.3%
Gombe 38.6% 41.3% Delta 8.6% 6.5%
Taraba 31.9% 27.7% Edo 6.9% 4.4%
Yobe 63.5% 64.3% Rivers 12.6% 7.2%
Zonal Average 49.75% 49.68% Zonal Average 8.88% 6.05%
NORTH-WEST ZONE SOUTH-WEST ZONE
Jigawa 61.6% 64.5% Ekiti 2.9% 2.9%
Kaduna 32.2% 22.3% Lagos 4.3% 6.3%
Kano 40.0% 44.0% Ogun 4.3% 6.3%
Katsina 55.0% 63.9% Ondo 6.0% 2.4%
Kebbi 69.0% 67.6% Osun 7.5% 3.3%
Sokoto 65.3% 68.9% Oyo 23.3% 18.2%
Zamfara 76.2% 65.5%
Zonal Average 57.04% 56.67% Zonal Average 8.05% 6.57%
Source: FRN; 2012, p6.
While the national average rate of out-of-school primary school-age children was 26%, it is of
interest to note that the average rate for Northern States was 43.3% while that of Southern States
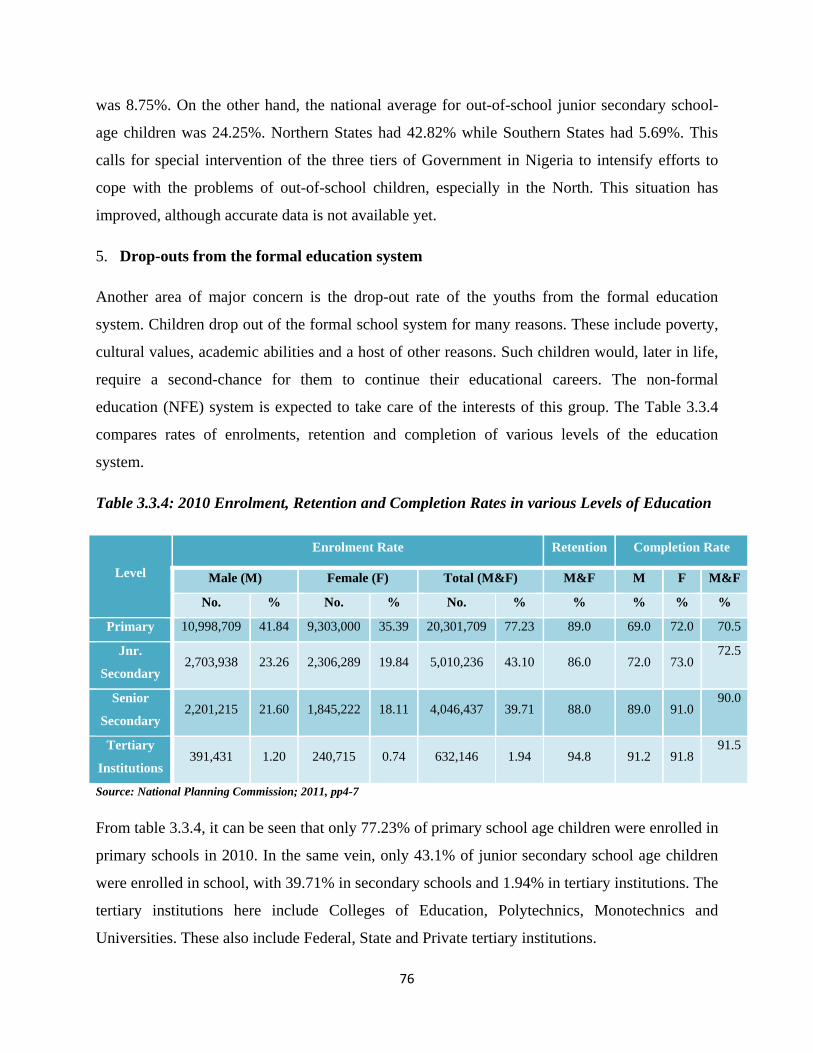
76
was 8.75%. On the other hand, the national average for out-of-school junior secondary school-
age children was 24.25%. Northern States had 42.82% while Southern States had 5.69%. This
calls for special intervention of the three tiers of Government in Nigeria to intensify efforts to
cope with the problems of out-of-school children, especially in the North. This situation has
improved, although accurate data is not available yet.
5. Drop-outs from the formal education system
Another area of major concern is the drop-out rate of the youths from the formal education
system. Children drop out of the formal school system for many reasons. These include poverty,
cultural values, academic abilities and a host of other reasons. Such children would, later in life,
require a second-chance for them to continue their educational careers. The non-formal
education (NFE) system is expected to take care of the interests of this group. The Table 3.3.4
compares rates of enrolments, retention and completion of various levels of the education
system.
Table 3.3.4: 2010 Enrolment, Retention and Completion Rates in various Levels of Education
Level
Enrolment Rate Retention Completion Rate
Male (M) Female (F) Total (M&F) M&F M F M&F
No. % No. % No. % % % % %
Primary 10,998,709 41.84 9,303,000 35.39 20,301,709 77.23 89.0 69.0 72.0 70.5
Jnr.
Secondary 2,703,938 23.26 2,306,289 19.84 5,010,236 43.10 86.0 72.0 73.0
72.5
Senior
Secondary 2,201,215 21.60 1,845,222 18.11 4,046,437 39.71 88.0 89.0 91.0
90.0
Tertiary
Institutions 391,431 1.20 240,715 0.74 632,146 1.94 94.8 91.2 91.8
91.5
Source: National Planning Commission; 2011, pp4-7
From table 3.3.4, it can be seen that only 77.23% of primary school age children were enrolled in
primary schools in 2010. In the same vein, only 43.1% of junior secondary school age children
were enrolled in school, with 39.71% in secondary schools and 1.94% in tertiary institutions. The
tertiary institutions here include Colleges of Education, Polytechnics, Monotechnics and
Universities. These also include Federal, State and Private tertiary institutions.
77
A comparison of enrolment in senior secondary education level to that of tertiary education level
depicts the inadequacy of the carrying capacities of the tertiary institutions leading to the larger
portion of graduates of senior education ending as out-of-school youths looking for second-
chance to continue their education career.
Comparison of retention and completion rates as presented in table 3.3.4 as well shows that all
those dropping out of the formal school system, for one reason or another, constitute the out-of-
school youths. These are the productive elements of the population for whom skills as provided
under TVET must be made available.
6. Strategic imperatives for meeting EFA goal 3
Government recognizes the fact that the focus of goal 3 is on skills and learning opportunities for
young people provided through technical and vocational education programmes. The various
programmes initiated by government are aimed at strengthening the transition from school to the
world of work, in offering second chances and in combating marginalization. This section
presents some strategic actions that could widen access to technical and vocational education and
training.
7. Enhanced image and visibility for TVET
Government plans to work at enhancing the low status of technical and vocational education and
training by according greater recognition to skills. Through the vocationalisation of secondary
school education, government has begun a recognition and articulation of the centrality of skills
in the overall national development agenda. It is expected that by so doing, government would
revisit the policy provision for streaming into TVET in the National Policy on Education.
8. Recognition and standards
A major crippling factor against skills development is the low recognition of artisanal skills
perhaps occasioned by the often hasty completion and poor packaging of products and services.
Because a number of artisans are not even able to attach appropriate monetary value to their
work, they are not able to earn a livelihood from their skills. This is a big challenge leading to
exploitation of both customer and client. The perceived negative return on investment in turn
fuels rejection of such skills and limits acquisition of them among young people and adults. It is
78
hoped that government would initiate a regulated system of pricing to ensure that both customer
and client are protected. There are recognized guilds and societies for most crafts and skills.
Such guilds can be supported to enforce standards among practitioners as well as protect clients
who need to seek redress for a job not well done.
9. Certification
There is need for a National Vocational Qualifications Framework (NVQF) which can categorise
and weigh the skills and competences offered in technical and vocational education and training
and locate them at commensurate levels in the NVQF. This is already being driven by the
National Board for Technical Education (NBTE). It is important to have this framework finalised
as quickly as possible. In 2014, NBTE began the process of certifying skills and appropriating
them for NVQF. This will help to streamline and clean up practice in that area.
10. Vocationalisation of education at all levels
This is about the most effective way of tackling stigma as well as ensuring availability of skills
for national development. This option exposes learners early to both academic and vocational
education. It is important to review the start of the programme as by the senior secondary level, a
number of students have left school whereas if this began at upper secondary practical skills
would have been consolidated by then.
11. Enhanced funding
Technical and vocational education and training is not a cheap programme to run. Current
provision is seriously hampered by lack of equipment around technical colleges while the VEIs
are equally not yet freely available. There must be increased funding of this sub-sector to enable
acquisition of the equipment that are very crucial for practical training.
12. Companies must play a role
Companies will gain from a useful collaborative relationship with government in workplace
training. Participating companies would have a pool of persons who may have become familiar
with their processes as well as have an opportunity to feed information on work demands into the
79
education system. This will bridge the current disconnect between education and the world of
work.
80
Achieving a 50 percent improvement in levels of adult literacy by 2015, especially for women, and equitable
access to basic and continuing education for all adults.
3.4 – Improving Adult Literacy
EFA GOAL 4
1. Introduction
Nigeria is one of the E-9 member countries that are responsible for three-quarters (3/4) of the
world’s illiterate adults, two-third (2/3) of whom are women. This signifies that over the years,
the marginalized groups have continued to be denied educational opportunities (EFA 2013/14:
p1). Literacy levels have merely marginally increased and women remain lower in the rung of its
attainment. Literacy programmes are offered largely through the non-formal means. It has
therefore become imperative to think of post 2015 strategies of reaching the educational needs of
the disadvantaged groups in addition to meeting the new challenges in the provision of
educational opportunities. Before then, the discussion begins with analysis of the policy/legal
framework of NFE, within the context of national and international commitments including
Jomtien Declaration on Education (1990) and the Dakar Frame Work of Action (2000).
However, the following discussion is concerned with the target beneficiaries of NFE
programmes. It examines the population of out-of-school youths and illiterate adults in relation
to the national population, progress made, as well as lessons learnt and the way forward.
The Constitution of the Federal Republic of Nigeria (1999): In addition to recognizing
the need for adequate and equitable distribution of educational facilities for all Nigerians,
Section 18(3) (c) of the Constitution stipulates that:-
Government shall strive to eradicate illiteracy; and, to this end, Government shall,
as and when practicable, provide: . . . free adult literacy programme. (FRN; 2011,
p35)
81
Hence, the Federal Government is committed to ensuring the rights of all citizens to education
and knowledge in order to live meaningful life. In pursuance of this constitutional provision, the
Basic Framework of Action to meet the Basic Learning needs was developed for implementation
by national agencies, States and Local Governments.
2. Progress Made towards non-formal and Adult Education
In commitment to targets and actions for non-formal education which will enable its citizenry
live more fulfilled and productive lives and contribute to national development and the
consolidation of democracy, a range of provisions were made.
Legal and Policy Framework and establishment of National Institutions
National Commission for Mass Literacy, Adult and Non-Formal Education (NMEC):
Established under Decree No. 17 of June, 1990: The Commission is charged with the
responsibility of: making literate all those who, for one reason or the other, did not or
cannot benefit from formal school system. These include out-of-school youths, children in
the street, women in purdah, victims of teenage motherhood (VVF), nomadic illiterate
people, almajiris and migrant fishing folk (NMEC; 2010, p2).
A Blueprint on NFE was developed by Government to serve as a roadmap and to facilitate
the implementation of the objectives of NMEC.
“National Commission for Nomadic Education” (NCNE): Establishment in 2004 to
providing educational opportunities to the nomadic pastoralists and migrant fishing folk
(FME; 2013, p11).
NCNE complements the activities of NMEC in providing functional and relevant
educational programmes for children and young nomads and migrant fishing folk. The
programme facilitates their integration into the normal life and equips them to make
meaningful contributions to the nation’s socio–economic development. Beyond provision
of basic literacy classes, the Commission continuously engages relevant agencies and
professional bodies to train pastoralists on animal husbandry and modern dairy cattle
production, as well as business/financial management to empower the learner, as well as
encourage retainance.
.
82
The Universal Basic Education (UBE) was launched in 1999, in fulfillment of its
international obligation to the 1990 Jomtien Declaration and the Compulsory, Free,
Universal Basic Education Act, 2004, and other Related Matters (UBEC LAW).
The operations of “Universal Basic Education” embraces early childhood care and education,
the nine years of formal schooling, adult literacy and non-formal education, skills acquisition
programmes, girl-child and women, Almajiri, street children and disabled groups. (UBEC;
2005, P10).
Thus the main agency coordinating the implementation of basic education is “Universal Basic
Education Commission” (UBEC) as EFA Goals 3 and 4 are components of UBE, while NMEC
and NCNE are charged with responsibilities for adult and non-formal education and nomadic
education respectively.
The 1998 Edition of the “National Policy on Education” (NPE) laid down excellent
objectives for mass literacy, adult and non-formal education. The document also made
specific provision for policy makers and implementers and recommended the
establishment of the “State Agency for Mass Education” (SAME), in all the 36 States of
the Federation including the FCT, to in order to complement the effort of the Federal
Government, in eradication of illiteracy. The State Governments were also urged to
adequately fund these Agencies to effectively coordinate established NFE offices in each
of the Local Governments, in providing literacy programmes that fit the economic,
cultural, social and political needs of the illiterate adults in their respective areas of
jurisdiction (FRN; 1998, p36). NMEC maintains close working relationship with SAMEs
in the implementation of literacy programmes, including running and monitoring of
literacy classes.
Gender Parity and Equality in NFE: The plight of the girl child has been a universal
concern to the Nigerian Government. This led to the production of a National Gender
Policy in Basic Education meant to address the cultural attitudes and practices hindering
girls’ participation in education. The document also advocates for the need for
women/girls education as a roadmap to gender equality and social justice. This
development was followed by the production of curriculum for the girl child and
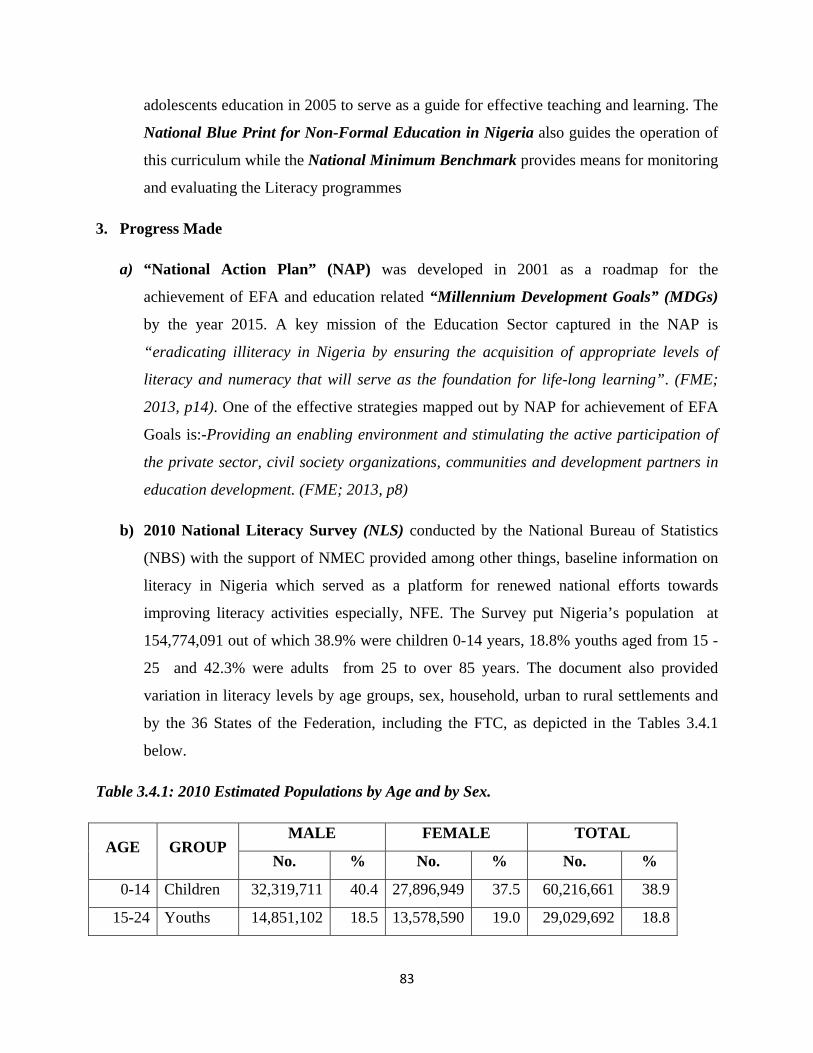
83
adolescents education in 2005 to serve as a guide for effective teaching and learning. The
National Blue Print for Non-Formal Education in Nigeria also guides the operation of
this curriculum while the National Minimum Benchmark provides means for monitoring
and evaluating the Literacy programmes
3. Progress Made
a) “National Action Plan” (NAP) was developed in 2001 as a roadmap for the
achievement of EFA and education related “Millennium Development Goals” (MDGs)
by the year 2015. A key mission of the Education Sector captured in the NAP is
“eradicating illiteracy in Nigeria by ensuring the acquisition of appropriate levels of
literacy and numeracy that will serve as the foundation for life-long learning”. (FME;
2013, p14). One of the effective strategies mapped out by NAP for achievement of EFA
Goals is:-Providing an enabling environment and stimulating the active participation of
the private sector, civil society organizations, communities and development partners in
education development. (FME; 2013, p8)
b) 2010 National Literacy Survey (NLS) conducted by the National Bureau of Statistics
(NBS) with the support of NMEC provided among other things, baseline information on
literacy in Nigeria which served as a platform for renewed national efforts towards
improving literacy activities especially, NFE. The Survey put Nigeria’s population at
154,774,091 out of which 38.9% were children 0-14 years, 18.8% youths aged from 15 -
25 and 42.3% were adults from 25 to over 85 years. The document also provided
variation in literacy levels by age groups, sex, household, urban to rural settlements and
by the 36 States of the Federation, including the FTC, as depicted in the Tables 3.4.1
below.
Table 3.4.1: 2010 Estimated Populations by Age and by Sex.
AGE GROUP MALE FEMALE TOTAL
No. % No. % No. %
0-14 Children 32,319,711 40.4 27,896,949 37.5 60,216,661 38.9
15-24 Youths 14,851,102 18.5 13,578,590 19.0 29,029,692 18.8
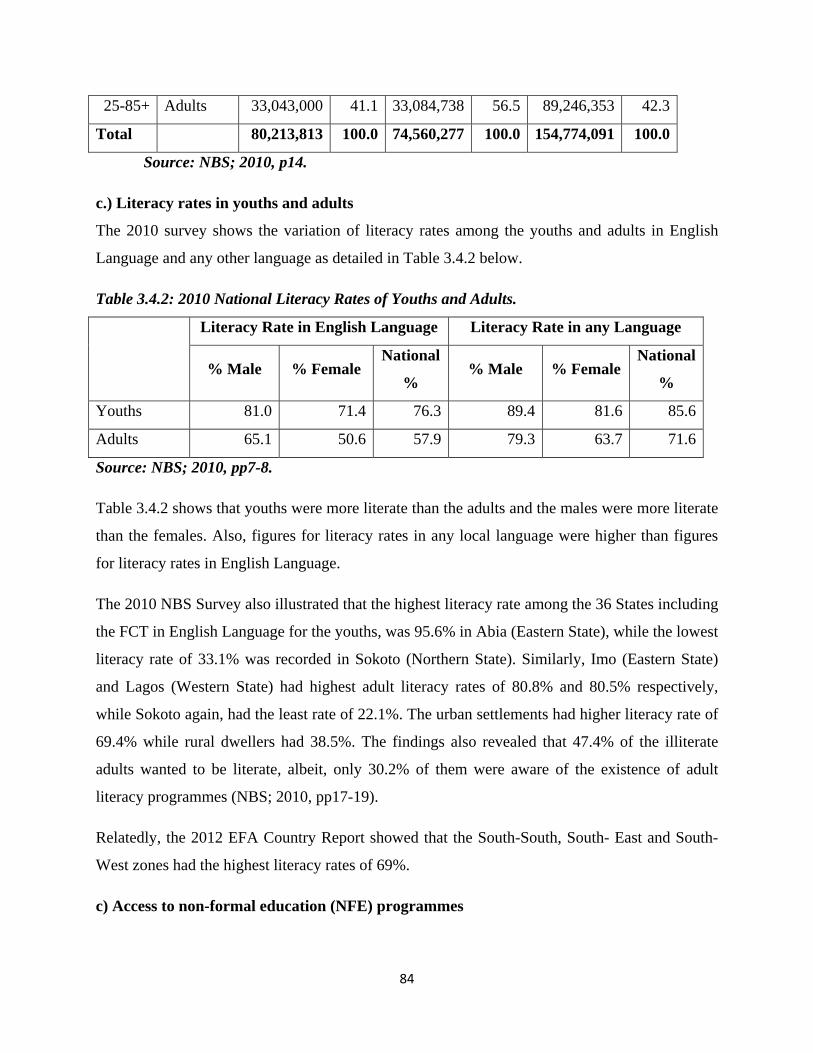
84
25-85+ Adults 33,043,000 41.1 33,084,738 56.5 89,246,353 42.3
Total 80,213,813 100.0 74,560,277 100.0 154,774,091 100.0
Source: NBS; 2010, p14.
c.) Literacy rates in youths and adults
The 2010 survey shows the variation of literacy rates among the youths and adults in English
Language and any other language as detailed in Table 3.4.2 below.
Table 3.4.2: 2010 National Literacy Rates of Youths and Adults.
Literacy Rate in English Language Literacy Rate in any Language
% Male % Female National
% % Male % Female
National
%
Youths 81.0 71.4 76.3 89.4 81.6 85.6
Adults 65.1 50.6 57.9 79.3 63.7 71.6
Source: NBS; 2010, pp7-8.
Table 3.4.2 shows that youths were more literate than the adults and the males were more literate
than the females. Also, figures for literacy rates in any local language were higher than figures
for literacy rates in English Language.
The 2010 NBS Survey also illustrated that the highest literacy rate among the 36 States including
the FCT in English Language for the youths, was 95.6% in Abia (Eastern State), while the lowest
literacy rate of 33.1% was recorded in Sokoto (Northern State). Similarly, Imo (Eastern State)
and Lagos (Western State) had highest adult literacy rates of 80.8% and 80.5% respectively,
while Sokoto again, had the least rate of 22.1%. The urban settlements had higher literacy rate of
69.4% while rural dwellers had 38.5%. The findings also revealed that 47.4% of the illiterate
adults wanted to be literate, albeit, only 30.2% of them were aware of the existence of adult
literacy programmes (NBS; 2010, pp17-19).
Relatedly, the 2012 EFA Country Report showed that the South-South, South- East and South-
West zones had the highest literacy rates of 69%.
c) Access to non-formal education (NFE) programmes
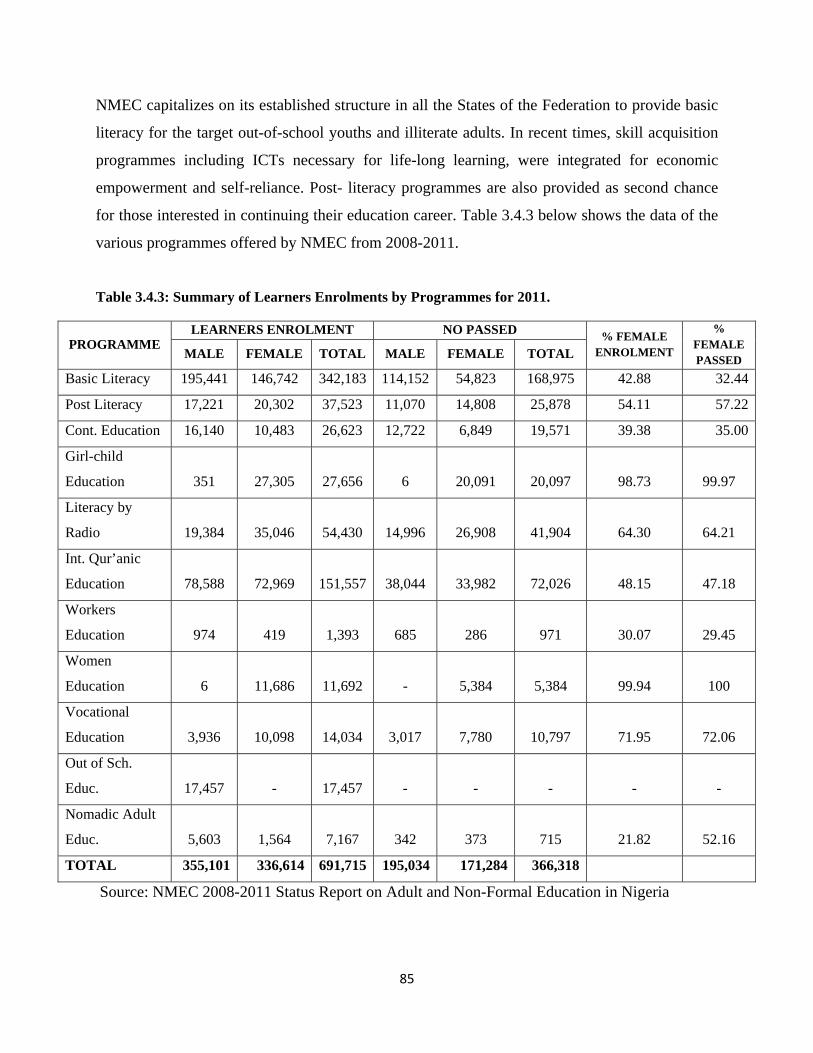
85
NMEC capitalizes on its established structure in all the States of the Federation to provide basic
literacy for the target out-of-school youths and illiterate adults. In recent times, skill acquisition
programmes including ICTs necessary for life-long learning, were integrated for economic
empowerment and self-reliance. Post- literacy programmes are also provided as second chance
for those interested in continuing their education career. Table 3.4.3 below shows the data of the
various programmes offered by NMEC from 2008-2011.
Table 3.4.3: Summary of Learners Enrolments by Programmes for 2011.
PROGRAMME LEARNERS ENROLMENT NO PASSED % FEMALE
ENROLMENT
% FEMALE PASSED MALE FEMALE TOTAL MALE FEMALE TOTAL
Basic Literacy 195,441 146,742 342,183 114,152 54,823 168,975 42.88 32.44
Post Literacy 17,221 20,302 37,523 11,070 14,808 25,878 54.11 57.22
Cont. Education 16,140 10,483 26,623 12,722 6,849 19,571 39.38 35.00
Girl-child
Education 351 27,305 27,656 6 20,091 20,097 98.73 99.97
Literacy by
Radio 19,384 35,046 54,430 14,996 26,908 41,904 64.30 64.21
Int. Qur’anic
Education 78,588 72,969 151,557 38,044 33,982 72,026 48.15 47.18
Workers
Education 974 419 1,393 685 286 971 30.07 29.45
Women
Education 6 11,686 11,692 - 5,384 5,384 99.94 100
Vocational
Education 3,936 10,098 14,034 3,017 7,780 10,797 71.95 72.06
Out of Sch.
Educ. 17,457 - 17,457 - - - - -
Nomadic Adult
Educ. 5,603 1,564 7,167 342 373 715 21.82 52.16
TOTAL 355,101 336,614 691,715 195,034 171,284 366,318
Source: NMEC 2008-2011 Status Report on Adult and Non-Formal Education in Nigeria
86
The highest enrolments were in Basic Literacy, Integrated Qur’anic Education, Literacy by
Radio and Post Literacy programmes. Out of the 691,715 registered learners, 585,693,
representing 84.67%, were enrolled in these programmes. The next popular programmes were
Girl-Child Education and Continuing Education. The programmes geared towards skills
acquisition attracted more than 50% of female learners - Women Education, Girl- child
Education, Vocational Education, Literacy by Radio and Post Literacy.
4. Other Progress towards EFA goal 4
The Government of Nigeria has initiated the following programmes driven by FME in
collaboration with related agencies, IDPs and stakeholders as it strives to eradicate illiteracy.
i) REFLECT- “Regenerated Freirean Literacy through Empowering Community
Techniques”. The main objective of REFLECT is to empower communities in functional
literacy and provide opportunity for participants to be more knowledgeable and conscious of
their rights and privileges, in order to take informed decisions to enhance their livelihood. The
programme implementation was targeted at the less privileged, the poor, the marginalized and
the excluded persons. Major achievements of the programme:
o Participants have taken ownership of the programme and developed their learning
materials to meet their needs thus establishing the linkage between literacy community
development issues.
o Establishment of more than 100 REFLECT communities nationwide from 1997 – 2010;
o Over five hundred thousand (500,000) illiterates made literate through this strategy.
(FRN; 2012, p8)
ii) “Literacy by Radio” Programme: The programme was launched in 2009 by NMEC with
the assistance of UNESCO, UNICEF and other government agencies to increase access for adult
and non-formal education learners. It provided opportunity for the delivery of basic literacy to a
large number of learners across the nation through the mass media, as well as enhanced reading,
writing among learners irrespective of location, age, gender, socio-cultural, and economic
circumstances. The success of the Literacy by Radio programme was achieved through
advocacy, sensitization and mobilization of stakeholders in addition to distribution of transistor
87
radio sets to the target learners through SAME. Financial support was also provided to State
Agencies at the cost of N2.1m per state in 2008, for the payment of airtime. Major achievements:
o 83.3% success was recorded in the pilot programme in 12 States which informed scaling-
up to all the 36 States of the Federation including the FCT.
o Improvement on Learners’ knowledge and practice in health and nutrition including
HIV/AIDS. Learners also learnt more about civic education and entrepreneurial/life
skills while acquiring literacy.
iii) Establishment of Model Literacy Centres: The Government through the support of IDPs
have established and equipped model literacy/Skill acquisition centres in all 774 Local
Government Areas, to cater for out-of-school children and adult and enable them mainstream
into the formal school system. Post literacy programmes are also offered at the centres.
However, the centres in the Northern States give priority to young girls who drop out of schools
because of poverty, early marriage or unwanted pregnancies. In Eastern and Southern States, the
focus is on boy-child drop-outs. The activities of these centres have been scaled –up in recent
times with the initiation of the Girl Education Programme (GEP) and the Back- to -School
Programme for Boys. The major constraint of these Literacy and Acquisition Centres is the lack
of political will by most of the State Governments to sustain and fund the operations of the
centres especially, the payment of the allowances of the facilitators/instructors.
o NMEC is close in working relationship with the 36 State Agencies for Mass Education
(SAME) in NFE programmes implementation and conducts regular capacity building
programmes to improve.
iv) Promotion of indigenous languages in literacy delivery: NMEC and SAMEs developed
primers in 22 indigenous languages with the collaboration of the Nigerian Educational Research
and Development Council (NERDC) and other experts. The following Primers were developed
and produced between 2000 and 2012:
Primers Developed: Year of Production:
a) Social studies and Citizenship Education . . . . . . . . . . . . . . . . . . . . . …… 2000
b) Basic Science primer for Non-Formal Education . . . . . . . ….. . . . . . . . . 2000
c) Non Formal Education curriculum for Qur’anic Schools ….. . ….. . . . . . . .. 2003
88
d) Non-Formal Education curriculum for Out-of Schools Boys….. . . . . . . ….. 2003
e) Communication strategies for the Integration of Basic Education
into Qur’anic Schools ….. . . . . . . . . . . . . . . . . . . . . . . . . . . . . . . . . . . 2007
f) National Benchmark for Non-Formal Education & Integrating
Basic Education into Qur’anic Schools in Nigeria …. . . . . . . . . . . . . . . . … 2007
g) National Blueprint for Adult and Non-Formal Education in Nigeria. . ……. 2007
h) English for Non-Formal Education …... . . . . . . . . . . . . . . . . . . . . . . . . . . . 2008
i) Policies Issues and Practice …... . . . . . . . . . . . . . . . . . . . . . . . . . . . . . . . . . 2010
j) Customized Teaching and Learning materials . . . . . . . . . . . . . . . . . . . ….. 2012
v) Curriculum development: NMEC collaborated with UNICEF to develop Curricula for Basic
and Post Literacy levels, as well as those for Integrated Qur’anic Education, Girl Child
Education, Business Education and Vocational Education.
vi) Standardized Monitoring and Evaluation Instrument Developed: for monitoring and
evaluation with the guidelines for programme improvement, efficiency, logical framework
analysis and goal attainment scaling.
vii) “Each-One-Teach-One”: NMEC has produced jingles in three Major Nigerian Languages
(Hausa, Igbo and Yoruba) and is sponsoring the weekly sensitization program on NTA Channel
5 under the slogan of “Each-One-Teach-One”.
viii) E-Learning Package for Literacy and Community Based Learning
NMEC developed e-learning content for basic literacy based on innovation and good practices
from other E-9 countries, in particular India. The package is now being trial tested in some
literacy centres, the findings of which will aid successful implementation.
ix) Public-Private Partnership
Partnerships are forged and existing ones being strengthened to promote the cause of NFE in
Nigeria, more so, as NMEC is grossly underfunded. However, in 2012, the FGN developed the
Public–Private Partnerships Framework for Literacy in collaboration with UNESCO,
Bangladesh, Senegal and stakeholders, to syndicate and mobilize resources especially, for NFE.
NMEC collaborates with relevant stakeholders in jointly implementing NFE programmes.
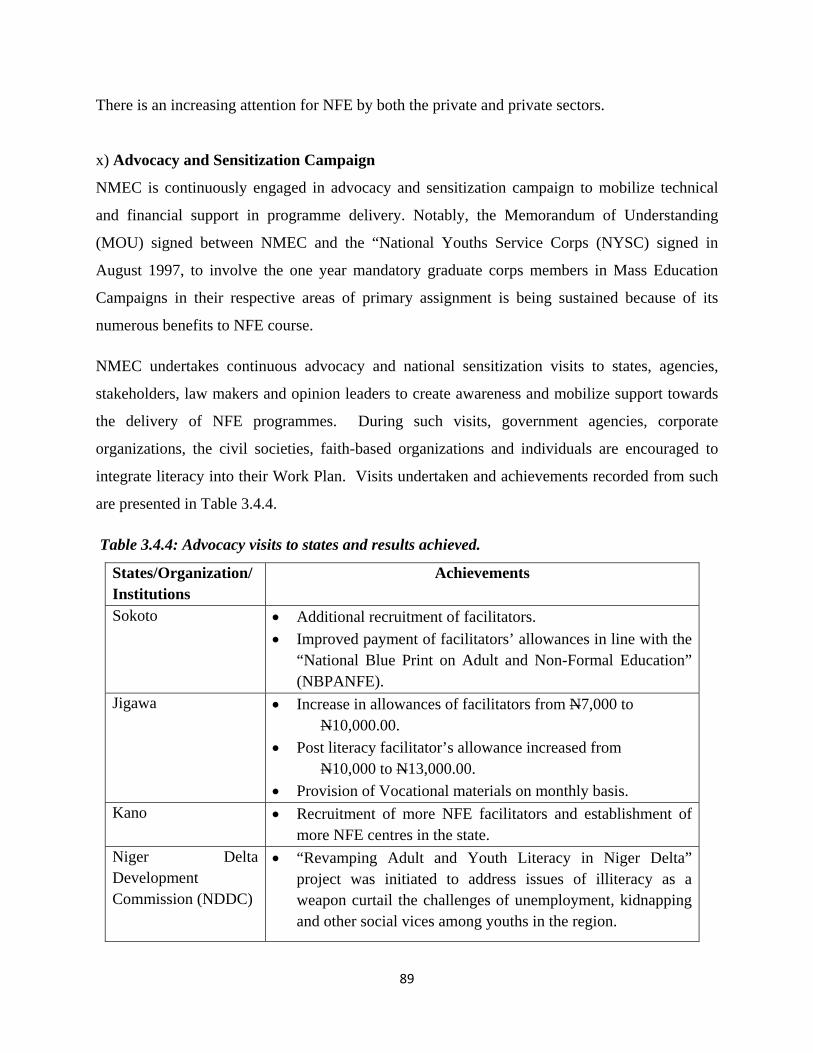
89
There is an increasing attention for NFE by both the private and private sectors.
x) Advocacy and Sensitization Campaign
NMEC is continuously engaged in advocacy and sensitization campaign to mobilize technical
and financial support in programme delivery. Notably, the Memorandum of Understanding
(MOU) signed between NMEC and the “National Youths Service Corps (NYSC) signed in
August 1997, to involve the one year mandatory graduate corps members in Mass Education
Campaigns in their respective areas of primary assignment is being sustained because of its
numerous benefits to NFE course.
NMEC undertakes continuous advocacy and national sensitization visits to states, agencies,
stakeholders, law makers and opinion leaders to create awareness and mobilize support towards
the delivery of NFE programmes. During such visits, government agencies, corporate
organizations, the civil societies, faith-based organizations and individuals are encouraged to
integrate literacy into their Work Plan. Visits undertaken and achievements recorded from such
are presented in Table 3.4.4.
Table 3.4.4: Advocacy visits to states and results achieved.
States/Organization/ Institutions
Achievements
Sokoto Additional recruitment of facilitators.
Improved payment of facilitators’ allowances in line with the “National Blue Print on Adult and Non-Formal Education” (NBPANFE).
Jigawa Increase in allowances of facilitators from N7,000 to N10,000.00.
Post literacy facilitator’s allowance increased from N10,000 to N13,000.00.
Provision of Vocational materials on monthly basis. Kano Recruitment of more NFE facilitators and establishment of
more NFE centres in the state. Niger Delta Development Commission (NDDC)
“Revamping Adult and Youth Literacy in Niger Delta” project was initiated to address issues of illiteracy as a weapon curtail the challenges of unemployment, kidnapping and other social vices among youths in the region.
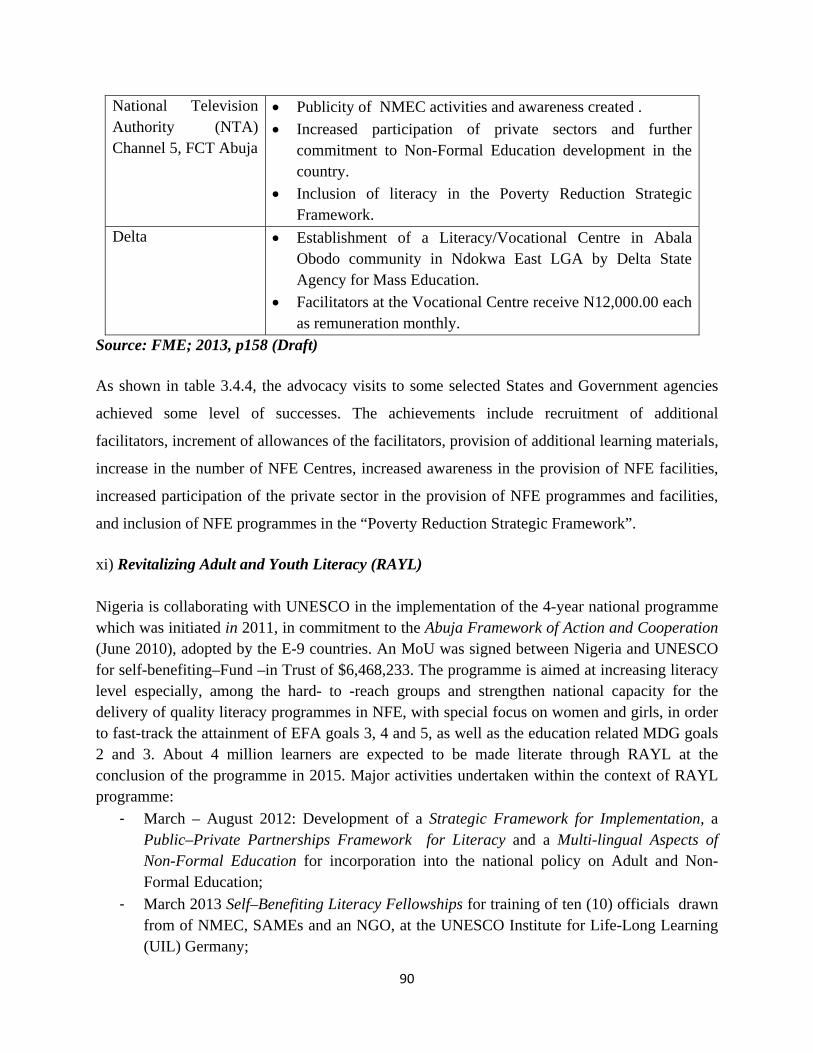
90
National Television Authority (NTA) Channel 5, FCT Abuja
Publicity of NMEC activities and awareness created .
Increased participation of private sectors and further commitment to Non-Formal Education development in the country.
Inclusion of literacy in the Poverty Reduction Strategic Framework.
Delta Establishment of a Literacy/Vocational Centre in Abala Obodo community in Ndokwa East LGA by Delta State Agency for Mass Education.
Facilitators at the Vocational Centre receive N12,000.00 each as remuneration monthly.
Source: FME; 2013, p158 (Draft)
As shown in table 3.4.4, the advocacy visits to some selected States and Government agencies
achieved some level of successes. The achievements include recruitment of additional
facilitators, increment of allowances of the facilitators, provision of additional learning materials,
increase in the number of NFE Centres, increased awareness in the provision of NFE facilities,
increased participation of the private sector in the provision of NFE programmes and facilities,
and inclusion of NFE programmes in the “Poverty Reduction Strategic Framework”.
xi) Revitalizing Adult and Youth Literacy (RAYL) Nigeria is collaborating with UNESCO in the implementation of the 4-year national programme which was initiated in 2011, in commitment to the Abuja Framework of Action and Cooperation (June 2010), adopted by the E-9 countries. An MoU was signed between Nigeria and UNESCO for self-benefiting–Fund –in Trust of $6,468,233. The programme is aimed at increasing literacy level especially, among the hard- to -reach groups and strengthen national capacity for the delivery of quality literacy programmes in NFE, with special focus on women and girls, in order to fast-track the attainment of EFA goals 3, 4 and 5, as well as the education related MDG goals 2 and 3. About 4 million learners are expected to be made literate through RAYL at the conclusion of the programme in 2015. Major activities undertaken within the context of RAYL programme:
- March – August 2012: Development of a Strategic Framework for Implementation, a Public–Private Partnerships Framework for Literacy and a Multi-lingual Aspects of Non-Formal Education for incorporation into the national policy on Adult and Non-Formal Education;
- March 2013 Self–Benefiting Literacy Fellowships for training of ten (10) officials drawn from of NMEC, SAMEs and an NGO, at the UNESCO Institute for Life-Long Learning (UIL) Germany;
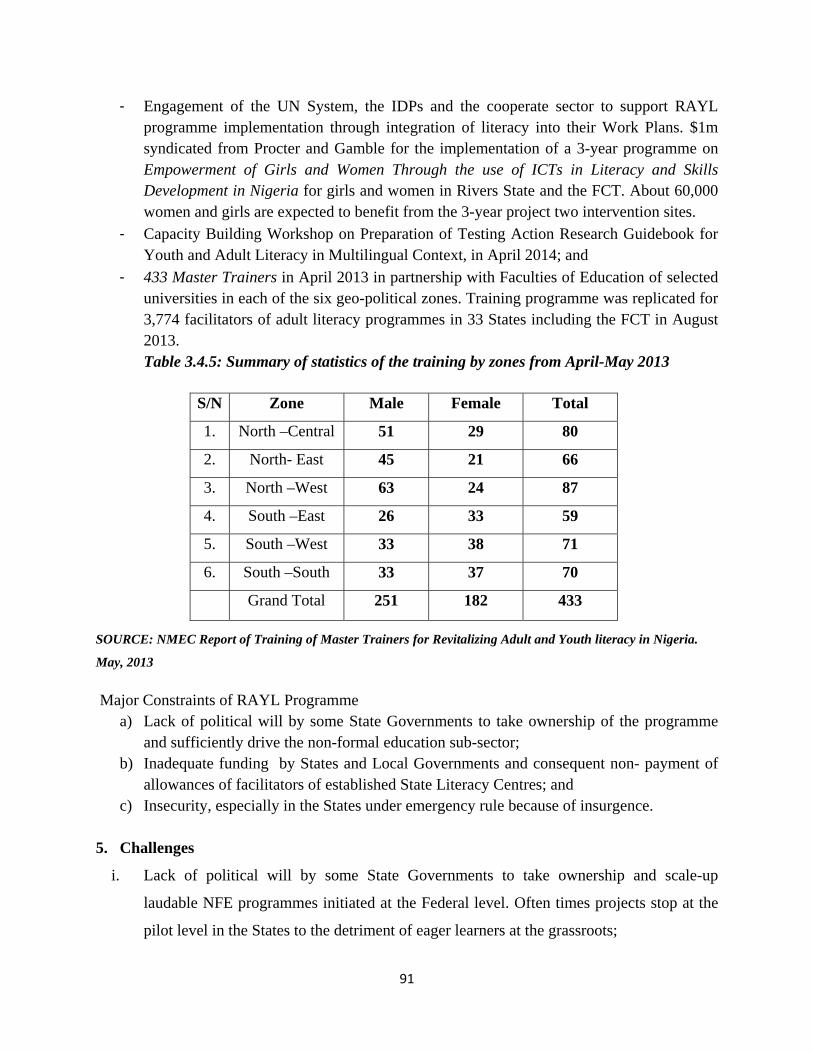
91
- Engagement of the UN System, the IDPs and the cooperate sector to support RAYL programme implementation through integration of literacy into their Work Plans. $1m syndicated from Procter and Gamble for the implementation of a 3-year programme on Empowerment of Girls and Women Through the use of ICTs in Literacy and Skills Development in Nigeria for girls and women in Rivers State and the FCT. About 60,000 women and girls are expected to benefit from the 3-year project two intervention sites.
- Capacity Building Workshop on Preparation of Testing Action Research Guidebook for Youth and Adult Literacy in Multilingual Context, in April 2014; and
- 433 Master Trainers in April 2013 in partnership with Faculties of Education of selected universities in each of the six geo-political zones. Training programme was replicated for 3,774 facilitators of adult literacy programmes in 33 States including the FCT in August 2013. Table 3.4.5: Summary of statistics of the training by zones from April-May 2013
S/N Zone Male Female Total
1. North –Central 51 29 80
2. North- East 45 21 66
3. North –West 63 24 87
4. South –East 26 33 59
5. South –West 33 38 71
6. South –South 33 37 70
Grand Total 251 182 433
SOURCE: NMEC Report of Training of Master Trainers for Revitalizing Adult and Youth literacy in Nigeria.
May, 2013
Major Constraints of RAYL Programme a) Lack of political will by some State Governments to take ownership of the programme
and sufficiently drive the non-formal education sub-sector; b) Inadequate funding by States and Local Governments and consequent non- payment of
allowances of facilitators of established State Literacy Centres; and c) Insecurity, especially in the States under emergency rule because of insurgence.
5. Challenges
i. Lack of political will by some State Governments to take ownership and scale-up
laudable NFE programmes initiated at the Federal level. Often times projects stop at the
pilot level in the States to the detriment of eager learners at the grassroots;
92
ii. Inadequate funding of the NFE sector by all levels of Government hence NFE is mostly
supported by IDPs and largely driven by the civil society and faith-based organizations;
iii. Non-payment or under payment of approved allowances of facilitators of established
literacy and skill acquisition centres;
iv. Inadequate data to aid planning and monitoring and literacy delivery and participation;
v. Negative cultural attitudes and practices hindering the full participation of girls’ in
education programme especially, in the Northern region;
vi. Lack of synergy of efforts and resources among literacy related agencies; and
vii. Recent insecurity by insurgent in some parts of the country.
6. Way Forward
i. Continuous advocacy and sensitization, as well as innovative strategies to highlight the
relevance of NFE to individual and national development, in order to improve political
will, and ultimately syndicate adequate financial and material resources;
ii. Urgent and similar attention given to the formal education by all levels of government is
needed to support the NFE, in view of the potentials of NFE to provide opportunity for
school drop-outs, youth and adults illiterates to improve their self-esteem, acquire basic
and life skill and more importantly provide employment.
iii. Regular dialogue and networking among literacy related Government agencies to share
information and experiences for more integrated delivery of NFE programmes;
iv. Strengthening the capacity and funding of Nigerian Education Information System
(NEMIS) to process and provide accurate data for effective planning and monitoring of
NFE programmes;
v. Effective implementation of the Girl Education Programme (GEP) and the Back- to -
School Programme for Boys initiatives by all stakeholders;
vi. NMEC should be adequately funded to carry out its mandate; and
vii. Strengthening of security measures across the country.
93
3.5 –Gender Parity and Equality in Education
EFA GOAL 5
1. Introduction
Inequality as it relates to gender is an endemic reality which is aptly described in very strong
terms from both global and local perspectives. Women are more than fifty percent of the world’s
population. They perform two – thirds of the world’s work, yet receive one- tenth of the world’s
income and own one – hundredth of the world’s property. They represent a staggering seventy
percent of the world’s one billion poorest people. With an estimated population of over
162million, Nigeria has the highest population among African nations and is ranked the world’s
seventh most populated country. About 49% of the Nigerian population (approximately 80.2
million) is female. Out of this number, 38% of women lack formal education while only 25% is
recorded for the males in this category. These figures have serious implications for national
development. As rightly observed by the UN Secretary – General Ban Ki-Moon, no appreciable
development can be made either at the local, national or international platform without
recognizing girls and women as equal players in the game of life whilst empowering, up- skilling
and investing in them for a better world. Ban Ki- Moon further declared that when we empower
women and girls, we empower communities, nations and entire human family.
In view of the fore-going, issues related to gender (parity and equity), occupy a central place in
tracking progress towards the attainment of EFA goals. The EFA GMR (2013) provides a
framework for distinguishing between “gender parity” and “equality in education”. Thus, it
explains that while gender parity means equal enrolment ratio for girls and boys, equality in
education portends a schooling environment that is free of discrimination and provides equal
Eliminating gender disparities in primary and secondary education by 2005, and achieving gender equality in
education in literacy by 2015, with a focus on ensuring girls’ full access to and achievement in basic education of good
quality.
94
opportunities for boys and girls to realize their potentials. Furthermore, it was observed that
gender parity is just the first step towards EFA Goal 5. Other steps include: making sure that
school environment is safe and improving facilities by
Providing separate conveniences for girls and boys;
Training teachers in gender sensitivity;
Achieving gender balance among teachers; and
Rewriting curricular and textbooks to remove gender stereotypes (GMR2013).
2. Antecedents/ Situation Analysis
The EFA Goal 5 aims at eliminating gender disparity in primary and secondary education by
2015. All countries, Nigeria inclusive pledged to ensure that this Goal is delivered by 2015.
Contrary to expectations, the 2003/2004 edition of the EFA Global Monitoring Report warned
that many nations were not likely to achieve this goal judging from indicative trends. In Nigeria,
there has been a history of sometimes, gaping disparities between the education that boys and
girls receive. In some parts of Nigeria, many girls do not have access to adequate education past
a certain age. Currently, the female adult literacy rate (ages 15 and above) for the country is
59.4% as compared to the male adult literacy rate of 74.4%. Disparity in education is what has
given rise to this gap in literacy. According to the Central Bank of Nigeria the gender gap in
literacy rates at the rural level between boys and girls was 18.3 percent in favour of the boys in
overall rating. However, in the age group 6–9 years (primary school ages) it was only 3.9 percent
in favour of boys. This indicates that there is a gender dimension to educational attainment and
development in Nigeria. Apart from the disparities in enrolment, there are still other problems,
such as high drop-out rates of females, poor performance, reluctance on the part of females to
enroll in traditionally male dominated courses and poor classroom participation. Across various
geo-political zones in Nigeria, a greater percentage of school-age girls are needlessly out-of-
school, compared with the ratio applicable to boys of same age grouping.
Thus, in Nigeria, even though education has been conceptualized as a universal human right,
gender inequality across regions often prevent women and girls from accessing it. The popular
view is that the situation calls for gender – responsive educational processes which have the
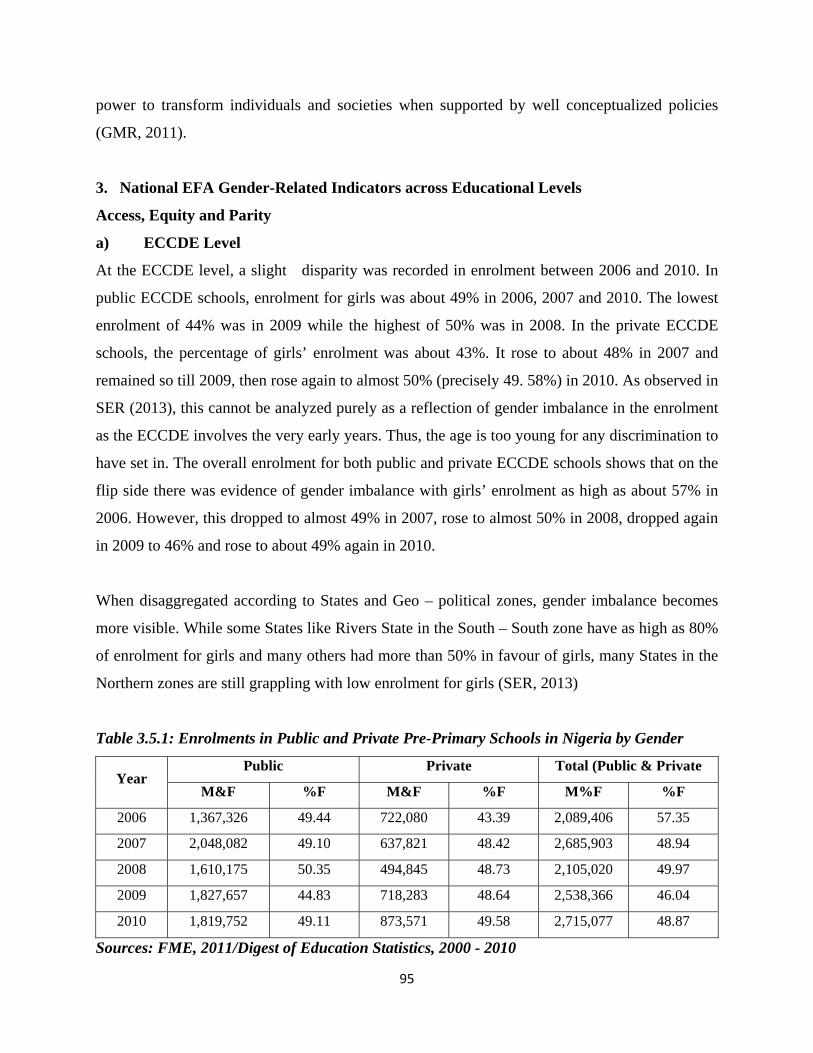
95
power to transform individuals and societies when supported by well conceptualized policies
(GMR, 2011).
3. National EFA Gender-Related Indicators across Educational Levels
Access, Equity and Parity
a) ECCDE Level
At the ECCDE level, a slight disparity was recorded in enrolment between 2006 and 2010. In
public ECCDE schools, enrolment for girls was about 49% in 2006, 2007 and 2010. The lowest
enrolment of 44% was in 2009 while the highest of 50% was in 2008. In the private ECCDE
schools, the percentage of girls’ enrolment was about 43%. It rose to about 48% in 2007 and
remained so till 2009, then rose again to almost 50% (precisely 49. 58%) in 2010. As observed in
SER (2013), this cannot be analyzed purely as a reflection of gender imbalance in the enrolment
as the ECCDE involves the very early years. Thus, the age is too young for any discrimination to
have set in. The overall enrolment for both public and private ECCDE schools shows that on the
flip side there was evidence of gender imbalance with girls’ enrolment as high as about 57% in
2006. However, this dropped to almost 49% in 2007, rose to almost 50% in 2008, dropped again
in 2009 to 46% and rose to about 49% again in 2010.
When disaggregated according to States and Geo – political zones, gender imbalance becomes
more visible. While some States like Rivers State in the South – South zone have as high as 80%
of enrolment for girls and many others had more than 50% in favour of girls, many States in the
Northern zones are still grappling with low enrolment for girls (SER, 2013)
Table 3.5.1: Enrolments in Public and Private Pre-Primary Schools in Nigeria by Gender
Year Public Private Total (Public & Private
M&F %F M&F %F M%F %F
2006 1,367,326 49.44 722,080 43.39 2,089,406 57.35
2007 2,048,082 49.10 637,821 48.42 2,685,903 48.94
2008 1,610,175 50.35 494,845 48.73 2,105,020 49.97
2009 1,827,657 44.83 718,283 48.64 2,538,366 46.04
2010 1,819,752 49.11 873,571 49.58 2,715,077 48.87
Sources: FME, 2011/Digest of Education Statistics, 2000 - 2010
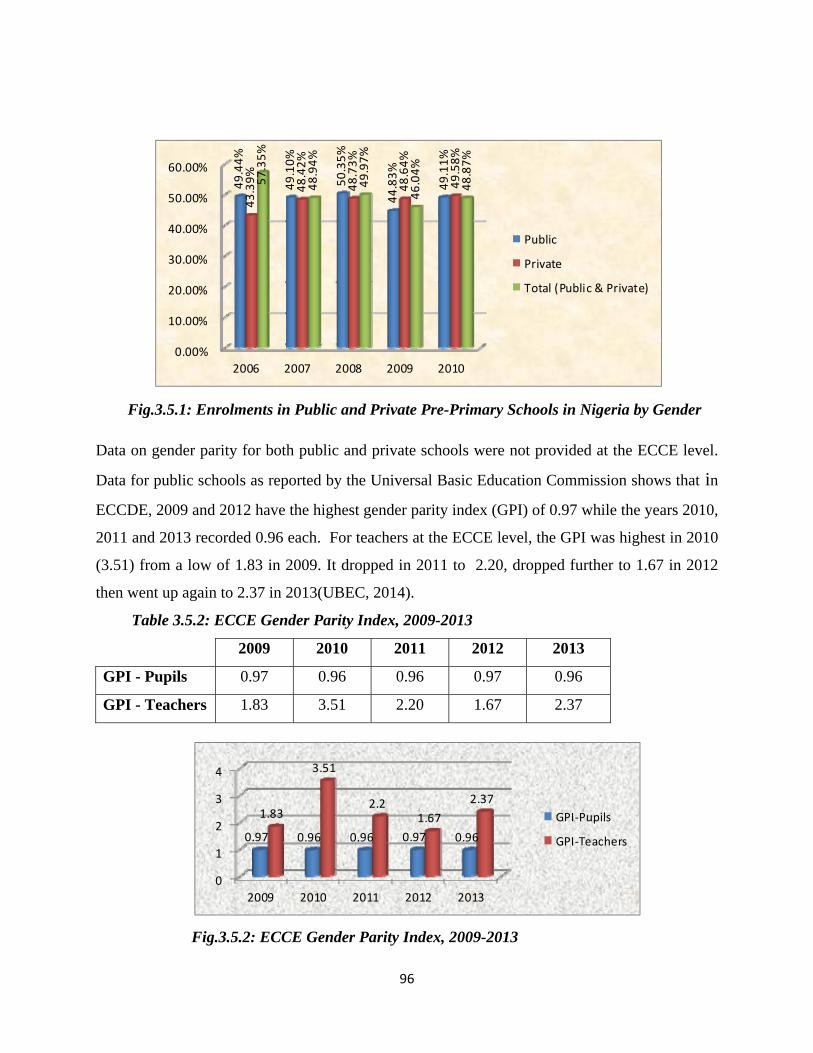
96
Fig.3.5.1: Enrolments in Public and Private Pre-Primary Schools in Nigeria by Gender
Data on gender parity for both public and private schools were not provided at the ECCE level.
Data for public schools as reported by the Universal Basic Education Commission shows that in
ECCDE, 2009 and 2012 have the highest gender parity index (GPI) of 0.97 while the years 2010,
2011 and 2013 recorded 0.96 each. For teachers at the ECCE level, the GPI was highest in 2010
(3.51) from a low of 1.83 in 2009. It dropped in 2011 to 2.20, dropped further to 1.67 in 2012
then went up again to 2.37 in 2013(UBEC, 2014).
Table 3.5.2: ECCE Gender Parity Index, 2009-2013
2009 2010 2011 2012 2013
GPI - Pupils 0.97 0.96 0.96 0.97 0.96
GPI - Teachers 1.83 3.51 2.20 1.67 2.37
Fig.3.5.2: ECCE Gender Parity Index, 2009-2013
0.00%
10.00%
20.00%
30.00%
40.00%
50.00%
60.00%
2006 2007 2008 2009 2010
49.44%
49.10%
50.35%
44.83%
49.11%
43.39%
48.42%
48.73%
48.64%
49.58%
57.35%
48.94%
49.97%
46.04%
48.87%
Public
Private
Total (Public & Private)
0
1
2
3
4
2009 2010 2011 2012 2013
0.97 0.96 0.96 0.97 0.96
1.83
3.51
2.21.67
2.37
GPI‐Pupils
GPI‐Teachers
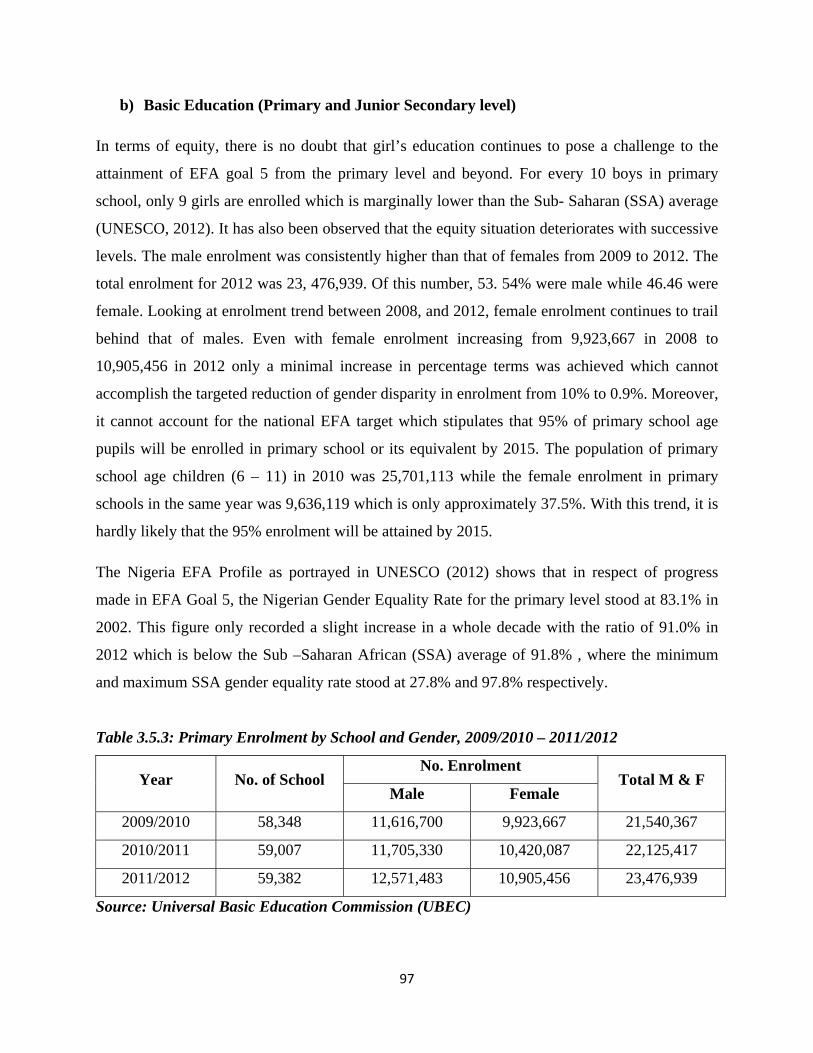
97
b) Basic Education (Primary and Junior Secondary level)
In terms of equity, there is no doubt that girl’s education continues to pose a challenge to the
attainment of EFA goal 5 from the primary level and beyond. For every 10 boys in primary
school, only 9 girls are enrolled which is marginally lower than the Sub- Saharan (SSA) average
(UNESCO, 2012). It has also been observed that the equity situation deteriorates with successive
levels. The male enrolment was consistently higher than that of females from 2009 to 2012. The
total enrolment for 2012 was 23, 476,939. Of this number, 53. 54% were male while 46.46 were
female. Looking at enrolment trend between 2008, and 2012, female enrolment continues to trail
behind that of males. Even with female enrolment increasing from 9,923,667 in 2008 to
10,905,456 in 2012 only a minimal increase in percentage terms was achieved which cannot
accomplish the targeted reduction of gender disparity in enrolment from 10% to 0.9%. Moreover,
it cannot account for the national EFA target which stipulates that 95% of primary school age
pupils will be enrolled in primary school or its equivalent by 2015. The population of primary
school age children (6 – 11) in 2010 was 25,701,113 while the female enrolment in primary
schools in the same year was 9,636,119 which is only approximately 37.5%. With this trend, it is
hardly likely that the 95% enrolment will be attained by 2015.
The Nigeria EFA Profile as portrayed in UNESCO (2012) shows that in respect of progress
made in EFA Goal 5, the Nigerian Gender Equality Rate for the primary level stood at 83.1% in
2002. This figure only recorded a slight increase in a whole decade with the ratio of 91.0% in
2012 which is below the Sub –Saharan African (SSA) average of 91.8% , where the minimum
and maximum SSA gender equality rate stood at 27.8% and 97.8% respectively.
Table 3.5.3: Primary Enrolment by School and Gender, 2009/2010 – 2011/2012
Year No. of School No. Enrolment
Total M & F Male Female
2009/2010 58,348 11,616,700 9,923,667 21,540,367
2010/2011 59,007 11,705,330 10,420,087 22,125,417
2011/2012 59,382 12,571,483 10,905,456 23,476,939
Source: Universal Basic Education Commission (UBEC)
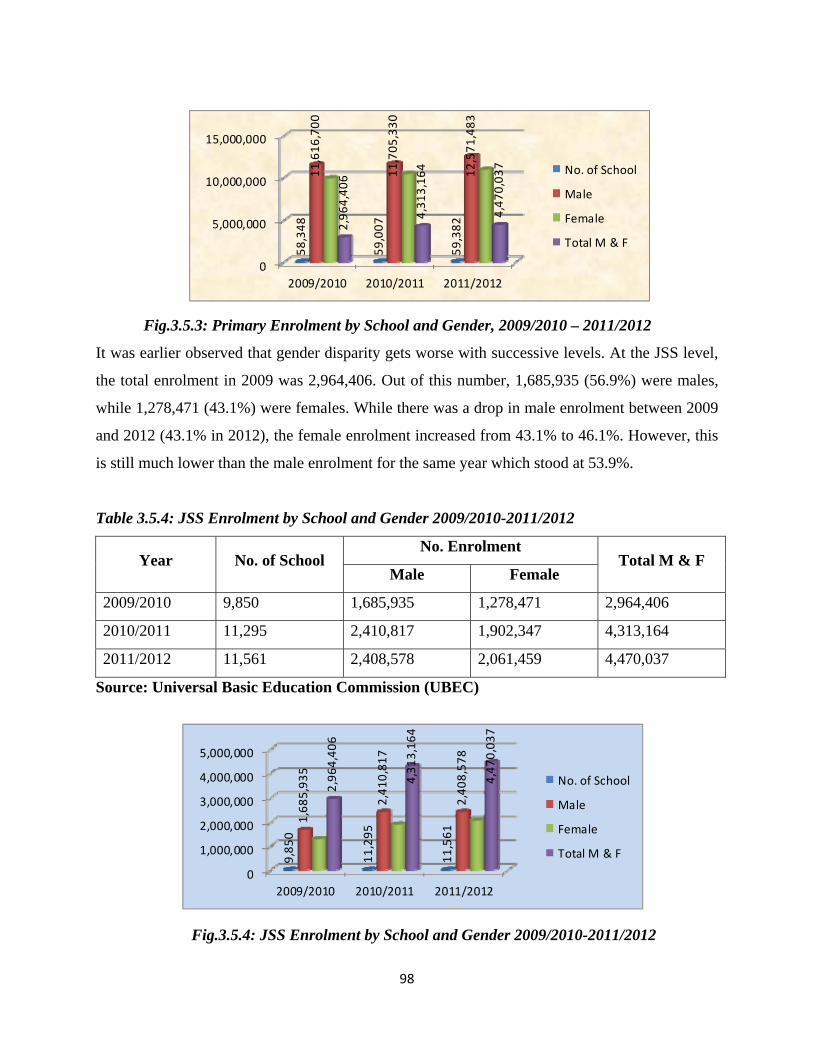
98
Fig.3.5.3: Primary Enrolment by School and Gender, 2009/2010 – 2011/2012
It was earlier observed that gender disparity gets worse with successive levels. At the JSS level,
the total enrolment in 2009 was 2,964,406. Out of this number, 1,685,935 (56.9%) were males,
while 1,278,471 (43.1%) were females. While there was a drop in male enrolment between 2009
and 2012 (43.1% in 2012), the female enrolment increased from 43.1% to 46.1%. However, this
is still much lower than the male enrolment for the same year which stood at 53.9%.
Table 3.5.4: JSS Enrolment by School and Gender 2009/2010-2011/2012
Year No. of School No. Enrolment
Total M & F Male Female
2009/2010 9,850 1,685,935 1,278,471 2,964,406
2010/2011 11,295 2,410,817 1,902,347 4,313,164
2011/2012 11,561 2,408,578 2,061,459 4,470,037
Source: Universal Basic Education Commission (UBEC)
Fig.3.5.4: JSS Enrolment by School and Gender 2009/2010-2011/2012
0
5,000,000
10,000,000
15,000,000
2009/2010 2010/2011 2011/2012
58,348
59,007
59,382
11,616,700
11,705,330
12,571,483
2,964,406
4,313,164
4,470,037 No. of School
Male
Female
Total M & F
0
1,000,000
2,000,000
3,000,000
4,000,000
5,000,000
2009/2010 2010/2011 2011/2012
9,850
11,295
11,561
1,685,935
2,410,817
2,408,578
2,964,406
4,313,164
4,470,037
No. of School
Male
Female
Total M & F
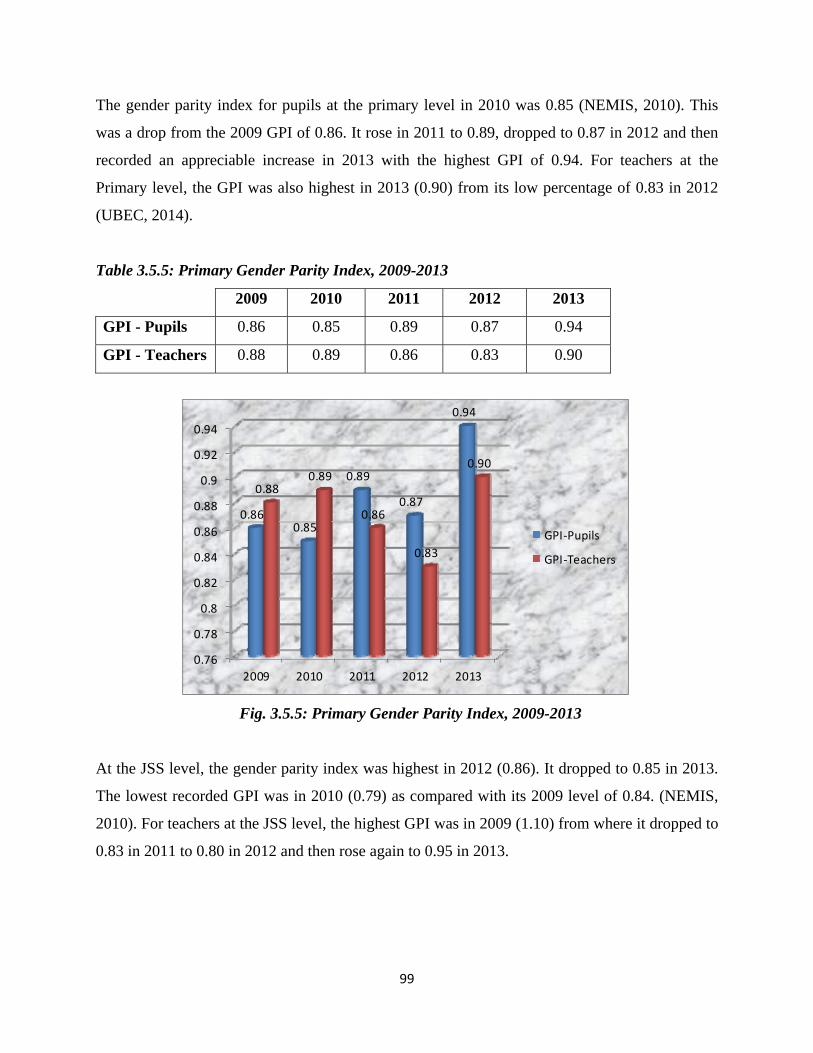
99
The gender parity index for pupils at the primary level in 2010 was 0.85 (NEMIS, 2010). This
was a drop from the 2009 GPI of 0.86. It rose in 2011 to 0.89, dropped to 0.87 in 2012 and then
recorded an appreciable increase in 2013 with the highest GPI of 0.94. For teachers at the
Primary level, the GPI was also highest in 2013 (0.90) from its low percentage of 0.83 in 2012
(UBEC, 2014).
Table 3.5.5: Primary Gender Parity Index, 2009-2013
2009 2010 2011 2012 2013
GPI - Pupils 0.86 0.85 0.89 0.87 0.94
GPI - Teachers 0.88 0.89 0.86 0.83 0.90
Fig. 3.5.5: Primary Gender Parity Index, 2009-2013
At the JSS level, the gender parity index was highest in 2012 (0.86). It dropped to 0.85 in 2013.
The lowest recorded GPI was in 2010 (0.79) as compared with its 2009 level of 0.84. (NEMIS,
2010). For teachers at the JSS level, the highest GPI was in 2009 (1.10) from where it dropped to
0.83 in 2011 to 0.80 in 2012 and then rose again to 0.95 in 2013.
0.76
0.78
0.8
0.82
0.84
0.86
0.88
0.9
0.92
0.94
2009 2010 2011 2012 2013
0.860.85
0.89
0.87
0.94
0.880.89
0.86
0.83
0.90
GPI‐Pupils
GPI‐Teachers
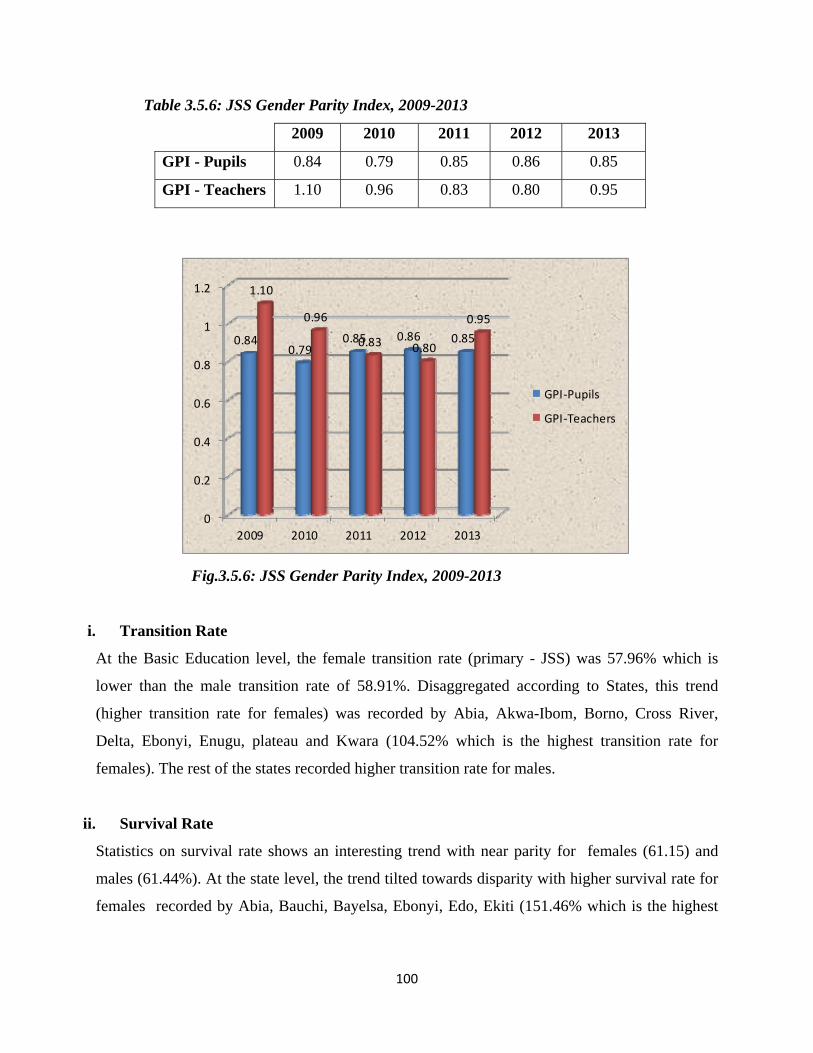
100
Table 3.5.6: JSS Gender Parity Index, 2009-2013
2009 2010 2011 2012 2013
GPI - Pupils 0.84 0.79 0.85 0.86 0.85
GPI - Teachers 1.10 0.96 0.83 0.80 0.95
Fig.3.5.6: JSS Gender Parity Index, 2009-2013
i. Transition Rate
At the Basic Education level, the female transition rate (primary - JSS) was 57.96% which is
lower than the male transition rate of 58.91%. Disaggregated according to States, this trend
(higher transition rate for females) was recorded by Abia, Akwa-Ibom, Borno, Cross River,
Delta, Ebonyi, Enugu, plateau and Kwara (104.52% which is the highest transition rate for
females). The rest of the states recorded higher transition rate for males.
ii. Survival Rate
Statistics on survival rate shows an interesting trend with near parity for females (61.15) and
males (61.44%). At the state level, the trend tilted towards disparity with higher survival rate for
females recorded by Abia, Bauchi, Bayelsa, Ebonyi, Edo, Ekiti (151.46% which is the highest
0
0.2
0.4
0.6
0.8
1
1.2
2009 2010 2011 2012 2013
0.840.79
0.85 0.86 0.85
1.10
0.96
0.83 0.80
0.95
GPI‐Pupils
GPI‐Teachers
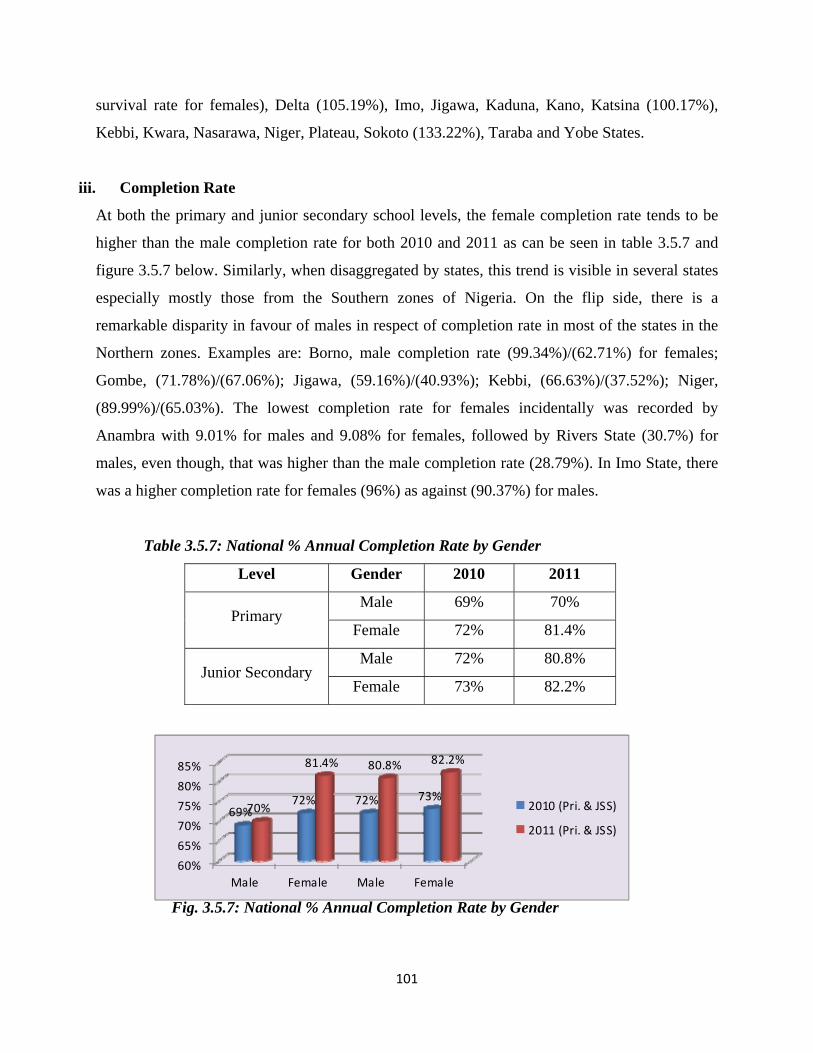
101
survival rate for females), Delta (105.19%), Imo, Jigawa, Kaduna, Kano, Katsina (100.17%),
Kebbi, Kwara, Nasarawa, Niger, Plateau, Sokoto (133.22%), Taraba and Yobe States.
iii. Completion Rate
At both the primary and junior secondary school levels, the female completion rate tends to be
higher than the male completion rate for both 2010 and 2011 as can be seen in table 3.5.7 and
figure 3.5.7 below. Similarly, when disaggregated by states, this trend is visible in several states
especially mostly those from the Southern zones of Nigeria. On the flip side, there is a
remarkable disparity in favour of males in respect of completion rate in most of the states in the
Northern zones. Examples are: Borno, male completion rate (99.34%)/(62.71%) for females;
Gombe, (71.78%)/(67.06%); Jigawa, (59.16%)/(40.93%); Kebbi, (66.63%)/(37.52%); Niger,
(89.99%)/(65.03%). The lowest completion rate for females incidentally was recorded by
Anambra with 9.01% for males and 9.08% for females, followed by Rivers State (30.7%) for
males, even though, that was higher than the male completion rate (28.79%). In Imo State, there
was a higher completion rate for females (96%) as against (90.37%) for males.
Table 3.5.7: National % Annual Completion Rate by Gender
Level Gender 2010 2011
Primary Male 69% 70%
Female 72% 81.4%
Junior Secondary Male 72% 80.8%
Female 73% 82.2%
Fig. 3.5.7: National % Annual Completion Rate by Gender
60%
65%
70%
75%
80%
85%
Male Female Male Female
69%72% 72% 73%
70%
81.4% 80.8% 82.2%
2010 (Pri. & JSS)
2011 (Pri. & JSS)
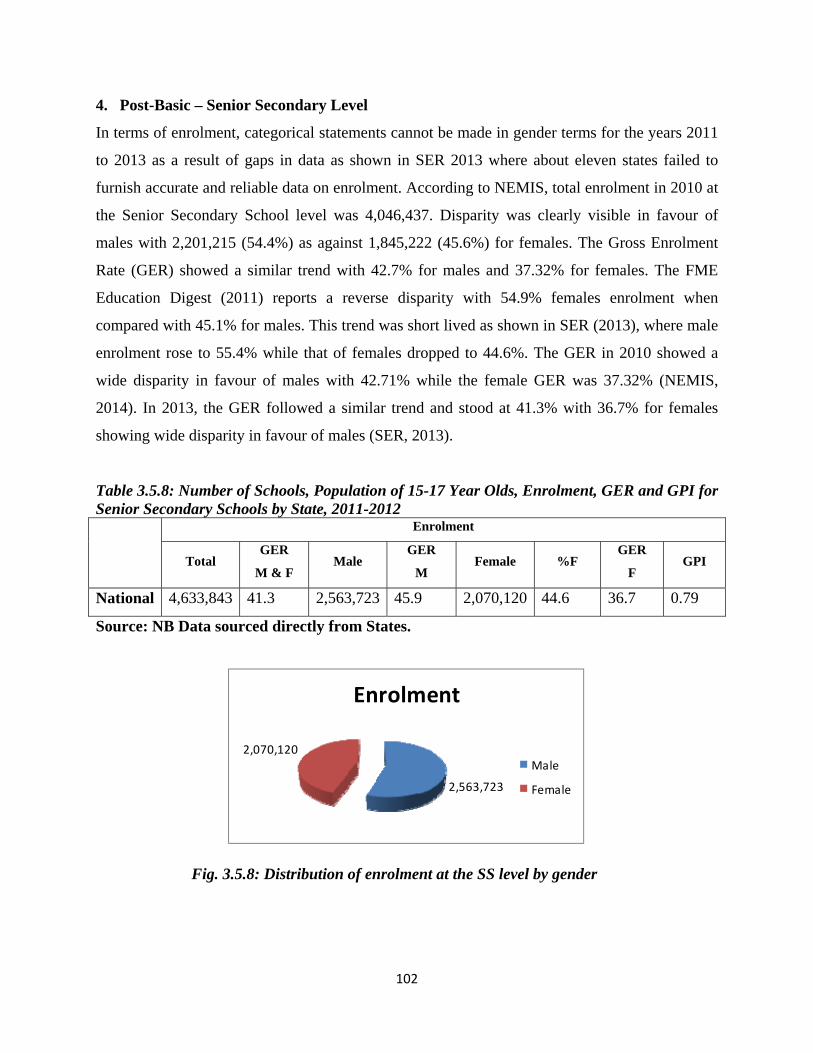
102
4. Post-Basic – Senior Secondary Level
In terms of enrolment, categorical statements cannot be made in gender terms for the years 2011
to 2013 as a result of gaps in data as shown in SER 2013 where about eleven states failed to
furnish accurate and reliable data on enrolment. According to NEMIS, total enrolment in 2010 at
the Senior Secondary School level was 4,046,437. Disparity was clearly visible in favour of
males with 2,201,215 (54.4%) as against 1,845,222 (45.6%) for females. The Gross Enrolment
Rate (GER) showed a similar trend with 42.7% for males and 37.32% for females. The FME
Education Digest (2011) reports a reverse disparity with 54.9% females enrolment when
compared with 45.1% for males. This trend was short lived as shown in SER (2013), where male
enrolment rose to 55.4% while that of females dropped to 44.6%. The GER in 2010 showed a
wide disparity in favour of males with 42.71% while the female GER was 37.32% (NEMIS,
2014). In 2013, the GER followed a similar trend and stood at 41.3% with 36.7% for females
showing wide disparity in favour of males (SER, 2013).
Table 3.5.8: Number of Schools, Population of 15-17 Year Olds, Enrolment, GER and GPI for Senior Secondary Schools by State, 2011-2012 Enrolment
Total GER
M & F Male
GER
M Female %F
GER
F GPI
National 4,633,843 41.3 2,563,723 45.9 2,070,120 44.6 36.7 0.79
Source: NB Data sourced directly from States.
Fig. 3.5.8: Distribution of enrolment at the SS level by gender
2,563,723
2,070,120
Enrolment
Male
Female
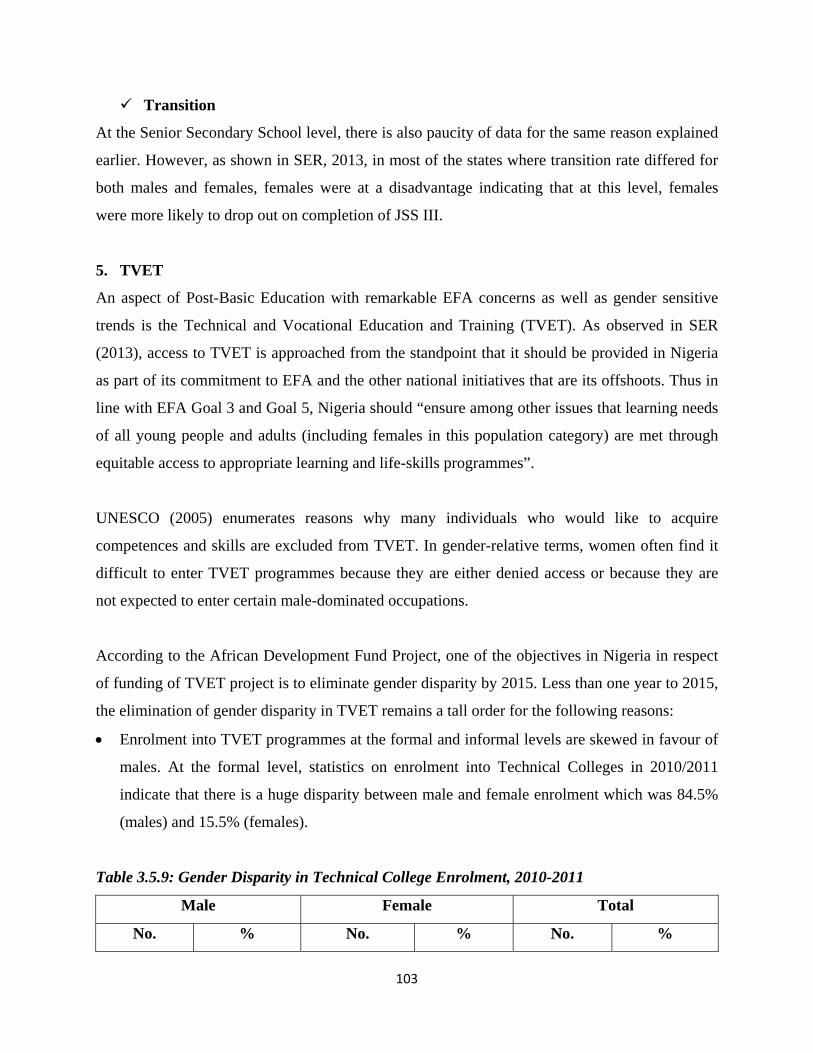
103
Transition
At the Senior Secondary School level, there is also paucity of data for the same reason explained
earlier. However, as shown in SER, 2013, in most of the states where transition rate differed for
both males and females, females were at a disadvantage indicating that at this level, females
were more likely to drop out on completion of JSS III.
5. TVET
An aspect of Post-Basic Education with remarkable EFA concerns as well as gender sensitive
trends is the Technical and Vocational Education and Training (TVET). As observed in SER
(2013), access to TVET is approached from the standpoint that it should be provided in Nigeria
as part of its commitment to EFA and the other national initiatives that are its offshoots. Thus in
line with EFA Goal 3 and Goal 5, Nigeria should “ensure among other issues that learning needs
of all young people and adults (including females in this population category) are met through
equitable access to appropriate learning and life-skills programmes”.
UNESCO (2005) enumerates reasons why many individuals who would like to acquire
competences and skills are excluded from TVET. In gender-relative terms, women often find it
difficult to enter TVET programmes because they are either denied access or because they are
not expected to enter certain male-dominated occupations.
According to the African Development Fund Project, one of the objectives in Nigeria in respect
of funding of TVET project is to eliminate gender disparity by 2015. Less than one year to 2015,
the elimination of gender disparity in TVET remains a tall order for the following reasons:
Enrolment into TVET programmes at the formal and informal levels are skewed in favour of
males. At the formal level, statistics on enrolment into Technical Colleges in 2010/2011
indicate that there is a huge disparity between male and female enrolment which was 84.5%
(males) and 15.5% (females).
Table 3.5.9: Gender Disparity in Technical College Enrolment, 2010-2011
Male Female Total
No. % No. % No. %
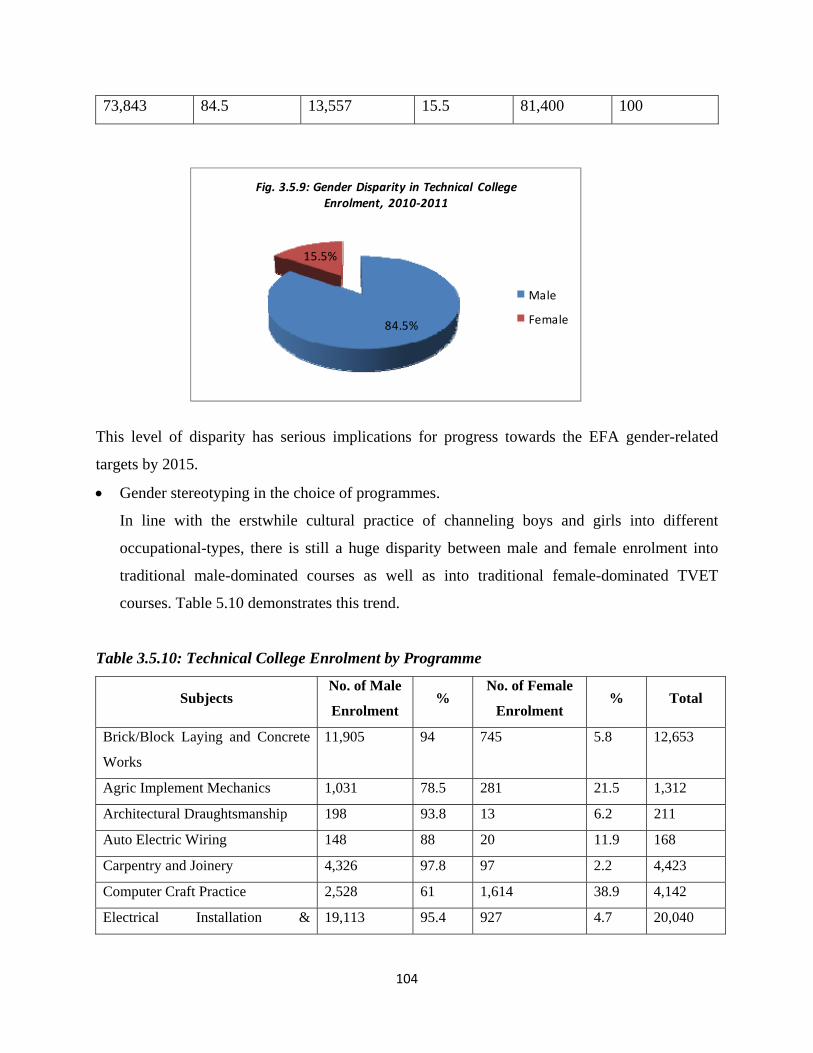
104
73,843 84.5 13,557 15.5 81,400 100
This level of disparity has serious implications for progress towards the EFA gender-related
targets by 2015.
Gender stereotyping in the choice of programmes.
In line with the erstwhile cultural practice of channeling boys and girls into different
occupational-types, there is still a huge disparity between male and female enrolment into
traditional male-dominated courses as well as into traditional female-dominated TVET
courses. Table 5.10 demonstrates this trend.
Table 3.5.10: Technical College Enrolment by Programme
Subjects No. of Male
Enrolment %
No. of Female
Enrolment % Total
Brick/Block Laying and Concrete
Works
11,905 94 745 5.8 12,653
Agric Implement Mechanics 1,031 78.5 281 21.5 1,312
Architectural Draughtsmanship 198 93.8 13 6.2 211
Auto Electric Wiring 148 88 20 11.9 168
Carpentry and Joinery 4,326 97.8 97 2.2 4,423
Computer Craft Practice 2,528 61 1,614 38.9 4,142
Electrical Installation & 19,113 95.4 927 4.7 20,040
84.5%
15.5%
Fig. 3.5.9: Gender Disparity in Technical College Enrolment, 2010‐2011
Male
Female
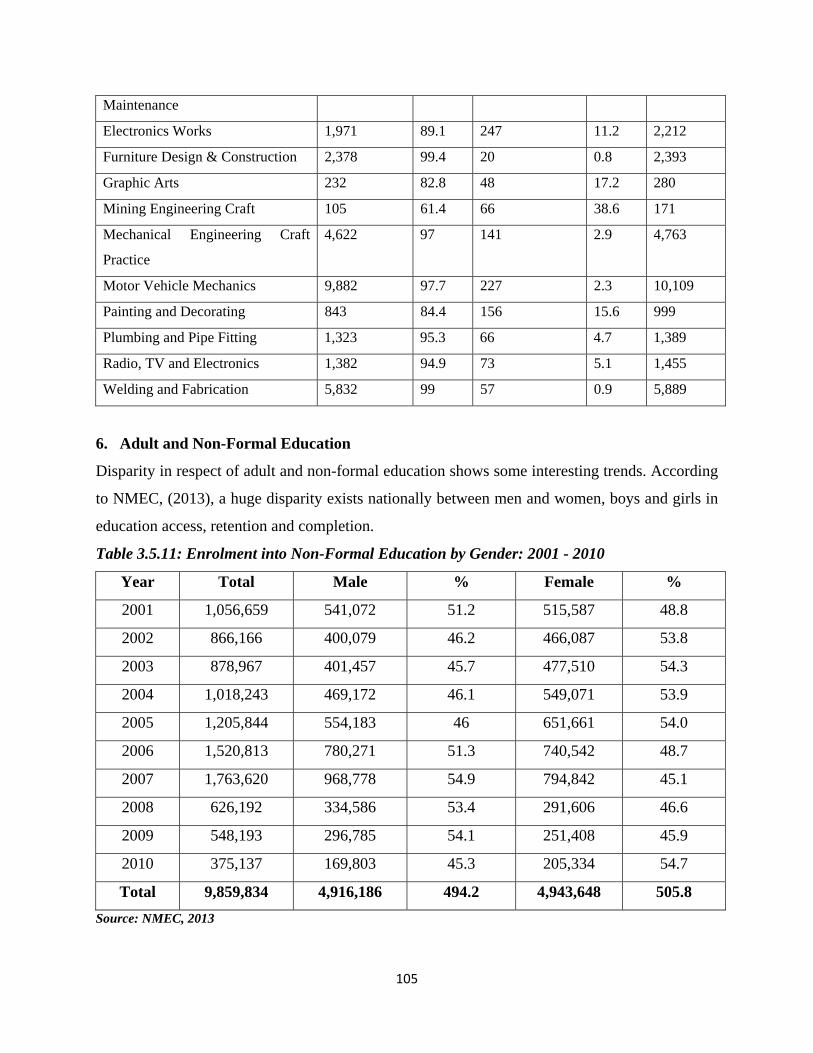
105
Maintenance
Electronics Works 1,971 89.1 247 11.2 2,212
Furniture Design & Construction 2,378 99.4 20 0.8 2,393
Graphic Arts 232 82.8 48 17.2 280
Mining Engineering Craft 105 61.4 66 38.6 171
Mechanical Engineering Craft
Practice
4,622 97 141 2.9 4,763
Motor Vehicle Mechanics 9,882 97.7 227 2.3 10,109
Painting and Decorating 843 84.4 156 15.6 999
Plumbing and Pipe Fitting 1,323 95.3 66 4.7 1,389
Radio, TV and Electronics 1,382 94.9 73 5.1 1,455
Welding and Fabrication 5,832 99 57 0.9 5,889
6. Adult and Non-Formal Education
Disparity in respect of adult and non-formal education shows some interesting trends. According
to NMEC, (2013), a huge disparity exists nationally between men and women, boys and girls in
education access, retention and completion.
Table 3.5.11: Enrolment into Non-Formal Education by Gender: 2001 - 2010
Year Total Male % Female %
2001 1,056,659 541,072 51.2 515,587 48.8
2002 866,166 400,079 46.2 466,087 53.8
2003 878,967 401,457 45.7 477,510 54.3
2004 1,018,243 469,172 46.1 549,071 53.9
2005 1,205,844 554,183 46 651,661 54.0
2006 1,520,813 780,271 51.3 740,542 48.7
2007 1,763,620 968,778 54.9 794,842 45.1
2008 626,192 334,586 53.4 291,606 46.6
2009 548,193 296,785 54.1 251,408 45.9
2010 375,137 169,803 45.3 205,334 54.7
Total 9,859,834 4,916,186 494.2 4,943,648 505.8
Source: NMEC, 2013
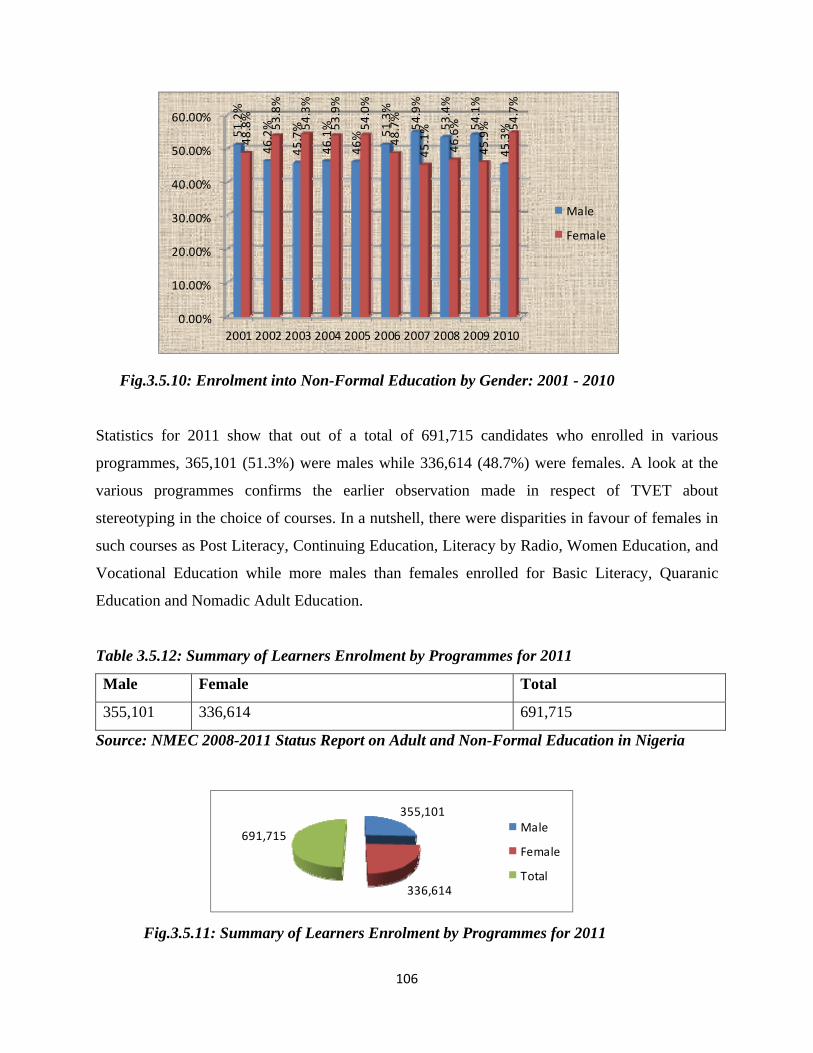
106
Fig.3.5.10: Enrolment into Non-Formal Education by Gender: 2001 - 2010
Statistics for 2011 show that out of a total of 691,715 candidates who enrolled in various
programmes, 365,101 (51.3%) were males while 336,614 (48.7%) were females. A look at the
various programmes confirms the earlier observation made in respect of TVET about
stereotyping in the choice of courses. In a nutshell, there were disparities in favour of females in
such courses as Post Literacy, Continuing Education, Literacy by Radio, Women Education, and
Vocational Education while more males than females enrolled for Basic Literacy, Quaranic
Education and Nomadic Adult Education.
Table 3.5.12: Summary of Learners Enrolment by Programmes for 2011
Male Female Total
355,101 336,614 691,715
Source: NMEC 2008-2011 Status Report on Adult and Non-Formal Education in Nigeria
Fig.3.5.11: Summary of Learners Enrolment by Programmes for 2011
355,101
336,614
691,715Male
Female
Total
0.00%
10.00%
20.00%
30.00%
40.00%
50.00%
60.00%
2001 2002 2003 2004 2005 2006 2007 2008 2009 2010
51.2%
46.2%
45.7%
46.1%
46% 51.3%
54.9%
53.4%
54.1%
45.3%
48.8%
53.8%
54.3%
53.9%
54.0%
48.7%
45.1%
46.6%
45.9% 54.7%
Male
Female
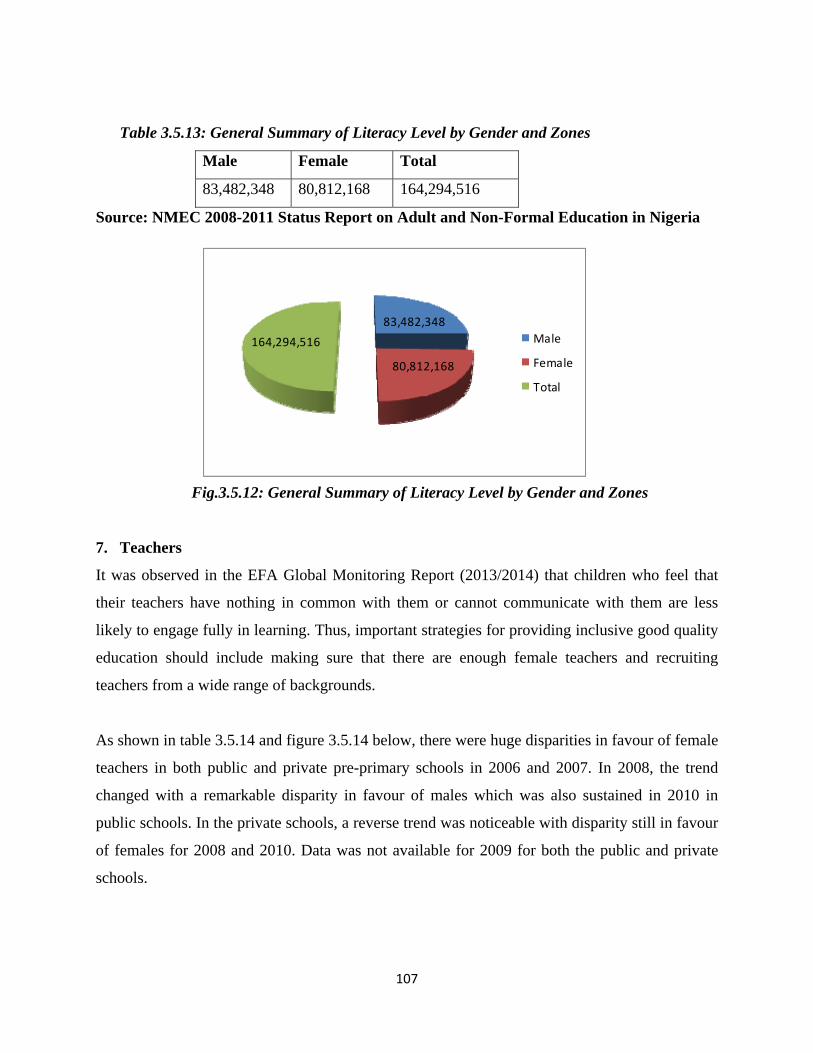
107
Table 3.5.13: General Summary of Literacy Level by Gender and Zones
Male Female Total
83,482,348 80,812,168 164,294,516
Source: NMEC 2008-2011 Status Report on Adult and Non-Formal Education in Nigeria
Fig.3.5.12: General Summary of Literacy Level by Gender and Zones
7. Teachers
It was observed in the EFA Global Monitoring Report (2013/2014) that children who feel that
their teachers have nothing in common with them or cannot communicate with them are less
likely to engage fully in learning. Thus, important strategies for providing inclusive good quality
education should include making sure that there are enough female teachers and recruiting
teachers from a wide range of backgrounds.
As shown in table 3.5.14 and figure 3.5.14 below, there were huge disparities in favour of female
teachers in both public and private pre-primary schools in 2006 and 2007. In 2008, the trend
changed with a remarkable disparity in favour of males which was also sustained in 2010 in
public schools. In the private schools, a reverse trend was noticeable with disparity still in favour
of females for 2008 and 2010. Data was not available for 2009 for both the public and private
schools.
83,482,348
80,812,168
164,294,516 Male
Female
Total
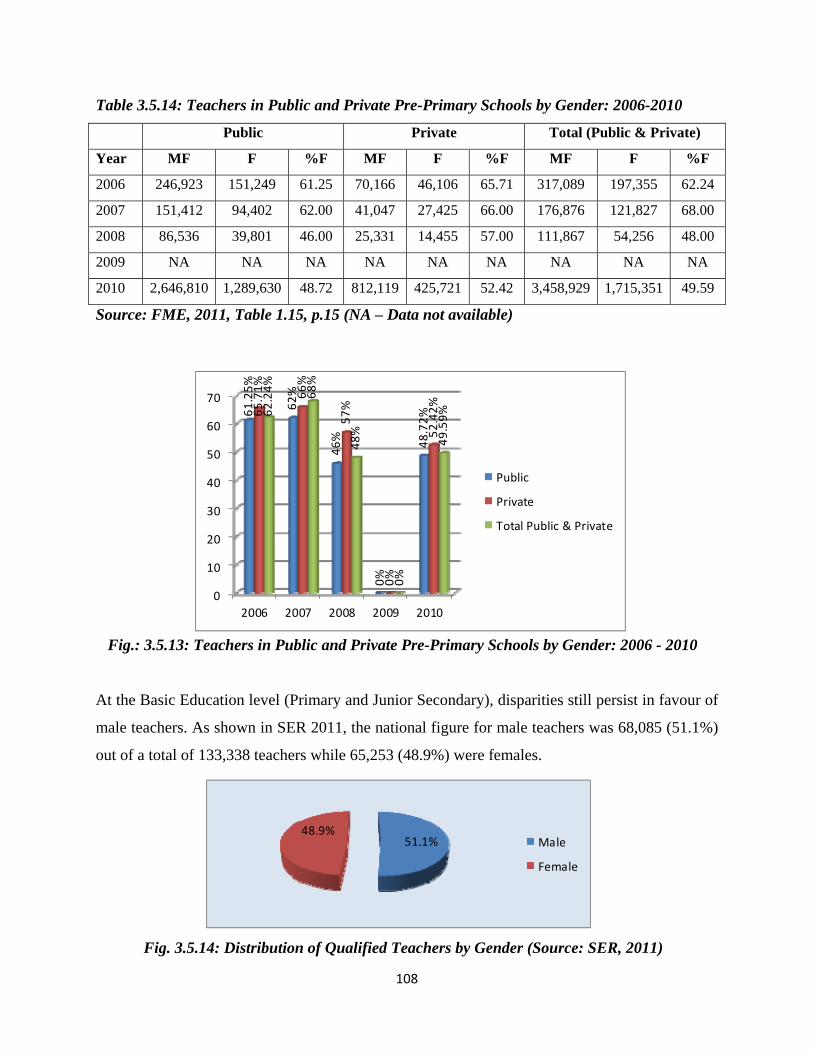
108
Table 3.5.14: Teachers in Public and Private Pre-Primary Schools by Gender: 2006-2010
Public Private Total (Public & Private)
Year MF F %F MF F %F MF F %F
2006 246,923 151,249 61.25 70,166 46,106 65.71 317,089 197,355 62.24
2007 151,412 94,402 62.00 41,047 27,425 66.00 176,876 121,827 68.00
2008 86,536 39,801 46.00 25,331 14,455 57.00 111,867 54,256 48.00
2009 NA NA NA NA NA NA NA NA NA
2010 2,646,810 1,289,630 48.72 812,119 425,721 52.42 3,458,929 1,715,351 49.59
Source: FME, 2011, Table 1.15, p.15 (NA – Data not available)
Fig.: 3.5.13: Teachers in Public and Private Pre-Primary Schools by Gender: 2006 - 2010
At the Basic Education level (Primary and Junior Secondary), disparities still persist in favour of
male teachers. As shown in SER 2011, the national figure for male teachers was 68,085 (51.1%)
out of a total of 133,338 teachers while 65,253 (48.9%) were females.
Fig. 3.5.14: Distribution of Qualified Teachers by Gender (Source: SER, 2011)
51.1%48.9%
Male
Female
0
10
20
30
40
50
60
70
2006 2007 2008 2009 2010
61.25%
62%
46%
0%
48.72%65.71%
66%
57%
0%
52.42%
62.24%
68%
48%
0%
49.59%
Public
Private
Total Public & Private
109
At the senior secondary school level, there is evidence of gender disparity in teacher recruitment
in the majority of States. Apart from Abia (69.2%), Anambra (68.3%), Delta (64.6%), FCT
(53.4%), Lagos (55.7%), and Ogun (50.4%), where the proportion of female teachers is higher
than the proportion of males, there is disparity in favour of male teachers in all other states where
data was available. The disparity is more pronounced in Adamawa, Bauchi, Benue, Borno, Imo,
Katsina, Sokoto, Taraba and Yobe States with the proportion of female teachers at less than 35%.
The situation is most critical in Jigawa (12.1%) and Bauchi (18.8%) states where females are
probably not available for employment or are highly discriminated. (SER, 2013)
8. Progress made towards EFA Goal 5
Despite the fact that the gender trends indicate that a lot needs to be done towards attaining the
targets for 2015, a lot of achievements have been recorded by Nigeria towards this goal. These
include:
Formulated a Gender Policy on basic education with its guidelines in 2007.
Formulated a national framework on Girls and Women Education in partnership with IDPs,
such as DFID, UNICEF, Action Health Incorporated in 2012.
A State Education Sector Operational Plan (SESOP) was developed in GEP states (Bauchi,
Katsina, Niger, Sokoto, Zamfara) which details entails entire plans for proper functioning of
the school.
Whole school development plans developed in GEP States in collaboration with SBMCs who
monitor the implementation of such plans. The plans were developed in each girls’ school.
Established and trained mothers’ association members in 28 states plus FCT. In 2008, 2,068
SBMC, women were trained in school management. Mothers’ Association were trained to
ensure and track girls enrolments, attendance, completion and transition from primary to
JSS and higher education. A total of 1,962 mothers were trained in 2011 and 3,602 were
trained in 2012.
Developed School Based Teachers Development (SbTD) Pedagogy Model to enhance
teaching and learning. Developed by Ministry of Education in conjunction with UNICEF
(NCCE, NTI, TRCN, and Colleges of Education from GEP states) as core Teams. It was
piloted in 2008 in Niger, Katsina, Bauchi, Sokoto and is currently being used in all GEP
States and College of Education Owerri and Ibadan.
110
Female Teachers Training Scholarship Scheme (FTTSS) was established in GEP States and
young indigent girls from various disadvantaged communities are granted scholarships to be
trained as teachers. After the training course, girls are encouraged to return to their individual
communities to teach and serve as role models and address the inadequacy of female
teachers in rural areas.
3 in Senatorial Districts of GEP States were empowered with income generating equipment
like sewing machines, block molding machines etc., in 2008 to empower youths, women and
dropouts.
Increased funding for girls education as Zamfara state government commits N500 million
yearly till date towards girls’ education. This commenced in 2008.
Provision of learning kits for 10,000 girls propelled retention in school, mitigates for
improved access and gender parity.
Advocacy and sensitization targeting women and girls for education opportunities have been
carried out in Anambra, Imo, Ebonyi, Nasarawa, Gombe. Provision has been made for
advocacy to Oyo and Kogi states in 2014. This is an addition to high level advocacy that
takes place nationwide.
Improved child friendly school environment facilities by the construction of separate toilet
facilities for boys/girls in schools including for students living with disabilities. Boreholes
were also provided in schools to improve sanitary conditions for such communities. States
that are mostly affected and benefitting from the project include Akwa-Ibom, Zamfara,
Niger. This has greatly increased retention of girls in schools through improved learning
environment.
Formulation of Girls Education Movement (GEM) and girls clubs in schools to inculcate
their rights on them and speaking out. Also provides a forum for girls to go back to school.
Girls serve as role models to other girls in the communities who are out of school.
Civil Society Organizations are actively involved in awareness building initiatives and civil
education which highlight role and importance of women and girl-child education. Capacity
building exercises are regularly conducted for traditional leaders, men and other agencies that
tend to undermine importance of women/girls education. The umbrella body Civil Society
Action Coalition on Education for All coordinates some of these activities.
111
Girls only schools have been built in states like Katsina and Kano to promote increased
enrolment of girls in school, also discounted transportation has been provided in Katsina,
Sokoto and Kano to enable girls in rural communities have easy access to schools.
Provision of conditional cash transfers to indigent families in Niger, Katsina and Bauchi to
support the girl child to attend schools. The money is given to mothers to argument the
families sources of income making way for girls to go to school instead of assisting in
sourcing for family’s income.
9. Challenges
These achievements notwithstanding, a number of challenges need to be addressed. These are:
Adoption of Child Right Acts in some Northern States still pose a challenge and it greatly
affects the enrolment of girls in school and her rights to basic education.
Inadequate learning materials and infrastructures in Nigerian schools to promote girl friendly
school environment.
Inadequate number of qualified teachers especially female teachers who serve as role models
to girls in communities.
Lack of political will and sustainability of educational policies which largely affects
implementation.
Poverty of families who cannot afford to send their wards to school especially girls who
serve as income generators for their respective families greatly affects pay enrolment and
retention in schools.
Recent trend in insecurity in many parts of Nigeria that threaten to derail the progress so far
made in the education of girls, especially in the North East.
Data collection suffer set back in some states thereby rendering the data incorrect. Females
feel certain subjects or courses are male oriented and tend to avoid such subjects or courses.
112
3.6 – Quality of Education
Goal 6
1. Introduction
According to the 2005 EFA Global Monitoring Report, a new consensus and impetus is building
up around the imperative to improve the quality of education. How well students are taught and
how much they learn are likely to have a crucial impact upon the length and value of their
schooling experience. Quality can influence parents’ choice to invest in their children’s
education. The range of intrinsic and social benefits associated with education, from better
protection against disease to higher personal income, is strongly dependent on the quality of the
teaching-learning process. Although there is no single definition of quality, two principles
characterize most attempts to define the objectives of education.
The first, which identifies learners’ cognitive development as the major explicit objective of all
education systems, sees the success with which systems achieve this as one indicator of their
quality. The second emphasizes the role of education in promoting commonly shared values
along with creative and emotional development – objectives whose achievement is much more
difficult to assess. Common ground is also found in the broadly shared objectives that tend to
underpin debates about quality: respect for individual rights, improved equity of access and of
learning outcomes, and increased relevance. These principles have been integrated into the aims
of education set out in the Convention on the Rights of the Child (1990), which underpins the
current positions on quality held by UNESCO and UNICEF.
“Improve all aspects of the quality of education to achieve recognized and measurable learning outcomes for
all – especially in literacy, numeracy and essential life skills”
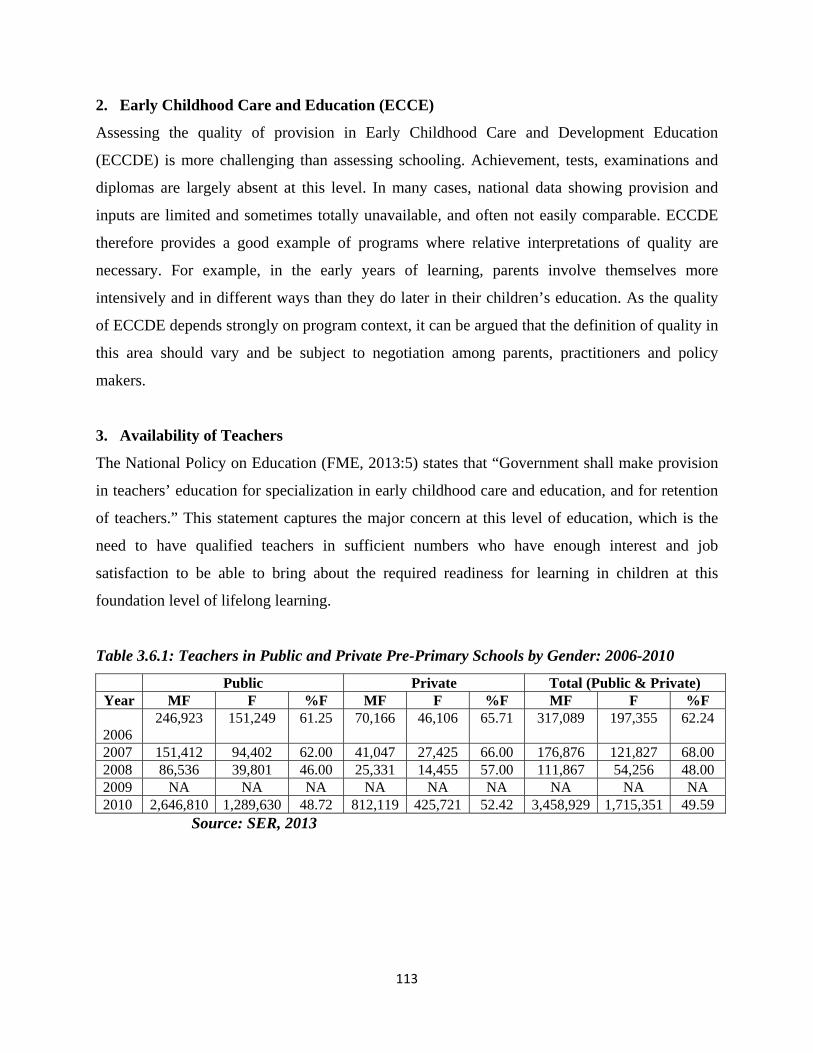
113
2. Early Childhood Care and Education (ECCE)
Assessing the quality of provision in Early Childhood Care and Development Education
(ECCDE) is more challenging than assessing schooling. Achievement, tests, examinations and
diplomas are largely absent at this level. In many cases, national data showing provision and
inputs are limited and sometimes totally unavailable, and often not easily comparable. ECCDE
therefore provides a good example of programs where relative interpretations of quality are
necessary. For example, in the early years of learning, parents involve themselves more
intensively and in different ways than they do later in their children’s education. As the quality
of ECCDE depends strongly on program context, it can be argued that the definition of quality in
this area should vary and be subject to negotiation among parents, practitioners and policy
makers.
3. Availability of Teachers
The National Policy on Education (FME, 2013:5) states that “Government shall make provision
in teachers’ education for specialization in early childhood care and education, and for retention
of teachers.” This statement captures the major concern at this level of education, which is the
need to have qualified teachers in sufficient numbers who have enough interest and job
satisfaction to be able to bring about the required readiness for learning in children at this
foundation level of lifelong learning.
Table 3.6.1: Teachers in Public and Private Pre-Primary Schools by Gender: 2006-2010
Public Private Total (Public & Private) Year MF F %F MF F %F MF F %F 2006
246,923 151,249 61.25 70,166 46,106 65.71 317,089 197,355 62.24
2007 151,412 94,402 62.00 41,047 27,425 66.00 176,876 121,827 68.00 2008 86,536 39,801 46.00 25,331 14,455 57.00 111,867 54,256 48.00 2009 NA NA NA NA NA NA NA NA NA 2010 2,646,810 1,289,630 48.72 812,119 425,721 52.42 3,458,929 1,715,351 49.59
Source: SER, 2013
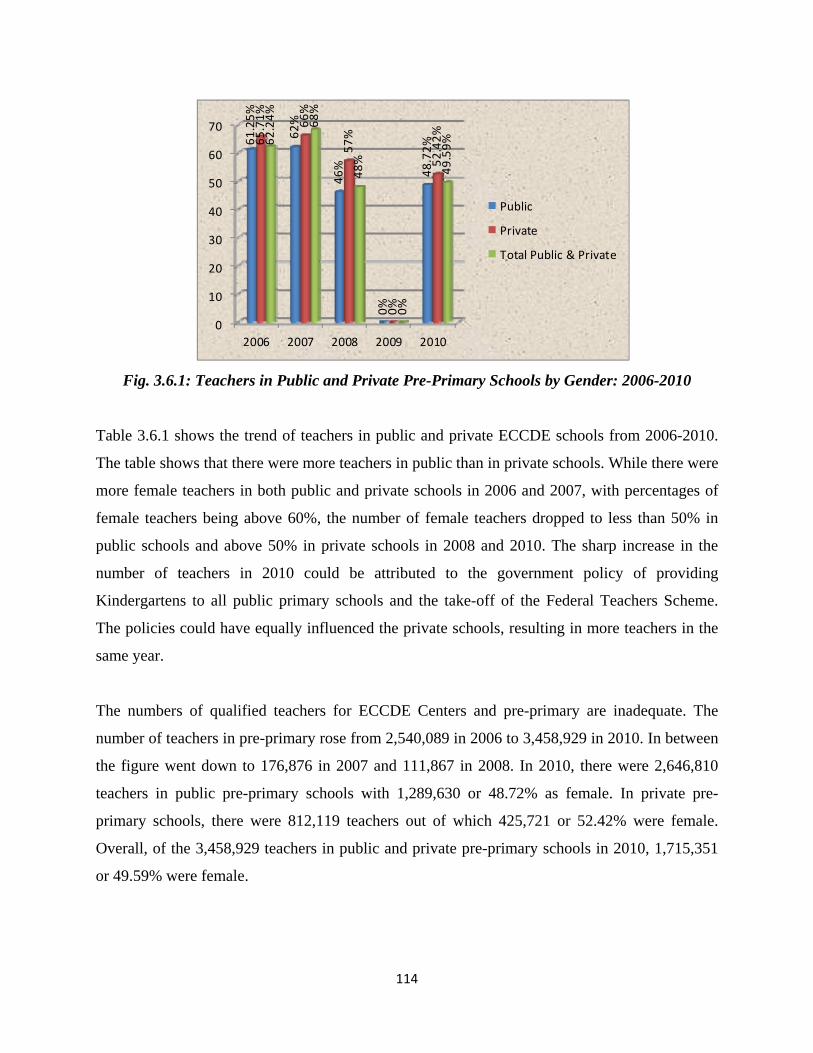
114
Fig. 3.6.1: Teachers in Public and Private Pre-Primary Schools by Gender: 2006-2010
Table 3.6.1 shows the trend of teachers in public and private ECCDE schools from 2006-2010.
The table shows that there were more teachers in public than in private schools. While there were
more female teachers in both public and private schools in 2006 and 2007, with percentages of
female teachers being above 60%, the number of female teachers dropped to less than 50% in
public schools and above 50% in private schools in 2008 and 2010. The sharp increase in the
number of teachers in 2010 could be attributed to the government policy of providing
Kindergartens to all public primary schools and the take-off of the Federal Teachers Scheme.
The policies could have equally influenced the private schools, resulting in more teachers in the
same year.
The numbers of qualified teachers for ECCDE Centers and pre-primary are inadequate. The
number of teachers in pre-primary rose from 2,540,089 in 2006 to 3,458,929 in 2010. In between
the figure went down to 176,876 in 2007 and 111,867 in 2008. In 2010, there were 2,646,810
teachers in public pre-primary schools with 1,289,630 or 48.72% as female. In private pre-
primary schools, there were 812,119 teachers out of which 425,721 or 52.42% were female.
Overall, of the 3,458,929 teachers in public and private pre-primary schools in 2010, 1,715,351
or 49.59% were female.
0
10
20
30
40
50
60
70
2006 2007 2008 2009 2010
61.25%
62%
46%
0%
48.72%65.71%
66%
57%
0%
52.42%
62.24%
68%
48%
0%
49.59%
Public
Private
Total Public & Private
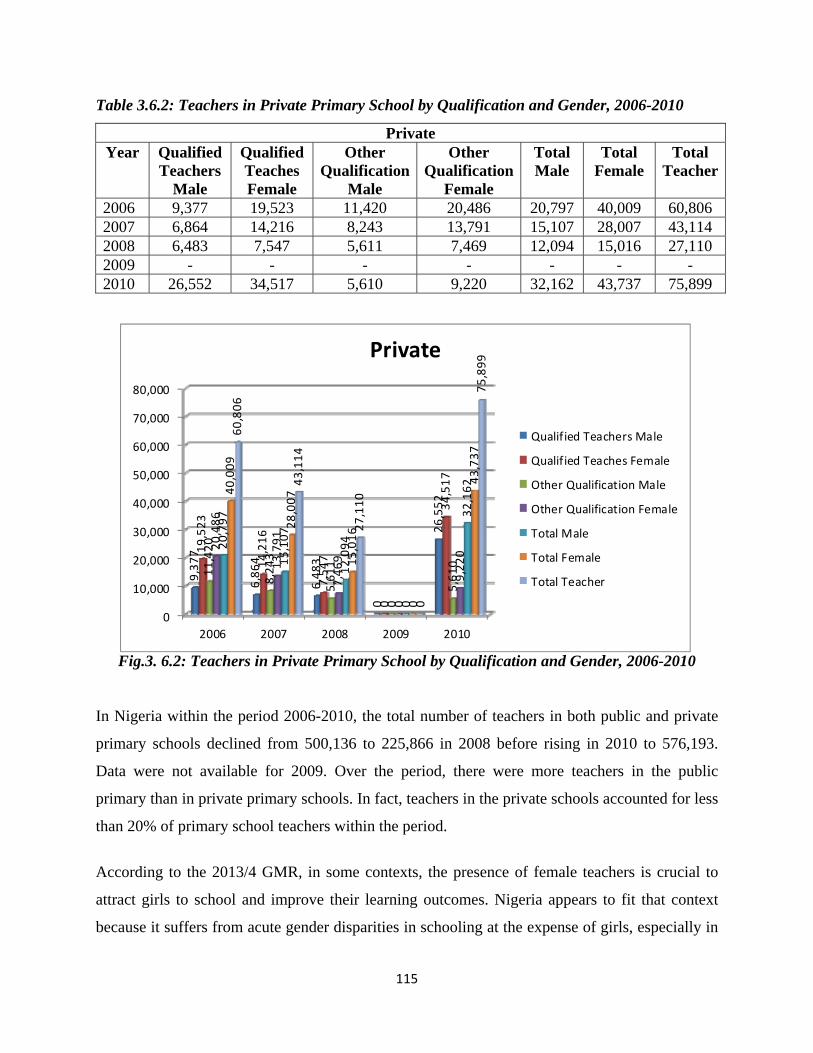
115
Table 3.6.2: Teachers in Private Primary School by Qualification and Gender, 2006-2010
Private Year Qualified
Teachers Male
Qualified Teaches Female
Other Qualification
Male
Other Qualification
Female
Total Male
Total Female
Total Teacher
2006 9,377 19,523 11,420 20,486 20,797 40,009 60,806 2007 6,864 14,216 8,243 13,791 15,107 28,007 43,114 2008 6,483 7,547 5,611 7,469 12,094 15,016 27,110 2009 - - - - - - - 2010 26,552 34,517 5,610 9,220 32,162 43,737 75,899
Fig.3. 6.2: Teachers in Private Primary School by Qualification and Gender, 2006-2010
In Nigeria within the period 2006-2010, the total number of teachers in both public and private
primary schools declined from 500,136 to 225,866 in 2008 before rising in 2010 to 576,193.
Data were not available for 2009. Over the period, there were more teachers in the public
primary than in private primary schools. In fact, teachers in the private schools accounted for less
than 20% of primary school teachers within the period.
According to the 2013/4 GMR, in some contexts, the presence of female teachers is crucial to
attract girls to school and improve their learning outcomes. Nigeria appears to fit that context
because it suffers from acute gender disparities in schooling at the expense of girls, especially in
0
10,000
20,000
30,000
40,000
50,000
60,000
70,000
80,000
2006 2007 2008 2009 2010
9,377
6,864
6,483
0
26,552
19,523
14,216
7,547
0
34,517
11,420
8,243
5,611
0
5,610
20,486
13,791
7,469
0
9,220
20,797
15,107
12,094
0
32,162
40,009
28,007
15,016
0
43,737
60,806
43,114
27,110
0
75,899Private
Qualified Teachers Male
Qualified Teaches Female
Other Qualification Male
Other Qualification Female
Total Male
Total Female
Total Teacher
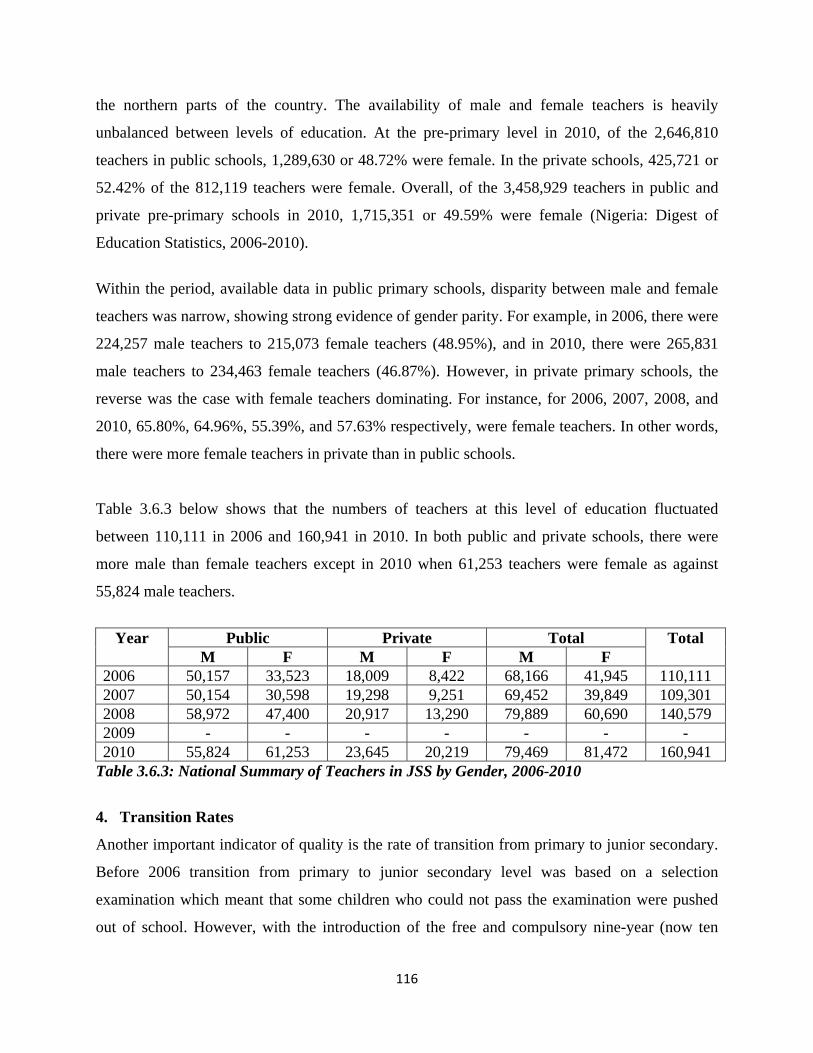
116
the northern parts of the country. The availability of male and female teachers is heavily
unbalanced between levels of education. At the pre-primary level in 2010, of the 2,646,810
teachers in public schools, 1,289,630 or 48.72% were female. In the private schools, 425,721 or
52.42% of the 812,119 teachers were female. Overall, of the 3,458,929 teachers in public and
private pre-primary schools in 2010, 1,715,351 or 49.59% were female (Nigeria: Digest of
Education Statistics, 2006-2010).
Within the period, available data in public primary schools, disparity between male and female
teachers was narrow, showing strong evidence of gender parity. For example, in 2006, there were
224,257 male teachers to 215,073 female teachers (48.95%), and in 2010, there were 265,831
male teachers to 234,463 female teachers (46.87%). However, in private primary schools, the
reverse was the case with female teachers dominating. For instance, for 2006, 2007, 2008, and
2010, 65.80%, 64.96%, 55.39%, and 57.63% respectively, were female teachers. In other words,
there were more female teachers in private than in public schools.
Table 3.6.3 below shows that the numbers of teachers at this level of education fluctuated
between 110,111 in 2006 and 160,941 in 2010. In both public and private schools, there were
more male than female teachers except in 2010 when 61,253 teachers were female as against
55,824 male teachers.
Year Public Private Total Total M F M F M F
2006 50,157 33,523 18,009 8,422 68,166 41,945 110,111 2007 50,154 30,598 19,298 9,251 69,452 39,849 109,301 2008 58,972 47,400 20,917 13,290 79,889 60,690 140,579 2009 - - - - - - - 2010 55,824 61,253 23,645 20,219 79,469 81,472 160,941
Table 3.6.3: National Summary of Teachers in JSS by Gender, 2006-2010
4. Transition Rates
Another important indicator of quality is the rate of transition from primary to junior secondary.
Before 2006 transition from primary to junior secondary level was based on a selection
examination which meant that some children who could not pass the examination were pushed
out of school. However, with the introduction of the free and compulsory nine-year (now ten
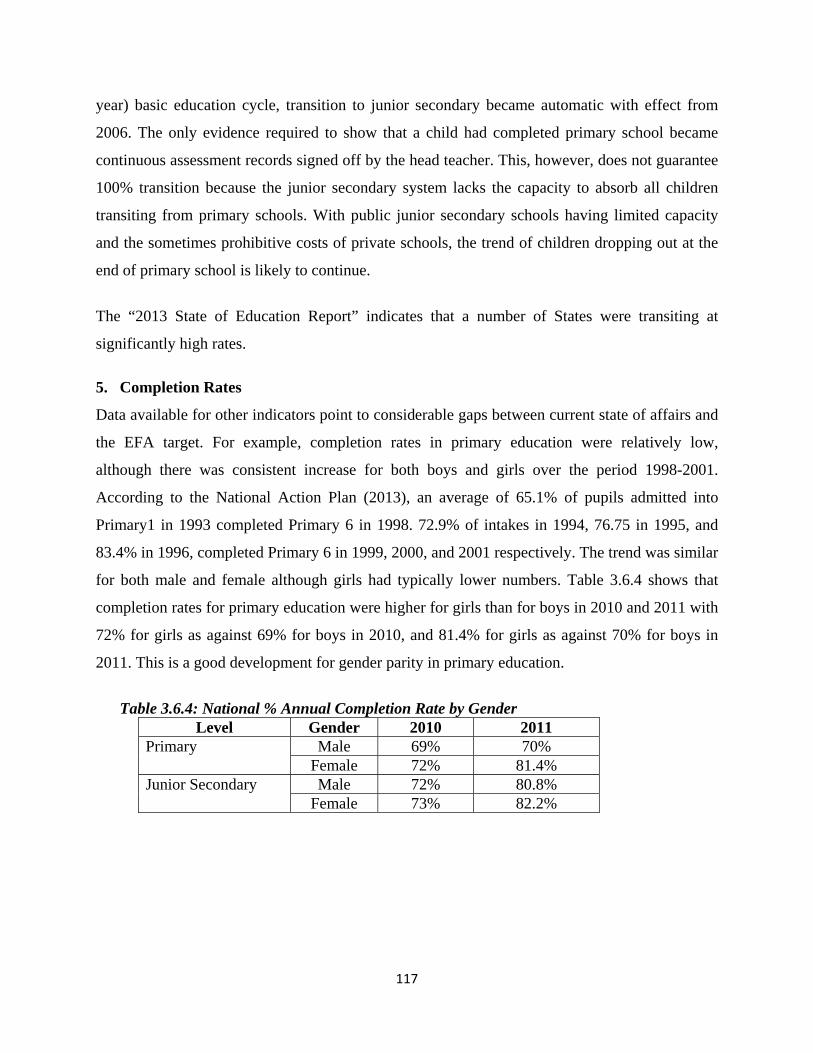
117
year) basic education cycle, transition to junior secondary became automatic with effect from
2006. The only evidence required to show that a child had completed primary school became
continuous assessment records signed off by the head teacher. This, however, does not guarantee
100% transition because the junior secondary system lacks the capacity to absorb all children
transiting from primary schools. With public junior secondary schools having limited capacity
and the sometimes prohibitive costs of private schools, the trend of children dropping out at the
end of primary school is likely to continue.
The “2013 State of Education Report” indicates that a number of States were transiting at
significantly high rates.
5. Completion Rates
Data available for other indicators point to considerable gaps between current state of affairs and
the EFA target. For example, completion rates in primary education were relatively low,
although there was consistent increase for both boys and girls over the period 1998-2001.
According to the National Action Plan (2013), an average of 65.1% of pupils admitted into
Primary1 in 1993 completed Primary 6 in 1998. 72.9% of intakes in 1994, 76.75 in 1995, and
83.4% in 1996, completed Primary 6 in 1999, 2000, and 2001 respectively. The trend was similar
for both male and female although girls had typically lower numbers. Table 3.6.4 shows that
completion rates for primary education were higher for girls than for boys in 2010 and 2011 with
72% for girls as against 69% for boys in 2010, and 81.4% for girls as against 70% for boys in
2011. This is a good development for gender parity in primary education.
Table 3.6.4: National % Annual Completion Rate by Gender
Level Gender 2010 2011 Primary Male 69% 70%
Female 72% 81.4% Junior Secondary Male 72% 80.8%
Female 73% 82.2%
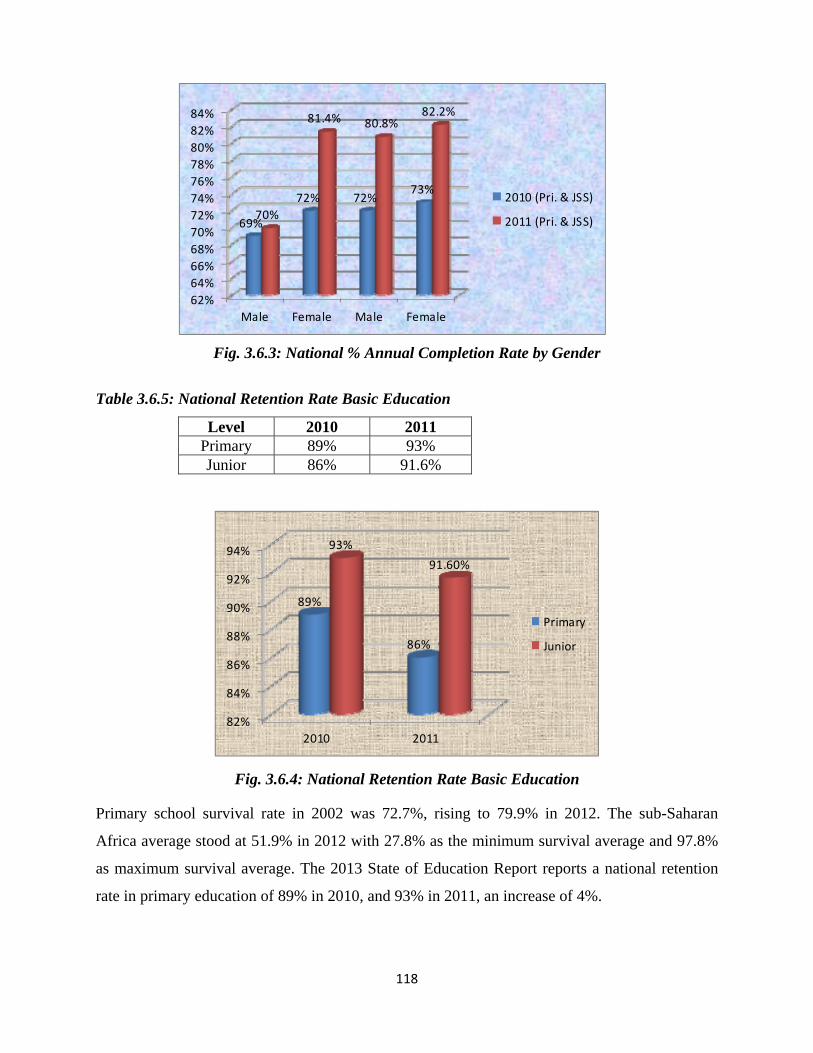
118
Fig. 3.6.3: National % Annual Completion Rate by Gender
Table 3.6.5: National Retention Rate Basic Education
Level 2010 2011 Primary 89% 93% Junior 86% 91.6%
Fig. 3.6.4: National Retention Rate Basic Education
Primary school survival rate in 2002 was 72.7%, rising to 79.9% in 2012. The sub-Saharan
Africa average stood at 51.9% in 2012 with 27.8% as the minimum survival average and 97.8%
as maximum survival average. The 2013 State of Education Report reports a national retention
rate in primary education of 89% in 2010, and 93% in 2011, an increase of 4%.
62%
64%
66%
68%
70%
72%
74%
76%
78%
80%
82%
84%
Male Female Male Female
69%
72% 72%73%
70%
81.4% 80.8%82.2%
2010 (Pri. & JSS)
2011 (Pri. & JSS)
82%
84%
86%
88%
90%
92%
94%
2010 2011
89%
86%
93%
91.60%
Primary
Junior
119
6. Pupil-teacher ratio in basic education
The pupil/teacher ratio has been a key measure for assessing progress towards Goal 6 since the
EFA goals were set. Globally, between 1999 and 2011, average pupil/teacher ratios have barely
changed at the pre-primary, primary, and secondary education levels (GMR, 2013/4:85).
According to the report, in primary education, pupil/teacher ratio improved slightly from 26:1 to
24:1. In sub-Saharan Africa, pupil/teacher ratio hardly changed at any level of education. In
primary education, teacher recruitment grew by 62%, lagging behind enrolment which grew by
66% over the period. At 44 pupils per teacher, this is the region with the highest ratio at the
primary level.
Pupil/teacher ratio at the primary education level improved from 46:1 in 2006 to 36:1 in 2010.
The computation of the pupil/teacher ratio was based on total number of teachers at the primary
level. This number is made up of teachers with the national minimum qualification for teaching
in the primary school, and those without the national standard. For example, in 2006, 56% of
primary school teachers were qualified and the figure rose to 66% in 2010. In terms of qualified
teachers, the pupil/qualified teacher ratios for 2006 and 2010 were 82:1 and 54:1 respectively. At
the JS level, the pupil/teacher ratio was 31:1 in 2010, up from 27:1 in 2006. The rise, though not
significant, could be attributed to the rise in enrollment in 2010 which was not matched by a
corresponding increase in teacher recruitment.
On the issue of quality of teachers, the National Council on Education (NCE) at its 57th meeting
held from 21st to 25th February, 2011 in Sokoto, in section B(iv) and (v) of the communiqué
urged:
FME, States and FCT to embark on a gradual phasing out of unqualified teachers from the
school system;
Federal, States and FCT to organize regular induction programmes for the trained NYSC
members deployed to the school system.
Nearly all the states in the federation are complying, with the exception of only a few states in
the north-east still battling with shortage of teachers and have to fall back on TC II teachers, and
sometimes school certificate holders.
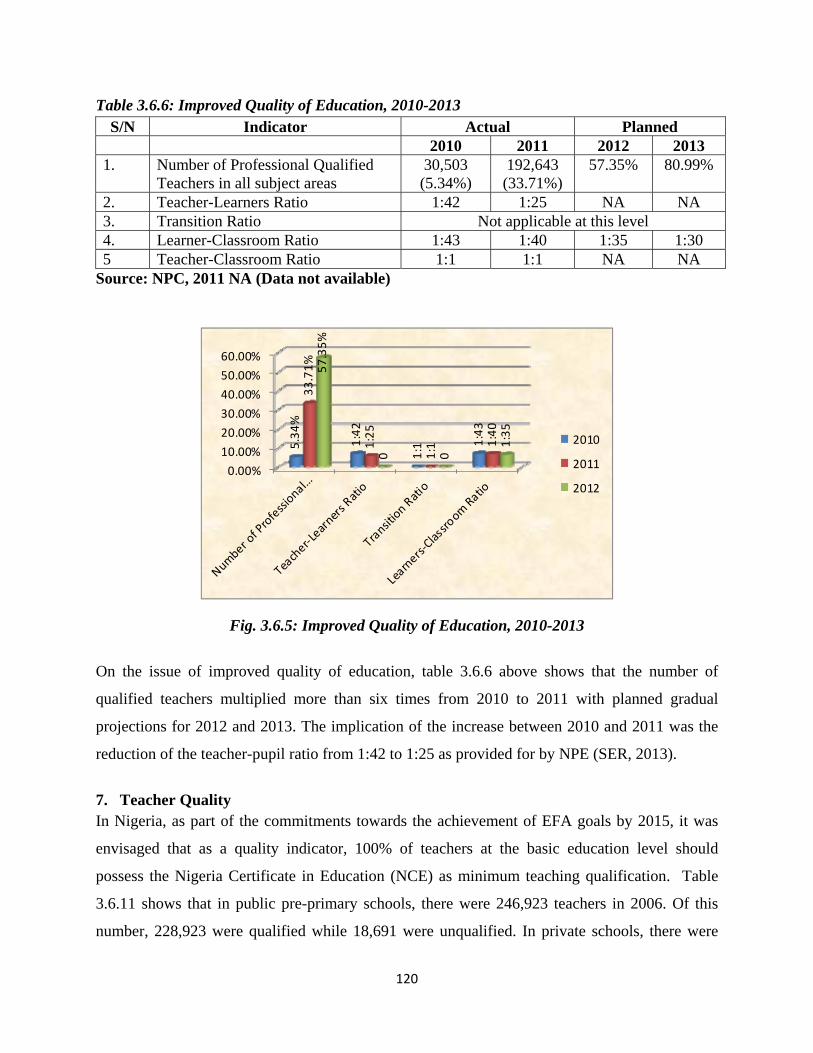
120
Table 3.6.6: Improved Quality of Education, 2010-2013 S/N Indicator Actual Planned
2010 2011 2012 2013 1. Number of Professional Qualified
Teachers in all subject areas 30,503 (5.34%)
192,643 (33.71%)
57.35% 80.99%
2. Teacher-Learners Ratio 1:42 1:25 NA NA 3. Transition Ratio Not applicable at this level 4. Learner-Classroom Ratio 1:43 1:40 1:35 1:30 5 Teacher-Classroom Ratio 1:1 1:1 NA NA
Source: NPC, 2011 NA (Data not available)
Fig. 3.6.5: Improved Quality of Education, 2010-2013
On the issue of improved quality of education, table 3.6.6 above shows that the number of
qualified teachers multiplied more than six times from 2010 to 2011 with planned gradual
projections for 2012 and 2013. The implication of the increase between 2010 and 2011 was the
reduction of the teacher-pupil ratio from 1:42 to 1:25 as provided for by NPE (SER, 2013).
7. Teacher Quality In Nigeria, as part of the commitments towards the achievement of EFA goals by 2015, it was
envisaged that as a quality indicator, 100% of teachers at the basic education level should
possess the Nigeria Certificate in Education (NCE) as minimum teaching qualification. Table
3.6.11 shows that in public pre-primary schools, there were 246,923 teachers in 2006. Of this
number, 228,923 were qualified while 18,691 were unqualified. In private schools, there were
0.00%
10.00%
20.00%
30.00%
40.00%
50.00%
60.00%
5.34%
1:42
1:1 1:43
33.71%
1:25
1:1 1:40
57.35%
0 0
1:35
2010
2011
2012
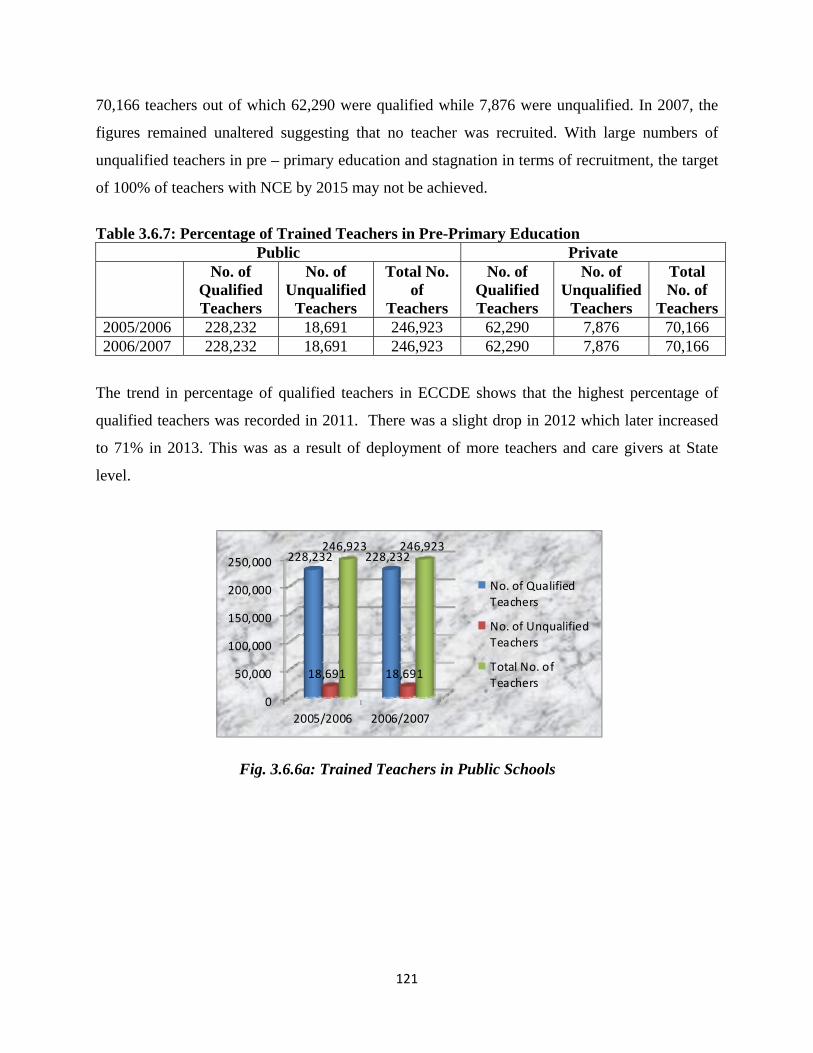
121
70,166 teachers out of which 62,290 were qualified while 7,876 were unqualified. In 2007, the
figures remained unaltered suggesting that no teacher was recruited. With large numbers of
unqualified teachers in pre – primary education and stagnation in terms of recruitment, the target
of 100% of teachers with NCE by 2015 may not be achieved.
Table 3.6.7: Percentage of Trained Teachers in Pre-Primary Education
Public Private No. of
Qualified Teachers
No. of Unqualified
Teachers
Total No. of
Teachers
No. of Qualified Teachers
No. of Unqualified
Teachers
Total No. of
Teachers2005/2006 228,232 18,691 246,923 62,290 7,876 70,166 2006/2007 228,232 18,691 246,923 62,290 7,876 70,166
The trend in percentage of qualified teachers in ECCDE shows that the highest percentage of
qualified teachers was recorded in 2011. There was a slight drop in 2012 which later increased
to 71% in 2013. This was as a result of deployment of more teachers and care givers at State
level.
Fig. 3.6.6a: Trained Teachers in Public Schools
0
50,000
100,000
150,000
200,000
250,000
2005/2006 2006/2007
228,232 228,232
18,691 18,691
246,923 246,923
No. of QualifiedTeachers
No. of UnqualifiedTeachers
Total No. ofTeachers
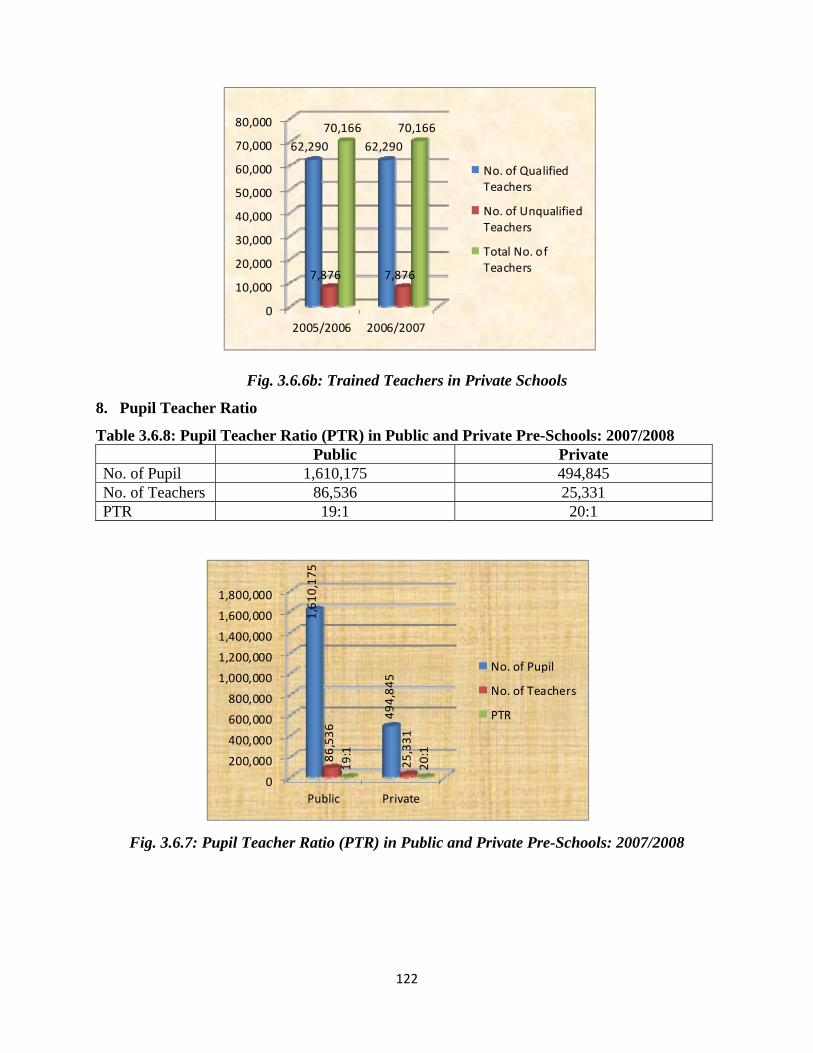
122
Fig. 3.6.6b: Trained Teachers in Private Schools
8. Pupil Teacher Ratio
Table 3.6.8: Pupil Teacher Ratio (PTR) in Public and Private Pre-Schools: 2007/2008 Public Private
No. of Pupil 1,610,175 494,845 No. of Teachers 86,536 25,331 PTR 19:1 20:1
Fig. 3.6.7: Pupil Teacher Ratio (PTR) in Public and Private Pre-Schools: 2007/2008
0
10,000
20,000
30,000
40,000
50,000
60,000
70,000
80,000
2005/2006 2006/2007
62,290 62,290
7,876 7,876
70,166 70,166
No. of QualifiedTeachers
No. of UnqualifiedTeachers
Total No. ofTeachers
0
200,000
400,000
600,000
800,000
1,000,000
1,200,000
1,400,000
1,600,000
1,800,000
Public Private
1,610,175
494,845
86,536
25,331
19:1
20:1
No. of Pupil
No. of Teachers
PTR
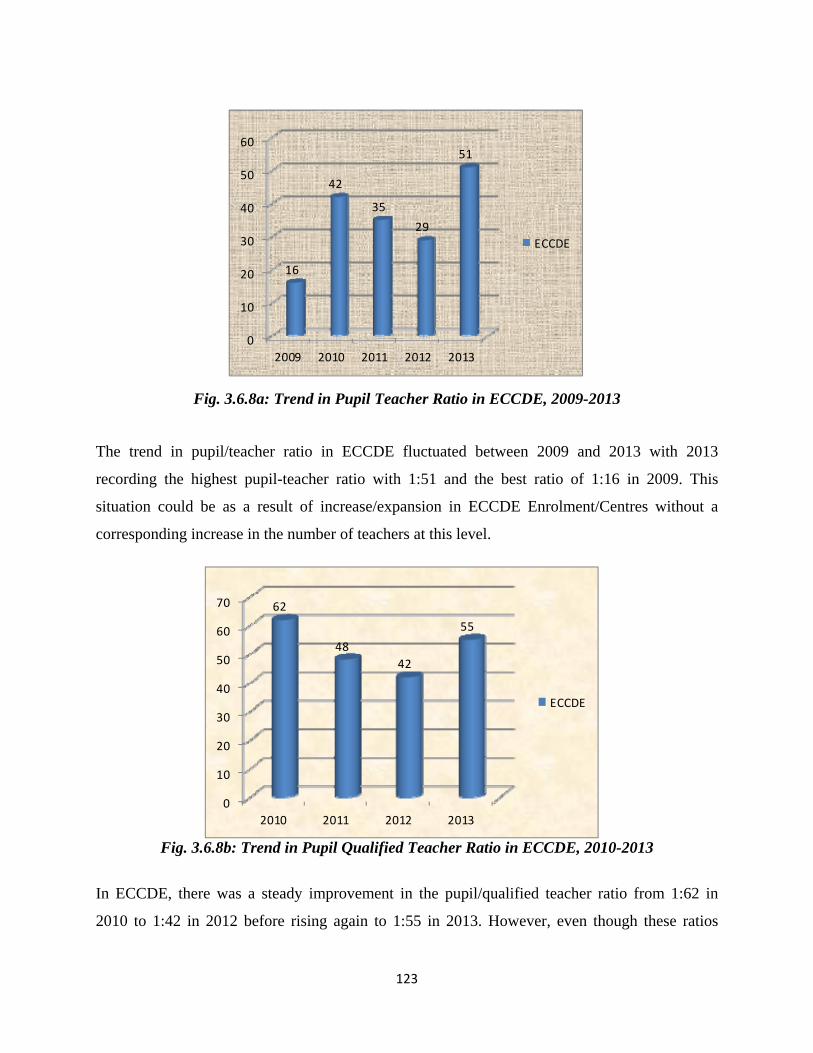
123
Fig. 3.6.8a: Trend in Pupil Teacher Ratio in ECCDE, 2009-2013
The trend in pupil/teacher ratio in ECCDE fluctuated between 2009 and 2013 with 2013
recording the highest pupil-teacher ratio with 1:51 and the best ratio of 1:16 in 2009. This
situation could be as a result of increase/expansion in ECCDE Enrolment/Centres without a
corresponding increase in the number of teachers at this level.
Fig. 3.6.8b: Trend in Pupil Qualified Teacher Ratio in ECCDE, 2010-2013
In ECCDE, there was a steady improvement in the pupil/qualified teacher ratio from 1:62 in
2010 to 1:42 in 2012 before rising again to 1:55 in 2013. However, even though these ratios
0
10
20
30
40
50
60
2009 2010 2011 2012 2013
16
42
35
29
51
ECCDE
0
10
20
30
40
50
60
70
2010 2011 2012 2013
62
48
42
55
ECCDE
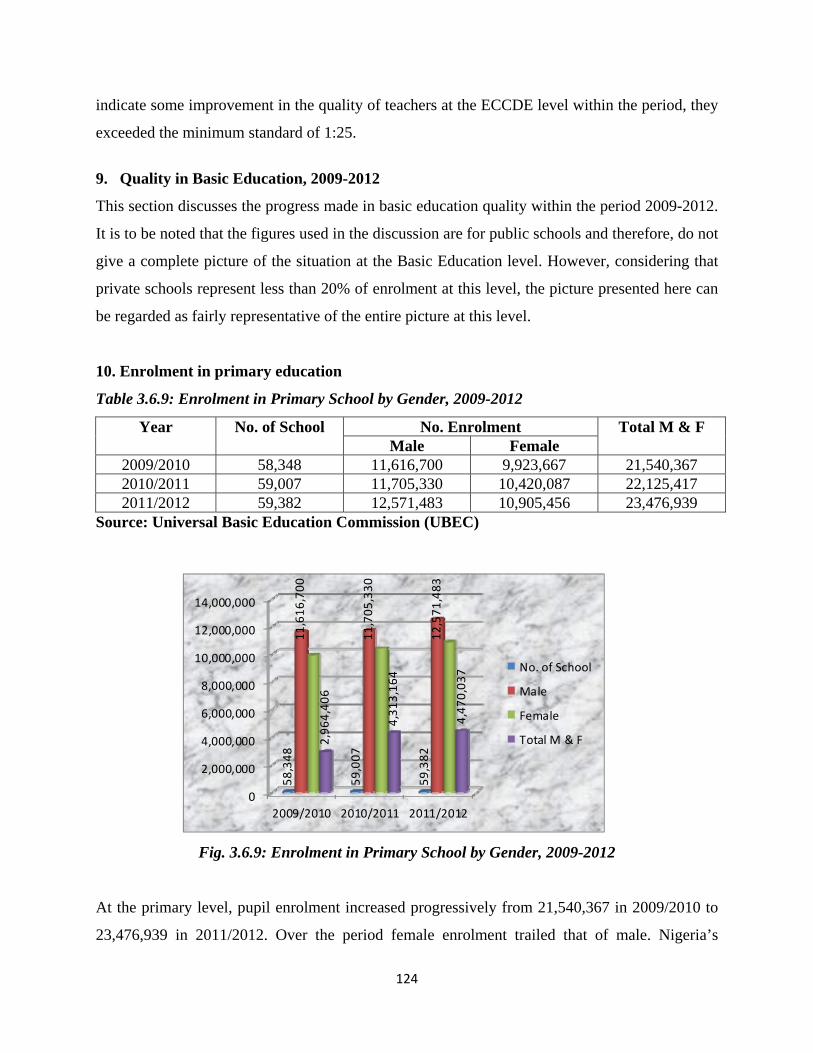
124
indicate some improvement in the quality of teachers at the ECCDE level within the period, they
exceeded the minimum standard of 1:25.
9. Quality in Basic Education, 2009-2012
This section discusses the progress made in basic education quality within the period 2009-2012.
It is to be noted that the figures used in the discussion are for public schools and therefore, do not
give a complete picture of the situation at the Basic Education level. However, considering that
private schools represent less than 20% of enrolment at this level, the picture presented here can
be regarded as fairly representative of the entire picture at this level.
10. Enrolment in primary education
Table 3.6.9: Enrolment in Primary School by Gender, 2009-2012
Year No. of School No. Enrolment Total M & F Male Female
2009/2010 58,348 11,616,700 9,923,667 21,540,367 2010/2011 59,007 11,705,330 10,420,087 22,125,417 2011/2012 59,382 12,571,483 10,905,456 23,476,939
Source: Universal Basic Education Commission (UBEC)
Fig. 3.6.9: Enrolment in Primary School by Gender, 2009-2012
At the primary level, pupil enrolment increased progressively from 21,540,367 in 2009/2010 to
23,476,939 in 2011/2012. Over the period female enrolment trailed that of male. Nigeria’s
0
2,000,000
4,000,000
6,000,000
8,000,000
10,000,000
12,000,000
14,000,000
2009/2010 2010/2011 2011/2012
58,348
59,007
59,382
11,616,700
11,705,330
12,571,483
2,964,406
4,313,164
4,470,037 No. of School
Male
Female
Total M & F
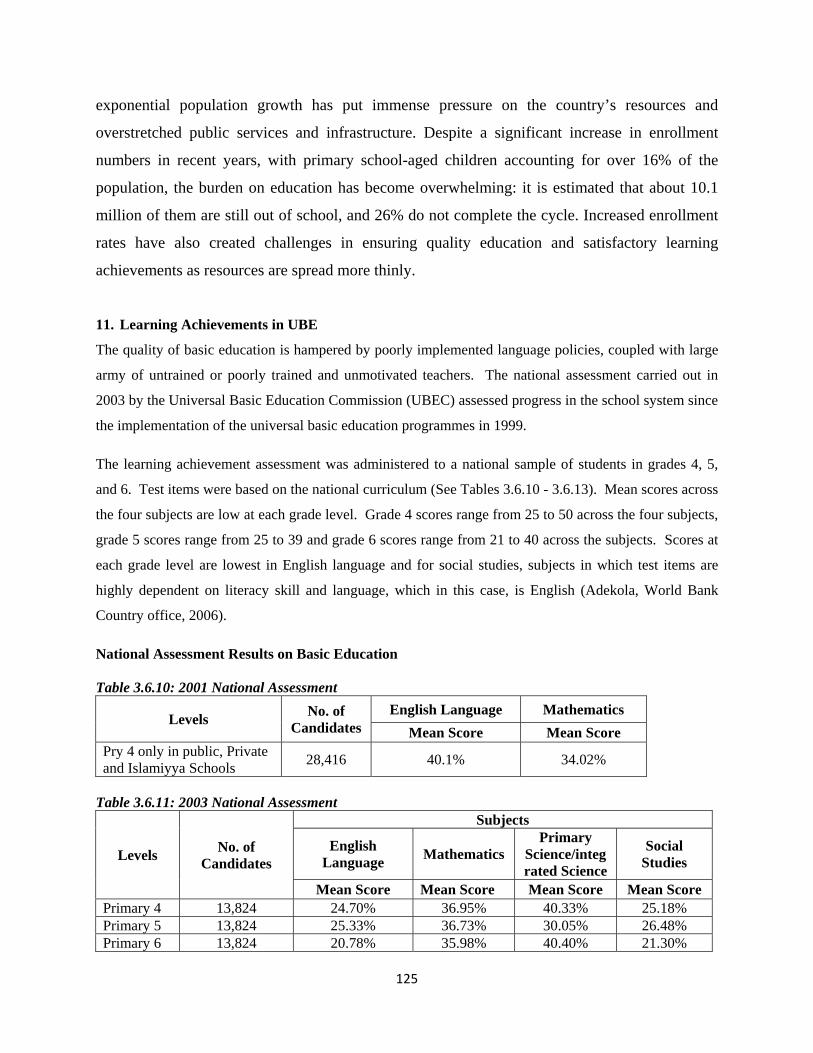
125
exponential population growth has put immense pressure on the country’s resources and
overstretched public services and infrastructure. Despite a significant increase in enrollment
numbers in recent years, with primary school-aged children accounting for over 16% of the
population, the burden on education has become overwhelming: it is estimated that about 10.1
million of them are still out of school, and 26% do not complete the cycle. Increased enrollment
rates have also created challenges in ensuring quality education and satisfactory learning
achievements as resources are spread more thinly.
11. Learning Achievements in UBE
The quality of basic education is hampered by poorly implemented language policies, coupled with large
army of untrained or poorly trained and unmotivated teachers. The national assessment carried out in
2003 by the Universal Basic Education Commission (UBEC) assessed progress in the school system since
the implementation of the universal basic education programmes in 1999.
The learning achievement assessment was administered to a national sample of students in grades 4, 5,
and 6. Test items were based on the national curriculum (See Tables 3.6.10 - 3.6.13). Mean scores across
the four subjects are low at each grade level. Grade 4 scores range from 25 to 50 across the four subjects,
grade 5 scores range from 25 to 39 and grade 6 scores range from 21 to 40 across the subjects. Scores at
each grade level are lowest in English language and for social studies, subjects in which test items are
highly dependent on literacy skill and language, which in this case, is English (Adekola, World Bank
Country office, 2006).
National Assessment Results on Basic Education Table 3.6.10: 2001 National Assessment
Levels No. of
Candidates English Language Mathematics
Mean Score Mean Score Pry 4 only in public, Private and Islamiyya Schools
28,416 40.1% 34.02%
Table 3.6.11: 2003 National Assessment
Levels No. of
Candidates
Subjects
English Language
Mathematics Primary
Science/integrated Science
Social Studies
Mean Score Mean Score Mean Score Mean Score Primary 4 13,824 24.70% 36.95% 40.33% 25.18% Primary 5 13,824 25.33% 36.73% 30.05% 26.48% Primary 6 13,824 20.78% 35.98% 40.40% 21.30%
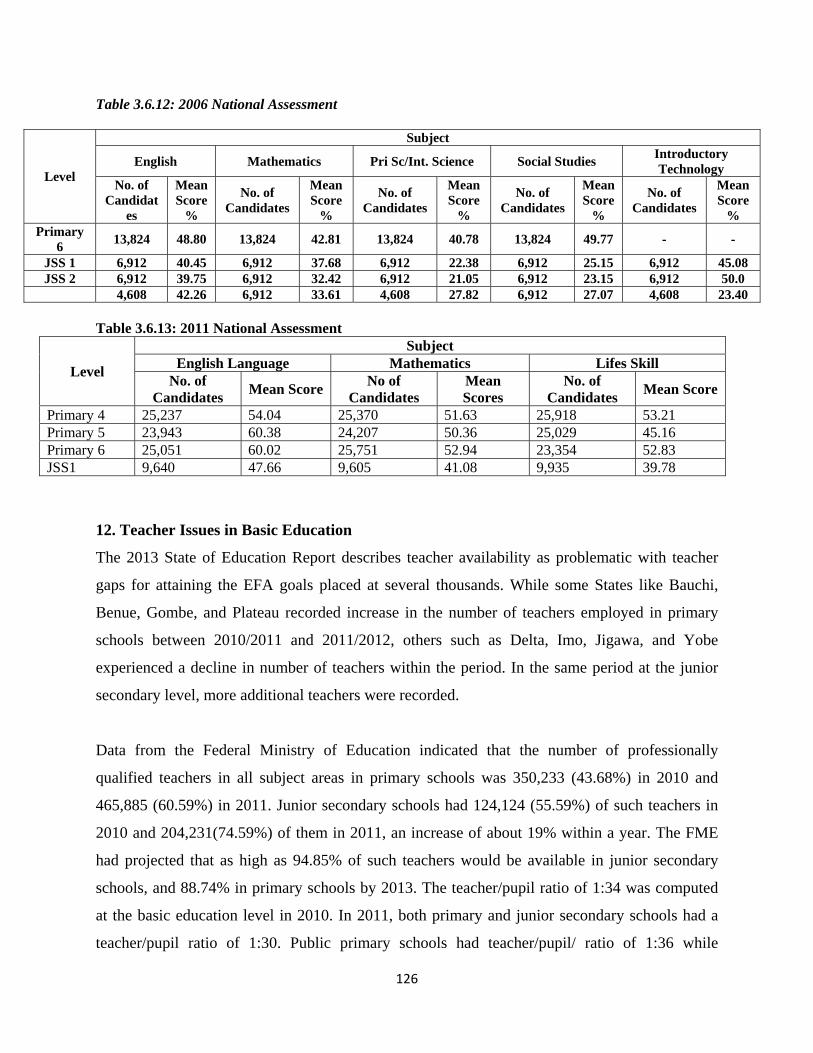
126
Table 3.6.12: 2006 National Assessment
Level
Subject
English Mathematics Pri Sc/Int. Science Social Studies Introductory Technology
No. of Candidat
es
Mean Score
%
No. of Candidates
Mean Score
%
No. of Candidates
Mean Score
%
No. of Candidates
Mean Score
%
No. of Candidates
Mean Score
% Primary
6 13,824 48.80 13,824 42.81 13,824 40.78 13,824 49.77 - -
JSS 1 6,912 40.45 6,912 37.68 6,912 22.38 6,912 25.15 6,912 45.08 JSS 2 6,912 39.75 6,912 32.42 6,912 21.05 6,912 23.15 6,912 50.0
4,608 42.26 6,912 33.61 4,608 27.82 6,912 27.07 4,608 23.40 Table 3.6.13: 2011 National Assessment
Level
Subject English Language Mathematics Lifes Skill
No. of Candidates
Mean Score No of
Candidates Mean Scores
No. of Candidates
Mean Score
Primary 4 25,237 54.04 25,370 51.63 25,918 53.21 Primary 5 23,943 60.38 24,207 50.36 25,029 45.16 Primary 6 25,051 60.02 25,751 52.94 23,354 52.83 JSS1 9,640 47.66 9,605 41.08 9,935 39.78
12. Teacher Issues in Basic Education
The 2013 State of Education Report describes teacher availability as problematic with teacher
gaps for attaining the EFA goals placed at several thousands. While some States like Bauchi,
Benue, Gombe, and Plateau recorded increase in the number of teachers employed in primary
schools between 2010/2011 and 2011/2012, others such as Delta, Imo, Jigawa, and Yobe
experienced a decline in number of teachers within the period. In the same period at the junior
secondary level, more additional teachers were recorded.
Data from the Federal Ministry of Education indicated that the number of professionally
qualified teachers in all subject areas in primary schools was 350,233 (43.68%) in 2010 and
465,885 (60.59%) in 2011. Junior secondary schools had 124,124 (55.59%) of such teachers in
2010 and 204,231(74.59%) of them in 2011, an increase of about 19% within a year. The FME
had projected that as high as 94.85% of such teachers would be available in junior secondary
schools, and 88.74% in primary schools by 2013. The teacher/pupil ratio of 1:34 was computed
at the basic education level in 2010. In 2011, both primary and junior secondary schools had a
teacher/pupil ratio of 1:30. Public primary schools had teacher/pupil/ ratio of 1:36 while
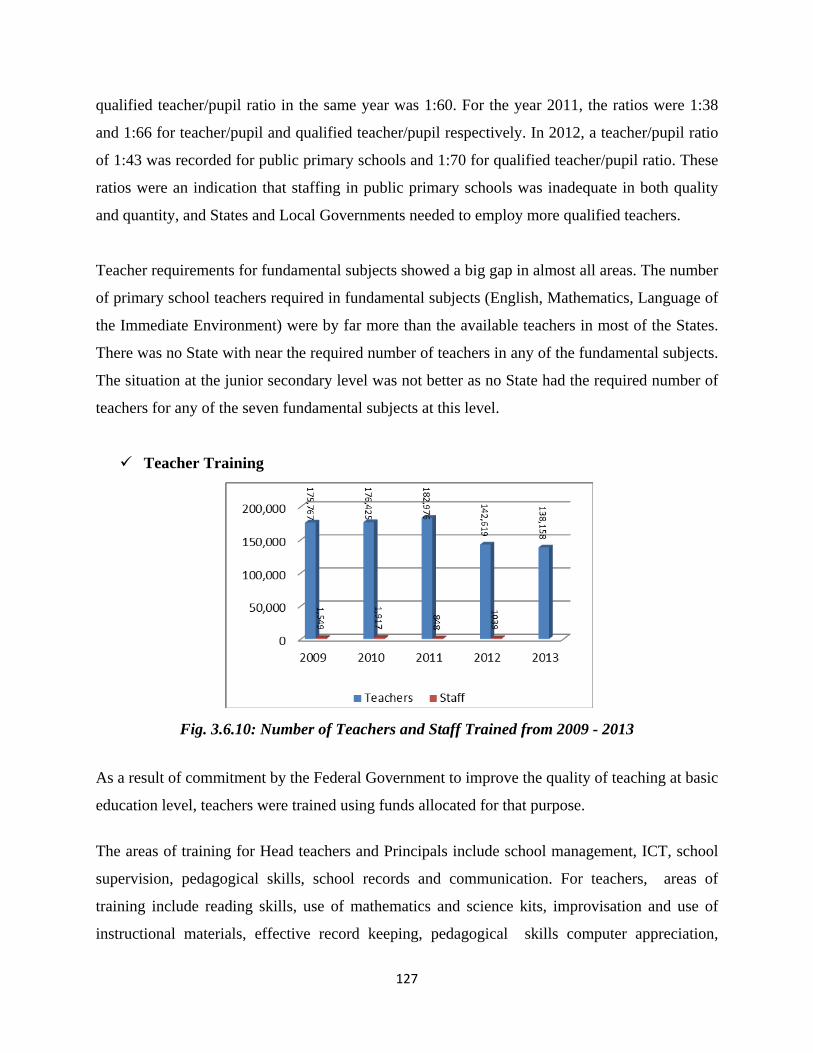
127
qualified teacher/pupil ratio in the same year was 1:60. For the year 2011, the ratios were 1:38
and 1:66 for teacher/pupil and qualified teacher/pupil respectively. In 2012, a teacher/pupil ratio
of 1:43 was recorded for public primary schools and 1:70 for qualified teacher/pupil ratio. These
ratios were an indication that staffing in public primary schools was inadequate in both quality
and quantity, and States and Local Governments needed to employ more qualified teachers.
Teacher requirements for fundamental subjects showed a big gap in almost all areas. The number
of primary school teachers required in fundamental subjects (English, Mathematics, Language of
the Immediate Environment) were by far more than the available teachers in most of the States.
There was no State with near the required number of teachers in any of the fundamental subjects.
The situation at the junior secondary level was not better as no State had the required number of
teachers for any of the seven fundamental subjects at this level.
Teacher Training
Fig. 3.6.10: Number of Teachers and Staff Trained from 2009 - 2013
As a result of commitment by the Federal Government to improve the quality of teaching at basic
education level, teachers were trained using funds allocated for that purpose.
The areas of training for Head teachers and Principals include school management, ICT, school
supervision, pedagogical skills, school records and communication. For teachers, areas of
training include reading skills, use of mathematics and science kits, improvisation and use of
instructional materials, effective record keeping, pedagogical skills computer appreciation,
128
implementation of HIV/AIDS curriculum, unified continuous assessment, professional
development, cluster school model, methodology of teaching Social Studies. A good number of
States are emphasizing training for heads of schools and teachers although the relevance and
depth of the training are yet to be determined.
The National Teachers Institute (NTI) was established in 1978 with the mandate to organize and
provide programmes for training, development, upgrading and certification of teachers. Since its
inception, the institute has progressively strengthened its role in running training programmes to
upgrade the qualification and competences of teachers at the basic and secondary education
levels especially, taking advantage of Open Distance Learning (ODL). It presently runs academic
programmes for NCE, Advance Diploma and PIVOTAL Teacher Training by the Distant
Learning System (DLS), in addition to Special Teacher Upgrading Programme (STUP).
The National Institute for Educational Planning and Administration (NIEPA) was established in
1992 as a sub-regional staff development Institute for education sector planners and managers.
The Institute serves as a resource centre for regular capacity building, research, consulting, as
well as dissemination of relevant information for effective and efficient management of the
education sector.
10. Infrastructure
Quality is enhanced by the provision of adequate numbers and specifications of facilities that
would comfortably serve as a child-friendly school environment. The facilities include
classrooms, separate toilets for boys and girls, technology workshops, and integrated science
laboratories. According to the 2013 State of Education Report, one of the most important
facilities in formal schooling is classroom space. Especially in the urban centres, schools are
overcrowded, a situation that makes it difficult for teacher-pupil contact, thereby making difficult
an effective teaching- learning process. The number of pupils in a class is a very important factor
in the learning process. Generally, schools at ECCDE level adopt class-teacher method rather
than subject-teacher method. The NPE (2013) pegs teacher-pupil-ratio in crèches at 10:1 while
nursery schools and kindergartens are pegged at 25:1. In consideration of the above, it may be
expedient to also peg the class size in crèches at 10 pupils, while a class in either nursery or
kindergarten should not have more than 25 pupils.
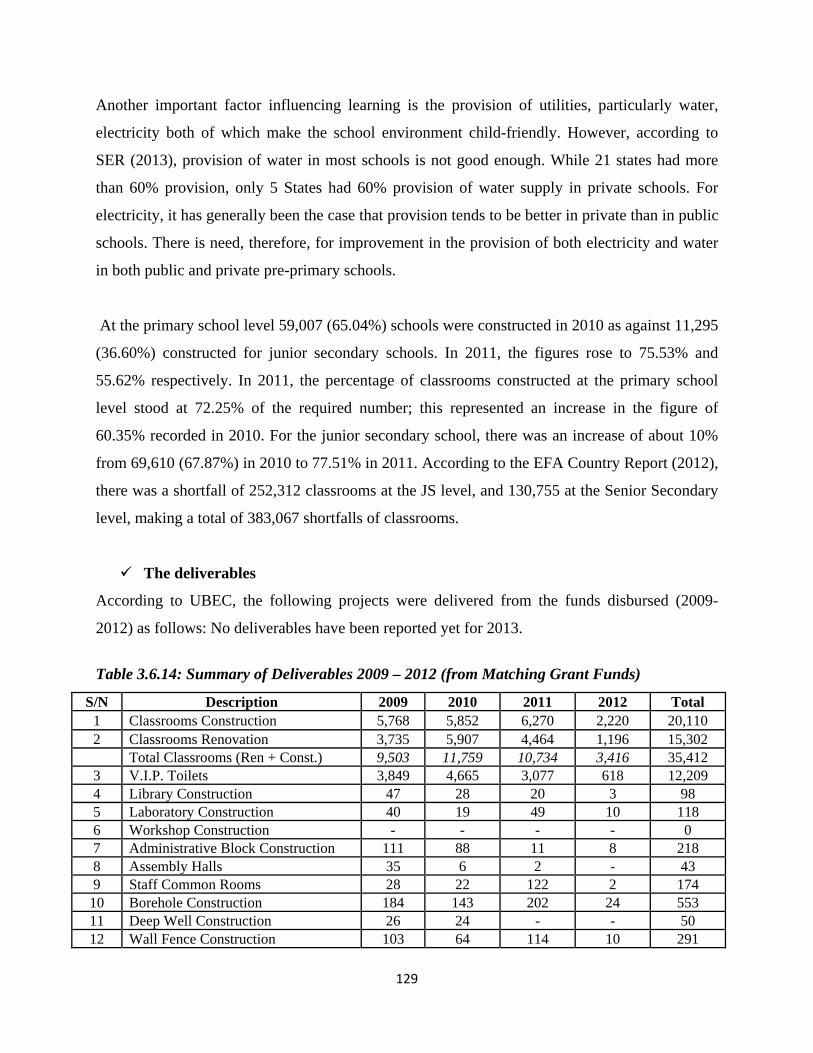
129
Another important factor influencing learning is the provision of utilities, particularly water,
electricity both of which make the school environment child-friendly. However, according to
SER (2013), provision of water in most schools is not good enough. While 21 states had more
than 60% provision, only 5 States had 60% provision of water supply in private schools. For
electricity, it has generally been the case that provision tends to be better in private than in public
schools. There is need, therefore, for improvement in the provision of both electricity and water
in both public and private pre-primary schools.
At the primary school level 59,007 (65.04%) schools were constructed in 2010 as against 11,295
(36.60%) constructed for junior secondary schools. In 2011, the figures rose to 75.53% and
55.62% respectively. In 2011, the percentage of classrooms constructed at the primary school
level stood at 72.25% of the required number; this represented an increase in the figure of
60.35% recorded in 2010. For the junior secondary school, there was an increase of about 10%
from 69,610 (67.87%) in 2010 to 77.51% in 2011. According to the EFA Country Report (2012),
there was a shortfall of 252,312 classrooms at the JS level, and 130,755 at the Senior Secondary
level, making a total of 383,067 shortfalls of classrooms.
The deliverables
According to UBEC, the following projects were delivered from the funds disbursed (2009-
2012) as follows: No deliverables have been reported yet for 2013.
Table 3.6.14: Summary of Deliverables 2009 – 2012 (from Matching Grant Funds)
S/N Description 2009 2010 2011 2012 Total 1 Classrooms Construction 5,768 5,852 6,270 2,220 20,110 2 Classrooms Renovation 3,735 5,907 4,464 1,196 15,302 Total Classrooms (Ren + Const.) 9,503 11,759 10,734 3,416 35,412 3 V.I.P. Toilets 3,849 4,665 3,077 618 12,209 4 Library Construction 47 28 20 3 98 5 Laboratory Construction 40 19 49 10 118 6 Workshop Construction - - - - 0 7 Administrative Block Construction 111 88 11 8 218 8 Assembly Halls 35 6 2 - 43 9 Staff Common Rooms 28 22 122 2 174
10 Borehole Construction 184 143 202 24 553 11 Deep Well Construction 26 24 - - 50 12 Wall Fence Construction 103 64 114 10 291
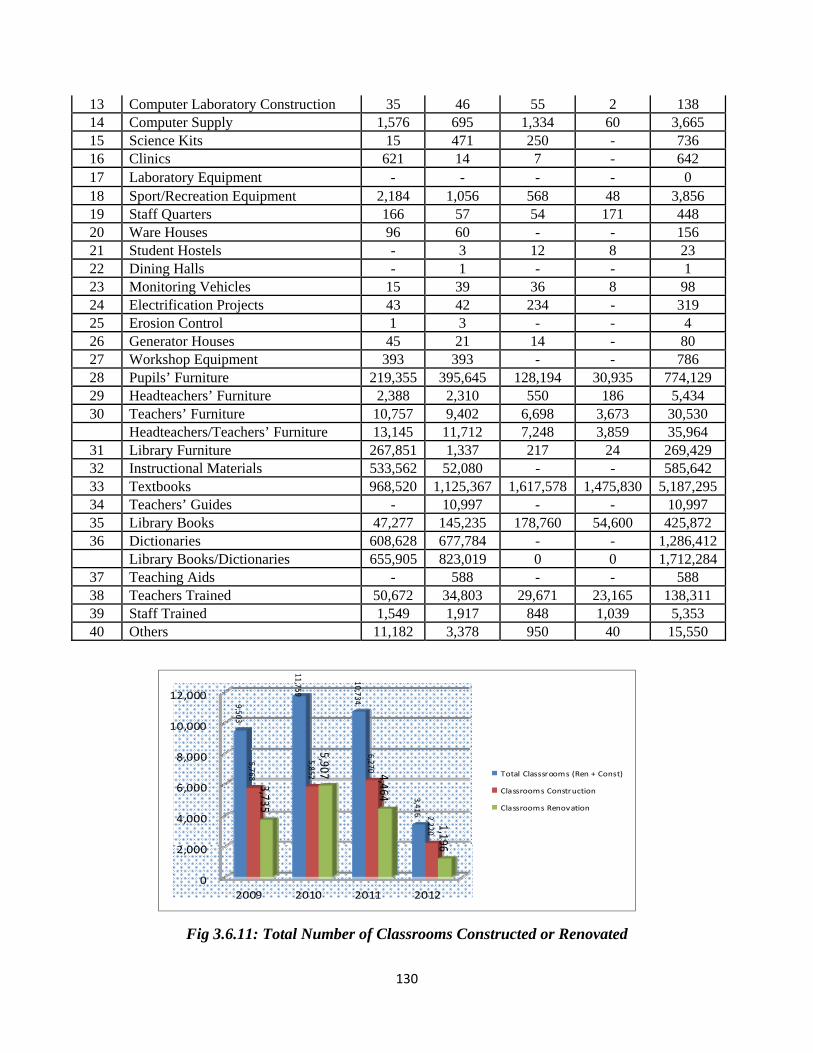
130
13 Computer Laboratory Construction 35 46 55 2 138 14 Computer Supply 1,576 695 1,334 60 3,665 15 Science Kits 15 471 250 - 736 16 Clinics 621 14 7 - 642 17 Laboratory Equipment - - - - 0 18 Sport/Recreation Equipment 2,184 1,056 568 48 3,856 19 Staff Quarters 166 57 54 171 448 20 Ware Houses 96 60 - - 156 21 Student Hostels - 3 12 8 23 22 Dining Halls - 1 - - 1 23 Monitoring Vehicles 15 39 36 8 98 24 Electrification Projects 43 42 234 - 319 25 Erosion Control 1 3 - - 4 26 Generator Houses 45 21 14 - 80 27 Workshop Equipment 393 393 - - 786 28 Pupils’ Furniture 219,355 395,645 128,194 30,935 774,129 29 Headteachers’ Furniture 2,388 2,310 550 186 5,434 30 Teachers’ Furniture 10,757 9,402 6,698 3,673 30,530 Headteachers/Teachers’ Furniture 13,145 11,712 7,248 3,859 35,964
31 Library Furniture 267,851 1,337 217 24 269,429 32 Instructional Materials 533,562 52,080 - - 585,642 33 Textbooks 968,520 1,125,367 1,617,578 1,475,830 5,187,295 34 Teachers’ Guides - 10,997 - - 10,997 35 Library Books 47,277 145,235 178,760 54,600 425,872 36 Dictionaries 608,628 677,784 - - 1,286,412 Library Books/Dictionaries 655,905 823,019 0 0 1,712,284
37 Teaching Aids - 588 - - 588 38 Teachers Trained 50,672 34,803 29,671 23,165 138,311 39 Staff Trained 1,549 1,917 848 1,039 5,353 40 Others 11,182 3,378 950 40 15,550
Fig 3.6.11: Total Number of Classrooms Constructed or Renovated
0
2,000
4,000
6,000
8,000
10,000
12,000
2009 2010 2011 2012
9,503
11,759
10,734
3,416
5,768
5,852
6,270
2,220
3,735
5,907 4,464
1,196
Total Classsrooms (Ren + Const)
Classrooms Construction
Classrooms Renovation
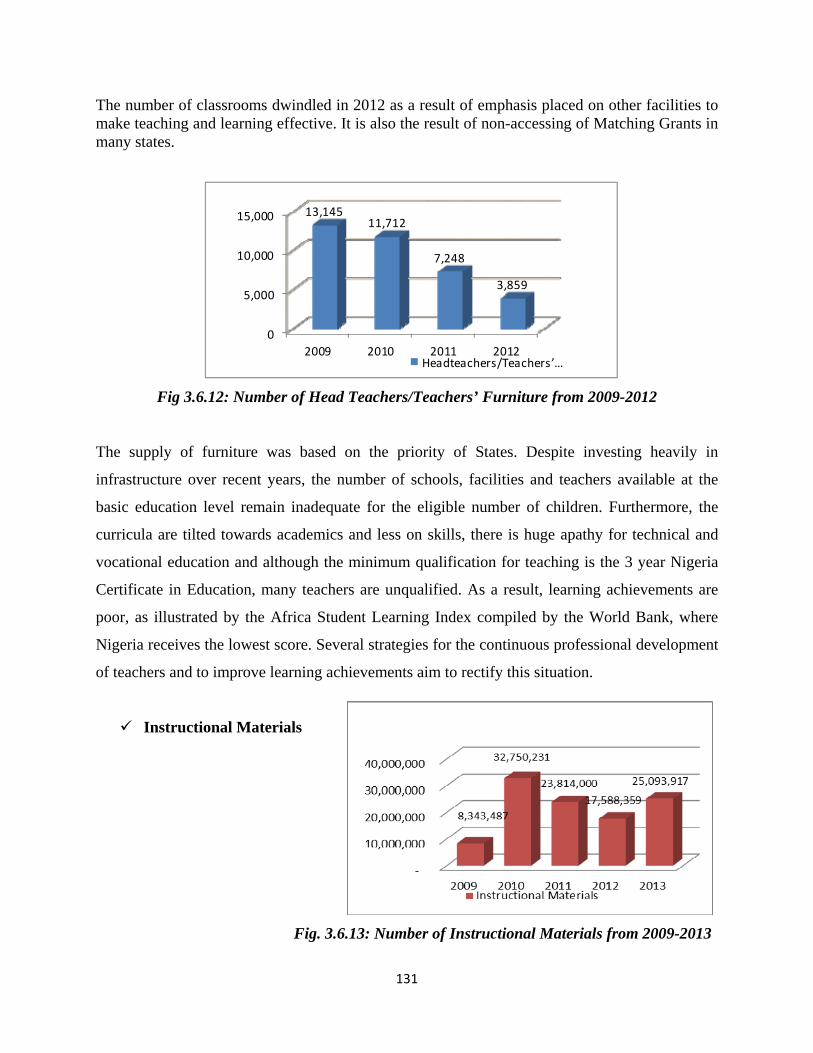
131
The number of classrooms dwindled in 2012 as a result of emphasis placed on other facilities to make teaching and learning effective. It is also the result of non-accessing of Matching Grants in many states.
Fig 3.6.12: Number of Head Teachers/Teachers’ Furniture from 2009-2012
The supply of furniture was based on the priority of States. Despite investing heavily in
infrastructure over recent years, the number of schools, facilities and teachers available at the
basic education level remain inadequate for the eligible number of children. Furthermore, the
curricula are tilted towards academics and less on skills, there is huge apathy for technical and
vocational education and although the minimum qualification for teaching is the 3 year Nigeria
Certificate in Education, many teachers are unqualified. As a result, learning achievements are
poor, as illustrated by the Africa Student Learning Index compiled by the World Bank, where
Nigeria receives the lowest score. Several strategies for the continuous professional development
of teachers and to improve learning achievements aim to rectify this situation.
Instructional Materials
Fig. 3.6.13: Number of Instructional Materials from 2009-2013
0
5,000
10,000
15,000
2009 2010 2011 2012
13,14511,712
7,248
3,859
Headteachers/Teachers’ …
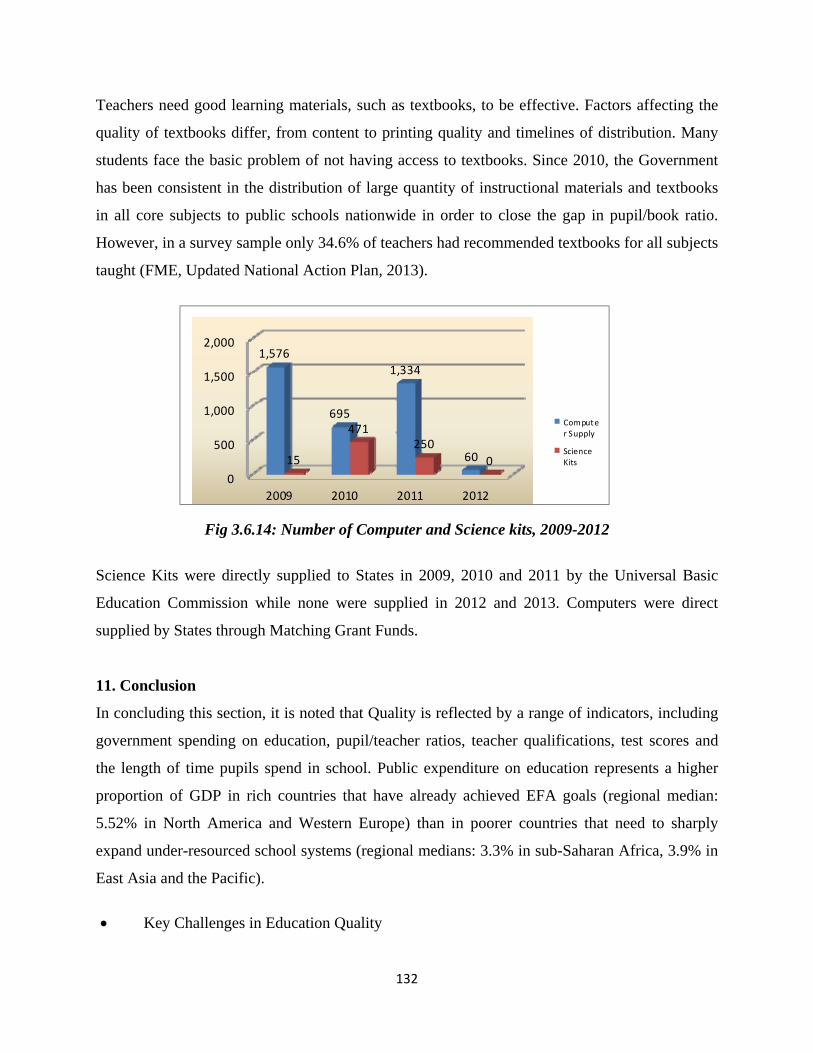
132
Teachers need good learning materials, such as textbooks, to be effective. Factors affecting the
quality of textbooks differ, from content to printing quality and timelines of distribution. Many
students face the basic problem of not having access to textbooks. Since 2010, the Government
has been consistent in the distribution of large quantity of instructional materials and textbooks
in all core subjects to public schools nationwide in order to close the gap in pupil/book ratio.
However, in a survey sample only 34.6% of teachers had recommended textbooks for all subjects
taught (FME, Updated National Action Plan, 2013).
Fig 3.6.14: Number of Computer and Science kits, 2009-2012
Science Kits were directly supplied to States in 2009, 2010 and 2011 by the Universal Basic
Education Commission while none were supplied in 2012 and 2013. Computers were direct
supplied by States through Matching Grant Funds.
11. Conclusion
In concluding this section, it is noted that Quality is reflected by a range of indicators, including
government spending on education, pupil/teacher ratios, teacher qualifications, test scores and
the length of time pupils spend in school. Public expenditure on education represents a higher
proportion of GDP in rich countries that have already achieved EFA goals (regional median:
5.52% in North America and Western Europe) than in poorer countries that need to sharply
expand under-resourced school systems (regional medians: 3.3% in sub-Saharan Africa, 3.9% in
East Asia and the Pacific).
Key Challenges in Education Quality
0
500
1,000
1,500
2,000
2009 2010 2011 2012
1,576
695
1,334
6015
471250
0
Computer Supply
ScienceKits
133
Noncompliance with adopted benchmark qualifications required to be a primary-school
teacher hence, indiscipline and teacher absenteeism;
Large class sizes of many primary schools
Widespread low learning achievement as children are not mastering basic skills;
Vulnerability of children as victims of conflict, disability HIV/AIDS and child labour
Funds constraints;
Enrolment and available school resources.
Suggested Priorities to Improve Quality
Inclusive policies that respond to the diverse needs and circumstances of all learners
(positioning learners at the heart of the learning experience)
defining appropriate goals and relevant content
Adoption of structured teaching – a combination of direct instruction, guided practice and
independent learning.
Enforcement of pedagogically language policy to allow children to learn in their mother
tongue for at least their first few school years as prescribed in the National Policy on
Education (2013).
Regular assessments teaching and learning processes.
Strengthening accountability and improve management and supervision of schools.
Teacher development and appropriate incentives.
Equity in the deployment of teachers to both urban and rural areas.
Provision of adequate learning materials.
Encouragement of local publishing textbooks.
Provision of adequate infrastructure and necessary facilities.
134
Section4‐ImplementationofEFAStrategies
1. Introduction
The high level launch of the EFA campaign in 1999 injected a ripple of activities into the EFA
environment giving it the impetus to identify and mobilize its stakeholders and review
implementation strategies. During this period, an EFA Coordinating unit was created in the
Federal Ministry of Education and was headed by a Coordinator appointed from the civil society.
During the same period, the Education Sector Analysis (ESA) project was initiated to identify
the persistent challenges in the education system in Nigeria and proffer short, medium and long-
term solutions to these. Data provided by the over 43 studies conducted in the ESA project
provided the primary data needed for developing the first national EFA plan in Nigeria which
was undertaken in collaboration with the states.
2. Some Strategies used to Implement EFA in Nigeria
Following its Strategic Plan, the Federal Ministry of Education has successfully carried out some
of its programs to boost access, and enhance quality in basic education. Thus, it has carried out
campaigns to boost access and enrolment, both of which activities were held in the North and in
the South to address the challenge of low girl-child and low boy-child enrolment respectively. A
committee has also been set up on Madrasah education, and a national framework developed for
its operations. Although the campaigns have been carried out, their impacts in terms of
enrolment, attendance, and participation have not been assessed.
i. The National EFA Action Plan
Through the EFA, the Government committed itself to the process of instituting an inclusive,
empowered, and participatory National EFA Forum and equivalent structures at lower levels
within Nigeria. It also pursued the development of a participatory National Action Plan (NAP)
which set out the means by which the country would achieve the EFA targets in the context of its
own culture, history, and development priorities.
ii. The National EFA Forum/State EFA Forum
A number of activities and programmes were embarked upon in response to the concern for the
delivery of Education For All by 2015. In 2001 the National EFA Forum (NEFAF) was
135
inaugurated to show the commitment by the Nigerian government toward achieving EFA by
2015. The Forum became a consultative and high-level decision-making body on the Education
For All process, chaired by the Minister of Education, with Commissioners of Education from
the 36 states and the Federal Capital Territory (FCT) as members. Other members of the forum
were drawn from civil society organizations, Federal Ministry of Education Parastatals that are
EFA vehicles, consultants, members of the organized private sector, International Development
Partners, and other stakeholders in the education sector
In collaboration with UNESCO, UNICEF, World Bank, other international development partners
and civil society organizations (principally the Civil Society Action Coalition on Education for
All (CASCEFA), the Federal Ministry of Education developed plans culminating in the National
EFA Forum Workshop of July 2001. The workshop which was held from July 29th - August 1,
2001, brought together over 200 participants, provided a good opportunity for creating awareness
and understanding of the context of EFA and the identification of some key constraints to
achieving EFA. The workshop was an opportunity for stakeholders to make contributions to the
draft EFA National Action Plan. It produced consensus on the framework for coordination,
planning, resource mobilization, monitoring, evaluation, and impact assessment of EFA. It also
saw the constitution of a participatory and representative National EFA Forum, to be replicated
at the State level with membership comprising multi-sectoral representation from government,
civil society, the private sector and International Development Partners (IDPs).
iii. Nigeria Country Report on EFA 2001
The Nigeria EFA Country Report 2001 formed the basis of the National Action Plan (NAP). It
set out targets to be achieved by 2015 in pursuit of the EFA goals agreed in Dakar in 2000. For
each area, the report set out clear position statements, objectives, targets, indicators and
responsibilities for achieving the Dakar goals. The report was built on the principle of
participation of critical stakeholders, including civil societies, the private sector, and IDPs in all
aspects and at all levels of education in Nigeria.
iv. Yearly EFA Report Card since 2002 to 2013
136
This is a document produced by EFA Unit of Federal Ministry of Education every year as a
report card for all the activities of the Ministry toward achievement of and also highlights
challenges encountered in the process towards EFA by 2015. The document is usually used as
country report card for High Level Group Meeting (HLGM), now General EFA Meeting (GEM),
which Nigeria is a Member.
3. Some Key Reforms Influenced by EFA i. Launch of the Universal Basic Education (UBE)
In 1999, in fulfillment of its international obligation to the 1990 Jomtien Declaration, the Federal Government launched the free Universal Basic Education (UBE); subsequently, the Universal Basic Education Commission (UBEC) was established in 2001 while the UBE and other Related Matters Acts were enacted in 2004 to give a legal framework for the operation of UBEC. In addition, the Universal Basic Education Commission was established to achieve uniform and qualitative basic education in the country.
ii. Change in National Education system In 2012, one year was introduced into the educational system to enhance the achievement of goal 1 in the country. This changed the education system from 6–3–3–4 to 1–6–3–3–4 to establish a ten-year continuing education with three (3) components as follows:
Early Childhood Care Development Education (ECCDE) - 1 year; Primary Education - 6 years; and Junior Secondary Education - 3 years.
iii. Early Childhood Care Development Education Developed a National Policy for the Integrated Early Childhood (IEC); Institutionalized the one year ECD as part of the education system, for establishment of
the ECCE Centres in all public and primary schools and ensure stronger foundational transition from pupils to primary schools;
Grassroots sensitization, advocacy and mobilization of activities on ECD; Translation of relevant ECCE materials into thirteen (13) indigenous languages including
the policy, integrated ECD Policy, the National Curriculum/Training Guide, criteria for establishment of centres and care-givers and Toy-Making manuals.
Establishment of community Based Child Centres (CBCC) in five pilot states to promote community participation in the ECCE.
iv. Introduction of Almajiri Education To integrate basic education into quranic schools and provide access for children at risk of exclusion irrespective of gender, religious background or social status, the Federal government introduced the Almajiri education. 125 model boarding schools have been constructed in 27 States of the Federation.
v. Establishment of the National Commission for Nomadic Education (NCNE)
137
The Act establishing the NCNE was revised in 2004 in order to streamline the activities of the Commission into UBE. The Commission is empowered by law to provide educational opportunities to the nomadic pastoralists and migrant fisher folks through the provision of basic literacy classes and business/financial management to empower the learners. vi. Girl-child Education Project (GEP)
This programme is initiated to achieve girl-child related goals and increase enrollment of girls and help them to achieve completion of basic education. The programme is driven in the Northern States in collaboration with UNICEF. vii. Back-to-School Programme for Boys It is initiated to address the problem of large rate of school drop-out among boys in the South-East and South-South States. Special basic education schools that would incorporate vocational skills relevant to the socio-economic environment of the concerned states are being constructed for implementation. viii. Support For Special Needs Education Programme (SNEP) This is aimed at promoting inclusive education and increase access to basic education for children with special needs. Under the programme, special needs schools are being established and a National Diagnostic and Assessment Centre for special children was established in the FCT to screen, assess and place children with special needs in schools. Also, the Government through the UBEC provided financial support to the tune of N2, 077, 196, 805.00 to 348 public and provide school providers to expand the programme and provide necessary facilities. ix. Establishment of the Nigerian Education Management Information System
(NEMIS) In 2007, the Government of Nigeria established the Nigerian Education Management Information System (NEMIS) to generate data for effective planning and monitoring of education programmes.
x. School Based Management Committees (SBMC) Establishment of School Based Management Committees (SBMC) to improve school governance. xi. Adult and Non-Formal Education
Establishment of a 4-year programme on Revitalizing Adult and Youth Literacy in Nigeria (2011 – 2015), aimed at strengthening the capacity of national institutions to design and deliver quality literacy programmes. The programme is targeted at youth and adults with special attention for the difficult to reach groups such as girls, women and integration of skills development and wealth creation. xii. Quality
Teacher Development; Professionalization of the teaching profession and establishment of minimum
standards of teaching. Accredited courses and programmes of teacher training in 33 institutions to ensure compliance with the national minimum standards;
138
Curriculum review of teacher training institutions and development of National Benchmark for uniform context of curriculum of teacher training institutions;
Integration of ICTs into teaching programme; Federal Teachers’ Scheme (FTS) established to address the challenges of teacher
shortage and distribution of quality teachers in the basic education. It is a 2-year programme for employed NCE graduates which provide opportunity for internship preparatory to formal engagement into the teaching profession. In 2013, 15,000 FTS teachers were recruited (10,000 for Primary and 5,000 for Junior Secondary Schools).
Accreditation of courses and programmes of 33 teacher training institutions by 2013. Restoration of the Technical Teachers Training Programme (TTTP); Institution of regular in-service training programmes including proficiency in ICT
skills. xiii. Development of an Evidence Based Quality Assurance Instrument by the Federal
Inspectorate Services.
xiv. Review of School Curriculum to incorporate among other things, vocational subjects at the primary level and vocational and entrepreneurial skills; aimed at enhancing the quality of education and bridging the gap between education acquired and the current demands of the labour.
xv. 4-year Strategic Plan for the Development of the Education Sector (2011 – 2015).
4. Successes
a. Access i. Increased access and enrolment of children aged 3-5 years in public pre-primary
schools nationwide. The pupils enrolment in ECCDE centres increased from 1,510,974 in 2009 to 2,994,734 in 2013 (an increase of 98% per cent).
ii. Increase in the number of public ECCDE centres from 20,698 in 2009 to 30,901 in 2013 (50% of 61,305 total primary schools). The increase has impacted positively in the number of pupil’s enrollment and transition to primary level.
iii. Increase in pupil enrollment in public primary schools from 21,857,011 in 2009 to 24,071,559 in 2013 (10 per cent increase)
iv. Student enrollment in public JS Schools in the year 2009 was 3,107,287 while that of 2013 was 4,219,679 (35 per cent increase). The shortfall between 2012 and 2013 enrollment could be as a result of issues arising from disarticulation problem junior and senior secondary schools.
v. 10 adult literacy centres were established in each of the 774 LGAs in the Federation in addition to the existing ones.
vi. Reduction in number of out-of-school children.
b. Equity i. Improvement in gender parity index
ECCDE: 2009 and 2012 had the highest rate of 0.97 while 2010 and 2013 recorded the same figure of 0.96 each;
139
Primary schools: 2013 had the highest gender parity index of 0.91 while year 2010 had the east with 0.85; and
JSS: record shows 2010 had the least with 0.79 while year 2012 had 0.80.
c. Quality i. Instructional materials: provision of 35 million textbooks in 4 core subjects to all
public schools from 2009 to date. ii. Enhanced learning environment through massive construction and rehabilitation of
infrastructure such as classrooms, e-libraries and laboratories in public schools in order to create conducive teaching and learning.
5. Effectiveness of National Education Strategies The successes recorded in the implementation of these strategies can be attributed to some of the following:
– Federal Government commitment to annual release of the 2% Consolidated Revenue Fund (CRF) to improve service delivery of Basic Education which has encouraged investment in the Sector by other levels of Government;
– Progressive increase in Government budgetary allocation to education sector although still inadequate because of the huge population and inherent challenges of including attitudinal and socio-economic issues;
– Strategic partnership and collaboration with IDPs including UNESCO, UNICEF, World Bank, USAID, DFID and other donor countries. Others include corporate private sector, civil society, NGOs, the Media and other stakeholders; etc.
6. Constraints
– Inadequate funding of the education sector especially NFE; – Inadequate number of well-trained ECCD teachers/caregivers and dearth of qualified
teachers; – Risk of exclusion of children in rural, the hard to reach areas and children with special
needs in education programmes; – Insecurity in some parts of the country which may truncate successes recorded in school
enrollment; – Inadequate and inaccurate data for effective planning and monitoring etc.
7. Solution
– Prioritization of the education sector by all level of Government. – Increased funding of the education sector. – Enhance teacher development programmes. – Innovative sensitization and advocacy activities to encourage enrollment, retention and
solicit technical and financial support. – Promotion of good governance to encourage accountability and fair and just distribution
of human, materials and financial resources to especially, benefit to the vulnerable and those at the grassroots.
– Creation of security consciousness among school personnel, pupils and students.
140
– Government at all levels should strengthen security measures to ensure safety of live and property.
– Develop the capacity of personnel and ensure adequate funding of NEMIS to generate data for the sector as and when due.
8. Conclusion The Federal Government remains committed to leveraging available resources and support of stakeholders in the education sector, not only to ensure quality education for all our learners but also scale-up our actions to meet the EFA goals set targets
141
SECTION 5 - FinancingBasicEducationinNigeria
1. Introduction
Government’s constitutional responsibility is the promotion of education for all, that is, education is a shared responsibility of the three tiers of Nigeria’s government: Federal, State and the Local government. In view of this, the Federal Government has the responsibility to ensure quality control, maintenance of minimum standard as well as general coordination of programme implementation.
In demonstration of its commitment to this mandate, the Federal Government set aside some percentages of its Consolidated Revenue Fund (CRF) to Universal Basic Education Commission (UBEC) from 2005, with the passage of (UBEC) Act in May, 2004.
The release of the first tranche of UBE Fund in 2005 clearly demonstrated government’s commitment to play an active role in assisting state in the implementation of the UBE programme. From the first quarter of 2010, the commission received and disbursed to the states and the Federal Capital Territory (FCT), on equal basis, the sum of one hundred and nineteen billion, forty seven million, six hundred and seventy five thousand, one hundred eighty seven naira, ninety eighty kobo. (N190,470,675, 187.98k.) to address issues of access, equity and quality in the delivery of Basic Education.
2. Funding And Other Financial Issues
The prescriptive nature of how UBE fund and counter resources may be used has contributed to lack of ownership at the state level.
Most of the UBE intervention fund’s allocation is equal for all states, regardless of number of students and incidence of poverty. This appears inequity Unified, National Education Systems rely on funding allocation formula to ensure that resources are distributed equally and in accordance with specific educational priorities;
The under-utilization of UBE funds has become a major challenge in the implementation of the UBE programme. Several reasons have been given for non- accessibility of funds;
Insufficient consultation with the states in designing and implementation of the UBE programme including project selection;
Inadequate policy coordination across the three tiers of government in the implementation of the UBE programme;
Lack of capacity within states to use funds in accordance with guideline; Apart from weak capacity in accessing the funds, many state governments misappropriate
or misplay funds released to them; In 2007, the independent corrupt practices and other related offences commission (ICPC)
recovered N 2.31 billion misappropriated from SUBEB across the country. The recovered
142
fund was part of a total of N 3.31 billion either embezzled or diverted to projects other than those of the UBE in the thirty six states (Punch Newspaper, Friday, April 10 2009 and Editorial);
Complex conditions for accessing the funds and associated bureaucracy; Lack of capacity and political will at Federal level to amend guidelines in light of
experience and to drive through disbursements; The suspension of disbursement due to “Sharp practices” in expenditure, which has
occurred in several states; Lack of willingness of states to give counterpart funding for matching grants; Pace of disbursement on the part of UBEC which has been subject to major delays. The
fact that quarterly allocations can be rolled over indefinitely does not provide a strong incentive for state government to commit their matching funding.
3. Accumulated Un-Accessed Funds.
Funds allocated and not accessed have become another major challenges that confronts the UBE programme. It is on record that between 2000 and 2008, the sum of N 22.6 million (Mohmood Yakubu publication 2009) that had been allocated to some public tertiary institutions, states ministries of Education and Universal Basic Education Board(UBEB) by the Education Trust Fund have not been accessed.
Technical and Vocational Education and training is not a cheap programme to run therefore concurrent provision is seriously hampered by lack of equipment around Technical Colleges while the( VEIs) are equally not yet freely available. There must be increased funding of fund to this sub-sector to enable acquisition of the equipment that are crucial for practical training.
Five percent (5%) of the fund allocated to the Universal Basic Education Commission (UBEC) is made available for the funding of ECCDE initiatives. Funds are also made available for Care-givers.
4. Debt Relief Gains
Nigeria’s negotiation of debt relief in 2005, with huge burden of US $19,293,207,575 wiped off Nigeria’s debt profile. Hence, a rebut mechanism for executing this initiative was put in place with the establishment of the office of Senior Special Assistant to the President on MDGs, to oversee the utilization of the funds for pro-poor projects and coordinate Nigeria efforts in the quest to attain the MDGs by 2015.
The disbursement of the DRGs funds commenced with the 2006 Federal Budgetary Appropriation. Since then, a number of programmes and projects were executed with DRGs with Education constituting a key sector.
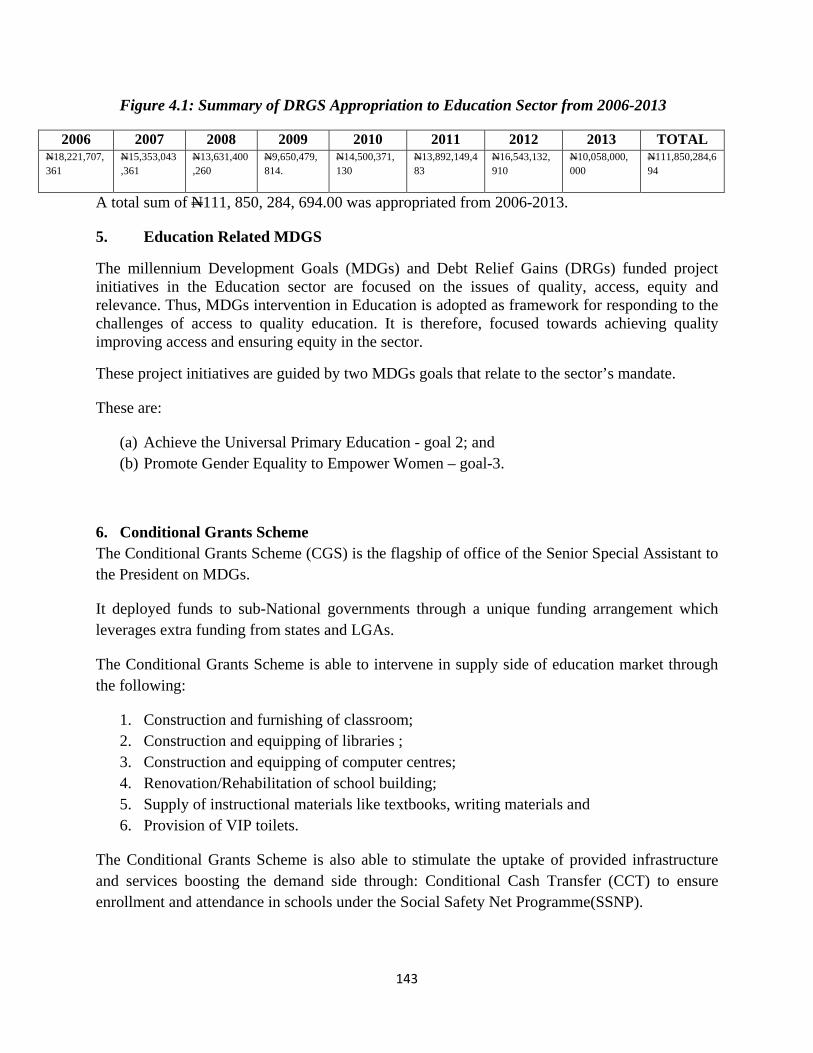
143
Figure 4.1: Summary of DRGS Appropriation to Education Sector from 2006-2013
2006 2007 2008 2009 2010 2011 2012 2013 TOTAL N18,221,707,361
N15,353,043,361
N13,631,400,260
N9,650,479,814.
N14,500,371,130
N13,892,149,483
N16,543,132,910
N10,058,000,000
N111,850,284,694
A total sum of N111, 850, 284, 694.00 was appropriated from 2006-2013.
5. Education Related MDGS
The millennium Development Goals (MDGs) and Debt Relief Gains (DRGs) funded project initiatives in the Education sector are focused on the issues of quality, access, equity and relevance. Thus, MDGs intervention in Education is adopted as framework for responding to the challenges of access to quality education. It is therefore, focused towards achieving quality improving access and ensuring equity in the sector.
These project initiatives are guided by two MDGs goals that relate to the sector’s mandate.
These are:
(a) Achieve the Universal Primary Education - goal 2; and (b) Promote Gender Equality to Empower Women – goal-3.
6. Conditional Grants Scheme The Conditional Grants Scheme (CGS) is the flagship of office of the Senior Special Assistant to the President on MDGs.
It deployed funds to sub-National governments through a unique funding arrangement which leverages extra funding from states and LGAs.
The Conditional Grants Scheme is able to intervene in supply side of education market through the following:
1. Construction and furnishing of classroom; 2. Construction and equipping of libraries ; 3. Construction and equipping of computer centres; 4. Renovation/Rehabilitation of school building; 5. Supply of instructional materials like textbooks, writing materials and 6. Provision of VIP toilets.
The Conditional Grants Scheme is also able to stimulate the uptake of provided infrastructure and services boosting the demand side through: Conditional Cash Transfer (CCT) to ensure enrollment and attendance in schools under the Social Safety Net Programme(SSNP).
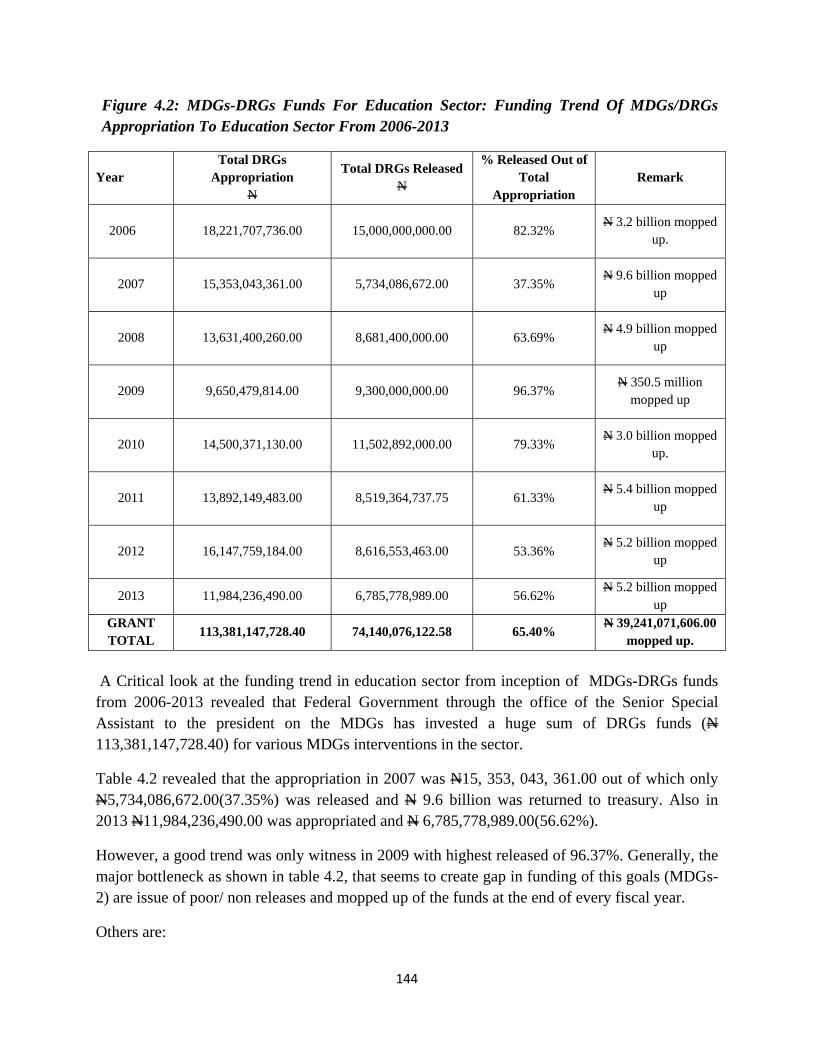
144
Figure 4.2: MDGs-DRGs Funds For Education Sector: Funding Trend Of MDGs/DRGs Appropriation To Education Sector From 2006-2013
Year Total DRGs
Appropriation N
Total DRGs Released N
% Released Out of Total
Appropriation Remark
2006
18,221,707,736.00 15,000,000,000.00 82.32%
N 3.2 billion mopped up.
2007
15,353,043,361.00 5,734,086,672.00 37.35%
N 9.6 billion mopped up
2008
13,631,400,260.00 8,681,400,000.00 63.69%
N 4.9 billion mopped up
2009
9,650,479,814.00 9,300,000,000.00 96.37%
N 350.5 million mopped up
2010
14,500,371,130.00 11,502,892,000.00 79.33%
N 3.0 billion mopped up.
2011
13,892,149,483.00 8,519,364,737.75 61.33%
N 5.4 billion mopped up
2012
16,147,759,184.00 8,616,553,463.00 53.36%
N 5.2 billion mopped up
2013 11,984,236,490.00 6,785,778,989.00 56.62% N 5.2 billion mopped
up GRANT TOTAL
113,381,147,728.40 74,140,076,122.58 65.40% N 39,241,071,606.00
mopped up.
A Critical look at the funding trend in education sector from inception of MDGs-DRGs funds from 2006-2013 revealed that Federal Government through the office of the Senior Special Assistant to the president on the MDGs has invested a huge sum of DRGs funds (N 113,381,147,728.40) for various MDGs interventions in the sector.
Table 4.2 revealed that the appropriation in 2007 was N15, 353, 043, 361.00 out of which only N5,734,086,672.00(37.35%) was released and N 9.6 billion was returned to treasury. Also in 2013 N11,984,236,490.00 was appropriated and N 6,785,778,989.00(56.62%).
However, a good trend was only witness in 2009 with highest released of 96.37%. Generally, the major bottleneck as shown in table 4.2, that seems to create gap in funding of this goals (MDGs-2) are issue of poor/ non releases and mopped up of the funds at the end of every fiscal year.
Others are:
145
Poor utilization, transparency and accountability in the management of funds by the FME and its parastatals that implement the MDGs-DRGs funded projects and programmes in the sector;
Non-prioritization of MDGs-DRGs funds to other activities of the Ministry; Diversion of MDGs-DRGs funds to other activities of the Ministry; Delay in procurement process; Non- compliance with the work plan and initial proposal.
All these funding challenges create gap towards the achievement of these goals in the sector.
7. Sources Of Fund The sources of funding basic education in Nigeria at the Federal level as provided by the UBEC Act of 2004 are categorized into three: Federal Government block grant of not less than 2% of its Consolidated Revenue Fund
(CRF);
Funds or Contributions in form of Federal guaranteed credit, and
Local and International donor grants.
The block grant of 2% of CRF is disbursed to state government. However, there are key
conditions to be met by states in order to draw from the fund. These include:
The existence of a state UBE law; and
Contribution of matching grant and development action plans.
8. Release Of The UBE Fund
A reviewed sharing formula for the 2% CRF which is disbursed for the execution of the UBE
programmes are as follows:
Matching Grant to state ..………………………………………………………….. 50% Education imbalance ………………………………………………………………. 14% Good performance ………………………………………………………………. 5% Physical and mentally challenged ………………………………………………… . 2% UBE Implementation ..…………………………………………………….. 2% UBE Monitoring ……………………………………………………………… 2% Instructional materials (formerly school feeding)………………………………….. 15% Teacher Professional Development ………………………………………………. 10% TOTAL ……………………………………………………………………… 100% Matching Grant
146
This is the fund contributed by both Federal and the State Governments on equal basis. States are
particularly required to match the Federal Governments contribution by providing their
counterpart funding in order to draw from UBE fund. This is to ensure that states do not rely
exclusively on the Federal Governments’ intervention fund for implementing the programme.
Some other funds such as Debt Relief Gains (DRGs), MDGs funds and ETF interventions have
also been utilized by some states to make provision in Basic Education delivery. These
provisions have contributed significantly to improving aspects of quality and enhancing access
and equity in the delivery of basic education in Nigeria.
9. Community Self-Initiated
It is a community based self–help initiative designed to provide support towards the execution of
priority-based projects in the Public Primary Schools. In implementing the project, benefiting
communities are expected to provide counterpart funds in cash or in kind of not less than 10% of
the total project cost for each project component. Under the current arrangement, UBEC
provides the sum of N1,000, 000.00 as funding support to each beneficiary community.
10. Challenges In Financing Basic Education In Nigeria
i.) Slow draw–down of intervention fund by states.
ii.) Low level of budgetary allocation to basic education at state and local government levels for
the provision of infrastructure.
iii.) Inadequate budgetary allocation to Agencies of adult and non–formal education and nomadic
education to take care of high illiterate adult population and nomadic children.
iv.) Neglect of over 10 million out–of–school children and youth including the Almajiris and
children with special needs.
v.) Low level of commitments of some parents, NGOs and private sector to issues relating to
basic education.
vi.) Unacceptably rate of unqualified teachers in the system due to low level of training.
vii.) The planned exist of the ETF from basic education funding will deplete the total
resources available to the basic education sub –sector by at least #22.00 billion annually.
viii.) Frequent strikes by teachers due largely to labour issues involving salaries and incentives.
ix.) Non absorption of FTS Teachers in the some states of the federation.
147
x.) Frequent dissolution of SUBEB by states which slow down UBE implementation.
11. Possible Solutions
Clearly define the division of responsibilities among and within the various institutions.
Build the capacity of the state ministry of education (SMOEs and LGEAs) which are
weak at present.
Ensure that the National vision is clearly understood by all officials. Outline specific
objectives and strategies required to achieve UBE Project.
Allocate resources more equitably. Ensure more balanced delivery of funds to states and
local governments.
Budgets should be based on clear plans and strategies. Narrow the gap between resources
available to managers and head officers and those available to teaching staff and field
officers.
Provide material resources to schools and offices. Construct classrooms, provide
educational materials (desks, textbooks, facilities such as toilet and water) especially for
LGEAs with resources essential for communication, record-keeping and transportation.
Create a management culture that promotes productivity. Ensure that human and material
resources are fully and efficiently utilized; define clear responsibility for each component
and task; and
Ensure all managers receive project management training immediately.
148
SECTIONSIX–Prospect For Post 2015
1. Introduction
In order to ensure a successful post 2015 basic education agenda the following aspects of basic
education delivery will have to be given priority attention. On the basis of the forgone analysis,
this section provides the emerging issues that Nigeria aims to address through its basic education
programme in order to reach every child with quality learning.
2. Access
The mission of the UBE Commission is the provision of unfettered access to high quality basic
education in Nigeria. This means that all the states of the federation are bound by this desire.
Although access has greatly improved, Nigeria recognizes that poverty is prominent among the
issues that keep many children out of school despite the fact that the UBE Act provides for a
free, universal and compulsory education for all school aged children. Thus, continuous
mobilization, sensitization and advocacy of parents and guardians to sustain and increase
enrolment has continued to receive priority attention.
Sensitization programmes on UBE will be intensified at the local government level and the rural
areas. In recognition of the roles of civil society groups in reaching this segment of the
population, Government is partnering with private and Non-Governmental Organizations
(NGOs) so that the children currently roaming the streets would see the need for their being in
school. This sensitization would lead to construction and renovation of additional classrooms and
expanded role for private schools. Expanding access would mean the provision and
establishment of new schools for disadvantaged children and other such groups. Already, some
states are exploring the public private partnership (PPP) options for increasing access, enhancing
quality and increasing efficiency.
3. Quality
Government is also addressing quality issues by strengthening teacher quality and quantity,
review of the curriculum, improving inspection/supervision and provision of adequate
instructional materials. Government has designed programmes that will:

149
employ adequate number of qualified professional teachers and education managers
including head teachers;
provide capacity development of existing personnel, especially teachers and management
staff;
transform the Inspectorate service to Quality Assurance as already obtained in some States
such as Ondo;
comply with the approved 1:35 teacher/pupil ratio at primary and secondary school levels;
provide adequate school infrastructure, equipment and materials, laboratories, workshops and
libraries;
ensure that pupils are not overcrowded while learning, but there should be allowance for
relaxation by constructing adequate number of classrooms with quality furniture and other
items necessary for strengthening teaching/learning process;
provide special incentives to attract and retain competent teachers in rural areas and difficult
terrains;
improve teachers’ welfare such as improvement of salary and regular promotion;
empower school inspectors through regular training, seminars and workshops;
establish a data bank and the required facilities to keep inspection reports and other
relevant statistics about schools and teachers;
introduce the concept of ‘super-teachers through the absorption of retired teachers who are
willing to give more of their skills to serving teachers; and among others,
encourage and empower head-teachers to see their work as including overseeing their
teachers and supporting them in performing their work effectively. The quality of
instruction begins with the interaction that takes place in the classroom between the teacher
and his/her pupils.
4. Equity
The challenge of equity in education has been attributed to many social problems at both societal
and family levels. These problems are also being addressed through programmes that are offered
in collaboration with other sectors outside education in welfare and women affairs ministries.
Despite gains that have been made in some states, the Government of Nigeria and education
stakeholders have also begun to focus on educational and social interventions that will improve
150
the conditions of schools in rural areas by providing comparable and equally competitive
facilities and equipments. Government is also embarking on sensitization and advocacy
programmes in order to increase parental awareness and raise the level of access to special
schools. Programmes have also been initiated to increase the economic status of parents in rural
areas by promoting traditional economic skills (e.g. weaving, carving, fishing, construction of
good roads between rural and urban areas, provision of social amenities in rural communities,
provision of information on economic opportunities). Government also plans to:
enforce policy guidelines on schools location in relation to equity.
ensure that learners with special needs are given adequate attention in order to remove
inadequate access of special learners. This includes the recognition and inclusion of
Autism as an area of special focus for education whereby ‘Autism Spectrum Disorders is
real and the establishment of Diagnostic Centres is a panacea for early intervention and
placement options’ (57th meeting held from 21st to 25th February, 2011, in Sokoto, NCE).
enact appropriate law against stigmatization and discrimination of physically challenged
children and providing customized facilities for them in all structures and facilities;
enforce the provision of UBE Act on school aged children found out of school;
provide special schools and qualified (special) teachers to cater for the special pupils;
establish new schools to provide for the growing number of schools required for only
girls schools to encourage the girl-child in areas where cultural differences are impeding
co-education. Feeding arrangement for pupils/students should be introduced and
sustained by state governments;
through UBEC/SUBEB/LGEA, embark on ‘holistic’ mobilization of parents and the
communities on the objectives of UBE and the importance of girl-child education as well
as that of the physically challenged. This is recognition of the intent of the policy that
“Parents should be more enlightened and/all compelled by law to allow their female
children to complete education before marriage”.
provide means of transport (school buses should be secured by relevant authorities to
convey pupils/students to distant schools, especially girls as an inducement.
In addition to enhancing access, quality and equity Government recognizes the need for
mobilizing state support to utilize make their own financial contributions to the UBEC funds that
151
they receive. This will enhance the draw-down of these funds and ensure that quality education is
available to all children.
Continuous conduct of the school census of all schools in Nigeria including those privately
owned and those considered out of school, is also recognized as an issue that will be tackled to
strengthen the data management capacities at the national, state and local government levels.
Strict compliance to the NEMIS policy is recognised as an issue that must be enforced to resolve
the dearth of data.
Government is also laying greater emphasis on technical and vocational education especially at
JSS level to prepare students for lifelong learning through the acquisition of technical skills
useful to themselves and the society, in which they live, will be added impetus to successful
implementation of post 2015 UBE programme.
5. Conclusion
The Government of Nigeria is already focusing on the critical areas outlined in the section which are being embedded into new initiatives being introduced in the UBE programme. It is expected that policy focus on learning outcomes in order to address the gaps observed in education provision. Towards this end, early childhood care and education is receiving adequate attention in recognition of the head start it provides in overall learning. It is also expected that skills will dominate in the post 2015 agenda for Nigeria to build on the extensive introduction of skills into the secondary education curriculum while adequate attention would be required to enhance transition and completion rates. Provision of education of good quality will also be enhanced by strengthening all avenues of education delivery both formal and non-formal, provision of learning materials and strengthening the capacity of teachers and facilitators of learning in schools and non-formal learning centres respectively.
152
References
1.Agusiobo, B.C. (2003). National Policy for Integrated Early Childhood Development in
Nigeria. UNESCO IICBA Newsletter Vol. 9 No. 2, December 2007, pp. 8-10.
2.Federal Ministry of Education (2013). The State of Education Report – strong foundations:
Our equality imperative. Abuja: Federal Ministry of Education.
3.FME (2011) The State of Education of Report: Beyond Access. Federal Inspectorate
Service.
4. Obanya, P (2007) “Thinking and talking Education” Published by Evans Brothers Nigeria Ltd. 2007 p.79
5. Olokor, Friday (2013). Rivers has highest HIV/AIDS rate – FG. Punch, December 8,
2013
6. (www.punching.com/news/rivers-has-highest-hivaids-rate-Eg/
7. Ozohu – Suleiman Yakubu (2011). Children Literacy Development and the Book
Industry in
8. Education for All (EFA) in Nigeria: Country Report on EFA Since Dakar and National
Plan of Action, August, 2011.
9. Nigeria: The EFA 2015 Policy Somersault. (Journal of Pengajian Media Malaysia).
10. Malaysian Journal of Media Studies Vol. 13, No. 1, 2011 pp. 51-63.
11. UNESCO (2006) Nigeria early childhood care and education (ECCE) programmes –
country profile prepared for the Education for All Global Monitoring Report 2007.
Strong foundations: Early childhood care and education. Geneva: UNESCO International
Bureau of Education (IBE).
12. UNESCO, (2012).Global Education For All Meeting: Sub-Saharan African EFA
Report.
13. Nigeria Vision 20:2020 Economic Transformation Blueprint. October 2009
14. UNESCO (2010) Education for All Global Monitoring Report
153
15. UNESCO (2000) the Dakar Framework for Action. Dakar, Senegal April 23rd
16. UNESCO (2000) Expanded Commentary on the Dakar Framework for Action. Paris
May 23rd.
154
The Production Team