Embed Size (px)
Citation preview

COUNTRY REPORT
Niger’s Infrastructure: A Continental Perspective
Carolina Domínguez-Torres and Vivien Foster
MAY 2011
Pub
lic D
iscl
osur
e A
utho
rized
Pub
lic D
iscl
osur
e A
utho
rized
Pub
lic D
iscl
osur
e A
utho
rized
Pub
lic D
iscl
osur
e A
utho
rized
Pub
lic D
iscl
osur
e A
utho
rized
Pub
lic D
iscl
osur
e A
utho
rized
Pub
lic D
iscl
osur
e A
utho
rized
Pub
lic D
iscl
osur
e A
utho
rized
© 2011 The International Bank for Reconstruction and Development / The World Bank 1818 H Street, NW Washington, DC 20433 USA Telephone: 202-473-1000 Internet: www.worldbank.org E-mail: [email protected] All rights reserved A publication of the World Bank. The World Bank 1818 H Street, NW Washington, DC 20433 USA The findings, interpretations, and conclusions expressed herein are those of the author(s) and do not necessarily reflect the views of the Executive Directors of the International Bank for Reconstruction and Development / The World Bank or the governments they represent. The World Bank does not guarantee the accuracy of the data included in this work. The boundaries, colors, denominations, and other information shown on any map in this work do not imply any judgment on the part of The World Bank concerning the legal status of any territory or the endorsement or acceptance of such boundaries.
Rights and permissions The material in this publication is copyrighted. Copying and/or transmitting portions or all of this work without permission may be a violation of applicable law. The International Bank for Reconstruction and Development / The World Bank encourages dissemination of its work and will normally grant permission to reproduce portions of the work promptly. For permission to photocopy or reprint any part of this work, please send a request with complete information to the Copyright Clearance Center Inc., 222 Rosewood Drive, Danvers, MA 01923 USA; telephone: 978-750-8400; fax: 978-750-4470; Internet: www.copyright.com. All other queries on rights and licenses, including subsidiary rights, should be addressed to the Office of the Publisher, The World Bank, 1818 H Street, NW, Washington, DC 20433 USA; fax: 202-522-2422; e-mail: [email protected].
About AICD and its country reports
This study is a product of the Africa Infrastructure Country Diagnostic (AICD), a project designed to expand the world’s knowledge of physical infrastructure in Africa. The AICD provides a baseline against which future improvements in infrastructure services can be measured, making it possible to monitor the results achieved from donor support. It also offers a solid empirical foundation for prioritizing investments and designing policy reforms in Africa’s infrastructure sectors.
The AICD is based on an unprecedented effort to collect detailed economic and technical data on African infrastructure. The project has produced a series of original reports on public expenditure, spending needs, and sector performance in each of the main infrastructure sectors, including energy, information and communication technologies, irrigation, transport, and water and sanitation. Africa’s Infrastructure—A Time for Transformation, published by the World Bank and the Agence Française de Développement (AFD) in November 2009, synthesized the most significant findings of those reports.
The focus of the AICD country reports is on benchmarking sector performance and quantifying the main financing and efficiency gaps at the country level. These reports are particularly relevant to national policy makers and development partners working on specific countries.
The AICD was commissioned by the Infrastructure Consortium for Africa following the 2005 G8 (Group of Eight) summit at Gleneagles, Scotland, which flagged the importance of scaling up donor finance for infrastructure in support of Africa’s development.
The first phase of the AICD focused on 24 countries that together account for 85 percent of the gross domestic product, population, and infrastructure aid flows of Sub-Saharan Africa. The countries are: Benin, Burkina Faso, Cape Verde, Cameroon, Chad, Côte d’Ivoire, the Democratic Republic of Congo, Ethiopia, Ghana, Kenya, Lesotho, Madagascar, Malawi, Mozambique, Namibia, Niger, Nigeria, Rwanda, Senegal, South Africa, Sudan, Tanzania, Uganda, and Zambia. Under a second phase of the project, coverage was expanded to include as many of the remaining African countries as possible.
Consistent with the genesis of the project, the main focus is on the 48 countries south of the Sahara that face the most severe infrastructure challenges. Some components of the study also cover North African countries so as to provide a broader point of reference. Unless otherwise stated, therefore, the term Africa is used throughout this report as a shorthand for Sub-Saharan Africa.
The World Bank has implemented the AICD with the guidance of a steering committee that represents the African Union (AU), the New Partnership for Africa’s Development (NEPAD), Africa’s regional economic communities, the African Development Bank (AfDB), the Development Bank of Southern Africa (DBSA), and major infrastructure donors.

Financing for the AICD is provided by a multidonor trust fund to which the main contributors are the United Kingdom’s Department for International Development (DFID), the Public-Private Infrastructure Advisory Facility (PPIAF), Agence Française de Développement (AFD), the European Commission, and Germany’s Entwicklungsbank (KfW). A group of distinguished peer reviewers from policy-making and academic circles in Africa and beyond reviewed all of the major outputs of the study to ensure the technical quality of the work. The Sub-Saharan Africa Transport Policy Program and the Water and Sanitation Program provided technical support on data collection and analysis pertaining to their respective sectors.
The data underlying AICD’s reports, as well as the reports themselves, are available to the public through an interactive Web site, www.infrastructureafrica.org, which allows users to download customized data reports and perform various simulations. Many AICD outputs will appear in the World Bank’s Policy Research Working Papers series.
Inquiries concerning the availability of data sets should be directed to the volume editors at the World Bank in Washington, DC.
iii
Contents
List of figures iii
List of tables iii
Acknowledgments iv
Synopsis 1
The continental perspective 2Why does infrastructure matter? 2
The state of Niger’s infrastructure 4Transport 8Roads 12Railways 16Air transport 17Water resources 19Irrigation 20Water supply and sanitation 22Power 26Information and communication technologies 31
Financing Niger’s infrastructure 34How much more can be done within the existing resource envelope? 38Annual funding gap 41What else can be done? 42
References and bibliography 44
List of figures
Figure 1. Infrastructure’s contribution to economic growth: Benchmarking Niger against other Sub-Saharan countries 3Figure 2. Infrastructure deficits constrain firms’ productivity 4Figure 3. Niger’s population, poorest areas, and mineral resources are concentrated in the south 6Figure 4. Niger’s infrastructure networks align with population density and natural resource concentrations 7Figure 5. Niger’s Logistics Performance Index ranking and that of other West African landlocked countries 9Figure 6. Shares of different factors affecting the time and cost of importing through gateways in West Africa 10Figure 7. Optimal and existing fuel levy in select Sub-Saharan African countries 15Figure 8. Spending on road maintenance and rehabilitation in Niger and other Sub-Saharan nations 15Figure 9. Evolution of seats and city pairs in Niger 18Figure 10. Niger’s irrigation sector 21Figure 11. Irrigation potential, small-scale projects 22Figure 12. Hidden costs 25Figure 13. Expansion of standposts and improved latrines in Niger 26Figure 14. High tariffs in Niger relative to other countries with thermal-based generation 27Figure 15 Hidden costs for NIGELEC have decreased over time 27Figure 16. Mid-range cost of power production in Niger 29Figure 17. The efficient market gap in Niger—highest in the region 32Figure 18. Niger’s Internet market compares poorly with other ECOWAS countries 34

iv
Figure 19. Niger’s infrastructure spending needs in the regional context 36Figure 20. Niger’s existing infrastructure spending is relatively low 37Figure 21. Patterns of capital investment in infrastructure, benchmarked against comparator countries 38Figure 22. Underpricing of water in Niger is comparatively less burdensome 39Figure 23. Consumption of infrastructure services in Niger varies by income quintile 39Figure 24. Water subsidies that reach the poor 40Figure 25. Affordability in Niger in comparison to other low-income countries 41Figure 26. Niger’s power and water utilities burden of inefficiency 41Figure 27. Niger has captured relatively low private sector participation 42
List of tables
Table 1. The achievements and challenges of Niger’s infrastructure sectors 8Table 2. Trading across borders in West African countries 10Table 3. West African port indicators 11Table 4. Niger’s international trade 12Table 5. Road conditions along major transit ECOWAS corridors that run through Niger 13Table 6. Niger’s road indicators 14Table 7. Railway indicators for OCBN and select other railways 16Table 8. Benchmarking air transport indicators for Niger and select other countries 18Table 9. Niger's irrigation potential 21Table 10. Benchmarking water and sanitation indicators 23Table 11. Evolution of operational indicators associated with SPEN, Niger 24Table 12. Power indicators, benchmarked against select country groups 28Table 13. High fuel prices escalate domestic power production costs 29Table 14. Benchmarking ICT indicators 31Table 15. Mobile penetration in West African countries 33Table 16. Illustrative investment targets for infrastructure in Niger 35Table 17. Indicative infrastructure spending needs in Niger, 2006–15 35Table 18. Financial flows to Niger’s infrastructure 36Table 19. Niger’s potential gains from greater operational efficiency 38Table 20. Funding gaps by sector 42Table 21. Savings from innovation 43
Acknowledgments
This paper draws on contributions from sector specialists from the AICD team: notably, Heinrich Bofinger on air transport, Rupa Ranganathan on power, Michael Minges on information and communication technologies, Nataliya Pushak on public expenditure, and Alvaro Federico Barra on spatial analysis.
Synopsis
Between 2000 and 2005 infrastructure made a net contribution of only 0.3 percentage points to the improved per capita growth performance of Niger, one of the lowest in Sub-Saharan Africa. Raising the country’s infrastructure endowment to that of the region’s middle-income countries (MICs) could boost annual growth by about 4.5 percentage points, mainly by improving the condition of the road network.
Niger has made significant progress in some areas of its infrastructure. Important reforms liberalizing the water supply and information and communication technology (ICT) sectors have boosted performance. In particular, reforms in urban water are among the most promising on the continent. Increased competition in the ICT market has contributed to the rapid expansion of mobile services. NIGELEC, the national power utility, has enhanced its performance. The Nigerien portions of regional corridors are in relatively good or fair condition. Air transport connectivity has improved.
Looking ahead, the country faces a number of important infrastructure challenges. Infrastructure services remain expensive and unreliable, hindering the competitiveness of the economy. Probably Niger’s most pressing challenge lies in the water supply and sanitation sector. Niger has the highest reliance on open defecation in the continent, at 82 percent of the population. Ninety percent of the rural population relies on wells and boreholes, but only a fraction is protected. In the power sector, too, the country faces significant challenges: only 8 percent of the national population is electrified, one-fourth the level of comparable low-income countries (LICs). Power supply is inefficient and unreliable, constraining firms’ ability to do business. In the transport sector, the country needs to improve the quality of its network and increase financing for rehabilitation and maintenance. Expanding the Internet and mobile markets and providing a high-speed fiber-optic network are the main challenges in the ICT sector. Niger heavily relies on its regional corridors for the efficient movement of goods and people, but neighboring countries are not prioritizing the maintenance of their portions of the regional corridors. To increase the efficiency of moving goods to and from Niger, the government needs to improve the overall condition of the road corridors and enhance the performance of the Port of Cotonou.
Addressing Niger’s infrastructure challenges will require sustained expenditure of $747 million per year over the next decade. Almost two-thirds of the required spending ($529 million) is associated with capital investments, and the remaining third with operational and maintenance spending. More than one-third of the total spending needs are related to the water supply and sanitation sectors, followed by the power sector. Niger’s effort, equivalent to 22.4 percent of its gross domestic product (GDP), is higher than the average for Sub-Saharan Africa (14.5 percent).
Niger already spends around $225 million per year on infrastructure, equivalent to 7 percent of its GDP. Most of this goes toward capital expenditure ($174 million); government spending accounts for around half of the total flows. Various players, many of them overseas development agencies, fund the remaining. The water and sanitation sector receives the highest level of spending, accounting for $66 million per year.
The current spending envelope could be expanded if efficiency was improved. For example, $62 million a year could be saved if Niger raised tariffs to cost-recovery levels, aligned operational

NIGER’S INFRASTRUCTURE: A CONTINENTAL PERSPECTIVE
2
inefficiencies with reasonable developing-country benchmarks, and executed the full amount of its infrastructure budget.
After adding existing spending to required spending, and subtracting the potential savings from improved efficiency, a substantial funding gap of $460 million per year remains. By far the largest portion of this is to be found in the water supply and sanitation sector.
Niger has the potential to close this funding gap by tapping alternate sources of financing or adopting lower-cost technologies. There is plenty of room for private sector participation in Niger’s infrastructure sectors, in particular ICT. Meanwhile, the adoption of alternate lower-cost technologies in the water supply, power, and road sectors would reduce the financing gap by almost a half ($219 million).
The continental perspective
The Africa Infrastructure Country Diagnostic (AICD) has gathered and analyzed extensive data on infrastructure in more than 40 Sub-Saharan countries, including Niger. The results have been presented in reports covering various areas of infrastructure—ICT, irrigation, power, transport, and water and sanitation—and different policy areas, including investment needs, fiscal costs, and sector performance.
This report presents the key AICD findings for Niger, allowing the country’s infrastructure situation to be benchmarked against that of its African peers. Given that Niger is a poor but stable country, two sets of African benchmarks will be used to evaluate Niger’s situation: low-income countries (LICs) and middle-income countries (MICs). Detailed comparisons will also be made with immediate regional neighbors in West Africa.
Several methodological issues should be borne in mind. First, because of the cross-country nature of data collection, a time lag is inevitable. The period covered by the AICD runs from 2001 to 2006. Most technical data presented are for 2006 (or the most recent year available), while financial data are typically averaged over the available period to smooth out the effect of short-term fluctuations. Second, to make comparisons across countries, indicators were standardized so that analyses were done on a consistent basis. This means that some of the indicators presented here may be slightly different from those that are routinely reported and discussed at the country level.
Why does infrastructure matter?
Niger’s economic growth is below the desired level for reducing poverty. Between 2001 and 2009 Niger’s grew at 4.8 percent per year, below the annual Sub Saharan growth at 6.2 percent. Niger’s economic performance is below the 7 percent mark needed to make a significant impact on poverty reduction.
The poor condition of Niger’s infrastructure hardly contributed to economic growth. The overall contribution of telecommunications, electricity, and roads infrastructure to Niger’s per capita growth between 2000 and 2005 was only 0.3 percentage points, among the lowest on the continent. At this level, Niger—along with Chad—is one of the worst performers in infrastructure development in the region.
NIGER’S INFRASTRUCTURE: A CONTINENTAL PERSPECTIVE
3
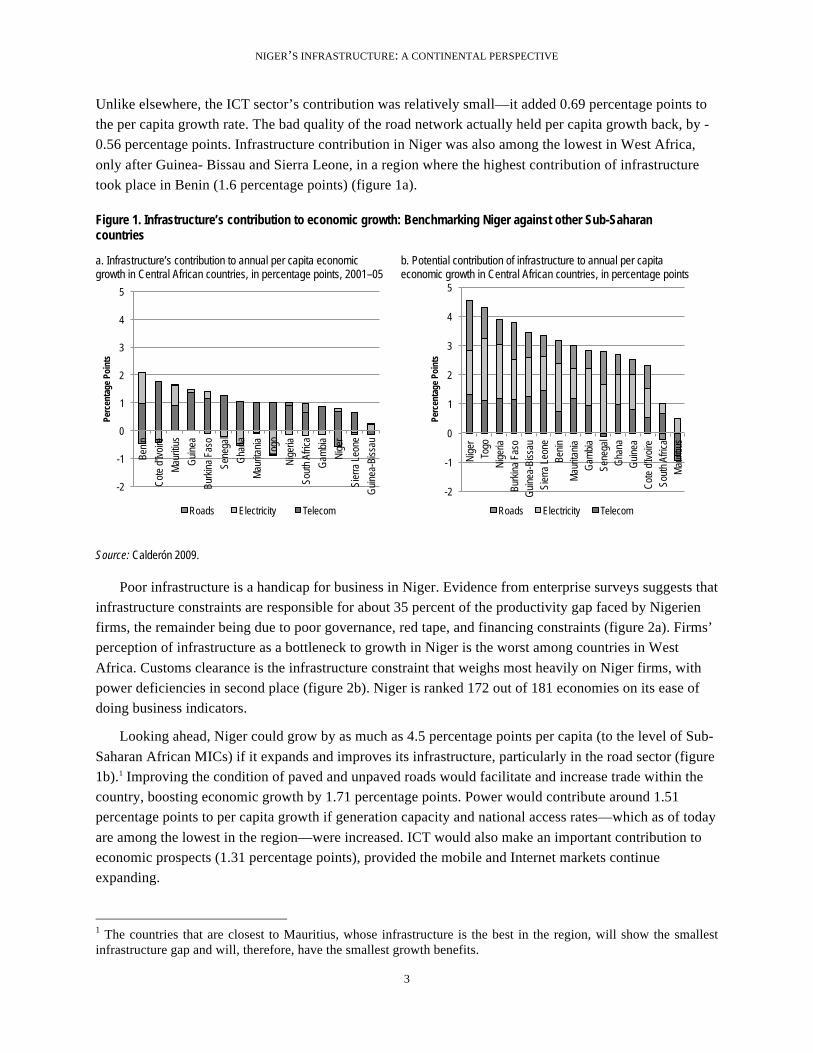
Unlike elsewhere, the ICT sector’s contribution was relatively small—it added 0.69 percentage points to the per capita growth rate. The bad quality of the road network actually held per capita growth back, by -0.56 percentage points. Infrastructure contribution in Niger was also among the lowest in West Africa, only after Guinea- Bissau and Sierra Leone, in a region where the highest contribution of infrastructure took place in Benin (1.6 percentage points) (figure 1a).
Figure 1. Infrastructure’s contribution to economic growth: Benchmarking Niger against other Sub-Saharan countries
a. Infrastructure’s contribution to annual per capita economic growth in Central African countries, in percentage points, 2001–05
b. Potential contribution of infrastructure to annual per capita economic growth in Central African countries, in percentage points
Source: Calderón 2009.
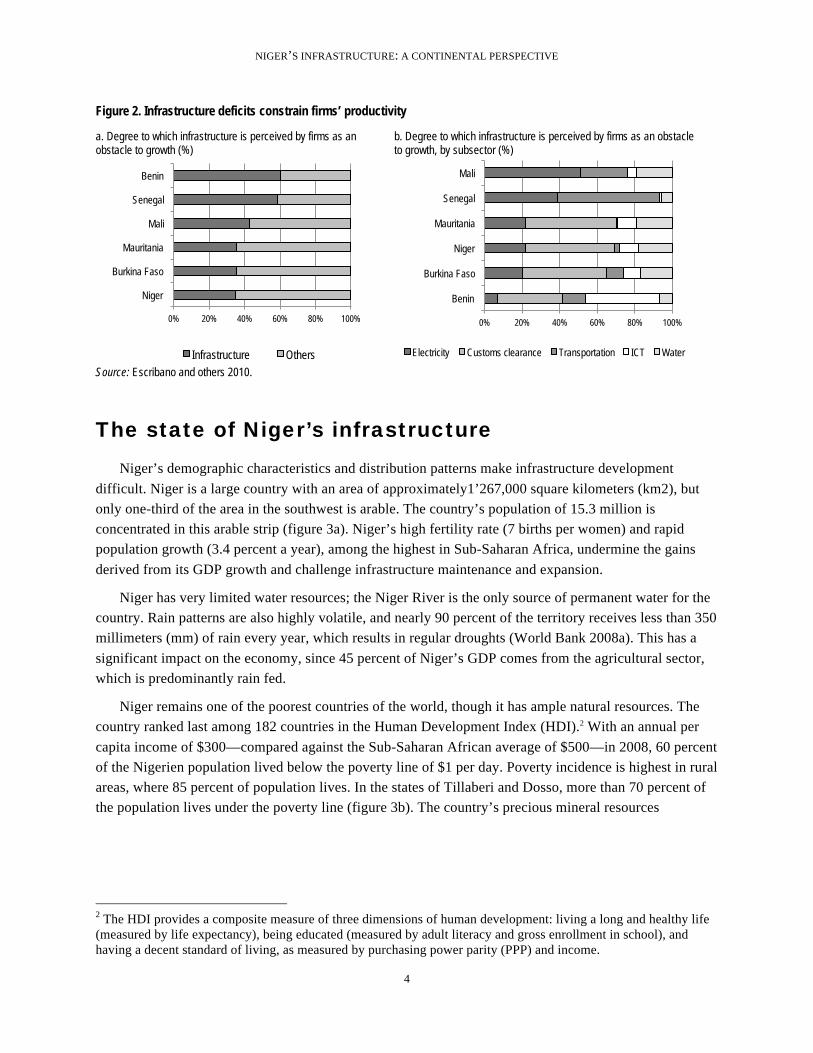
Poor infrastructure is a handicap for business in Niger. Evidence from enterprise surveys suggests that infrastructure constraints are responsible for about 35 percent of the productivity gap faced by Nigerien firms, the remainder being due to poor governance, red tape, and financing constraints (figure 2a). Firms’ perception of infrastructure as a bottleneck to growth in Niger is the worst among countries in West Africa. Customs clearance is the infrastructure constraint that weighs most heavily on Niger firms, with power deficiencies in second place (figure 2b). Niger is ranked 172 out of 181 economies on its ease of doing business indicators.
Looking ahead, Niger could grow by as much as 4.5 percentage points per capita (to the level of Sub-Saharan African MICs) if it expands and improves its infrastructure, particularly in the road sector (figure 1b).1 Improving the condition of paved and unpaved roads would facilitate and increase trade within the country, boosting economic growth by 1.71 percentage points. Power would contribute around 1.51 percentage points to per capita growth if generation capacity and national access rates—which as of today are among the lowest in the region—were increased. ICT would also make an important contribution to economic prospects (1.31 percentage points), provided the mobile and Internet markets continue expanding.
1 The countries that are closest to Mauritius, whose infrastructure is the best in the region, will show the smallest infrastructure gap and will, therefore, have the smallest growth benefits.
-2
-1
0
1
2
3
4
5
Beni
n
Cot
e d'
Ivoi
re
Mau
ritiu
s
Gui
nea
Burk
ina
Faso
Sene
gal
Gha
na
Mau
ritan
ia
Togo
Nig
eria
Sout
h Af
rica
Gam
bia
Nig
er
Sier
ra L
eone
Gui
nea-
Biss
au
Perc
enta
ge P
oint
s
Roads Electricity Telecom
-2
-1
0
1
2
3
4
5
Nig
er
Togo
N
iger
ia
Burk
ina
Faso
G
uine
a-Bi
ssau
Si
erra
Leo
ne
Beni
n M
aurit
ania
G
ambi
a Se
nega
l G
hana
G
uine
a C
ote
d'Iv
oire
So
uth
Afric
a M
aurit
ius
Perc
enta
ge P
oint
s
Roads Electricity Telecom
NIGER’S INFRASTRUCTURE: A CONTINENTAL PERSPECTIVE
4
Figure 2. Infrastructure deficits constrain firms’ productivity
a. Degree to which infrastructure is perceived by firms as an obstacle to growth (%)
b. Degree to which infrastructure is perceived by firms as an obstacle to growth, by subsector (%)
Source: Escribano and others 2010.
The state of Niger’s infrastructure
Niger’s demographic characteristics and distribution patterns make infrastructure development difficult. Niger is a large country with an area of approximately1’267,000 square kilometers (km2), but only one-third of the area in the southwest is arable. The country’s population of 15.3 million is concentrated in this arable strip (figure 3a). Niger’s high fertility rate (7 births per women) and rapid population growth (3.4 percent a year), among the highest in Sub-Saharan Africa, undermine the gains derived from its GDP growth and challenge infrastructure maintenance and expansion.
Niger has very limited water resources; the Niger River is the only source of permanent water for the country. Rain patterns are also highly volatile, and nearly 90 percent of the territory receives less than 350 millimeters (mm) of rain every year, which results in regular droughts (World Bank 2008a). This has a significant impact on the economy, since 45 percent of Niger’s GDP comes from the agricultural sector, which is predominantly rain fed.
Niger remains one of the poorest countries of the world, though it has ample natural resources. The country ranked last among 182 countries in the Human Development Index (HDI).2 With an annual per capita income of $300—compared against the Sub-Saharan African average of $500—in 2008, 60 percent of the Nigerien population lived below the poverty line of $1 per day. Poverty incidence is highest in rural areas, where 85 percent of population lives. In the states of Tillaberi and Dosso, more than 70 percent of the population lives under the poverty line (figure 3b). The country’s precious mineral resources
2 The HDI provides a composite measure of three dimensions of human development: living a long and healthy life (measured by life expectancy), being educated (measured by adult literacy and gross enrollment in school), and having a decent standard of living, as measured by purchasing power parity (PPP) and income.
0% 20% 40% 60% 80% 100%
Niger
Burkina Faso
Mauritania
Mali
Senegal
Benin
Infrastructure Others
0% 20% 40% 60% 80% 100%
Benin
Burkina Faso
Niger
Mauritania
Senegal
Mali
Electricity Customs clearance Transportation ICT Water
NIGER’S INFRASTRUCTURE: A CONTINENTAL PERSPECTIVE
5
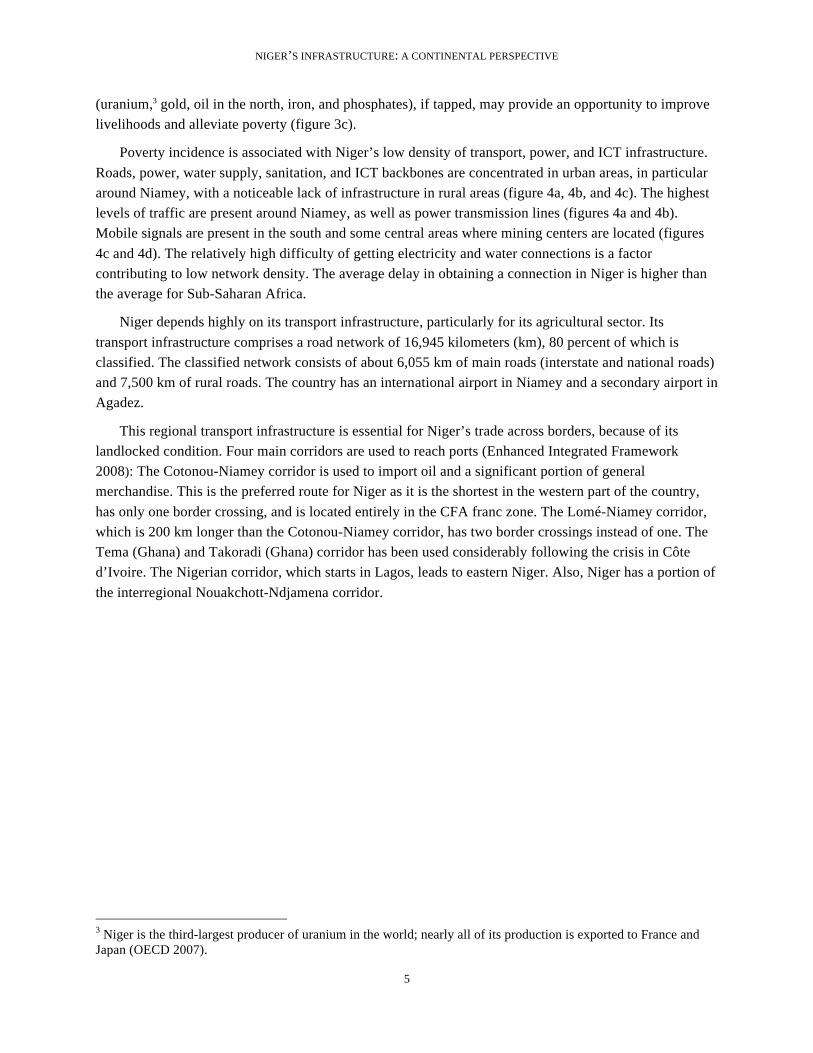
(uranium,3 gold, oil in the north, iron, and phosphates), if tapped, may provide an opportunity to improve livelihoods and alleviate poverty (figure 3c).
Poverty incidence is associated with Niger’s low density of transport, power, and ICT infrastructure. Roads, power, water supply, sanitation, and ICT backbones are concentrated in urban areas, in particular around Niamey, with a noticeable lack of infrastructure in rural areas (figure 4a, 4b, and 4c). The highest levels of traffic are present around Niamey, as well as power transmission lines (figures 4a and 4b). Mobile signals are present in the south and some central areas where mining centers are located (figures 4c and 4d). The relatively high difficulty of getting electricity and water connections is a factor contributing to low network density. The average delay in obtaining a connection in Niger is higher than the average for Sub-Saharan Africa.
Niger depends highly on its transport infrastructure, particularly for its agricultural sector. Its transport infrastructure comprises a road network of 16,945 kilometers (km), 80 percent of which is classified. The classified network consists of about 6,055 km of main roads (interstate and national roads) and 7,500 km of rural roads. The country has an international airport in Niamey and a secondary airport in Agadez.
This regional transport infrastructure is essential for Niger’s trade across borders, because of its landlocked condition. Four main corridors are used to reach ports (Enhanced Integrated Framework 2008): The Cotonou-Niamey corridor is used to import oil and a significant portion of general merchandise. This is the preferred route for Niger as it is the shortest in the western part of the country, has only one border crossing, and is located entirely in the CFA franc zone. The Lomé-Niamey corridor, which is 200 km longer than the Cotonou-Niamey corridor, has two border crossings instead of one. The Tema (Ghana) and Takoradi (Ghana) corridor has been used considerably following the crisis in Côte d’Ivoire. The Nigerian corridor, which starts in Lagos, leads to eastern Niger. Also, Niger has a portion of the interregional Nouakchott-Ndjamena corridor.
3 Niger is the third-largest producer of uranium in the world; nearly all of its production is exported to France and Japan (OECD 2007).

NIGER’S INFRASTRUCTURE: A CONTINENTAL PERSPECTIVE
6
Figure 3. Niger’s population, poorest areas, and mineral resources are concentrated in the south
a. Population b. Poverty
c. Topography d. Natural resources
Source: AICD Interactive Infrastructure Atlas for Niger (www.infrastructureafrica.org).

NIGER’S INFRASTRUCTURE: A CONTINENTAL PERSPECTIVE
7
Figure 4. Niger’s infrastructure networks align with population density and natural resource concentrations
a. Roads, railways, and airports b. Power
c. ICT d. Water resources
Source: AICD Interactive Infrastructure Atlas for Niger (www.infrastructureafrica.org).
NIGER’S INFRASTRUCTURE: A CONTINENTAL PERSPECTIVE
8
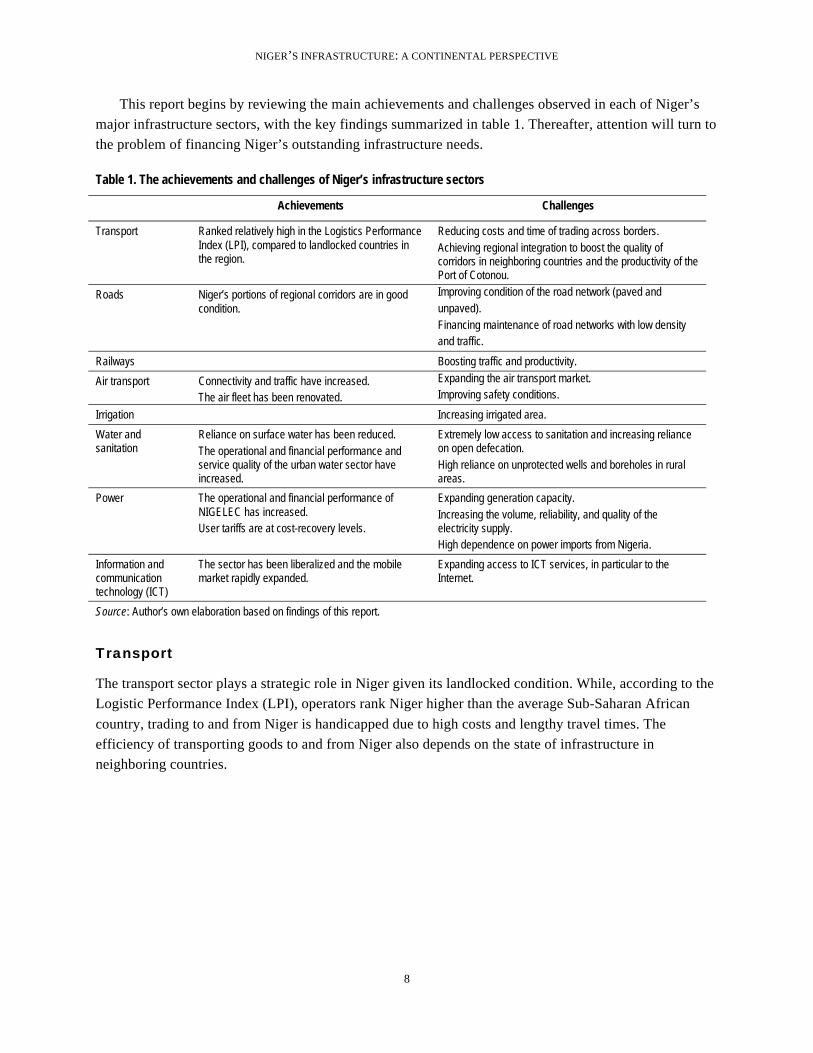
This report begins by reviewing the main achievements and challenges observed in each of Niger’s major infrastructure sectors, with the key findings summarized in table 1. Thereafter, attention will turn to the problem of financing Niger’s outstanding infrastructure needs.
Table 1. The achievements and challenges of Niger’s infrastructure sectors
Achievements Challenges
Transport Ranked relatively high in the Logistics Performance Index (LPI), compared to landlocked countries in the region.
Reducing costs and time of trading across borders. Achieving regional integration to boost the quality of corridors in neighboring countries and the productivity of the Port of Cotonou.
Roads Niger’s portions of regional corridors are in good condition.
Improving condition of the road network (paved and unpaved). Financing maintenance of road networks with low density and traffic.
Railways Boosting traffic and productivity.
Air transport Connectivity and traffic have increased. The air fleet has been renovated.
Expanding the air transport market. Improving safety conditions.
Irrigation Increasing irrigated area.
Water and sanitation
Reliance on surface water has been reduced. The operational and financial performance and service quality of the urban water sector have increased.
Extremely low access to sanitation and increasing reliance on open defecation. High reliance on unprotected wells and boreholes in rural areas.
Power The operational and financial performance of NIGELEC has increased. User tariffs are at cost-recovery levels.
Expanding generation capacity. Increasing the volume, reliability, and quality of the electricity supply. High dependence on power imports from Nigeria.
Information and communication technology (ICT)
The sector has been liberalized and the mobile market rapidly expanded.
Expanding access to ICT services, in particular to the Internet.
Source: Author’s own elaboration based on findings of this report.
Transport
The transport sector plays a strategic role in Niger given its landlocked condition. While, according to the Logistic Performance Index (LPI), operators rank Niger higher than the average Sub-Saharan African country, trading to and from Niger is handicapped due to high costs and lengthy travel times. The efficiency of transporting goods to and from Niger also depends on the state of infrastructure in neighboring countries.

NIGER’S INFRASTRUCTURE: A CONTINENTAL PERSPECTIVE
9
Niger’s capacity to efficiently move goods and connect manufacturers and consumers with international markets is above the regional average. When asked to give feedback on Niger’s logistics “friendliness,” operators (global freight forwarders and express carriers) gave it an LPI ranking of 2.54, above the West African average of 2.42 (figure 5). Senegal, Benin, Guinea, and Togo—all coastal countries—received a higher LPI. But Niger’s LPI is higher than Mali’s and Burkina’s, despite the fact that it is farther from the coast than these countries. Zooming in on the components of the LPI in Niger, operators gave the lowest scores to (i) the efficiency of the clearance process (that is, the speed, simplicity, and predictability of formalities) a border control agencies, and (ii) the quality of trade and transport-related infrastructure (for example, ports, railroads, roads, information technology).
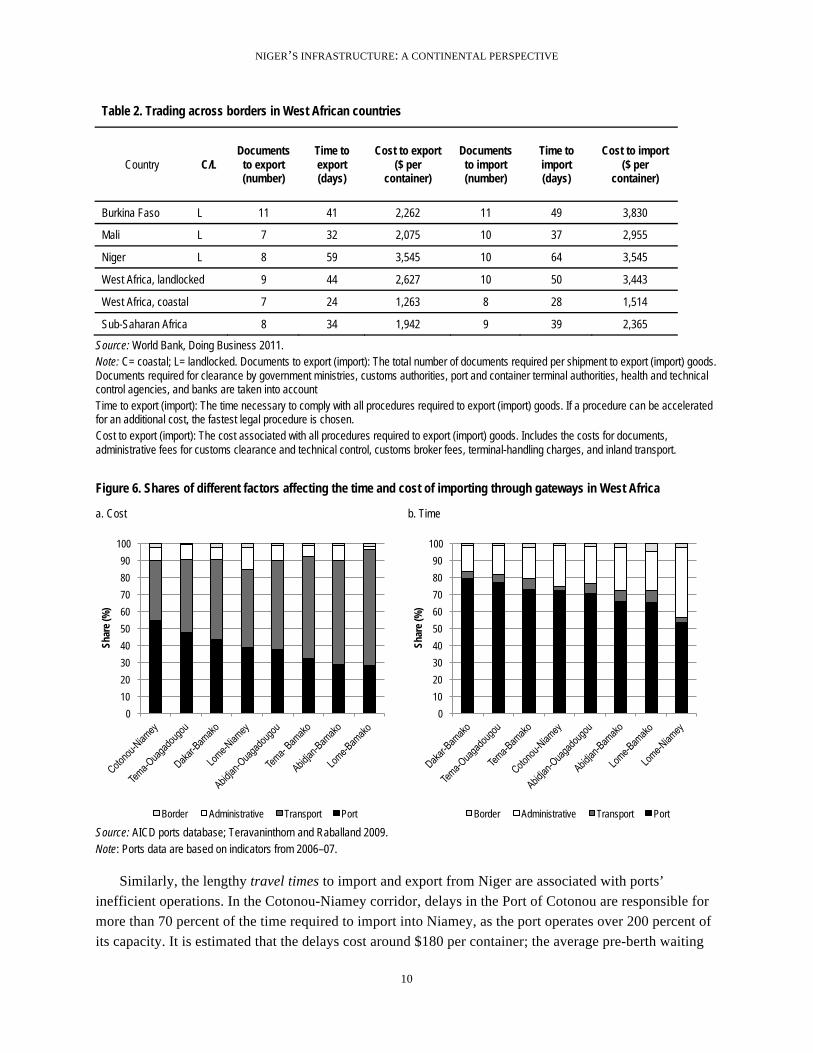
Niger’s costs and time to trade across borders are among the highest in the region in spite of its relatively high efficiency in moving goods across borders. The cost of exporting from and importing to Niger is the highest among West African countries and more than 70 percent higher than the average of Sub-Saharan Africa (table 2). Around 40 percent of the firms identified transport in Niger as a major business constraint, a level higher that the average in LICs (32 percent) and MICs (18 percent).4 The time needed to comply with all procedures required to export goods from Niger is 59 days, versus 34 days in the average West African country. It takes 64 days to import goods to Niger, which is above the regional average of 39 days.
The costs of trading to and from Niger are driven up by inefficiencies in the Port of Cotonou. High costs in this port account for the bulk of the cost (55 percent) of importing goods using the Cotonou-Niamey corridor (the highest share among the various gateways in West Africa), and surface transport accounts for 35 percent of the cost. Surface transport and port costs each account for about 40 percent of the cost of moving imports to Niger using the Lomé-Niamey corridor (figure 6a). The handling charges in the Port of Cotonou and Lomé are among the highest in West Africa (table 3), where services cost twice as much as those in other global ports.
4 World Bank–International Finance Corporation (IFC) Enterprise Surveys on 32 Sub-Saharan African countries.
Figure 5. Niger’s Logistics Performance Index ranking and that of other West African landlocked countries
Source: World Bank 2010d. Note: The Logistics Performance Index is based on a worldwide survey of operators on the ground (global freight forwarders and express carriers), providing feedback on the logistics “friendliness” of the countries in which they operate and those with which they trade. Such operators combine in-depth knowledge of the countries in which they operate with informed qualitative assessments of other countries with which they trade, and experience of a global logistics environment. SSA = Sub-Saharan Africa.
0
0.5
1
1.5
2
2.5
3
Sene
gal
Beni
n
Gui
nea
Togo
Nig
eria
Nig
er
Cot
e d'
Ivoi
re
Gam
bia,
The
Gha
na
Libe
ria
Mal
i
Burk
ina
Faso
Gui
nea-
Biss
au
Sier
ra L
eone
SSA Lo
gist
ics P
erfo
rman
ce In
dex
NIGER’S INFRASTRUCTURE: A CONTINENTAL PERSPECTIVE
10
Table 2. Trading across borders in West African countries
Country C/L Documents
to export (number)
Time to export (days)
Cost to export ($ per
container)
Documents to import (number)
Time to import (days)
Cost to import ($ per
container)
Burkina Faso L 11 41 2,262 11 49 3,830
Mali L 7 32 2,075 10 37 2,955
Niger L 8 59 3,545 10 64 3,545
West Africa, landlocked 9 44 2,627 10 50 3,443
West Africa, coastal 7 24 1,263 8 28 1,514
Sub-Saharan Africa 8 34 1,942 9 39 2,365
Source: World Bank, Doing Business 2011. Note: C= coastal; L= landlocked. Documents to export (import): The total number of documents required per shipment to export (import) goods. Documents required for clearance by government ministries, customs authorities, port and container terminal authorities, health and technical control agencies, and banks are taken into account Time to export (import): The time necessary to comply with all procedures required to export (import) goods. If a procedure can be accelerated for an additional cost, the fastest legal procedure is chosen. Cost to export (import): The cost associated with all procedures required to export (import) goods. Includes the costs for documents, administrative fees for customs clearance and technical control, customs broker fees, terminal-handling charges, and inland transport.
Figure 6. Shares of different factors affecting the time and cost of importing through gateways in West Africa
a. Cost b. Time
Source: AICD ports database; Teravaninthorn and Raballand 2009. Note: Ports data are based on indicators from 2006–07.
Similarly, the lengthy travel times to import and export from Niger are associated with ports’ inefficient operations. In the Cotonou-Niamey corridor, delays in the Port of Cotonou are responsible for more than 70 percent of the time required to import into Niamey, as the port operates over 200 percent of its capacity. It is estimated that the delays cost around $180 per container; the average pre-berth waiting
0
10
20
30
40
50
60
70
80
90
100
Shar
e (%
)
Border Administrative Transport Port
0
10
20
30
40
50
60
70
80
90
100
Shar
e (%
)
Border Administrative Transport Port

NIGER’S INFRASTRUCTURE: A CONTINENTAL PERSPECTIVE
11
time, at 48 hours, is the highest among West African ports. The global best practice for truck cycle time is one hour, and it is six hours in the Port of Cotonou (table 3). Delays in the Port of Lomé and administrative requirements are responsible for the bulk of the time consumed importing to Niger using the Lomé-Niamey corridor. This port is one of the busiest in West Africa, handling around 460,000 TEUs5 per year. Crane productivity in Lomé is 23 tonnes per hour, substantially better than elsewhere, although still short of the international benchmark. The international standard for the time containers spend in the terminal (dwell time) is 7 days or less, but in the Port of Lomé it is 13 days (table 3).
Time-consuming regulatory processes related to customs clearance and technical controls further augment the total time of trading across borders. In the Cotonou-Niamey corridor, administrative procedures account for about 23 percent of the total time required to move imports, and in the Lomé-Niamey corridor they consume around 35 percent (figure 6b). The administrative process in Niger is particularly cumbersome; unnecessary and often redundant formalities significantly prolong the time needed for customs clearance. This results in the costly immobilization of goods and means of transport (Enhanced Integrated Framework 2008).
Table 3. West African port indicators
Port Unit
Lomé, Togo
Cotonou, Benin
Dakar, Senegal
Abidjan, Côte
d’Ivoire
Tema, Ghana
Apapa, Nigeria
Harcourt, Nigeria
Total container cargo handled TEU, annual 460,000 158,201 331,191 500,119
420,000
336,308
7,900
Container dwell time Days 13 12 7 12 25 42 30
Truck turnaround time Hours 4 6 5 2.5 8 6 24
General-cargo vessel pre-berth waiting time Hours
48 24 2.9 9.6 36 38.4
General-cargo vessel turnaround time Hours
— 48 60 2.2 48 40.8 45.6
Crane productivity Containers per hour — — — 18 13 12 —
Crane productivity Tonnes per hour 23 15 — 16 14 9 8
Container-cargo-handling charge $ per TEU 220 180 160 260 168 155 —
General-cargo-handling charge $ per tonne 9 9 15 14 10 8 8
Bulk dry-handling charge $ per tonne 5 5 5 5 3 — —
Adequate road access present 0=no; 1=yes 0 0 0 — 0 0 0
Landlord model is used 0=no; 1=yes 1 0 0 1 1 1 1
Source: AICD ports database (www.infrastructureafrica.org/aicd/tools/data); data as of 2006. Note: TEU = 20-foot equivalent unit. — = Not available.
5 20-foot equivalent units.

NIGER’S INFRASTRUCTURE: A CONTINENTAL PERSPECTIVE
12
The inadequate implementation or simply the lack of enforcement of some of the rules and procedures agreed to by the various member states of the Economic Community of West African States (ECOWAS) and the West African Economic and Monetary Union (UEMOA)—rules and procedures that aim to promote efficiency and competition among transport carriers—augment the costs of trading to and from Niger. The abolishment of the queuing (tour de role) mechanism, a significant step toward trade facilitation, has not been effectively implemented by Niger. Trade flows are not balanced: import volumes total more than 20 times export volumes (table 4). Niger has to undertake urgent transport facilitation policies to phase out the many logistical and other barriers that impede the country’s economic development (World Bank 2008c).
Roads
Achievements
The condition of Niger’s portions of regional corridors is generally higher than these same corridors’ overall condition. Niger’s portion of the Lomé-Niamey corridor is entirely paved and almost 100 percent in good condition, while only 52 percent is in good or fair condition on the Togo side. Of the Cotonou-Niamey corridor, 100 percent of the Nigerien part is in good or fair condition, but only 40 percent of the Beninese part is. The country’s portion of the Nouakchott-Ndjamena corridor is 70 percent in good or fair condition, and it is only 38 percent so in the Senegalese portion (table 5). Clearly, the incentives for the coastal country to maintain hinterland road corridors do not seem to be strong, since the coastal countries’ economies are typically concentrated along the coast, making the up-country segments regional public goods, in effect. The relatively poor condition of the corridors in the coastal countries puts Niger at a disadvantage and calls for further regional coordination and collaboration.
Table 4. Niger’s international trade
Product Value (CFAF billions)
Volume (in tonnes)
Imports 503.3 Petroleum products 83.3
Rice and related products 157 630,000
Consumption goods 99.9 138,750
Intermediate and capital goods 163.1
Exports 263.5 Uranium 78.5 3,400
Cattle 29.1 40,152
Cowpeas 11.4 23,940
Onions 33.8 83,248
Other exports 110.7
Source: World Bank 2008c.

NIGER’S INFRASTRUCTURE: A CONTINENTAL PERSPECTIVE
13
Table 5. Road conditions along major transit ECOWAS corridors that run through Niger
Percentage in condition Percentage
paved
Percentage in traffic band
Corridors Good Fair Poor
<300 300–1,000 >1,000
Gateways to the sea
Lomé-Niamey 50.2 30.1 19.8 100.0 0.0 82.6 17.4
Togo 51.7 0.0 48.3 100.0 0.0 37.2 62.8
Burkina Faso 35.4 38.9 25.8 100.0 0.0 77.3 22.7
Niger 99.0 1.0 0.0 100.0 0.0 100.0 0.0
Cotonou-Niamey 49.5 7.9 42.6 98.5 1.5 26.4 70.0
Benin 38.1 2.2 59.7 97.8 2.2 15.8 81.5
Niger 77.7 22.3 0.0 100.0 0.0 52.8 41.4
Intraregional corridors
Nouakchott-Ndjamena 63.4 21.1 10.2 97.3 9.9 46.2 43.4
Mauritania 50.6 23.8 25.6 100.0 0.0 21.5 78.5
Senegal 10.9 26.5 62.6 28.6 0.0 100.0 0.0
Mali 62.9 31.3 0.0 94.2 5.8 75.8 16.4
Burkina Faso 70.7 29.3 0.0 100.0 6.2 37.6 56.3
Niger 66.4 4.4 29.1 99.1 3.8 46.8 48.5
Nigeria — — — 100.0 0.0 0.0 100.0
Cameroon 84.8 15.2 0.0 100.0 31.0 56.5 12.5
Source: AICD 2010. Note: ECOWAS = Economic Community of West African States — = Not available.
Challenges
Although only one-third of the Nigerien road network is in poor condition, most of the remainder is in fair rather than good condition. If no routine and periodic maintenance is performed, a large share of the main network could fall into poor condition within a short period of time. Even though 58 percent of the unpaved network – mostly rural - is in good or fair condition, above the average condition in LICs (table 6), the rural network is in fragile condition.
A major factor contributing to the poor or fair condition of the network is truck overloading. To compensate for the small number of trips per month (typically only one), truckers try to maximize their load. Some trucks exceed 70 tonnes, while the maximum allowed for six axles is only 51 tonnes (Enhanced Integrated Framework 2008); this contributes toward the deterioration of the road network and increases rehabilitation costs.
Coverage of the road network is an important challenge vis-à-vis the large size and relatively low population density of Niger. Total road density over arable land is around one-tenth the density of LICs (13 km compared to 132 km/1,000 km2, table 6). There are only 1.2 km of roads per 1,000 people—one-third the average for Sub-Saharan Africa. The rural network density is even lower, at 0.6 km per 1,000 people, one of the lowest on the continent.

NIGER’S INFRASTRUCTURE: A CONTINENTAL PERSPECTIVE
14
Table 6. Niger’s road indicators
Indicator Unit Low-
income countries
Niger Middle-income
countries
Total road network density [1] km/1,000 km2 of land area 132 13 318
Classified road network density km/1,000 km2 of land area 88 11 278
GIS rural accessibility % of rural pop. within 2 km of all-season road 25 15 31
Household survey rural accessibility % of rural pop. within 2 km of all-season road 34 37 63
Classified paved network condition % in good or fair condition 72 67 86
Classified unpaved network condition % in good or fair condition 53 58 65
Classified paved road traffic AADT 1,131 387 2,451
Classified unpaved road traffic AADT 57 31 107
Primary network overengineering % of primary network paved with 300 AADT or less 30 53 18
Primary network underengineering % of primary network unpaved with 300 AADT or more 13 23 20
Source: AICD Road Sector Database. Note: [1] Includes the classified and unclassified network. GIS = geographic information system; AADT = average annual daily traffic.
Traffic levels are extremely low, making it difficult to justify heavy road engineering. Traffic in the classified paved network, at 387 vehicles per day, is only one-third of the average 1,131 vehicles in LICs and one-eighth of the average 2,451 vehicles in MICs. The volume of traffic in Niger’s unpaved network is also low—31 vehicles per day on average, versus 57 vehicles for comparable LICs. Niger has not been sensitive to this reality: around 53 percent of its primary network is over-engineered (that is, it is paved even though it has traffic levels of under 300 vehicles per day; table 6).
The spread of population over a wide geographical area, along with the requirement for international road connectivity, poses a challenge to road financing. At an estimated 6 cents per liter for diesel and super gasoline, the Niger fuel levy is in the middle of the Sub-Saharan Africa distribution. But the fuel levy is set well below the 26 cents per liter needed to cover the maintenance costs arising from wear and tear of the network by road users and is sufficient to finance only 34 percent of routine maintenance (figure 7). The estimated optimal fuel levy for maintenance in Niger is one of the highest on the continent after Ethiopia and Chad, reflecting the geographical characteristics of the country.

NIGER’S INFRASTRUCTURE: A CONTINENTAL PERSPECTIVE
15
Figure 7. Optimal and existing fuel levy in select Sub-Saharan African countries
Source: Gwillliam and others, 2008.
In Niger current capital spending falls
well below what is needed to clear the rehabilitation backlog and maintain the existing network. Taking into account the current distribution of network conditions and working toward a target of clearing the current rehabilitation backlog within a five-year period and maintaining the network, it is possible to produce detailed estimates of the rehabilitation and maintenance requirements for Niger’s road network. The current levels of capital expenditure in Niger are not high enough to address the rehabilitation problem: they fall 65 percent below the rehabilitation norm, one of the biggest deviations among West African countries.
Spending on maintenance is around 70 percent below what is required to properly maintain Niger’s road network (figure 8). Road maintenance funding paradoxically declined after the creation of CAFER6, the road fund created in November 1999; a lack of realism in maintenance programming has led to an overcommitment of CAFER’s resources. A lack of resources and the accrual of substantial arrears in recent years have been two main obstacles to the proper maintenance of the road network and the development of a genuine private-public works subsector (World Bank 2008c). Additional funding will be needed despite implementation of road user charges, in particular for secondary and tertiary networks; 89
6 Caisse Autonome de Financement de l’Entretien Routier.
0
5
10
15
20
25
30
35 US
cent
s per
liter
Existing Optimal for maintenance
Figure 8. Spending on road maintenance and rehabilitation in Niger and other Sub-Saharan nations
Source: Gwilliam and others 2009. Note: Analysis of adequacy of road maintenance spending can only be performed for the primary network under federal jurisdiction.
-80%
-60%
-40%
-20%
0%
20%
40%
60%
Nigeria Niger Senegal Cote d'Ivoire
Liberia Ghana Benin
Spen
ding
as p
erce
ntag
e of n
orm
s
Maintenance Rehabilitation
NIGER’S INFRASTRUCTURE: A CONTINENTAL PERSPECTIVE
16
percent of the road fund’s resources are dedicated to the primary network. The goal is to increase road user charges and gradually phase out direct treasury transfers or external funding. But it might be particularly difficult to implement full cost recovery, at 26 cents per liter, given the already high price of fuel.
Railways
Achievements
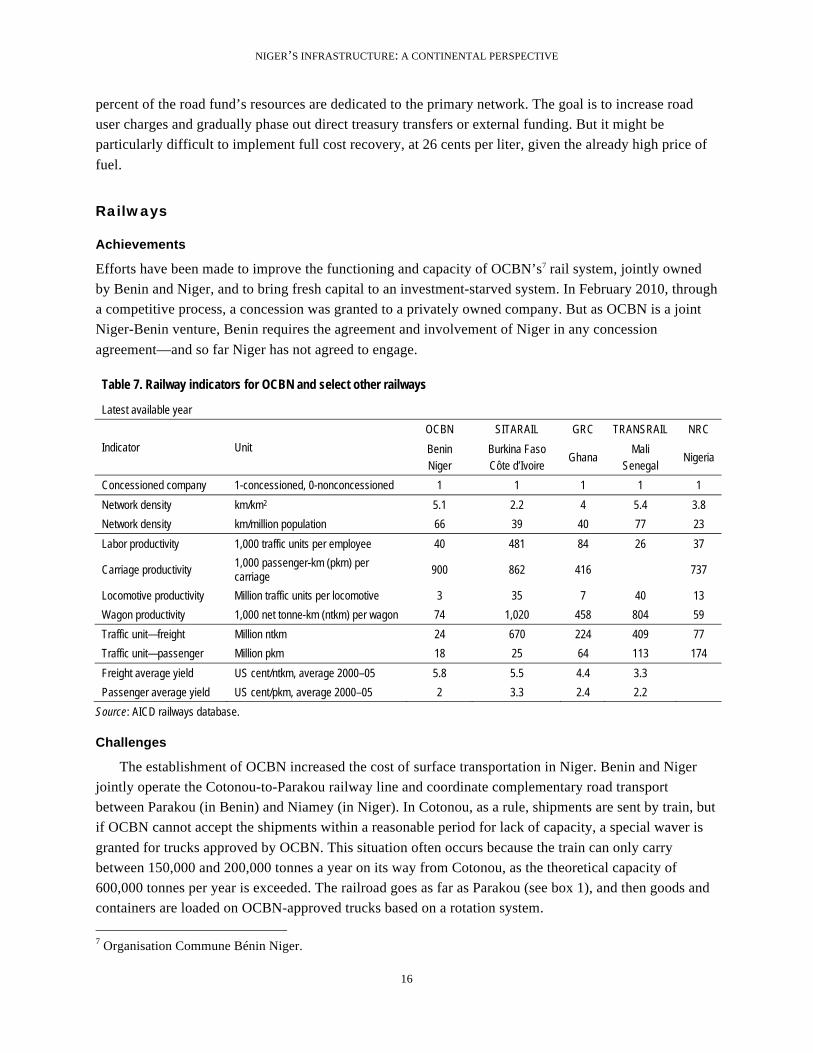
Efforts have been made to improve the functioning and capacity of OCBN’s7 rail system, jointly owned by Benin and Niger, and to bring fresh capital to an investment-starved system. In February 2010, through a competitive process, a concession was granted to a privately owned company. But as OCBN is a joint Niger-Benin venture, Benin requires the agreement and involvement of Niger in any concession agreement—and so far Niger has not agreed to engage.
Table 7. Railway indicators for OCBN and select other railways
Latest available year
Indicator Unit
OCBN SITARAIL GRC TRANSRAIL NRC
Benin Niger
Burkina Faso Côte d’Ivoire
Ghana Mali
Senegal Nigeria
Concessioned company 1-concessioned, 0-nonconcessioned 1 1 1 1 1
Network density km/km2 5.1 2.2 4 5.4 3.8
Network density km/million population 66 39 40 77 23
Labor productivity 1,000 traffic units per employee 40 481 84 26 37
Carriage productivity 1,000 passenger-km (pkm) per carriage
900 862 416 737
Locomotive productivity Million traffic units per locomotive 3 35 7 40 13
Wagon productivity 1,000 net tonne-km (ntkm) per wagon 74 1,020 458 804 59
Traffic unit—freight Million ntkm 24 670 224 409 77
Traffic unit—passenger Million pkm 18 25 64 113 174
Freight average yield US cent/ntkm, average 2000–05 5.8 5.5 4.4 3.3
Passenger average yield US cent/pkm, average 2000–05 2 3.3 2.4 2.2
Source: AICD railways database.
Challenges
The establishment of OCBN increased the cost of surface transportation in Niger. Benin and Niger jointly operate the Cotonou-to-Parakou railway line and coordinate complementary road transport between Parakou (in Benin) and Niamey (in Niger). In Cotonou, as a rule, shipments are sent by train, but if OCBN cannot accept the shipments within a reasonable period for lack of capacity, a special waver is granted for trucks approved by OCBN. This situation often occurs because the train can only carry between 150,000 and 200,000 tonnes a year on its way from Cotonou, as the theoretical capacity of 600,000 tonnes per year is exceeded. The railroad goes as far as Parakou (see box 1), and then goods and containers are loaded on OCBN-approved trucks based on a rotation system. 7 Organisation Commune Bénin Niger.
NIGER’S INFRASTRUCTURE: A CONTINENTAL PERSPECTIVE
17
By rule, two-thirds are distributed to trucks from Niger and one-third to those from Benin. The rate is set for the entire route (Cotonou to Niamey) but, in reality, Niger shippers often sell their “driving rights” to their Beninese counterparts and the rates are negotiable. The shippers then try to recover these costs and compensate for the low rates by overloading, which is a major problem for Niger’s road maintenance. Another alternative is for the importer to indicate Benin as the destination, and then obtain a reexport statement, or pay “unofficial” levies at the border (Enhanced Integrated Framework 2008).
Boosting freight and passenger traffic on OCBN’s tracks is an important challenge for Benin, where traffic levels are among the lowest in the region. On average, only 24 million net tonne-km and 18 million passenger-km were registered between 2001 and 2005—levels that put the Beninese railways behind other railways in West Africa (table 7). The situation further deteriorated, and passenger traffic stopped in 2007.
OCBN also needs to enhance its productivity, which lags most railways in West Africa. At 40,000 traffic units per employee, OCBN labor productivity is comparable with that of NRC but behind that of SITARAIL and GRC (481,000 and 84,000 traffic units per employee, respectively). On average, OCBN locomotives transported 3 million traffic units, the lowest figure compared to other concessions in the region. Similarly, wagon productivity, at 74,000 net tonne-km per wagon, was just a fraction of that of SITARAIL, GRC, and TRANSRAIL. Only carriage productivity, at 900,000 km per carriage, was comparatively high (table 7).
OCBN’s freight tariffs are the highest in the region—an average of 5.8 cents/tonne-km. Only SITARAIL has freight tariffs comparable with OCBN’s. But passenger tariffs, at 2 cents/passenger-km, are the lowest in the region (table 7).
Air transport
Achievements
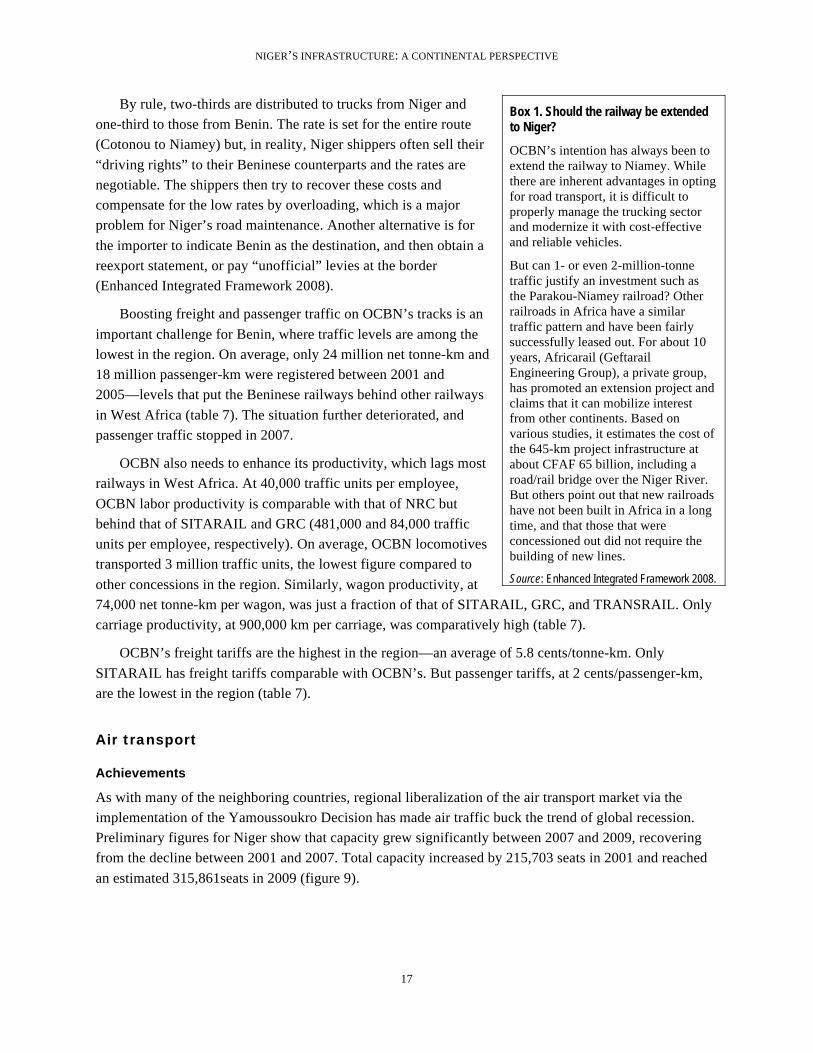
As with many of the neighboring countries, regional liberalization of the air transport market via the implementation of the Yamoussoukro Decision has made air traffic buck the trend of global recession. Preliminary figures for Niger show that capacity grew significantly between 2007 and 2009, recovering from the decline between 2001 and 2007. Total capacity increased by 215,703 seats in 2001 and reached an estimated 315,861seats in 2009 (figure 9).
Box 1. Should the railway be extended to Niger?
OCBN’s intention has always been to extend the railway to Niamey. While there are inherent advantages in opting for road transport, it is difficult to properly manage the trucking sector and modernize it with cost-effective and reliable vehicles.
But can 1- or even 2-million-tonne traffic justify an investment such as the Parakou-Niamey railroad? Other railroads in Africa have a similar traffic pattern and have been fairly successfully leased out. For about 10 years, Africarail (Geftarail Engineering Group), a private group, has promoted an extension project and claims that it can mobilize interest from other continents. Based on various studies, it estimates the cost of the 645-km project infrastructure at about CFAF 65 billion, including a road/rail bridge over the Niger River. But others point out that new railroads have not been built in Africa in a long time, and that those that were concessioned out did not require the building of new lines.
Source: Enhanced Integrated Framework 2008.
NIGER’S INFRASTRUCTURE: A CONTINENTAL PERSPECTIVE
18
Figure 9. Evolution of seats and city pairs in Niger
a. Seats b. City pairs
Source: Bofinger, 2009.Derived from AICD national database (www.infrastructureafrica.org/aicd/tools/data). Note: As reported to international reservation systems.
The fleet servicing Niger has been renovated. Around 95 percent of the seat capacity is new, largely
due to the international nature of the services. Four airlines—Air France, Royal Air Maroc, Afriqiyah Airways, and Air Senegal International—comprised over 80 percent of the regularly scheduled traffic in 2007. In 2009 Air Senegal International, with a market share of 14 percent, ceased operations.
Table 8. Benchmarking air transport indicators for Niger and select other countries
Country Niger Mali Chad Nigeria Burkina Faso
Central African
Republic
Traffic (2007)
Domestic seats (seats per year) n.a. n.a. n.a. 9,304,568 20,245 n.a.
Seats for international travel within Africa (seats per year) 128,414 564,455 109,074 1,373,745 244,721 20,661
Seats for intercontinental travel (seats per year) 41,717 165,776 88,608 2,437,702 147,095 23,842
Seats available per capita 0.012 0.061 0.018 0.089 0.027 0.010
Herfindahl-Hirschmann Index—air transport market (%) 18.97 11.75 36.35 71.4 22.89 50.26
Quality
Percent of seat-km in newer aircraft 94.3 95.6 99.5 71.4 93.4 100
Percent of seat-km in medium or smaller aircraft 44.9 51.8 93.6 27.6 46.7 23.5
Percent of carriers passing IATA/IOSA Audit 0 0 0 28.6 0 0
FAA/IASA Audit Status No audit No audit No audit No audit No audit No audit
Source: Bofinger, 2009. Derived from AICD national database (www.infrastructureafrica.org/aicd/tools/data). n.a. = Not applicable. Note: The Herfindhal-Hirschmann Index (HHI) is a commonly accepted measure of market concentration. It is calculated by squaring the market share of each firm competing in the market and then summing the resulting numbers. A HHI of 100 indicates the market is a monopoly; the lower the HHI, the more diluted the market power exerted by one company/agent. All data as of 2007 are based on estimations and computations of scheduled advertised seats, as published by the Dusiio SRS Analyzer. This captures 98 percent of worldwide traffic, but a percentage of African traffic is not captured by these data. FAA = U.S. Federal Aviation Administration; IASA = International Aviation Safety Assessment; IATA = International Air Transport Association; IOSA = IATA International Safety Audit.
-
50,000
100,000
150,000
200,000
250,000
300,000
350,000
400,000
450,000
2001 2004 2007 2009 (Est)
Num
ber o
f sea
ts
Total International Intercontinental
0 2 4 6 8
10 12 14 16 18 20
2001 2004 2007 2009 (Est)
City
Pair
s
Total International Intercontinental

NIGER’S INFRASTRUCTURE: A CONTINENTAL PERSPECTIVE
19
Challenges
The Nigerien air transport market is thin but has relatively developed infrastructure. The volumes of its international and intercontinental traffic are among the lowest in West Africa. The number of seats available per capita, at 0.12, is the second-lowest in the region, after the Central African Republic (table 8). The underdevelopment of the air transport sector is a reflection of the low level of national economic activity, the high cost of air transport compared to the population’s purchasing power, and the cost of jet fuel. Niger has three international airports in Niamey, Agadez, and Zinder, and three national airports in Maradi, Tahoua, and Diffa. A B747 can land only at Niamey airport, but Agadez can receive an Airbus 320. The other airports are built according to B737/200 standards. There are also laterite landing strips that are used for light aviation. Each of the six airports has facilities for air traffic control, including a control tower. These infrastructures need to be rehabilitated to maintain a level of safety that complies with the category of the airfield, but there is a severe lack of funding (Enhanced Integrated Framework 2008).
The quality of Niger’s safety oversight is below some of its neighbors and, except for the passing of the required civil aviation laws, the implementation of the International Civil Aviation Organization’s (ICAO’s) global standards and recommended practices is below global averages. In general, however, the passing of civil aviation laws is an indication of an ongoing effort within the country to raise overall safety standards and improve the oversight system.
Water resources
Niger is poorly endowed with water compared to countries occupying similar climatic zones, and is largely dependent on its neighbors. The Niger River, a transnational river that crosses the southwest of the country for about 550 km, is the only river that provides the country with permanent water, and its supply has declined over time. Niger belongs to two international basins: the Irhazer Lullemeden and the Chad. The renewable water resources per capita are estimated at about 2,710 cubic meters (m3) per year (including the cross-border flows), far below the Sub-Saharan African average of 7,000 m3. Rainfall ranges between 100 and 800 mm per year (averaging 151 mm annually), with nearly 90 percent of the territory receiving less than 350 mm of rain.
There are several factors that put significant pressure on water resources. Agricultural production needs represent 95 percent of total demand for water. Demand for domestic purposes and the industrial sector—4 percent and 1 percent of total water use, respectively—has increased over time. The urban water demand is expected to grow by 30 percent over the next decade (World Bank 2009a).
Given the wide range of conflicting uses (agriculture, domestic consumption, and industry), it is essential to have a clearly defined basis for allocating water rights among sectors so as to maximize their development impact. Beyond investment in dams’ maintenance, the further development of small-scale irrigation projects would do much to alleviate rural poverty and enhance the resilience of rural livelihoods to constant droughts.

NIGER’S INFRASTRUCTURE: A CONTINENTAL PERSPECTIVE
20
Irrigation
The agricultural sector is central to Niger’s economy. As of 2008, agriculture accounted for around 45 percent of Niger’s GDP, and around 87 percent of the labor force is involved in agriculture (versus 59 percent in Sub-Saharan Africa). Niger’s agricultural sector has grown 6 percent per year on average, twice the annual growth registered in Sub-Saharan Africa. But this was not enough to make it a net exporter. Niger imported around 50 percent of cereals from neighboring countries (Nigeria, Mali, Burkina Faso, Ghana, and Benin). Millet, the most drought-resistant cereal, accounts for almost two-thirds of total agricultural production. Despite its contribution to GDP, the agricultural value added per worker in Niger, at $157 per year, was well below the Sub-Saharan African average of $575. Low productivity is explained by the random nature of rainfall, the persistence of droughts and poor soil quality, and the small scale of production (85 percent of the total agricultural production is for self-consumption).
The arable land in Niger is estimated at 16.5 million hectares, equivalent to 13 percent of the country’s land. This low percentage is explained by the fact that around two-thirds of the country in the north is a desert. As of 2004, 4.5 million hectares—or 27 percent of the arable land—were dedicated to agriculture (primarily rain fed) and mainly for sorghum, cowpea, and cassava crops.
Irrigation systems might contribute to tapping this agricultural potential in Niger, which until now has been partially exploited under rain-fed agriculture. Niger’s irrigation potential is largely underdeveloped. As of 2004, 73,663 hectares were equipped for irrigation and another12,000 hectares were under some other form of water management. Public investment has been directed mainly toward small-scale irrigation systems. Both the irrigated area and the water management area were equivalent to 1.9 percent of the total cultivated area, a level below the average (3.5 percent) for Sub-Saharan African countries. Between 1973 and 2003 the irrigated area grew 4.8 percent annually, which was above the Sub-Saharan African growth rate of 2.3 percent. Even though irrigated land represents a negligible part of the total cultivated area, it contributes 30 percent to the total value of agriculture production. It is also estimated that irrigated agriculture, mainly rice, represents 14 percent of the agricultural GDP.
Niger’s current irrigated area could be increased with good economic returns. Simulations suggest that with a threshold internal rate of return (IRR)8 of 6 percent, it would be economically viable to develop a further 192,151 hectares of land for irrigation, of which 35 percent could be developed through large-scale projects. If the threshold IRR is raised to 12 percent, the economically viable area for irrigation shrinks to 117,553 hectares for only small scale-projects, as large-scale projects would not have an IRR higher than 12 percent. The investment required to attain this expansion would be $607 million (table 9). The area with the most irrigation potential is concentrated in the southwest part of the country, in the valley of the Niger River, close to the border with Burkina Faso (figure 10b).
8 Internal rates of return (IRRs) for irrigation are calculated based on various values for water cost (for dam-based irrigation), three alternative levels of irrigation investment, and two-time trajectories for investment expenditures. For small-scale irrigation, profitable areas are identified by pixel; for large-scale irrigation, IRRs are calculated for each dam.

NIGER’S INFRASTRUCTURE: A CONTINENTAL PERSPECTIVE
21
Figure 10. Niger’s irrigation sector
a. Current irrigation area b. Potential (baseline scenario)
Source: Map on current area: AICD Interactive Infrastructure Atlas for Niger (www.infrastructureafrica.org). Map on irrigation potential: You 2008. Note: Baseline scenario was calculated assuming investment cost of $3,000 per hectare, a canal maintenance and water-delivery cost of 1¢ per cubic meter, on-farm annual operation and maintenance costs of $30 per hectare, and a discount rate of 12 percent. IRR = internal rate of return.
Table 9. Niger's irrigation potential
Cut-off (%)
Large scale Small scale Total
Investment IRR Area increase Investment IRR Area
increase Investment IRR Area increase
$ million % hectare $ million % hectare $ million % hectare 0 130 9.3 66,569 658 40.0 127,357 788 29.5 193,926
6 130 9.3 66,569 649 45.0 125,582 779 32.6 192,151
12 0 0.0 0 607 51.0 117,553 607 51.0 117,553
24 0 0.0 0 530 65.0 102,660 530 65.0 102,660
Source: Derived from You and others (2009). Note: Water for irrigation can be collected in two ways: through large, dam-based schemes or through small projects based on the collection of run-off from rainfall. The investment costs of large-scale irrigation development reflect only irrigation-specific infrastructure, such as distribution canals and on-farm system development. The potential for small-scale irrigation is assessed not only on the basis of agro-ecological conditions, but also in terms of market access, since irrigation is typically viable only if the increased yields can be readily marketed. The unit cost for large-scale projects is set at $3000/ha and for small-scale projects at $2000/ha IRR = internal rate of return.

NIGER’S INFRASTRUCTURE: A CONTINENTAL PERSPECTIVE
22
Compared with its regional peers, Niger has among the largest potential area for small-scale irrigation projects and an attractive rate of return (figure 11), using an IRR cutoff of 12 percent.
Figure 11. Irrigation potential, small-scale projects
Source: Derived from You and others (2009). Note: Based on 12 percent cut-off estimates, at which the estimated area increase for southern African countries not included in the figure is zero. Water for irrigation can be collected in two ways: through large, dam-based schemes or through small projects based on collection of run-off from rainfall. The investment costs of large-scale irrigation development reflect only irrigation-specific infrastructure, such as distribution canals and on-farm system development. The potential for small-scale irrigation is assessed not only on the basis of agro-ecological conditions, but also in terms of market access, since irrigation is typically viable only if the increased yields can be readily marketed.
Water supply and sanitation
Achievements
In a context of high population growth, Niger has made important progress in reducing its reliance on surface water, in particular in urban areas. Reliance on surface water declined from 9.8 percent of the population in 1998 to 1.8 percent in 2006, a level well below the average for LICs and even MICs (table 10). In spite of high population growth (3.4 percent per year between 1998 and 2006), around 0.3 percent of the population has been moving away from surface water, and 1.1 percent of the urban population has been moving to some other form of water supply every year (figure 13).
Niger has managed to move its population up the water supply ladder by means of extending low-cost technologies, such as standposts and wells and boreholes. Access to standposts increased from 12.5 percent in 1998 to 16 percent in 2006 (table 10), which implies that at the national level 2.1 percent of the population was gaining access to this mode of water supply (figure 13). The number of wells and boreholes increased from 73 percent to 76.4 percent of the population between 1998 and 2006. Compared to other LICs, Niger’s rate of access to wells and boreholes is twice as high. But only 20 percent of these wells can be considered safe.
0 200 400 600 800 1000 1200 1400 1600 1800
0 10 20 30 40 50 60 70 80
Area
Incr
ease
(tho
usan
d ha
)
Inte
rnal
rate
of r
etur
n
Area increase (thousand ha) Internal Rate of Return (%)

NIGER’S INFRASTRUCTURE: A CONTINENTAL PERSPECTIVE
23
Table 10. Benchmarking water and sanitation indicators
Unit
Low-income
countries Niger
Middle-income
countries Mid-2000s 1998 2006 Mid-2000s
Access to piped water % pop 10.5 4.4 5.8 52.1
Access to standposts % pop 16.2 12.5 16.0 18.9
Access to wells/boreholes % pop 38.3 73.0 76.4 6.0
Access to surface water % pop 37.4 9.8 1.8 13.0
Access to flush toilets % pop 4.9 0.8 1.0 40.8
Access to improved latrines % pop 9.9 8.1 12.4 1.4
Access to traditional latrines % pop 50.1 8.1 5.1 30.4
Open defecation % pop 40.3 82.9 81.5 14.3
2001 2005 2007
Domestic water consumption liter/capita/day 50.7 37 41 44 154
Revenue collection % sales 92.7 80 88 90 100.0
Distribution losses % production 34.3 22 19 17 26.8
Cost recovery [1] % total costs 56.0 41 57 67 80.6
Operating cost recovery % operating costs 65 161 113 130 145
Labor costs connections per employee
159 116 171 182 369
Total hidden costs as % of revenue % 163 88 75 59 140
Niger
Scarce water resources
Other developing
regions 2005 2006
Residential tariff US cents per cubic meter 34 34 60
Nonresidential tariff US cents per cubic meter 76 80 120 3–60
Source: Demographic and Health Surveys and AICD water and sanitation utilities database (www.infrastructureafrica.org/aicd/tools/data). Note: Access figures from the Demographic and Health Surveys for 1998 and 2006. [1] Cost recovery is estimated based on the assumption of a capital cost of 40 cents/m3. — = Not available.
In 1999 the government introduced an ambitious urban water sector reform aimed at improving the operational and financial performance of the sector by reducing operating costs, introducing private sector commercial management, achieving financial autonomy, and expanding access. The new institutional framework involved four main actors: the government, which was responsible for defining sector policy, managing water resources, and developing tariff policy; a multisector regulatory agency (Autorité de Regulation Multi-Sectorielle, ARM), responsible for developing a regulatory framework and monitoring urban water services and contractual arrangements among stakeholders; a public asset-holding company (Société de Patrimoine des Eaux du Niger, SPEN), responsible for investments; and a private operator selected by competitive bidding (Société d’Exploitation des Eaux du Niger, SEEN), in charge of delivering services. In March 2001 SPEN and the government granted SEEN a 10-year performance concession to operate the water supply systems of 51 urban centers—representing 72 percent of the population.
NIGER’S INFRASTRUCTURE: A CONTINENTAL PERSPECTIVE
24
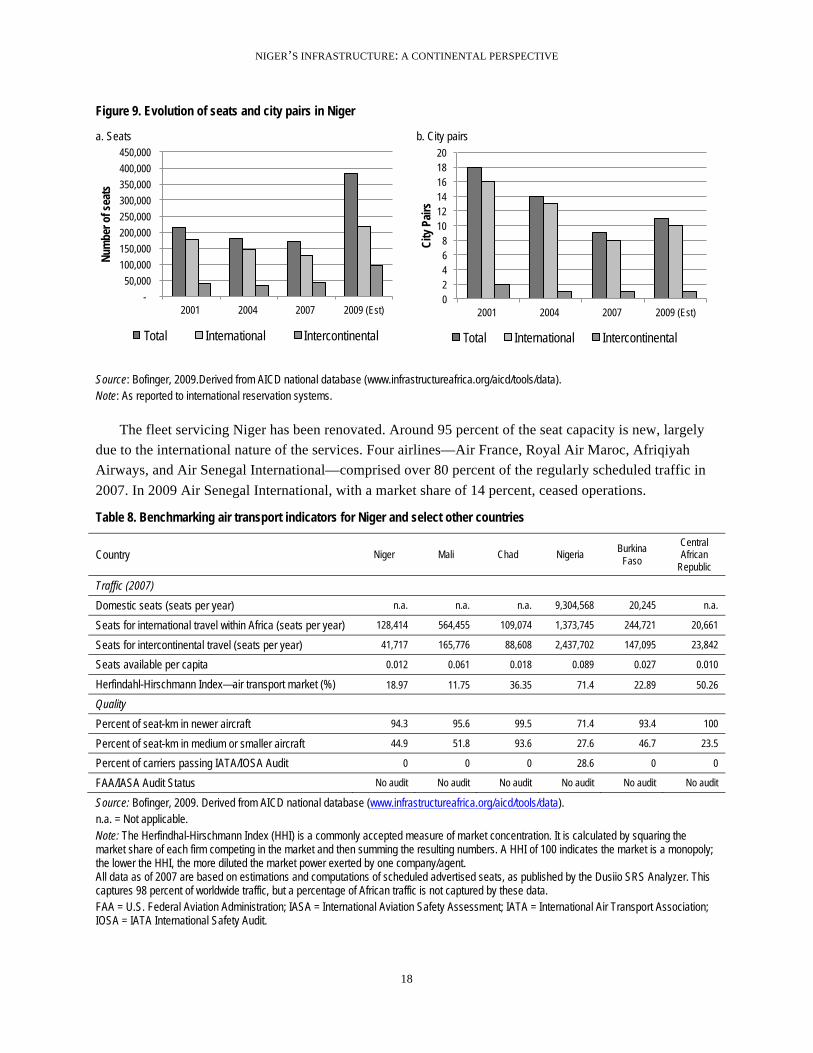
The urban water reform resulted in significant increases in access to piped water and standposts, and improvements in the sector’s operational and financial performance and service quality. In 1998 the access to piped water and standposts in urban areas was 27 and 37 percent of the population, respectively. The national water utility (SNE) was overstaffed and its financial situation undermined by inadequate cost-recovery policies and the accumulation of arrears from public customers—by 2000 about $12 million, equivalent to 125 percent of its revenue. The lack of investment resulted in a substantial backlog, leading to frequent water shortages. In 2006 piped water and standposts were expanded to 35 and 56 percent of the population, respectively. In the 10 years following the concession, systems losses declined progressively from 22 percent in 2001 to 16 percent in 2010, not only below the average of other LICs but even below the international benchmark of 20 percent of a well-performing utility. Collection ratios increased from 80 percent of all bills to 97 percent over those years, about the average collection ratio of other LICs (tables 6 and 7). Connections per employee rose from 116 to 184. Until 2006 regular tariff adjustments were made, helping compensate the increase in the unit total cost of production from 58 cents in 2001 to 82 cents in 2009 (table 11).9 The continuity of water supply was augmented from 18 hours to 24 hours between 2001 and 2009.
Table 11. Evolution of operational indicators associated with SPEN, Niger
Year Water delivered System losses
Collection ratio
Average total cost
Average effective tariff
Total hidden costs
Total hidden costs
(million m3/year) (%) (%) ($/m3) ($/m3) ($ million/year) (% revenues )
2001 32 22 80 0.58 0.27 8 88
2002 35 17 89 0.57 0.30 9 91
2003 36 17 94 0.80 0.36 14 121
2004 39 17 92 0.80 0.41 14 95
2005 42 19 88 0.82 0.47 14 75
2006 43 17 97 0.82 0.50 12 63
2007 47 17 90 0.82 0.55 13 59
2008 49 15 92 0.82 0.55 13 49
2009 52 16 97 0.82 0.55 13 50
Source: Derived from Briceño-Garmendia, Smits, and Foster (2009). Note: SPEN = Société de Patrimoine des Eaux du Niger.
SPEN’s improvements in operational and financial performance have led to decreasing hidden costs. Whereas in 2001 hidden costs represented 88 percent of SPEN’s revenues, in 2009 they represented around 50 percent of the revenues, a level comparable to other utilities in the region (figure 12b). In 2003 hidden costs reached the highest point in the period 2001–09 due to an important increase in the average total costs compounded by a relatively low average effective tariff (table 11).
9 Since January 2006 the published water tariffs have not been adjusted (see effective residential water tariff at 10 m3 and nonresidential at 100 m3 in table 10). But due to changes in the composition of the total billings and total water consumption among residential and nonresidential customers, the average effective tariff per cubic meter indeed experienced an increase from 50 cents in 2006 to 55 cents in 2007 (see table 11).

NIGER’S INFRASTRUCTURE: A CONTINENTAL PERSPECTIVE
25
Figure 12. Hidden costs Percentage of revenue a. Evolution of hidden costs in Niger’s water sector b. Hidden costs of select water utilities in West Africa
Source: Derived from Baneerjee and others (2008b) and Briceño-Garmendia, Smits, and Foster (2009).
Challenges
The frequency of open defecation in Niger is probably the worst in Sub-Saharan Africa and has increased over time. As of 2006, 82 percent of the population practiced open defecation in Niger, more than twice as high as the average for LICs (table 10). Furthermore, between 1998 and 2006 around 2.3 percent of the national population annually reverted to open defecation. The situation was even worse in rural areas, where around 2.7 percent of the population went back to open defecation. The slow progress in improving latrines has not been enough to counteract the country’s population growth at 3.4 percent per year (figure 13b).
Progress in improving rural water supply is insufficient. While, as of 2006, 90 percent of the water in rural areas was supplied through wells and boreholes, only 22 percent of this was supplied by protected wells or boreholes. Given that around 30 percent of rural water facilities are not operating properly, mainly due to lack of rehabilitation and maintenance, effective access to safe water from wells and boreholes has been further reduced.
The financial equilibrium of the water supply sector is at stake if tariff adjustments do not take effect shortly and government arrears continue to grow. In January 2006 the government froze water tariffs as part of its poverty alleviation policy, and since then tariffs have remained at 34 cents/m3 for residential customers and 80 cents/m3 for non-residential customers (table 10). Even though SPEN has managed to cover its operational costs, the tariffs are not enough to cover its capital costs; as of 2007 revenues were covering only 67 percent of total costs (table 10). Until 2006 public customers were current on their payments, but since then arrears have grown, reaching more than $2 million as of 2009.
0
20
40
60
80
100
120
140
Perc
enta
ge o
f rev
enue
s
Collection inefficiencies Losses Underpricing
0
20
40
60
80
100
120
140
Perc
enta
ge o
f rev
enue
s Collection Inefficiencies Underpricing Losses

NIGER’S INFRASTRUCTURE: A CONTINENTAL PERSPECTIVE
26
Figure 13. Expansion of standposts and improved latrines in Niger Population gaining access per year between 1998–2006
a. Water b. Sanitation
Source: WHO Joint Monitoring Program 2010, from the Demographic and Health Surveys for 1998 and 2006.
Power
Achievements
The performance of NIGELEC,10 Niger’s power utility, improved significantly after the introduction of an internal restructuring program in 2006. System losses accounted for 27 percent of the power produced in 2005 and dropped to 17 percent in 2009, below what is observed in power utilities on average in Sub-Saharan African low- and middle-income countries. But system losses are still above the international best practice of 10 percent. At 96 percent of billings, NIGELEC’s collection ratio exceeds that of other African MICs and LICs, and collections have increased as the government is paying its bills.
Recovery of costs accompanies NIGELEC’s performance improvements. At $0.17 per kilowatt-hour (kWh), Niger’s consumers pay approximately $0.07 more for power than the average African country that derives its power from thermal-based resources (figure 14). With this level of tariff, NIGELEC’s revenues were enough to recover costs of production in 2009. Thus, at 100 percent cost recovery, NIGELEC performs better than utilities in other low- and middle-income countries (table 12).
10 Société Nigérienne d’Electricité (Niger Electricity Company).

NIGER’S INFRASTRUCTURE: A CONTINENTAL PERSPECTIVE
27
Improvements in NIGELEC’s performance resulted in lower hidden costs over time. The burden of hidden costs, as a percentage of revenues, dropped from 21 percent in 2007 to 10 percent in 2009 (figure 15a). Due to the increase in operating expenses, driven largely by the rising prices of oil, in 2008 NIGELEC was unable to recover costs and suffered losses of around 4 percent of its revenues. Relative to hidden costs in power utilities in West Africa, NIGELEC’s are modest (figure 15b).
Figure 14. High tariffs in Niger relative to other countries with thermal-based generation
Source: Briceño-Garmendia and Shkaratan (2010); AICD estimates. Note: Average effective tariff estimates are based on prices paid by domestic and nondomestic customers, weighted by their contributions to total consumption. DRC = Democratic Republic of Congo; CAR = Central African Republic.
Figure 15 Hidden costs for NIGELEC have decreased over time Percentage of revenues
a. NIGELEC’s hidden costs b. Hidden costs in West African utilities
Source: Derived from Briceño-Garmendia, Smits, and Foster (2009).
0
10
20
30
40
50
Libe
ria
Cha
d
Burk
ina
Faso
Cap
e Ve
rde
Sene
gal
Mal
i
Uga
nda
Nig
er
Keny
a
Con
go, R
ep
CAR
Rw
anda
Béni
n
Cot
e d'
Ivoi
re
Nam
ibia
Mad
agas
car
Cam
eroo
n
Gha
na
Bots
wan
a
Moz
ambi
que
Leso
tho
Tanz
ania
Sout
h Af
rica
Ethi
opia
Zim
babw
e
Nig
eria
Mal
awi
DR
C
Zam
bia
U.S.
cent
s per
kWh
0
5
10
15
20
25
Perc
enta
ge o
f rev
enue
s
Collection Inefficiencies Underpricing Losses
0
20
40
60
80
100
120
140
160
180
Perc
enta
ge o
f rev
enue
s
Collection Inefficiencies Underpricing Losses

NIGER’S INFRASTRUCTURE: A CONTINENTAL PERSPECTIVE
28
Table 12. Power indicators, benchmarked against select country groups
Niger
Low-income nonfragile countries
Middle-income countries
Access (national) % of population 8 33 50
Access (urban) % of population 41 86 101
Access (capital city) % of population 53 81 81
Access (rural) % of population 0 12 32
Installed generation capacity MW per million people 105 651 36,971
Installed generation MW per million people 8 20 799
Generation capacity, operational MW 92 917 35,917
Firms that find power a constraint for business % of firms 41 52 31
Firms with own generator % of firms 20 41 18
Power outages Days/year 5 10 6
Power outages % of sales 5.6* 6 2
Collection rate % of billing 96 92 91
System losses % generation 17 24 20
Cost recovery % of total costs 100 89 85
Revenue per unit US cents per kWh 19 14 13
Total hidden costs % revenue 10 69 0
US cents Niger (2006) Predominantly thermal
Other developing regions
Effective power tariff Residential at 100 kWh 18.17 10.27
5.0–10.0 Effective power tariff Commercial at 100 kWh 15.75 11.73
Effective power tariff Industrial at 50,000 kWh 18.17 11.39
Source: Fragile and nonfragile countries’ figures as of 2005, calculated using the AICD power database (www.infrastructureafrica.org/aicd/tools/data), which contains household data. For the CAR, national access is for 2008 (World Bank 2010a); power outages are for 2005 (Rosnes and Vennemo 2009); collection ratio is for 2010 (World Bank 2010b); cost-recovery ratio, system losses, and revenue per unit are for 2009 (NIGELEC 2009). Note: kWh = kilowatt-hour; MW = megawatts.
Challenges
Despite the fact that its cost-recovery rates are high at present, NIGELEC’s financial situation is threatened by the potential increases in Nigeria’s power costs since Niger relies highly on Nigeria for power. Under an agreement made between Niger and Nigeria dating back to 1977, Nigeria’s state electricity company supplies 90 percent of Niger’s electricity needs to NIGELEC, with a preferential pricing of $0.03 per kWh (World Bank 2007b); Nigeria offers Niger a $0.05 subsidy for every unit of power imported. In 2009 Nigeria subsidized an estimated $26.5 million (or around 3 percent of its revenues) for power imports. In the long run under a scenario where Nigeria increases the price of power to its recovery levels ($0.08 per kWh), cost recovery for NIGELEC will be jeopardized as current tariffs would be unable to recover total costs. Hidden costs would then increase to 40 percent of Niger’s revenue—four times what Niger encountered in 2009—as NIGELEC would be saddled with an additional $26.5 million in losses a year due to underpricing.

NIGER’S INFRASTRUCTURE: A CONTINENTAL PERSPECTIVE
29
Given the current high costs of domestic thermal production, NIGELEC would not be able to counteract potential increases in Nigeria’s power price. NIGELEC’s cost of production per kilowatt-hour is among the highest in West Africa (figure 16)—on average, it costs $0.16 to produce power in Niger, of which only $0.06 is attributable to generation (NIGELEC 2009). The generation cost is composed of the cost of power that is imported from Nigeria (around 87 percent of all power produced, at $0.03 per kWh), power produced using diesel (around 8 percent of all power produced, at an astronomical $0.30 per kWh), and power supplied domestically from SONICHAR (around 4.3 percent of all power produced, at $0.12 per kWh). The other non-generation costs, at $0.10, can be attributed to expenditures related to labor and new investments in transmission, among others.
The high costs of domestic thermal power are related to high diesel prices. As noted, domestically generated power is particularly expensive, at $0.30 per kWh. Between 2004 and 2008, prices of diesel in Niger were high relative to some of its neighbors, ranging from $0.94 to $1.11 per liter (table 13). The lack of oil resources within Niger forced reliance on imported fuel that was transported to Niger via road. Transporting fuel to Niger is an expensive proposition, as is moving along West African corridors in general (costs are more than $0.11 per tonne-km, among the highest in the world).
Niger’s high reliance on Nigerian imports is due to its limited power infrastructure, in particular its generation capacity. Niger’s installed capacity of 105 MW, primarily thermal, is only one-tenth of the capacity of comparable LICs. The installed capacity per million people is 8 MW, far below the 20 MW that is the average for LICs (table 12) and one of the smallest in the continent. Niger could look into developing its own domestic power sources, particularly hydropower. The Kandadji Dam—Niger’s first hydroelectric project –about to
Figure 16. Mid-range cost of power production in Niger
Source: Briceño-Garmendia and Shkaratan (2010); AICD estimates.
Table 13. High fuel prices escalate domestic power production costs
Country Power costs of
production ($/ kWh)
Diesel price ($/liter)
2004 2006 2008
Burkina Faso 0.39 94 112 133
Mali 0.39 90 104 110
Niger 0.16 94 111 97
Nigeria 0.15 45 66 113
Ghana 0.12 43 84 90
Côte d’Ivoire 0.11 95 106 120
Source: GTZ 2009. Note: kWh = kilowatt-hour.
0
5
10
15
20
25
30
35
40
45
Mal
i
Beni
n (S
BEE)
Togo
(CEB
)
Cap
e Ve
rde
Nig
er
Burk
ina
Faso
Gha
na
Sene
gal
Cot
e d'
Ivoi
re
Nig
eria
US ce
nts p
er K
wH
Operating Costs Capital Costs

NIGER’S INFRASTRUCTURE: A CONTINENTAL PERSPECTIVE
30
be constructed—will boost power domestically and has the potential of supplying additional power to Niger’s neighbors in West Africa.
Scarce power infrastructure translates into regular power shortages, constraining the ability of firms to do business. In 2009 Niger suffered 21 outages a month compared to 11 outages in an average Sub-Saharan African country, although the duration of power outages in Niger was lower than in other parts of the continent (2 hours each versus 6 hours in Sub-Saharan Africa). Over 41 percent of Niger’s firms reported that power shortage was a large burden on business activity. Hotels were even more affected, with 70 percent of them reporting that power was a binding constraint (World Bank 2006; World Bank 2009e). Firms in Niger obtain 20 percent of their power from their own generators, compared to 25 percent in Sub-Saharan Africa. Around 6 percent of the firms’ annual turnover was lost due to electricity shortages, no better than other LICs in Africa (World Bank 2006). It takes around 4 months11 on average for firms in Niger to obtain a permanent electricity connection, and costs to obtain a power connection are on average 43 times the income per capita (World Bank 2010a).
In particular, the future growth of mining is exposed to the scarcity of power infrastructure. The mining industry is responsible for over half of Niger’s export earnings, and its future is critically linked to the availability of adequate power supply for its activities. In recent years there has been rapid growth in the demand for uranium in the world market, in particular by China, to support its burgeoning electricity generation (EIU 2010). Since 1981 SONICHAR12 has mined coal for the production and supply of electricity to the towns of Arlit and Akouta, and the SOMAIR and COMINAK uranium mines. At the end of 2006, the estimated remaining reserves of SONICHAR (4,933,043 tonnes) were not enough for power generation to support the mining industry, which was growing steadily in the region (World Bank 2010b). Other coal reserves that could serve as sources of electricity have recently been found. The growth of the mining industry depends on expanded generation of power to support extractive industries activity.
As power infrastructure is scarce, access rates to electricity are low in Niger, particularly in rural areas. In 2005 national access to electricity was only 8 percent of the population, one-fourth the level in comparable peer countries. Around 41 percent of the urban population is electrified in Niger, and 86 percent in LICs. Practically no one in Niger’s rural areas is electrified, while 12 percent of rural dwellers are in peer countries (table 12). Since no significant new investments were made in the sector during the period 2000–05, NIGELEC’s investment needs remain substantial (World Bank 2007b).
Low access to electricity negatively impacts Niger’s environmental sustainability. Increasing population growth, at 3.4 percent a year, compounded with low levels of access to power has furthered reliance on traditional sources of energy for domestic consumption. Reliance on traditional fuels has placed undue stress on fuel wood and, consequently, forestry resources, leading to overexploitation of the natural forest cover. Only 5,000 hectares are replanted versus 100,000 hectares of forest cleared every year (African Development Bank 2005). Households’ combustion of biomass for domestic uses also increases carbon emissions.
11 Getting Electricity Database 2010. The number of days to obtain a permanent electricity connection captures the median duration that the electricity utility and experts indicate is necessary, in practice (rather than required by law), to complete a procedure. 12 Société Nigérienne de Charbon.

NIGER’S INFRASTRUCTURE: A CONTINENTAL PERSPECTIVE
31
Information and communication technologies
Achievements
Niger implemented a number of reforms to boost competition in the ICT sector. The liberalization of the mobile market allowed the licensing of a second operator in 2001, a third in 2004, and a fourth in 2008. The landline incumbent, SONITEL,13 was privatized in 2001. The government also awarded a global service license to France Telecom in 2007, allowing it to provide any ICT service (for example, fixed line, mobile, and Internet). ARM, one of the few multisector regulatory agencies in Africa,14 was established to supervise the telecommunications sector.
The country has benefited from a huge expansion in the coverage of and access to mobile communications. Whereas the global system for mobile communications (GSM) signal was almost nonexistent in 2000, around 50 percent of the population was covered by the GSM signal in 2008 (but this is still below the average, 63 percent, for comparable peer countries). Mobile penetration increased from less than 1 per 100 inhabitants in 2000 to 12.8 per 100 in 2008—half the average for LICs and one-tenth the average for MICs. Growing mobile penetration is starting to have an impact on the economic and social development of the country and helping to reduce poverty (Aker 2008). One study on the Nigerien grain sector found that the introduction of mobile phones has reduced price asymmetries, lowered search costs, enhanced grain transport efficiency, and contributed to poverty reduction.
Table 14. Benchmarking ICT indicators
Low-income
countries Niger
Middle-income
countries
Indicator Unit 2008 2000 2005 2008 2008
GSM coverage % of population under signal 63 —* 22 46 96
Mobile phone Subscribers/100 people 24 0.02* 2.4 12.8 95
International bandwidth Bits/capita 24.8 0.04 2.4 7 209.3
Internet Users/100 people 3.5 0.04 0.3 0.7 7.0
Landline Subscribers/100 people 0.8 0.2 0.2 0.4 9.2
Price of mobile basket $ per month 11.0 17.0 16.8 12.8 9.2
Price of fixed-line basket $ per month 10.4 10.8 12.4 11.8 11.4
Price of fixed broadband $ per month 287 — 131 52 57
Price of a call to [[the United States?]]
$ per minute 0.7 0.6 0.7 0.5 0.6
Price of an inter-Africa call $ per minute 0.9 — 0.4 0.7 1.1
Source: Adapted from ARM, Zain, and Orange reports, and World Bank ICT At-a-Glance. Note: Converted to $ using annual average exchange rates (2010 figures using 2009 exchange rate). Penetration figures derived from population data of the National Statistical Institute. GSM = global system for mobile communications. * The first digital GSM network launched in 2001. Prior to that, there was an analog mobile network. — = Not available.
13 Société Nigérienne des Télécommunications. SONITEL’s privatization took place in December 2001, with 51 percent of shares being awarded to a Libyan-Chinese consortium; the government of Niger maintained 49 percent ownership. 14 ARM is also responsible for transport, energy, and water supply.
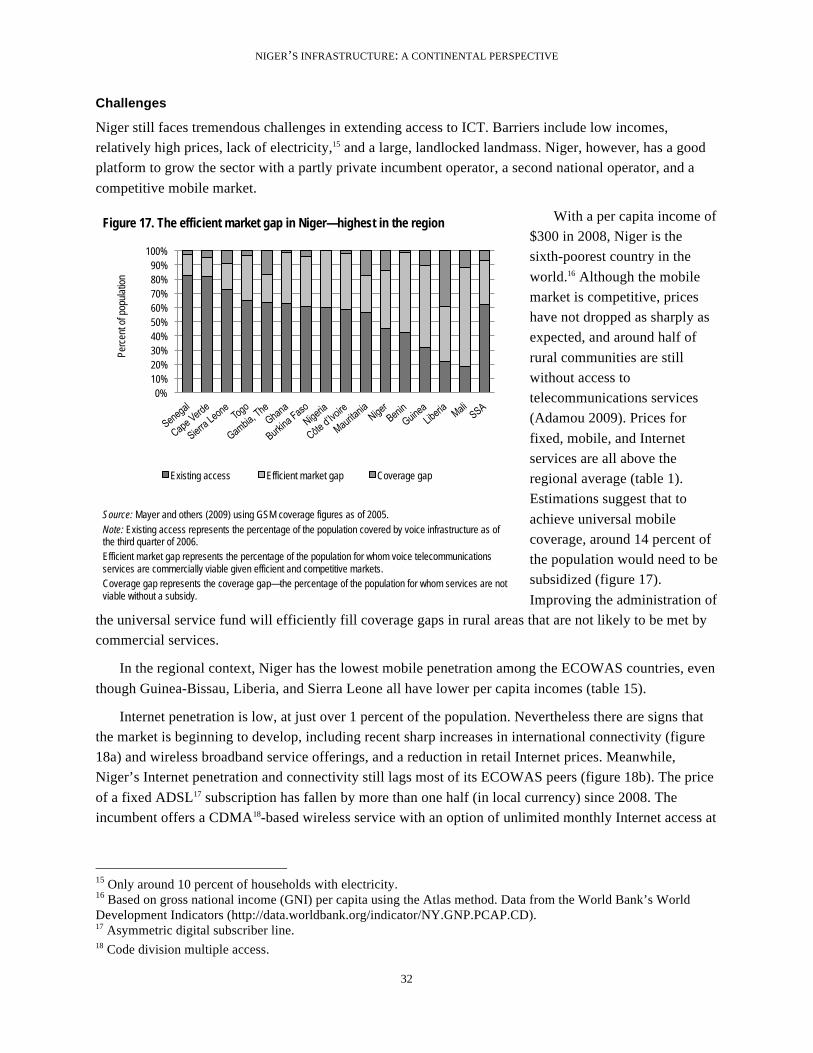
NIGER’S INFRASTRUCTURE: A CONTINENTAL PERSPECTIVE
32
Challenges
Niger still faces tremendous challenges in extending access to ICT. Barriers include low incomes, relatively high prices, lack of electricity,15 and a large, landlocked landmass. Niger, however, has a good platform to grow the sector with a partly private incumbent operator, a second national operator, and a competitive mobile market.
With a per capita income of $300 in 2008, Niger is the sixth-poorest country in the world.16 Although the mobile market is competitive, prices have not dropped as sharply as expected, and around half of rural communities are still without access to telecommunications services (Adamou 2009). Prices for fixed, mobile, and Internet services are all above the regional average (table 1). Estimations suggest that to achieve universal mobile coverage, around 14 percent of the population would need to be subsidized (figure 17). Improving the administration of
the universal service fund will efficiently fill coverage gaps in rural areas that are not likely to be met by commercial services.
In the regional context, Niger has the lowest mobile penetration among the ECOWAS countries, even though Guinea-Bissau, Liberia, and Sierra Leone all have lower per capita incomes (table 15).
Internet penetration is low, at just over 1 percent of the population. Nevertheless there are signs that the market is beginning to develop, including recent sharp increases in international connectivity (figure 18a) and wireless broadband service offerings, and a reduction in retail Internet prices. Meanwhile, Niger’s Internet penetration and connectivity still lags most of its ECOWAS peers (figure 18b). The price of a fixed ADSL17 subscription has fallen by more than one half (in local currency) since 2008. The incumbent offers a CDMA18-based wireless service with an option of unlimited monthly Internet access at
15 Only around 10 percent of households with electricity.
16 Based on gross national income (GNI) per capita using the Atlas method. Data from the World Bank’s World Development Indicators (http://data.worldbank.org/indicator/NY.GNP.PCAP.CD). 17 Asymmetric digital subscriber line. 18 Code division multiple access.
Figure 17. The efficient market gap in Niger—highest in the region
Source: Mayer and others (2009) using GSM coverage figures as of 2005.
Note: Existing access represents the percentage of the population covered by voice infrastructure as of the third quarter of 2006. Efficient market gap represents the percentage of the population for whom voice telecommunications services are commercially viable given efficient and competitive markets. Coverage gap represents the coverage gap—the percentage of the population for whom services are not viable without a subsidy.
0% 10% 20% 30% 40% 50% 60% 70% 80% 90%
100%
Perc
ent o
f pop
ulat
ion
Existing access Efficient market gap Coverage gap

NIGER’S INFRASTRUCTURE: A CONTINENTAL PERSPECTIVE
33
around $30 per month. France Telecom also offers WiMAX19 Internet access through its Orange subsidiary.
Table 15. Mobile penetration in West African countries
Subscribers per 100 people
Country 2005 2006 2007 2008 2009 Annual average
growth (%)
Benin 8.4 12.8 23.1 44.7 46.7 54
Burkina Faso 5.3 6.9 11.7 17.9 25.3 48
Côte d’Ivoire 12.3 20.2 36.6 45.4 54.4 45
Cape Verde 17.2 22.5 31.0 55.6 68.1 41
Ghana 11.5 22.6 32.4 51.4 63.0 53
Gambia, The 15.4 25.9 33.4 51.3 59.6 40
Guinea-Bissau 6.3 9.0 19.2 23.9 29.5 47
Liberia 3.2 11.9 15.0 19.0 26.3 70
Mali 7.6 12.6 20.5 27.0 32.3 43
Mauritania 22.9 34.8 48.3 62.7 75.0 35
Niger 2.4 4.1 6.7 11.6 18.4 67
Nigeria 12.7 23.1 27.8 42.6 48.1 40
Senegal 16.3 27.3 36.8 43.1 53.8 35
Sierra Leone 4.6 5.0 13.2 16.2 20.0 44
Togo 8.6 13.7 22.4 27.7 48
Simple average 10.3 16.8 25.2 36.0 44.3 44 Source: AICD.
Providing a high-speed fiber-optic backbone for the country remains a challenge. Domestic backbone connectivity in the western part of the country is partly served by fiber-optic cable, but most of Niger is linked by microwave or domestic satellite connections. Despite its landlocked situation, Niger has access to an international submarine cable via Benin and Burkina Faso. Currently connections are to the South Atlantic 3 (SAT-3) cable, but this will expand as additional cables are laid along the west coast of Africa over the coming years. One potential bottleneck is of the incumbent SONITEL controlling the fiber backbone. It is important to achieve open access by either ensuring that wholesale access pricing is competitive or by encouraging other operators to construct their own fiber networks. The regulator needs to ensure that wholesale access to fiber-optic connectivity is priced competitively.
19 Worldwide interoperability for microwave access.

NIGER’S INFRASTRUCTURE: A CONTINENTAL PERSPECTIVE
34
Figure 18. Niger’s Internet market compares poorly with other ECOWAS countries
a. Internet service trends, Niger b. Internet service, ECOWAS, 2008
Source: World Bank, including AICD analysis. Note: ECOWAS = Economic Community of West African States.
Financing Niger’s infrastructure
To meet its most pressing infrastructure needs and catch up with developing countries in other parts of the world, Niger needs to expand its infrastructure assets in key areas (table 16). The targets outlined in table 16 are purely illustrative, but they represent a level of aspiration that is not unreasonable. Developed in a standardized way across African countries, they allow for cross-country comparisons of the affordability of meeting targets that can be modified or delayed as needed to achieve financial balance.
0
1
2
3
4
5
6
7
8
0.0
0.1
0.2
0.3
0.4
0.5
0.6
0.7
0.8 20
00
2001
2002
2003
2004
2005
2006
2007
2008
Inte
rnat
iona
l inte
rnet
ban
dwid
th
Inte
rnet
use
rs
Internet users (per 100 people)
International Internet bandwidth (bits per second per person)
0
50
100
150
200
250
300
350
0
2
4
6
8
10
12
14
Sier
ra L
eone
Li
beria
N
iger
G
uine
a-Bi
ssau
M
ali
Burk
ina
Faso
M
aurit
ania
G
ambi
a Se
nega
l Be
nin
Gha
na
Côt
e d'
Ivoi
re
Cap
e Ve
rde
Togo
N
iger
ia
Inte
rnat
iona
l inte
rnet
ban
dwid
th
Inte
rnet
use
rs
Internet users (per 100 people) International Internet bandwidth (bits per second per person)
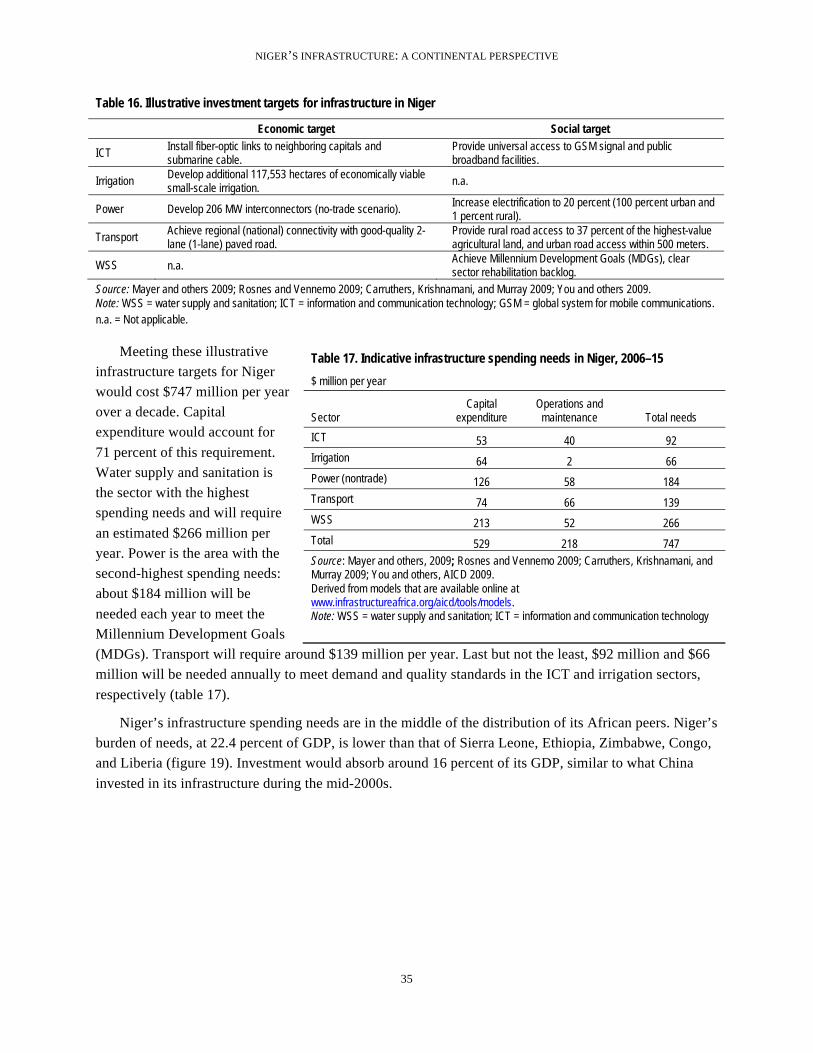
NIGER’S INFRASTRUCTURE: A CONTINENTAL PERSPECTIVE
35
Table 16. Illustrative investment targets for infrastructure in Niger
Economic target Social target
ICT Install fiber-optic links to neighboring capitals and submarine cable.
Provide universal access to GSM signal and public broadband facilities.
Irrigation Develop additional 117,553 hectares of economically viable small-scale irrigation.
n.a.
Power Develop 206 MW interconnectors (no-trade scenario). Increase electrification to 20 percent (100 percent urban and 1 percent rural).
Transport Achieve regional (national) connectivity with good-quality 2-lane (1-lane) paved road.
Provide rural road access to 37 percent of the highest-value agricultural land, and urban road access within 500 meters.
WSS n.a. Achieve Millennium Development Goals (MDGs), clear sector rehabilitation backlog.
Source: Mayer and others 2009; Rosnes and Vennemo 2009; Carruthers, Krishnamani, and Murray 2009; You and others 2009. Note: WSS = water supply and sanitation; ICT = information and communication technology; GSM = global system for mobile communications. n.a. = Not applicable.
Meeting these illustrative infrastructure targets for Niger would cost $747 million per year over a decade. Capital expenditure would account for 71 percent of this requirement. Water supply and sanitation is the sector with the highest spending needs and will require an estimated $266 million per year. Power is the area with the second-highest spending needs: about $184 million will be needed each year to meet the Millennium Development Goals (MDGs). Transport will require around $139 million per year. Last but not the least, $92 million and $66 million will be needed annually to meet demand and quality standards in the ICT and irrigation sectors, respectively (table 17).
Niger’s infrastructure spending needs are in the middle of the distribution of its African peers. Niger’s burden of needs, at 22.4 percent of GDP, is lower than that of Sierra Leone, Ethiopia, Zimbabwe, Congo, and Liberia (figure 19). Investment would absorb around 16 percent of its GDP, similar to what China invested in its infrastructure during the mid-2000s.
Table 17. Indicative infrastructure spending needs in Niger, 2006–15 $ million per year
Sector Capital
expenditure Operations and
maintenance Total needs
ICT 53 40 92
Irrigation 64 2 66
Power (nontrade) 126 58 184
Transport 74 66 139
WSS 213 52 266
Total 529 218 747
Source: Mayer and others, 2009; Rosnes and Vennemo 2009; Carruthers, Krishnamani, and Murray 2009; You and others, AICD 2009. Derived from models that are available online at www.infrastructureafrica.org/aicd/tools/models. Note: WSS = water supply and sanitation; ICT = information and communication technology
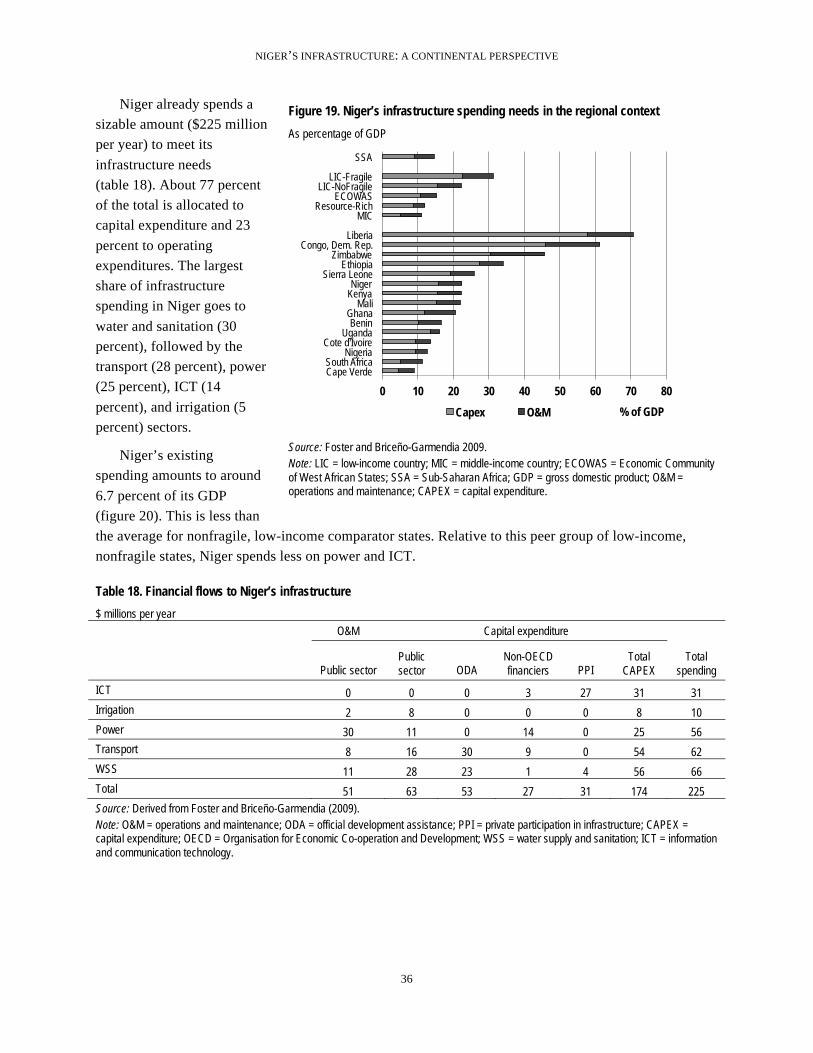
NIGER’S INFRASTRUCTURE: A CONTINENTAL PERSPECTIVE
36
Niger already spends a sizable amount ($225 million per year) to meet its infrastructure needs (table 18). About 77 percent of the total is allocated to capital expenditure and 23 percent to operating expenditures. The largest share of infrastructure spending in Niger goes to water and sanitation (30 percent), followed by the transport (28 percent), power (25 percent), ICT (14 percent), and irrigation (5 percent) sectors.
Niger’s existing spending amounts to around 6.7 percent of its GDP (figure 20). This is less than the average for nonfragile, low-income comparator states. Relative to this peer group of low-income, nonfragile states, Niger spends less on power and ICT.
Table 18. Financial flows to Niger’s infrastructure $ millions per year
O&M Capital expenditure
Total spending Public sector
Public sector ODA
Non-OECD financiers PPI
Total CAPEX
ICT 0 0 0 3 27 31 31
Irrigation 2 8 0 0 0 8 10
Power 30 11 0 14 0 25 56
Transport 8 16 30 9 0 54 62
WSS 11 28 23 1 4 56 66
Total 51 63 53 27 31 174 225
Source: Derived from Foster and Briceño-Garmendia (2009). Note: O&M = operations and maintenance; ODA = official development assistance; PPI = private participation in infrastructure; CAPEX = capital expenditure; OECD = Organisation for Economic Co-operation and Development; WSS = water supply and sanitation; ICT = information and communication technology.
Figure 19. Niger’s infrastructure spending needs in the regional context As percentage of GDP
Source: Foster and Briceño-Garmendia 2009. Note: LIC = low-income country; MIC = middle-income country; ECOWAS = Economic Community of West African States; SSA = Sub-Saharan Africa; GDP = gross domestic product; O&M = operations and maintenance; CAPEX = capital expenditure.
0 10 20 30 40 50 60 70 80 Cape Verde South Africa
Nigeria Cote d'Ivoire
Uganda Benin
Ghana Mali
Kenya Niger
Sierra Leone Ethiopia
Zimbabwe Congo, Dem. Rep.
Liberia
MIC Resource-Rich
ECOWAS LIC-NoFragile
LIC-Fragile
SSA
% of GDP Capex O&M

NIGER’S INFRASTRUCTURE: A CONTINENTAL PERSPECTIVE
37
Figure 20. Niger’s existing infrastructure spending is relatively low As percentage of GDP
Source: Derived from Foster and Briceño-Garmendia (2009). Note: LIC = low-income country; MIC = middle-income country; ECOWAS = Economic Community of West African States; SSA = Sub-Saharan Africa; GDP = gross domestic product; O&M= operations and maintenance; CAPEX = capital expenditure.
Whereas operating expenditures are entirely covered from budgetary resources and payments by infrastructure users, capital expenditures are financed by diverse sources (figure 18). About 36 percent of capital expenditure funding comes from the federal and state governments, as well as state-owned enterprises (SOEs). Niger relies heavily on official development assistance (ODA), which accounts for another 30 percent of total capital spending. Private financing plays a substantial and important role in financing capital infrastructure investments in Niger, accounting for about 18 percent of total capital spending. Non-OECD financiers account for around 16 percent of capital spending. ODA in Niger benefits mainly the transport and water sectors, but not the power sector (figure 21).
0 5 10 15 20 Congo, Dem. Rep.
Cote d'Ivoire Nigeria
Niger South Africa
Uganda Sierra Leone
Mali Benin
Ghana Kenya
Ethiopia Cape Verde
Liberia Zimbabwe
Resource-Rich ECOWAS
MIC LIC-Fragile
LIC-NoFragile
SSA
% of GDP
Capex O&M
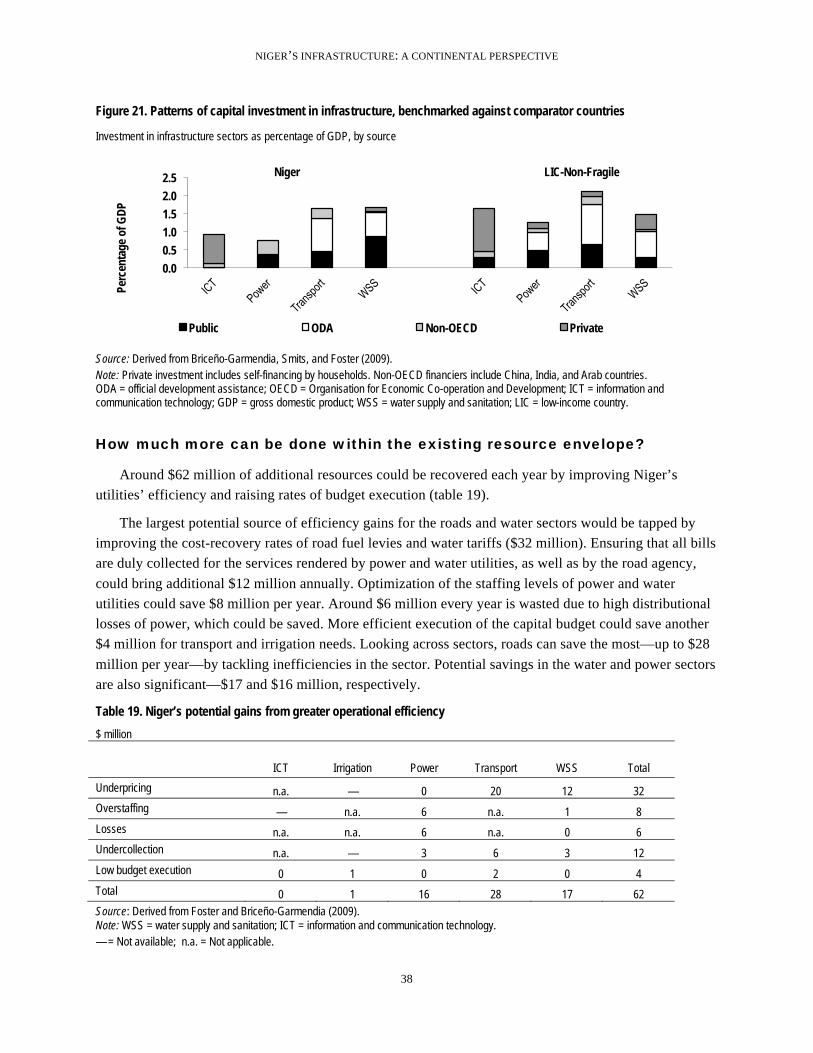
NIGER’S INFRASTRUCTURE: A CONTINENTAL PERSPECTIVE
38
Figure 21. Patterns of capital investment in infrastructure, benchmarked against comparator countries
Investment in infrastructure sectors as percentage of GDP, by source
Source: Derived from Briceño-Garmendia, Smits, and Foster (2009). Note: Private investment includes self-financing by households. Non-OECD financiers include China, India, and Arab countries. ODA = official development assistance; OECD = Organisation for Economic Co-operation and Development; ICT = information and communication technology; GDP = gross domestic product; WSS = water supply and sanitation; LIC = low-income country.
How much more can be done within the existing resource envelope?
Around $62 million of additional resources could be recovered each year by improving Niger’s utilities’ efficiency and raising rates of budget execution (table 19).
The largest potential source of efficiency gains for the roads and water sectors would be tapped by improving the cost-recovery rates of road fuel levies and water tariffs ($32 million). Ensuring that all bills are duly collected for the services rendered by power and water utilities, as well as by the road agency, could bring additional $12 million annually. Optimization of the staffing levels of power and water utilities could save $8 million per year. Around $6 million every year is wasted due to high distributional losses of power, which could be saved. More efficient execution of the capital budget could save another $4 million for transport and irrigation needs. Looking across sectors, roads can save the most—up to $28 million per year—by tackling inefficiencies in the sector. Potential savings in the water and power sectors are also significant—$17 and $16 million, respectively.
Table 19. Niger’s potential gains from greater operational efficiency $ million
ICT Irrigation Power Transport WSS Total
Underpricing n.a. — 0 20 12 32
Overstaffing — n.a. 6 n.a. 1 8
Losses n.a. n.a. 6 n.a. 0 6
Undercollection n.a. — 3 6 3 12
Low budget execution 0 1 0 2 0 4
Total 0 1 16 28 17 62
Source: Derived from Foster and Briceño-Garmendia (2009). Note: WSS = water supply and sanitation; ICT = information and communication technology. — = Not available; n.a. = Not applicable.
Niger LIC-Non-Fragile
0.0 0.5 1.0 1.5 2.0 2.5
Perc
enta
ge o
f GDP
Public ODA Non-OECD Private

NIGER’S INFRASTRUCTURE: A CONTINENTAL PERSPECTIVE
39
In the water sector, the average tariff
charged by SPEN, Niger’s water utility, stood at $0.55 per m3 as of 2009, versus the estimated $0.82 per m3 average cost-recovery rate. The consequent macroeconomic burden of undercharging for water services, at 0.23 percent of GDP, is slightly lower than in other nonfragile LICs. As the tariffs currently charged by NIGELEC are enough to cover production costs, which are highly subsidized by Nigeria, at present there does not appear to be a cost-recovery problem in the Nigerien power sector (figure 22).
Because of inequitable access to power and water services in Niger, subsidized tariffs are highly regressive. Close to 100 percent of those that have electricity or piped water connections belong to the top 20 percent of the expenditure distribution; such connections are nonexistent for poorer households (figure 23). Only the richest quintile has access to piped water; most of the poorest quintiles still rely on wells and boreholes for water supply.
Figure 23. Consumption of infrastructure services in Niger varies by income quintile
a. Mode of water supply, by income quintile b. Prevalence of connection to power grid among population, by income quintile
Source: Banerjee and others 2009. Note: Q1—first budget quintile, Q2—second budget quintile, and so on.
The inequitable distribution of water supply and electricity connections virtually guarantees that any subsidy to these services will be extremely regressive (figure 24). With a measure of distributional incidence of 0.27, Niger has one of the most regressive systems in Sub-Saharan Africa.
How expensive would utility bills become if cost-reflective tariffs were applied? With a cost-recovery tariff of $0.16 per kWh and a monthly subsistence consumption of 50 kWh for power and 10 m3 per
0%
20%
40%
60%
80%
100%
120%
Q1 Q2 Q3 Q4 Q5
% p
opul
atio
n
Piped water Stand posts
Wells/boreholes Surface water
0%
5%
10%
15%
20%
25%
30%
35%
40%
Q1 Q2 Q3 Q4 Q5
% p
opul
atio
n
Power
Figure 22. Underpricing of water in Niger is comparatively less burdensome Financial burden of underpricing, as percentage of GDP
Source: Derived from Briceño-Garmendia, Smits, and Foster (2009). Note: GDP = gross domestic product; LIC = low-income country.
0.0 0.2
1.3
0.3
0.0
0.5
1.0
1.5
Power Water
Perc
enat
age o
f GDP
Niger LIC-NoFragile
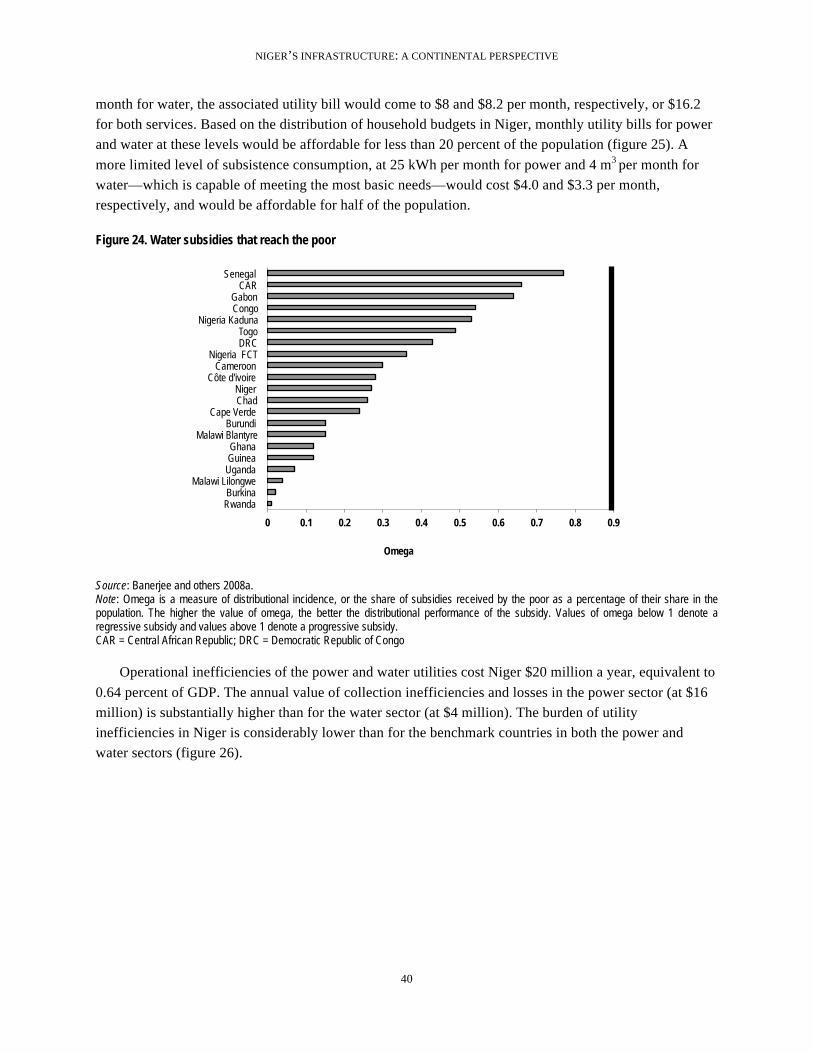
NIGER’S INFRASTRUCTURE: A CONTINENTAL PERSPECTIVE
40
month for water, the associated utility bill would come to $8 and $8.2 per month, respectively, or $16.2 for both services. Based on the distribution of household budgets in Niger, monthly utility bills for power and water at these levels would be affordable for less than 20 percent of the population (figure 25). A more limited level of subsistence consumption, at 25 kWh per month for power and 4 m3 per month for water—which is capable of meeting the most basic needs—would cost $4.0 and $3.3 per month, respectively, and would be affordable for half of the population.
Figure 24. Water subsidies that reach the poor
Source: Banerjee and others 2008a. Note: Omega is a measure of distributional incidence, or the share of subsidies received by the poor as a percentage of their share in the population. The higher the value of omega, the better the distributional performance of the subsidy. Values of omega below 1 denote a regressive subsidy and values above 1 denote a progressive subsidy. CAR = Central African Republic; DRC = Democratic Republic of Congo
Operational inefficiencies of the power and water utilities cost Niger $20 million a year, equivalent to 0.64 percent of GDP. The annual value of collection inefficiencies and losses in the power sector (at $16 million) is substantially higher than for the water sector (at $4 million). The burden of utility inefficiencies in Niger is considerably lower than for the benchmark countries in both the power and water sectors (figure 26).
0 0.1 0.2 0.3 0.4 0.5 0.6 0.7 0.8 0.9 Rwanda Burkina
Malawi Lilongwe Uganda Guinea Ghana
Malawi Blantyre Burundi
Cape Verde Chad Niger
Côte d'ivoire Cameroon
Nigeria FCT DRC Togo
Nigeria Kaduna Congo Gabon
CAR Senegal
Omega
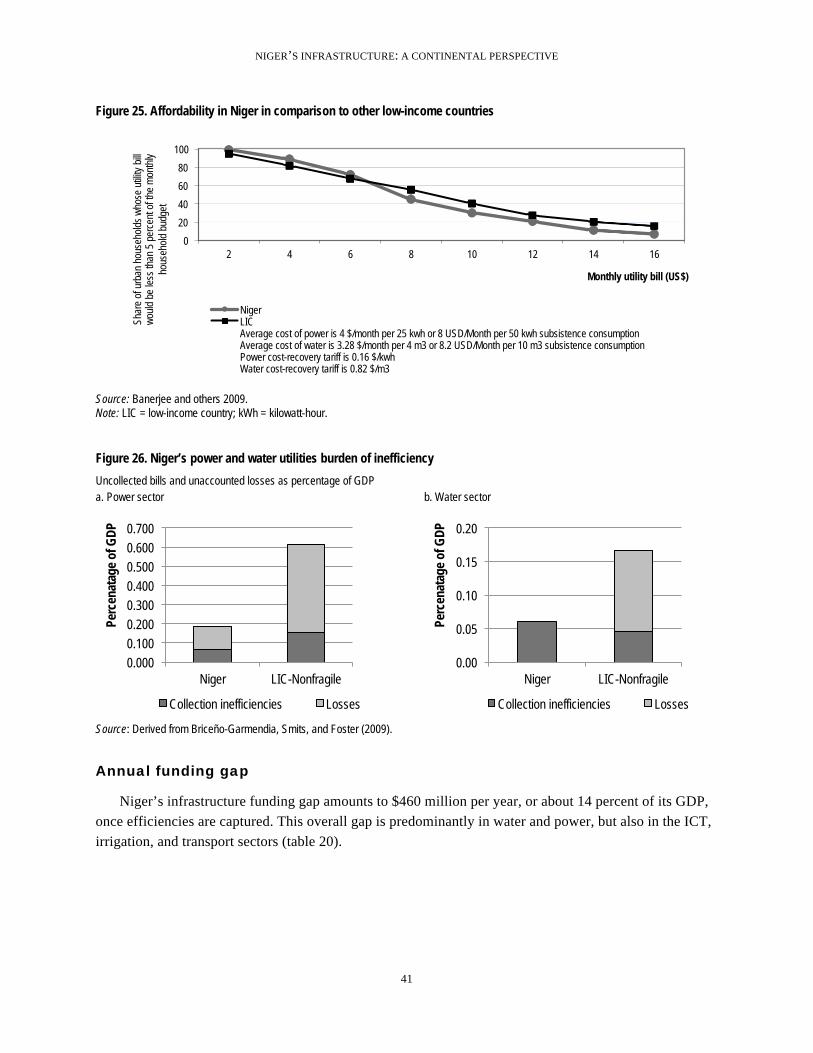
NIGER’S INFRASTRUCTURE: A CONTINENTAL PERSPECTIVE
41
Figure 25. Affordability in Niger in comparison to other low-income countries
Source: Banerjee and others 2009. Note: LIC = low-income country; kWh = kilowatt-hour. Figure 26. Niger’s power and water utilities burden of inefficiency Uncollected bills and unaccounted losses as percentage of GDP a. Power sector b. Water sector
Source: Derived from Briceño-Garmendia, Smits, and Foster (2009).
Annual funding gap
Niger’s infrastructure funding gap amounts to $460 million per year, or about 14 percent of its GDP, once efficiencies are captured. This overall gap is predominantly in water and power, but also in the ICT, irrigation, and transport sectors (table 20).
0
20
40
60
80
100
2 4 6 8 10 12 14 16
Shar
e of
urb
an h
ouse
hold
s w
hose
util
ity b
ill w
ould
be
less
than
5 p
erce
nt o
f the
mon
thly
ho
useh
old
budg
et
Monthly utility bill (US$)
Niger LIC Average cost of power is 4 $/month per 25 kwh or 8 USD/Month per 50 kwh subsistence consumption Average cost of water is 3.28 $/month per 4 m3 or 8.2 USD/Month per 10 m3 subsistence consumption Power cost-recovery tariff is 0.16 $/kwh Water cost-recovery tariff is 0.82 $/m3
0.000
0.100
0.200
0.300
0.400
0.500
0.600
0.700
Niger LIC-Nonfragile
Perc
enat
age o
f GDP
Collection inefficiencies Losses
0.00
0.05
0.10
0.15
0.20
Niger LIC-Nonfragile
Perc
enat
age o
f GDP
Collection inefficiencies Losses

NIGER’S INFRASTRUCTURE: A CONTINENTAL PERSPECTIVE
42
Table 20. Funding gaps by sector $ millions
ICT Irrigation Power Transport WSS Total
Spending needs (92) (66) (184) (139) (266) (747)
Existing spending 31 10 56 62 66 225
Efficiency gains 0 1 16 28 17 62
Funding gap (62) (54) (112) (50) (183) (460) Source: Derived from Foster and Briceño-Garmendia (2009). Note: Potential overspending across sectors is not included in the calculation of the funding gap, because it cannot be assumed that it would be applied toward other infrastructure sectors. Total assumes complete fungibility across sectors. WSS = water supply and sanitation; ICT = information and communication technology.
What else can be done?
The funding gap can be addressed by raising additional finance, adopting lower-cost technologies, or extending the time horizon.
In the case of Niger, there may be realistic prospects for increasing the flow of resources from alternative sources, such as private players. When compared to other African peers, Niger has failed to attract a significant amount of private finance for infrastructure (figure 27). Over the early 2000s, Niger captured private investment commitments worth only 0.8 percent of its GDP, predominantly in the ICT sector. Countries such as the Democratic Republic of Congo, Liberia, Nigeria, Uganda, Kenya, and Senegal have all captured between 1.8 and 2.5 percent of their GDP. For instance, as the ICT market is still growing, there is plenty of room for private sector companies to invest in Niger. On the other hand, attracting private sector investment into Niger’s infrastructure sectors might be constrained by low purchasing power.
Figure 27. Niger has captured relatively low private sector participation Average per year between 2002 and 2007
Source: AICD calculations. Note: GDP = gross domestic product; ICT = information and communications technology.
0
0.5
1
1.5
2
2.5
3
3.5
Gui
nea-
Biss
au
Sene
gal
Keny
a U
gand
a N
iger
ia
Libe
ria
DR
C C
ongo
, Dem
. Si
erra
Leo
ne
Moz
ambi
que
Tanz
ania
R
wan
da
Gha
na
Zam
bia
Burk
ina
Faso
M
ali
Beni
n Se
yche
lles
Sout
h Af
rica
Cam
eroo
n N
iger
Le
soth
o G
abon
M
adag
asca
r G
uine
a M
alaw
i M
aurit
ania
C
ote
d'Iv
oire
Zi
mba
bwe
Ango
la
Buru
ndi
Con
go, R
ep.
Mau
ritiu
s C
had
Bots
wan
a To
go
Swaz
iland
C
entra
l Afri
can
Equa
toria
l Gui
nea
Nam
ibia
Perc
enta
ge o
f GDP
Water Transport Power ICT

NIGER’S INFRASTRUCTURE: A CONTINENTAL PERSPECTIVE
43
Adopting lower-cost technologies could substantially reduce the cost of meeting the posited infrastructure targets, and reduce the funding gap. If Niger could strategically expand its capacity by installing hydropower plants, this would reduce the resource deficit of the power sector, lowering power needs from $184 million to $76 million per year. As discussed in the power section, Niger could potentially reduce its dependence on Nigeria’s power imports by means of expanding its own hydroelectric capacity in the Kandadji, Dyondyonga, and Gambou I hydroplants. Meeting the MDGs for water supply and sanitation with lower-cost technologies—such as standposts, boreholes, and improved latrines—could reduce the associated price tag from $266 million to $203 million each year. Similarly, meeting transport connectivity standards using lower-cost road-surfacing technologies—such as single-surface treatments—could reduce the associated price tag from $139 million to $91 million. The overall savings from these measures would amount to $219 million dollars, which would reduce the existing total funding gap by almost a half, underscoring the importance of technology choices (table 21).
Finally, if all else fails, it may be necessary to extend the time horizon for meeting the infrastructure targets beyond the illustrative 10-year period considered here. Simulations suggest that even if Niger is unable to raise additional finance, if at least inefficiencies can be addressed, the identified infrastructure targets could be achieved within a 27-year horizon. But without stemming inefficiencies, the existing resource envelope would not suffice to meet infrastructure targets in the medium term.
Table 21. Savings from innovation $ millions Before
innovation After
innovation Savings
Savings as % of sector funding gap
Savings as % of total funding gap
Power expansion of generation capacity 184 76 108 96 23
WSS low-cost technology 266 203 63 34 14
Roads low-surface treatment 139 91 49 98 11
Total 589 370 219 48 48 Source: Author’s own calculations. Note: WSS = water supply and sanitation.

NIGER’S INFRASTRUCTURE: A CONTINENTAL PERSPECTIVE
44
References and bibliography
This country report draws upon a wide range of papers, databases, models, and maps that were created as part of the Africa Infrastructure Country Diagnostic. All of these can be downloaded from the project website: http://www.infrastructureafrica.org. For papers go to the document page (http://www.infrastructureafrica.org/aicd/documents), for databases to the data page (http://www.infrastructureafrica.org/aicd/tools/data), for models to the models page (http://www.infrastructureafrica.org/aicd/tools/models), and for maps to the map page (http://www.infrastructureafrica.org/aicd/tools/maps ). The references for the papers that were used to compile this country report are provided in the table below.
General
AICD (Africa Infrastructure Country Diagnostic). 2010. ECOWAS’s Infrastructure: A Regional Perspective. http://www.infrastructureafrica.org.
Banerjee, Sudeshna, Quentin Wodon, Amadou Diallo, Taras Pushak, Helal Uddin, Clarence Tsimpo, and Vivien Foster. 2009. “Access, Affordability, and Alternatives: Modern Infrastructure Services in Africa.” AICD Background Paper 2, Africa Region, World Bank, Washington, DC.
Foster, Vivien, and Cecilia Briceño-Garmendia, eds. 2009. Africa’s Infrastructure: A Time for
Transformation. Paris and Washington, DC: Agence Française de Développement and World Bank. http://www.infrastructureafrica.org
Measure DHS. 2006. Demographic and Health Survey Niger, 2006. http://www.measuredhs.com.
OECD (Organisation for Economic Co-operation and Development). 2007. Niger Country Profile.
African Economic Outlook. Paris.
World Bank. 2007a. Implementation Completion and Results Report (IDA-31300 IDA-3130A) on a Credit
in the Amount of SDR 14.0 Million ($ 18.6 million equivalent) to the Republic of Niger for a
Privatization and Regulatory Reform Technical Assistance Project. Report No: ICR000042, World Bank, Washington, June 29.
———. 2008a. International Development Association Country Assistance Strategy for the Republic of
Niger for the period FYOS–FY11. Report No. 43443-NE, World Bank, Washington, DC, May 2.
———. 2008b. Doing Business: Country Profile for Niger. Washington, DC: World Bank.
———. 2009a. Niger: Putting the Economy on a Path of Higher Growth. Series IDA at Work. Washington, DC: World Bank.
———. 2009b. Enterprise Survey. Washington, DC: World Bank.
———. 2011. Doing Business 2011: Making a Difference for Entrepreneurs. Washington, DC.
NIGER’S INFRASTRUCTURE: A CONTINENTAL PERSPECTIVE
45
Financing
Briceño-Garmendia, Cecilia, Karlis Smits, and Vivien Foster. 2009. “Financing Public Infrastructure in Sub-Saharan Africa: Patterns and Emerging Issues.” AICD Background Paper 15, Africa Region, World Bank, Washington, DC.
Growth
Calderón, César. 2009. “Infrastructure and Growth in Africa.” Policy Research Working Paper 4914, World Bank, Washington, DC.
Escribano, Alvaro, J. Luis Guasch, and Jorge Pena. 2010. “Assessing the Impact of Infrastructure Quality on Firm Productivity in Africa.” Policy Research Working Paper 5191, World Bank, Washington, DC.
Yepes, Tito, Justin Pierce, and Vivien Foster. 2009. “Making Sense of Africa’s Infrastructure Endowment: A Benchmarking Approach.” Policy Research Working Paper 4912, World Bank, Washington, DC.
Information and communication technologies
Adamou, M. Iro. 2009. “Réforme du secteur des télécommunications en Afrique: Cas d’échec de la privatisation de l’opérateur historique au Niger.” http://www.apc.org/fr/system/files/CICEWA_Niger_20090911.pdf.
Aker, Jenny C. 2008. “Can You Hear Me Now? How Cell Phones are Transforming Markets in Sub-Saharan Africa.” Center for Global Development Notes. http://www.cgdev.org/content/publications/detail/894409.
Ampah, Mavis, Daniel Camos, Cecilia Briceño-Garmendia, Michael Minges, Maria Shkratan, and Mark Williams. 2009. “Information and Communications Technology in Sub-Saharan Africa: A Sector Review.” AICD Background Paper 10, Africa Region, World Bank, Washington, DC.
Mayer, Rebecca, Ken Figueredo, Mike Jensen, Tim Kelly, Richard Green, and Alvaro Federico Barra. 2009. “Connecting the Continent: Costing the Needs for Spending on ICT Infrastructure in Africa.” AICD Background Paper 3, Africa Region, World Bank, Washington, DC.
Irrigation
World Bank. 2008. Développement de l’Irrigation au Niger: Diagnostic et Options Stratégiques-Revue
Sectorielle de l’Irrigation. Washington, DC.
FAO (Food and Agriculture Organization). 2004. Aquastata: Niger Country profile. http://www.fao.org/nr/water/aquastat/main/index.stm.
Svendsen, Mark, Mandy Ewing, and Siwa Msangi. 2008. “Watermarks: Indicators of Irrigation Sector Performance in Africa.” AICD Background Paper 4, Africa Region, World Bank, Washington, DC.

NIGER’S INFRASTRUCTURE: A CONTINENTAL PERSPECTIVE
46
You, L. 2008. Irrigation Investment Needs in Sub-Saharan Africa. Appendix 2 Country Results. Washington, DC: World Bank.
You, L., C. Ringler, G. Nelson, U. Wood-Sichra, R. Robertson, S. Wood, G. Zhe, T. Zhu, and Y. Sun. 2009. “Torrents and Trickles: Irrigation Spending Needs in Africa.” AICD Background Paper 9, Africa Region, World Bank, Washington, DC.
World Bank. 2009c. “Niger Agro-Pastoral Export and Market Development Project.” Project Information Document (PID), World Bank, Washington, DC, March 26.
———. 2009d. Development de l’irrigation au Niger: Diagnostic et Options Strategiques. Revue
Sectorielle de l’irrigation. Washington, DC: World Bank.
Power
AfDB (African Development Bank). 2005. “Results-Based Country Strategy Paper—Republic of Niger. 2005–2009.” July 2005. http://www.afdb.org/fileadmin/uploads/afdb/Documents/Project-and-Operations/Niger_Eng.pdf.
Briceño-Garmendia, Cecilia, and Maria Shkaratan. 2010. “Power Tariffs: Caught between Cost Recovery and Affordability.” First draft, February 2010.
Eberhard, Anton, Vivien Foster, Cecilia Briceño-Garmendia, Fatimata Ouedraogo, Daniel Camos, and Maria Shkaratan. 2008. “Underpowered: The State of the Power Sector in Sub-Saharan Africa.” AICD Background Paper 6, Africa Region, World Bank, Washington, DC.
EIU (Economic Intelligence Unit). 2010. Niger Country Report. November 2010 Report. London: EIU.
Foster, Vivien, and Jevgenijs Steinbuks. 2009. “Paying the Price for Unreliable Power Supplies: In-Hoe Generation of Electricity by Firms in Africa.” Policy Research Working Paper 4913, World Bank, Washington, DC.
GTZ (Deutsche Gesellschaft für Internationale Zammenarbeit). 2009. International Fuel Prices 2009. 6th ed. Eschborn, Germany: GTZ.
NIGELEC (Societe Nigerienne d’Electricite). 2009. Analyse des Etats Financiers Exercice 2009. Niamey: NIGELEC.
Rosnes, Orvika, and Haakon Vennemo. 2009. “Powering Up: Costing Power Infrastructure Spending Needs in Sub-Saharan Africa.” AICD Background Paper 5, Africa Region, World Bank, Washington, DC.
World Bank. 2006. “Niger Investment Climate Summary 2006.” Africa Region Note No. 30, World Bank, Washington, DC, August 2006.
———. 2007b. Implementation Completion and Results Report (IDA-31300 IDA-3130A) on a Credit in
the Amount of SDR 14.0 Million ($ 18.6 Million Equivalent) to the Republic of Niger for a
Privatization and Regulatory Reform Technical Assistance Project. Report No: ICR0000425, World Bank, Washington, DC, June 29.

NIGER’S INFRASTRUCTURE: A CONTINENTAL PERSPECTIVE
47
———. 2009e. “Niger Enterprise Surveys 2009”. Washington, DC: World Bank. http://www.enterprisesurveys.org/ExploreEconomies/?economyid=142&year=2009.
———. 2010a. “Getting Electricity: A Pilot Indicator Set from the Doing Business Project”. Washington, DC: World Bank. http://doingbusiness.org/data/exploretopics/getting-electricity.
———. 2010b. “Niger: Modernizing Trade during a Mining Boom Diagnostic Trade Integration Study for the Integrated Framework Program.” Poverty Reduction and Economic Management. Africa Region, World Bank, Washington, DC.
Transport
Bofinger, Heinrich C. 2009. “An Unsteady Course: Growth and Challenges in Africa’s Air Transport Industry.” AICD Background Paper 16, Africa Region, World Bank, Washington, DC.
Bullock, Richard. 2009. “Off Track: Sub-Saharan African Railways.” AICD Background Paper 17, Africa Region, World Bank, Washington, DC.
Carruthers, Robin, Ranga Rajan Krishnamani, and Siobhan Murray. 2009. “Improving Connectivity: Investing in Transport Infrastructure in Sub-Saharan Africa.” AICD Background Paper 7, Africa Region, World Bank, Washington, DC.
Enhanced Integrated Framework. 2008. “Niger: Modernizing Trade during a Mining Boom.” Diagnostic Trade Integration Study for the Integrated Framework Program, February 2008. Africa Region, World Bank, Washington, DC.
Gwilliam, Ken, Vivien Foster, Rodrigo Archondo-Callao, Cecilia Briceño-Garmendia, Alberto Nogales, and Kavita Sethi. 2008. “The Burden of Maintenance: Roads in Sub-Saharan Africa.” AICD Background Paper 14, Africa Region, World Bank, Washington, DC.
Kumar, Ajay, and Fanny Barrett. 2008. “Stuck in Traffic: Urban Transport in Africa.” AICD Background Paper 1, Africa Region, World Bank, Washington, DC.
Ocean Shipping Consultants, Inc. 2009. “Beyond the Bottlenecks: Ports in Africa.” AICD Background Paper 8, Africa Region, World Bank, Washington, DC.
Teravaninthorn, Supee and Gael Raballand. 2009. “Transport Prices and Costs in Africa: A Review of the International Corridors.” Africa Region, World Bank, Washington, DC.
World Bank. 2008c. Project Appraisal Document on a Proposed Grant in the Amount of SDR 18.8
Million ($30 Million Equivalent) to the Republic of Niger for a Transport Sector Program
Support Project. Report No: 43162-NE, World Bank, Washington, DC, April 3.
Water supply and sanitation
Banerjee, Sudeshna, Vivien Foster, Yvonne Ying, Heather Skilling, and Quentin Wodon. 2008a.“Cost Recovery, Equity, and Efficiency in Water Tariffs: Evidence from African Utilities.” AICD Working Paper 7, Africa Region, World Bank, Washington, DC.

NIGER’S INFRASTRUCTURE: A CONTINENTAL PERSPECTIVE
48
Banerjee, Sudeshna, Heather Skilling, Vivien Foster, Cecilia Briceño-Garmendia, Elvira Morella, and Tarik Chfadi. 2008b. “Ebbing Water, Surging Deficits: Urban Water Supply in Sub-Saharan Africa.” AICD Background Paper 12, Africa Region, World Bank, Washington, DC.
Fall, Matar, Philipped Marin, Alain Locussol, and Richard Verspyck. 2009. “Reforming Urban Water Utilities in Western and Central Africa: Experiences with Public-Private Partnerships.” Volume 2: Case Studies, Water Sector Board Discussion Paper Series, Paper 13, Africa Region, World Bank, Washington, DC. June.
Gulyani, Sumila, Debabrata Talukdar, and Darby Jack. 2009. “Poverty, Living Conditions, and Infrastructure Access: A Comparison of Slums in Dakar, Johannesburg, and Nairobi.” AICD Working Paper 10, Africa Region, World Bank, Washington, DC.
IBNET (The International Benchmarking Network for Water and Sanitation Utilities). 2009. http://www.ib-net.org/.
WHO (World Health Organization), Joint Monitoring Program (JMP). 2010a. “Niger Estimates for the use of Improved Drinking-Water Sources.” Updated March 2010. http://www.wssinfo.org/resources/documents.html.
———. 2010b. “Niger Estimates for the useof Improved Sanitation Facilities.” Updated March 2010. http://www.wssinfo.org/resources/documents.html.
Keener, Sarah, Manuel Luengo, and Sudeshna Banerjee. 2009. “Provision of Water to the Poor in Africa: Experience with Water Standposts and the Informal Water Sector.” AICD Working Paper 13, Africa Region, World Bank, Washington, DC.
Morella, Elvira, Vivien Foster, and Sudeshna Ghosh Banerjee. 2008. “Climbing the Ladder: The State of Sanitation in Sub-Saharan Africa.” AICD Background Paper 13, Africa Region, World Bank, Washington, DC.
World Bank. 2010c. Implementation Completion and Results Report (IDA-3505 IDA-H259) on a Credit
in the Amount of SDR 37.3 Million ($48 Million Equivalent) and a Grant in the Amount of SDR
7.0 Million ($10 Million Equivalent) to the Government of Niger for the Water Sector Project. Report ICR00001231, World Bank, Washington, DC. June 18.
———. 2010d. “International LPI ranking.” http://www1.worldbank.org/PREM/LPI/tradesurvey/mode1b.asp#ranking