Embed Size (px)
Citation preview
1
2
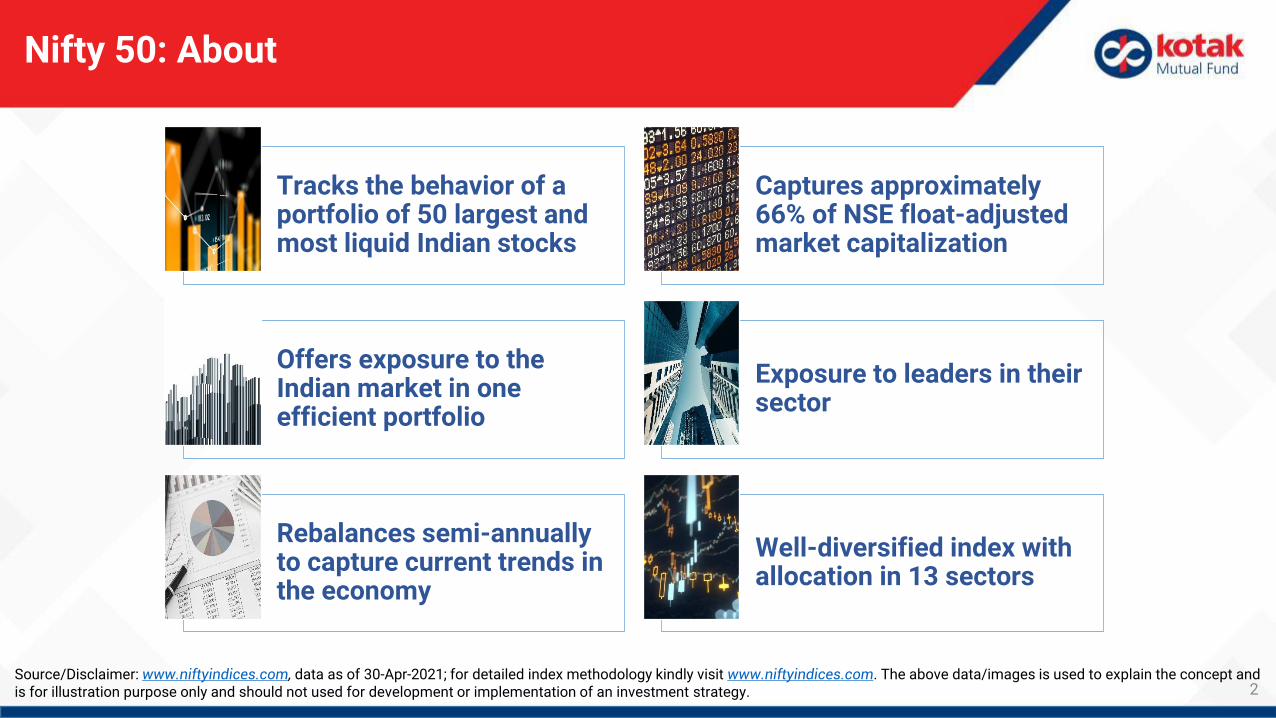
Nifty 50: About
Tracks the behavior of a portfolio of 50 largest and most liquid Indian stocks
Captures approximately 66% of NSE float-adjusted market capitalization
Offers exposure to the Indian market in one efficient portfolio
Exposure to leaders in their sector
Rebalances semi-annually to capture current trends in the economy
Well-diversified index with allocation in 13 sectors
Source/Disclaimer: www.niftyindices.com, data as of 30-Apr-2021; for detailed index methodology kindly visit www.niftyindices.com. The above data/images is used to explain the concept and is for illustration purpose only and should not used for development or implementation of an investment strategy.
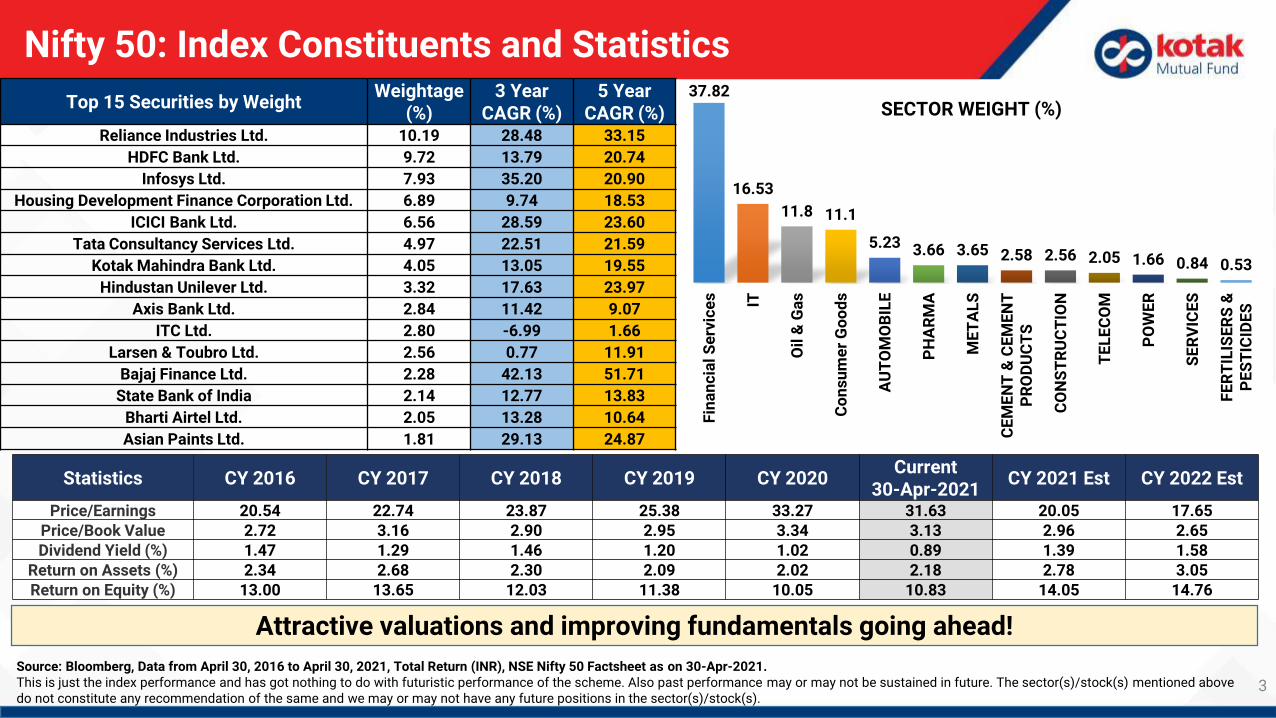
37.82
16.53
11.8 11.1
5.23 3.66 3.65 2.58 2.56 2.05 1.66 0.84 0.53
Fin
an
cia
l S
erv
ice
s IT
Oil
& G
as
Co
ns
um
er
Go
od
s
AU
TO
MO
BIL
E
PH
AR
MA
ME
TA
LS
CE
ME
NT
& C
EM
EN
TP
RO
DU
CT
S
CO
NS
TR
UC
TIO
N
TE
LE
CO
M
PO
WE
R
SE
RV
ICE
S
FE
RT
ILIS
ER
S &
PE
ST
ICID
ES
SECTOR WEIGHT (%)
3
Nifty 50: Index Constituents and Statistics
Source: Bloomberg, Data from April 30, 2016 to April 30, 2021, Total Return (INR), NSE Nifty 50 Factsheet as on 30-Apr-2021.This is just the index performance and has got nothing to do with futuristic performance of the scheme. Also past performance may or may not be sustained in future. The sector(s)/stock(s) mentioned above do not constitute any recommendation of the same and we may or may not have any future positions in the sector(s)/stock(s).
Top 15 Securities by WeightWeightage
(%)3 Year
CAGR (%)5 Year
CAGR (%)Reliance Industries Ltd. 10.19 28.48 33.15
HDFC Bank Ltd. 9.72 13.79 20.74
Infosys Ltd. 7.93 35.20 20.90
Housing Development Finance Corporation Ltd. 6.89 9.74 18.53
ICICI Bank Ltd. 6.56 28.59 23.60
Tata Consultancy Services Ltd. 4.97 22.51 21.59
Kotak Mahindra Bank Ltd. 4.05 13.05 19.55
Hindustan Unilever Ltd. 3.32 17.63 23.97
Axis Bank Ltd. 2.84 11.42 9.07
ITC Ltd. 2.80 -6.99 1.66
Larsen & Toubro Ltd. 2.56 0.77 11.91
Bajaj Finance Ltd. 2.28 42.13 51.71
State Bank of India 2.14 12.77 13.83
Bharti Airtel Ltd. 2.05 13.28 10.64
Asian Paints Ltd. 1.81 29.13 24.87
Statistics CY 2016 CY 2017 CY 2018 CY 2019 CY 2020Current
30-Apr-2021CY 2021 Est CY 2022 Est
Price/Earnings 20.54 22.74 23.87 25.38 33.27 31.63 20.05 17.65Price/Book Value 2.72 3.16 2.90 2.95 3.34 3.13 2.96 2.65Dividend Yield (%) 1.47 1.29 1.46 1.20 1.02 0.89 1.39 1.58
Return on Assets (%) 2.34 2.68 2.30 2.09 2.02 2.18 2.78 3.05Return on Equity (%) 13.00 13.65 12.03 11.38 10.05 10.83 14.05 14.76
Attractive valuations and improving fundamentals going ahead!
4
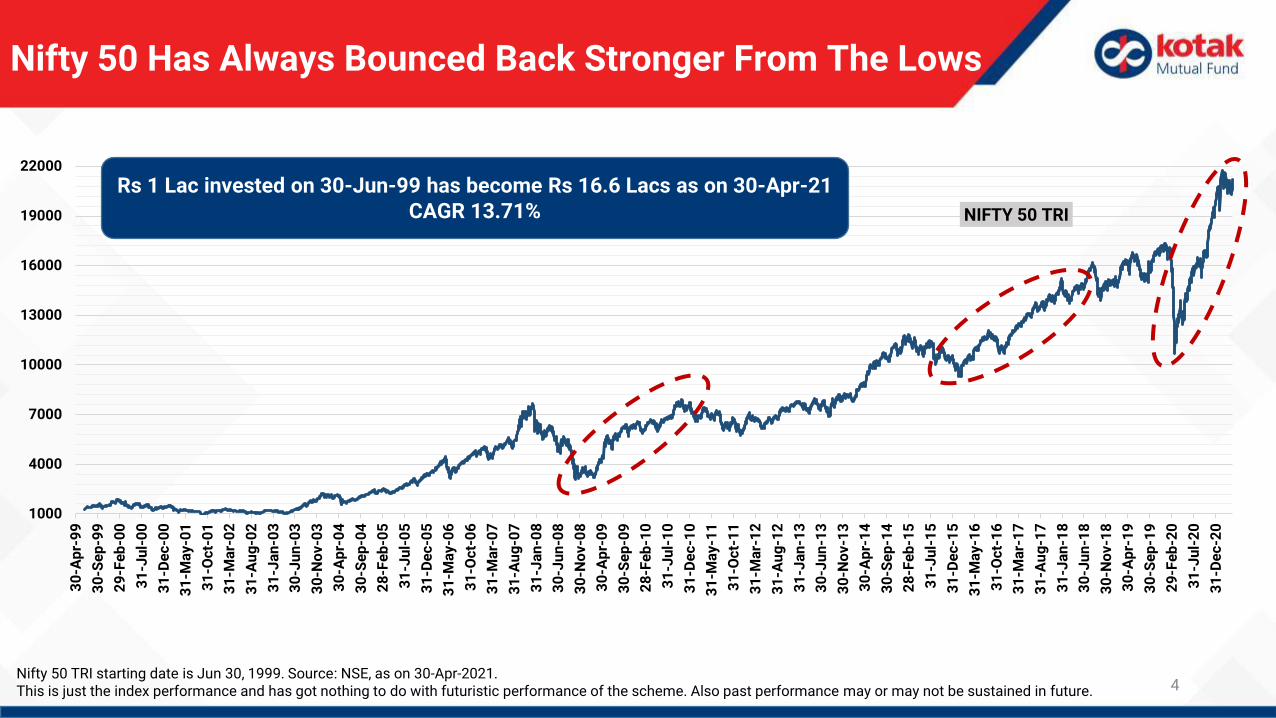
Nifty 50 Has Always Bounced Back Stronger From The Lows
1000
4000
7000
10000
13000
16000
19000
22000
30
-Ap
r-9
9
30
-Se
p-9
9
29
-Fe
b-0
0
31
-Ju
l-0
0
31
-De
c-0
0
31
-Ma
y-0
1
31
-Oc
t-0
1
31
-Ma
r-0
2
31
-Au
g-0
2
31
-Ja
n-0
3
30
-Ju
n-0
3
30
-No
v-0
3
30
-Ap
r-0
4
30
-Se
p-0
4
28
-Fe
b-0
5
31
-Ju
l-0
5
31
-De
c-0
5
31
-Ma
y-0
6
31
-Oc
t-0
6
31
-Ma
r-0
7
31
-Au
g-0
7
31
-Ja
n-0
8
30
-Ju
n-0
8
30
-No
v-0
8
30
-Ap
r-0
9
30
-Se
p-0
9
28
-Fe
b-1
0
31
-Ju
l-1
0
31
-De
c-1
0
31
-Ma
y-1
1
31
-Oc
t-1
1
31
-Ma
r-1
2
31
-Au
g-1
2
31
-Ja
n-1
3
30
-Ju
n-1
3
30
-No
v-1
3
30
-Ap
r-1
4
30
-Se
p-1
4
28
-Fe
b-1
5
31
-Ju
l-1
5
31
-De
c-1
5
31
-Ma
y-1
6
31
-Oc
t-1
6
31
-Ma
r-1
7
31
-Au
g-1
7
31
-Ja
n-1
8
30
-Ju
n-1
8
30
-No
v-1
8
30
-Ap
r-1
9
30
-Se
p-1
9
29
-Fe
b-2
0
31
-Ju
l-2
0
31
-De
c-2
0
NIFTY 50 TRI
Nifty 50 TRI starting date is Jun 30, 1999. Source: NSE, as on 30-Apr-2021.This is just the index performance and has got nothing to do with futuristic performance of the scheme. Also past performance may or may not be sustained in future.
Rs 1 Lac invested on 30-Jun-99 has become Rs 16.6 Lacs as on 30-Apr-21 CAGR 13.71%
5
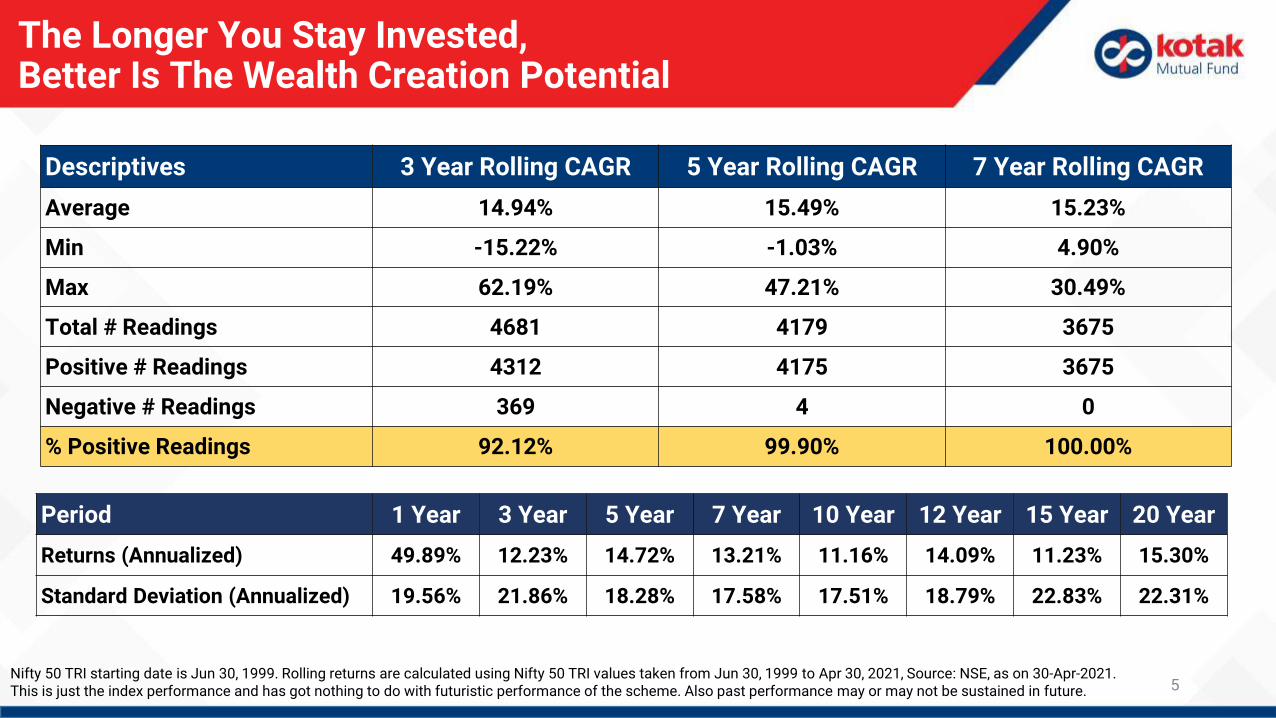
The Longer You Stay Invested, Better Is The Wealth Creation Potential
Descriptives 3 Year Rolling CAGR 5 Year Rolling CAGR 7 Year Rolling CAGR
Average 14.94% 15.49% 15.23%
Min -15.22% -1.03% 4.90%
Max 62.19% 47.21% 30.49%
Total # Readings 4681 4179 3675
Positive # Readings 4312 4175 3675
Negative # Readings 369 4 0
% Positive Readings 92.12% 99.90% 100.00%
Nifty 50 TRI starting date is Jun 30, 1999. Rolling returns are calculated using Nifty 50 TRI values taken from Jun 30, 1999 to Apr 30, 2021, Source: NSE, as on 30-Apr-2021.This is just the index performance and has got nothing to do with futuristic performance of the scheme. Also past performance may or may not be sustained in future.
Period 1 Year 3 Year 5 Year 7 Year 10 Year 12 Year 15 Year 20 Year
Returns (Annualized) 49.89% 12.23% 14.72% 13.21% 11.16% 14.09% 11.23% 15.30%
Standard Deviation (Annualized) 19.56% 21.86% 18.28% 17.58% 17.51% 18.79% 22.83% 22.31%
6
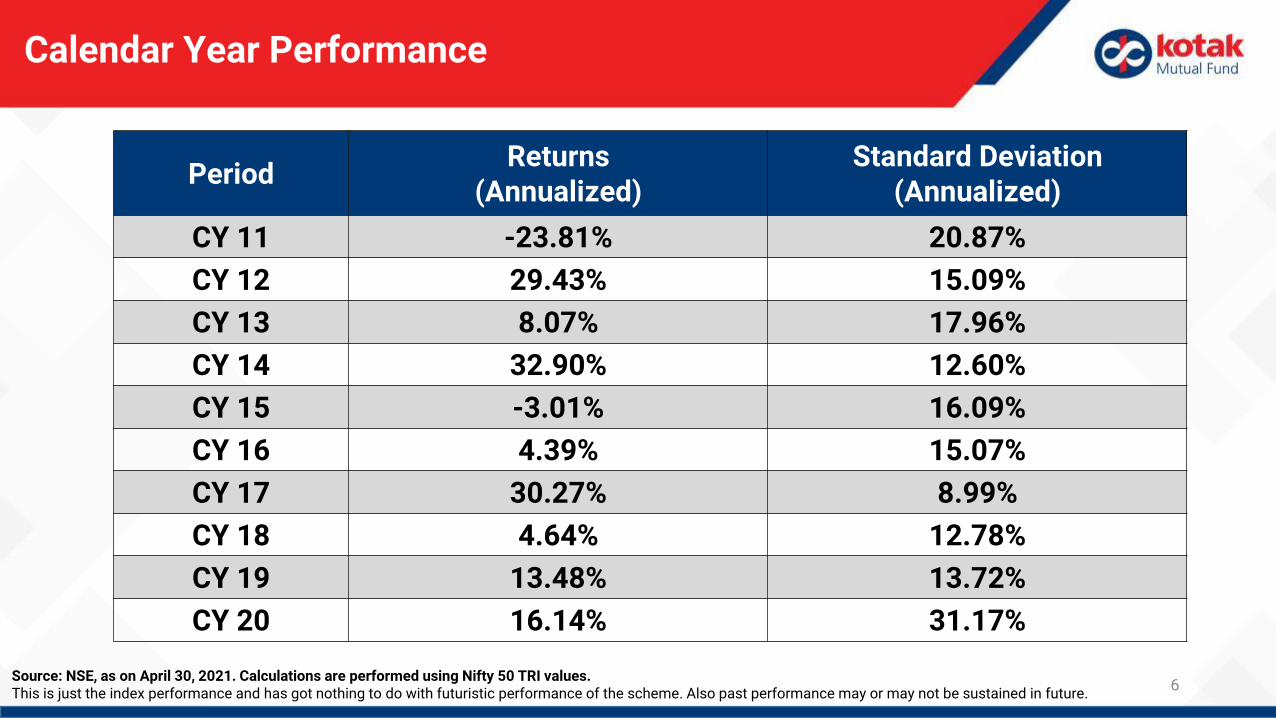
Calendar Year Performance
PeriodReturns
(Annualized)Standard Deviation
(Annualized)
CY 11 -23.81% 20.87%
CY 12 29.43% 15.09%
CY 13 8.07% 17.96%
CY 14 32.90% 12.60%
CY 15 -3.01% 16.09%
CY 16 4.39% 15.07%
CY 17 30.27% 8.99%
CY 18 4.64% 12.78%
CY 19 13.48% 13.72%
CY 20 16.14% 31.17%
Source: NSE, as on April 30, 2021. Calculations are performed using Nifty 50 TRI values.This is just the index performance and has got nothing to do with futuristic performance of the scheme. Also past performance may or may not be sustained in future.
7
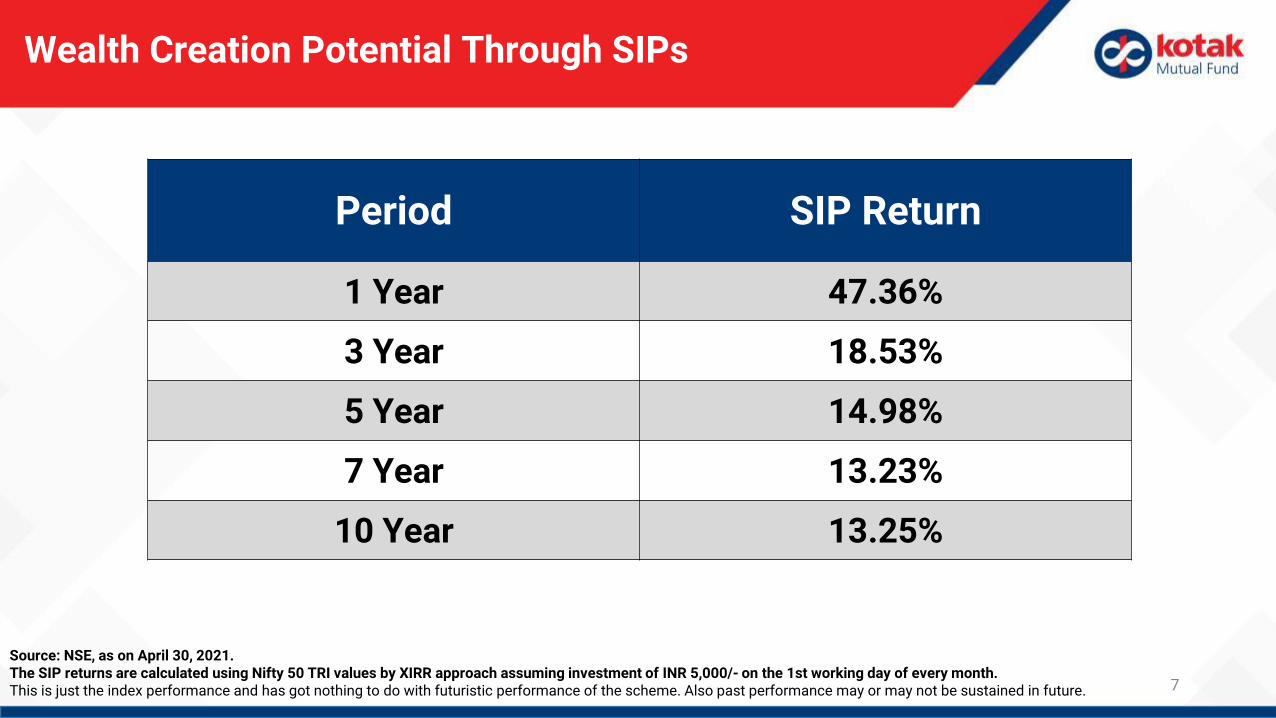
Wealth Creation Potential Through SIPs
Period SIP Return
1 Year 47.36%
3 Year 18.53%
5 Year 14.98%
7 Year 13.23%
10 Year 13.25%
Source: NSE, as on April 30, 2021.The SIP returns are calculated using Nifty 50 TRI values by XIRR approach assuming investment of INR 5,000/- on the 1st working day of every month.This is just the index performance and has got nothing to do with futuristic performance of the scheme. Also past performance may or may not be sustained in future.
8
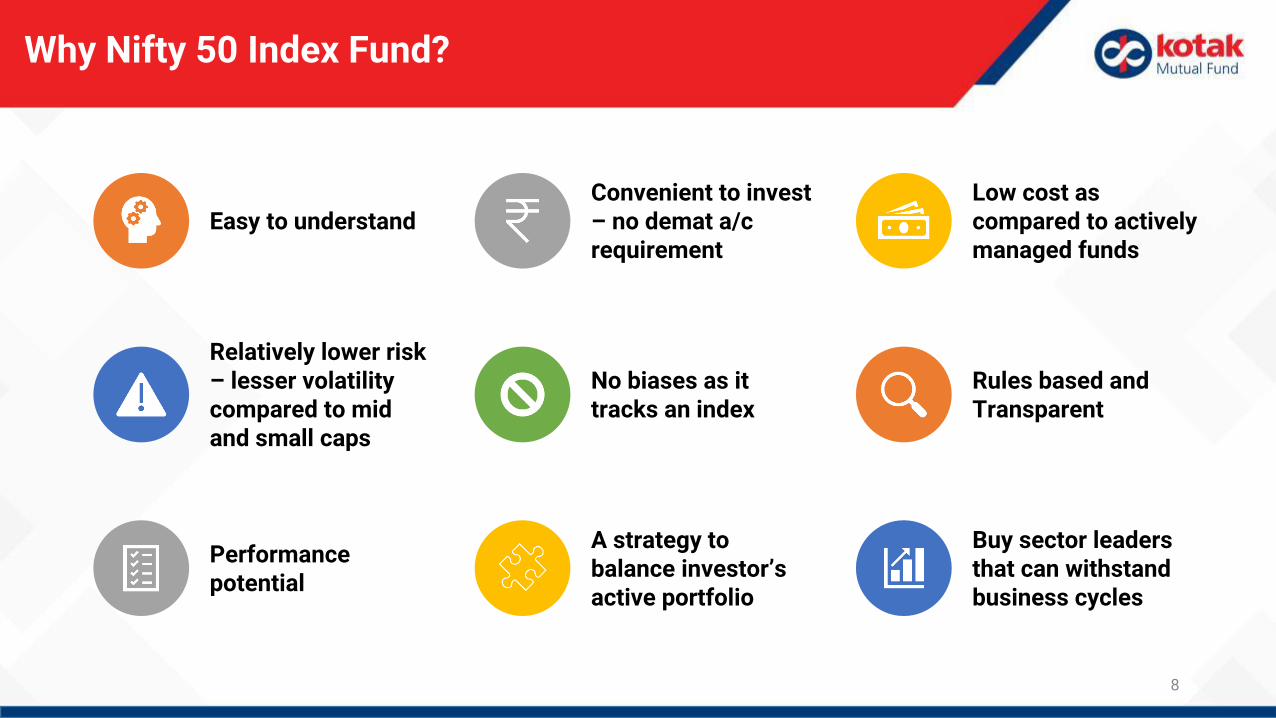
Why Nifty 50 Index Fund?
Easy to understandConvenient to invest – no demat a/c requirement
Low cost as compared to actively managed funds
Relatively lower risk – lesser volatility compared to mid and small caps
No biases as it tracks an index
Rules based and Transparent
Performance potential
A strategy to balance investor’s active portfolio
Buy sector leaders that can withstand business cycles
9
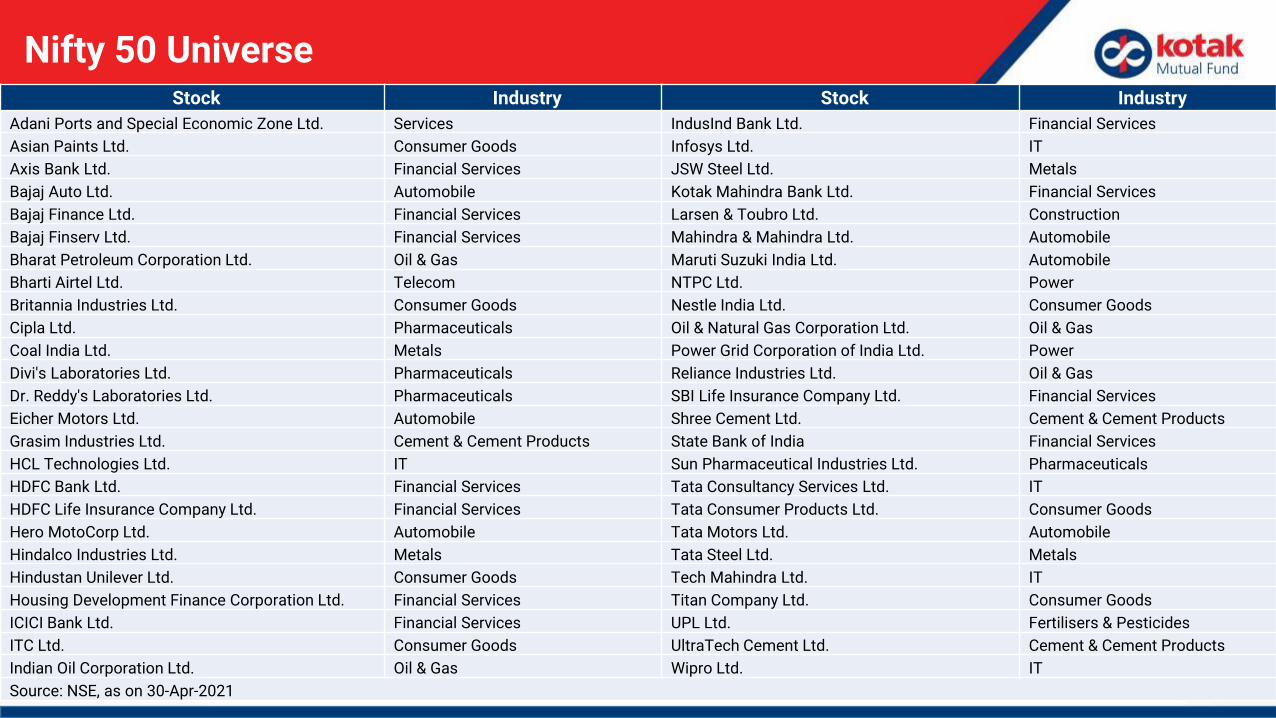
Nifty 50 UniverseStock Industry Stock Industry
Adani Ports and Special Economic Zone Ltd. Services IndusInd Bank Ltd. Financial Services
Asian Paints Ltd. Consumer Goods Infosys Ltd. IT
Axis Bank Ltd. Financial Services JSW Steel Ltd. Metals
Bajaj Auto Ltd. Automobile Kotak Mahindra Bank Ltd. Financial Services
Bajaj Finance Ltd. Financial Services Larsen & Toubro Ltd. Construction
Bajaj Finserv Ltd. Financial Services Mahindra & Mahindra Ltd. Automobile
Bharat Petroleum Corporation Ltd. Oil & Gas Maruti Suzuki India Ltd. Automobile
Bharti Airtel Ltd. Telecom NTPC Ltd. Power
Britannia Industries Ltd. Consumer Goods Nestle India Ltd. Consumer Goods
Cipla Ltd. Pharmaceuticals Oil & Natural Gas Corporation Ltd. Oil & Gas
Coal India Ltd. Metals Power Grid Corporation of India Ltd. Power
Divi's Laboratories Ltd. Pharmaceuticals Reliance Industries Ltd. Oil & Gas
Dr. Reddy's Laboratories Ltd. Pharmaceuticals SBI Life Insurance Company Ltd. Financial Services
Eicher Motors Ltd. Automobile Shree Cement Ltd. Cement & Cement Products
Grasim Industries Ltd. Cement & Cement Products State Bank of India Financial Services
HCL Technologies Ltd. IT Sun Pharmaceutical Industries Ltd. Pharmaceuticals
HDFC Bank Ltd. Financial Services Tata Consultancy Services Ltd. IT
HDFC Life Insurance Company Ltd. Financial Services Tata Consumer Products Ltd. Consumer Goods
Hero MotoCorp Ltd. Automobile Tata Motors Ltd. Automobile
Hindalco Industries Ltd. Metals Tata Steel Ltd. Metals
Hindustan Unilever Ltd. Consumer Goods Tech Mahindra Ltd. IT
Housing Development Finance Corporation Ltd. Financial Services Titan Company Ltd. Consumer Goods
ICICI Bank Ltd. Financial Services UPL Ltd. Fertilisers & Pesticides
ITC Ltd. Consumer Goods UltraTech Cement Ltd. Cement & Cement Products
Indian Oil Corporation Ltd. Oil & Gas Wipro Ltd. IT
Source: NSE, as on 30-Apr-2021
23
Kotak Nifty 50 Index Fund–Scheme Features
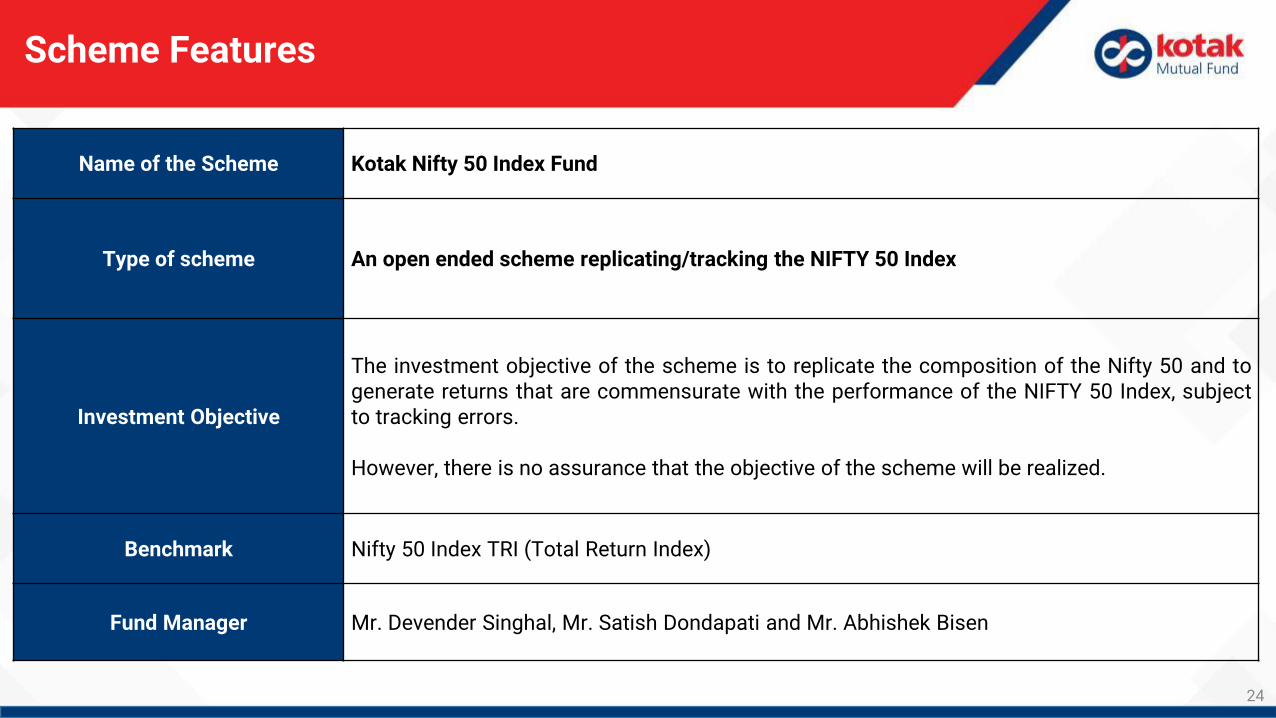
Scheme Features
Name of the Scheme Kotak Nifty 50 Index Fund
Type of scheme An open ended scheme replicating/tracking the NIFTY 50 Index
Investment Objective
The investment objective of the scheme is to replicate the composition of the Nifty 50 and togenerate returns that are commensurate with the performance of the NIFTY 50 Index, subjectto tracking errors.
However, there is no assurance that the objective of the scheme will be realized.
Benchmark Nifty 50 Index TRI (Total Return Index)
Fund Manager Mr. Devender Singhal, Mr. Satish Dondapati and Mr. Abhishek Bisen
24
12
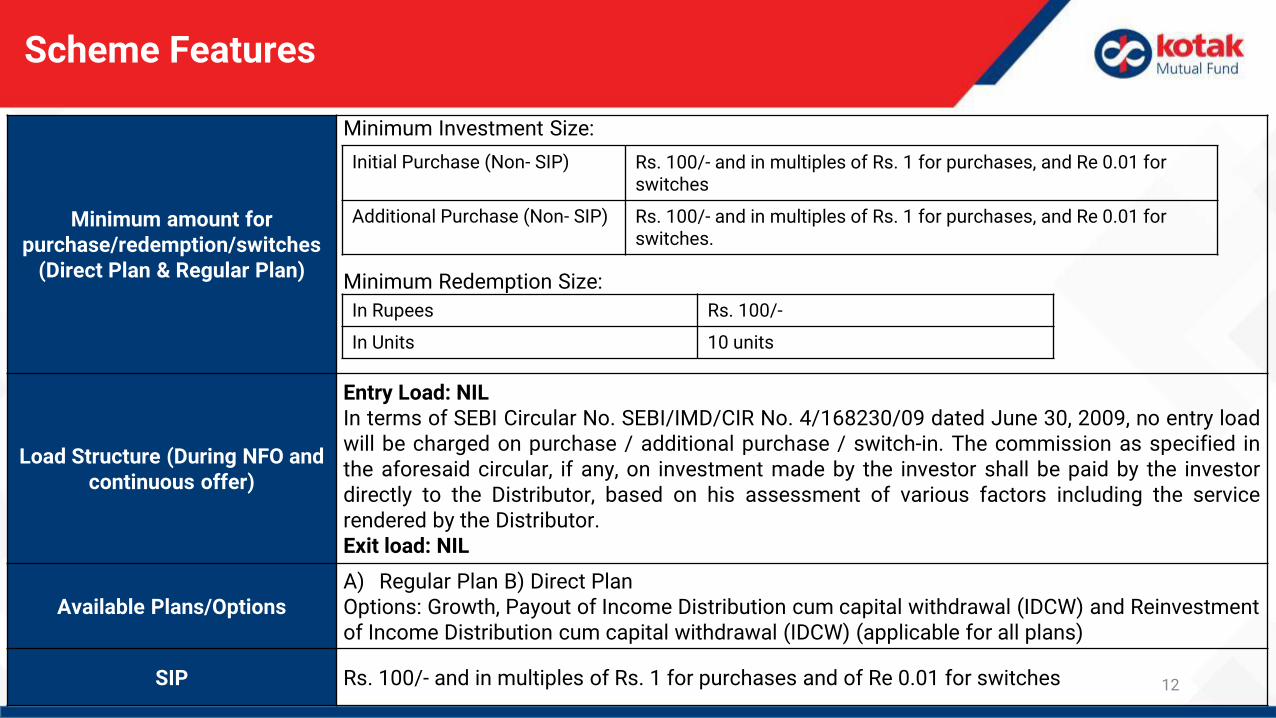
Scheme Features
Minimum amount for purchase/redemption/switches
(Direct Plan & Regular Plan)
Minimum Investment Size:
Minimum Redemption Size:
Load Structure (During NFO and continuous offer)
Entry Load: NILIn terms of SEBI Circular No. SEBI/IMD/CIR No. 4/168230/09 dated June 30, 2009, no entry loadwill be charged on purchase / additional purchase / switch-in. The commission as specified inthe aforesaid circular, if any, on investment made by the investor shall be paid by the investordirectly to the Distributor, based on his assessment of various factors including the servicerendered by the Distributor.Exit load: NIL
Available Plans/OptionsA) Regular Plan B) Direct Plan Options: Growth, Payout of Income Distribution cum capital withdrawal (IDCW) and Reinvestment of Income Distribution cum capital withdrawal (IDCW) (applicable for all plans)
SIP Rs. 100/- and in multiples of Rs. 1 for purchases and of Re 0.01 for switches
Initial Purchase (Non- SIP) Rs. 100/- and in multiples of Rs. 1 for purchases, and Re 0.01 for switches
Additional Purchase (Non- SIP) Rs. 100/- and in multiples of Rs. 1 for purchases, and Re 0.01 for switches.
In Rupees Rs. 100/-
In Units 10 units
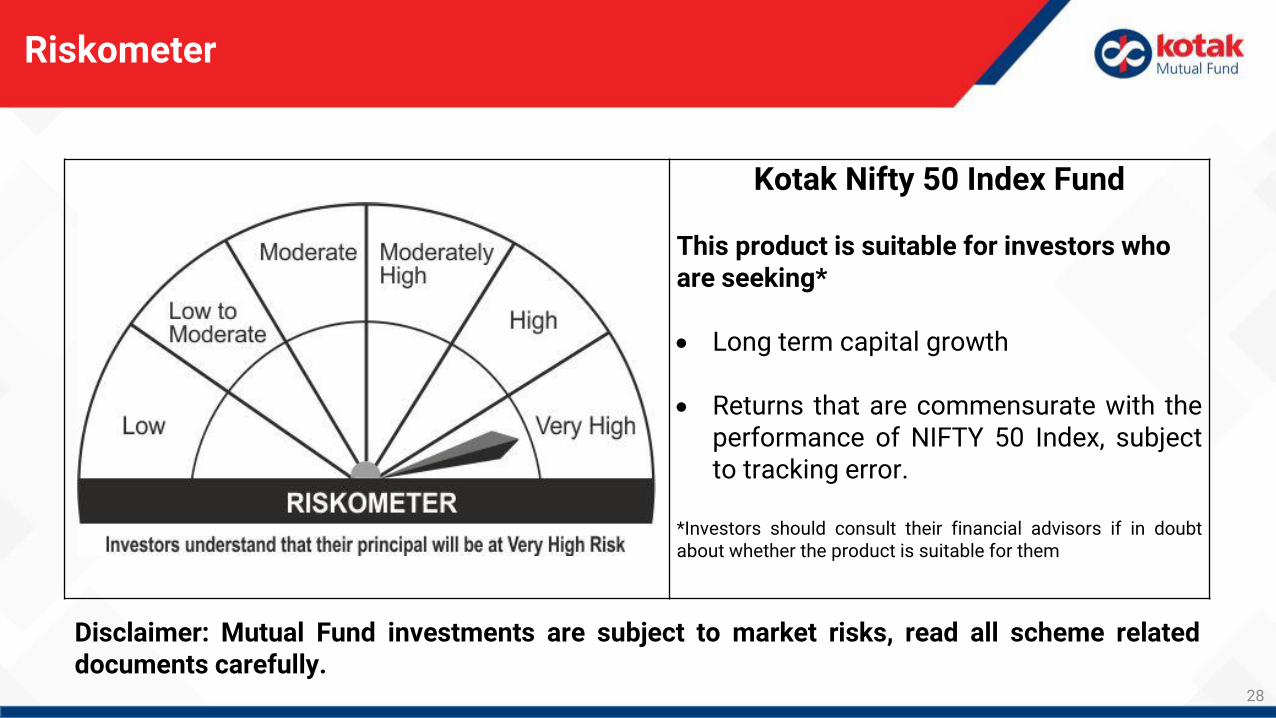
Riskometer
28
Kotak Nifty 50 Index Fund
This product is suitable for investors who are seeking*
Long term capital growth
Returns that are commensurate with theperformance of NIFTY 50 Index, subjectto tracking error.
*Investors should consult their financial advisors if in doubtabout whether the product is suitable for them
Disclaimer: Mutual Fund investments are subject to market risks, read all scheme relateddocuments carefully.
14
Thank You