Embed Size (px)
Citation preview

No. 0504
Social Protection Discussion Paper Series
Multinational Enterprises and Training Revisited: Do International Standards Matter?
Niels-Hugo Blunch
Paula Castro
March 2005
Social Protection Unit
Human Development Hub
The World Bank
Social Protection Discussion Papers are not formal publications of the World Bank. They present preliminary and unpolished results of analysis that are circulated to encourage discussion and comment; citation and the use of such a paper should take account of its provisional character. The findings, interpretations, and conclusions expressed in this paper are entirely those of the author(s) and should not be attributed in any manner to the World Bank, to its affiliated organizations or to members of its Board of Executive Directors or the countries they represent.
For free copies of this paper, please contact the Social Protection Advisory Service, The World Bank, 1818 H Street, N.W., Washington, D.C. 20433 USA. Telephone: (202) 458-5267, Fax: (202) 614-0471, E-mail: [email protected]. Or visit the Social Protection website at http://www.worldbank.org/sp.
32546
Pub
lic D
iscl
osur
e A
utho
rized
Pub
lic D
iscl
osur
e A
utho
rized
Pub
lic D
iscl
osur
e A
utho
rized
Pub
lic D
iscl
osur
e A
utho
rized
Pub
lic D
iscl
osur
e A
utho
rized
Pub
lic D
iscl
osur
e A
utho
rized
Pub
lic D
iscl
osur
e A
utho
rized
Pub
lic D
iscl
osur
e A
utho
rized

Multinational Enterprises and Training Revisited: Do International Standards Matter?
Niels-Hugo Blunch
Paula Castro
March 2005

Abstract:
Several studies have examined the determinants of training in developing countries but only few have paid attention to the potential importance of international standards such as ISO 9000 or ISO 14000 on the firm’s training decision. This paper examines training determinants using recent employer surveys for four developing countries, Honduras, Indonesia, Morocco and Nicaragua. We find that ISO certification status is an important determinant of training, even after controlling for other characteristics such as workers’ formal schooling, firm size, industry and foreign ownership. This points towards the importance of product quality and production standards for firm training. The paper also discusses policy implications related to the findings and provides directions for further research.
JEL Classifications: F23, D21, O1, O3 Keywords: Firm training, international standards, human capital

Multinational Enterprises and Training Revisited: Do International Standards Matter?
Niels-Hugo Blunch and Paula Castro†
1. Introduction
The relevance of human capital for economic growth and development has long been
recognized in economic theory1. Attention over human capital increased in the 1950s as
development theories shifted away from their previous focus in physical capital and
infrastructure. In the current context of a globalized economy where knowledge is
considered a major driver of growth (Romer, 1989), human capital becomes a crucial point in
development strategies and policies.
A significant amount of theoretical and empirical work is available on how human
capital, understood as education and post-schooling training, contributes to economic growth
by increasing productivity and facilitating the introduction of new technologies of
production. When people acquire skills they increase their productivity and become more
adaptable (Booth and Snower, 1996). This is a key ability in a world of flexible production
where tastes and technology are changing rapidly. Keeping a high level of competitiveness
depends on large part in the aptitude of firms and its workers to change and innovate. On the
other hand, when one worker gains skills, he/she makes other workers more productive
(Booth and Snower, 1996). As workplaces become highly integrated and interdependent
human networks, and teamwork constitutes a pervasive organizational practice, the benefits
of training gain increasing potential.
†The authors - Niels-Hugo Blunch, The George Washington University, [email protected] Paula Castro, University of California—Los Angeles, [email protected] We thank Amy Luinstra for managerial support and helpful comments and suggestions. This paper is a background paper for the World Bank’s Multinational Enterprises and Training project, commissioned by the Social Protection Department of The World Bank’s Human Development Network. The Investment Climate Surveys analyzed here were collected by The World Bank’s Private Sector Department. The findings and interpretations, however, are those of the authors and should not be attributed to the World Bank or any of its member countries or affiliated institutions. 1 In Adam Smith’s major work The Wealth of Nations, worker’s dexterity is stated as one of the mechanisms through which the division of labor raises productivity.

2
One of the points defining the debates around firm-sponsored training is its
conception as a privileged instrument for increasing labor market flexibility by providing
channels that enable workers to adapt to technical change (Goux and Maurin, 2000). On the
other hand, there exist polarized positions regarding whether private sector or governments
are the best providers of training. The private sector is considered more responsive to market
forces than governments in many dimensions, but there is disagreement on how good it
works regarding training. The diversity of policy arrangements found around the world
reflects the many different views regarding the interplay of governments and private sector in
this matter (Booth and Snower, 1996; Arulampalam and Booth, 1997; Tan, 2001).
Additionally, dissimilar levels of training among countries seem to be associated to their
share of GDP to research and development, and to their performance in the so-called “high-
tech industries” (OECD, 1999). Significant amount of research on the determinants of firm-
sponsored training has been carried out in developed countries. However a remarkable
scarcity of studies of this kind in developing countries remains a major problem (Colin Xu,
1998; Tan, 1996).
This paper addresses this knowledge gap by providing an overview of the
determinants of firm-sponsored training for five developing countries across three continets
from original firm-level surveys, namely Ethiopia, Honduras, Indonesia, Morocco and
Nicaragua. In so doing, we focus specifically at the potential importance of international
standards such as ISO 9000 or ISO 14000 on the firm’s training decision, which previously
have received little to no attention in the literature. In a globalized world, however,
international standards may be more important than ever. Two issues are involved. First,
when consumers are exposed to products from a wide range of products from all over the
world, consumers will likely desire and, maybe even more importantly, be able to demand
higher and more even product standards. An example here is the ISO 9000 certification,
which is a quality management and quality assurance standard. Second, however, firms now
act not only on consumers’ demands in terms of products and prices but increasingly in terms
of consumers’ demands in terms of values more broadly defined. This includes a notion of
“green” or “sustainable” consumption, so that modes of production are more environmentally
friendly and so on. These issues are, at least partially, addressed by the ISO 14000 standard,
which involve environmental management systems, environmental auditing, environmental

3
labels and declarations, and environmental performance evaluation. Again, while there have
been several studies on the determinants of firms’ training decision for both developed and
developing economies, the evidence for developing countries is still scarce in relative terms.
This is certainly true when it comes to the examining the possible impact of international
standards on the firm’s training decision.
The remainder of the paper is structured as follows. The next section presents an
overview of the previous evidence on training determinants. Section three presents the data,
including descriptive statistics. A discussion of the methodology of the paper is provided in
section four, while section five presents the results. Finally, section six concludes, discusses
the policy implications of the findings and provides directions for further research.
2. Previous Evidence on Training Determinants
Several factors potentially affect the firm’s training decision. Among these are the
education level of workers; the ratio between costs and benefits of training being more
favorable for people with higher education level. From the perspective of both employers
and employees, this means a higher probability of training for people with greater learning
ability, which can be proxied by the educational level they have attained. In turn, this raises
a major public policy issue. If workers enter the labor force with poor education, they will
not obtain the training needed to increase their wages. A high proportion of low educated
workers will discourage firms from offering good jobs that require higher skills and training.
At the same time, having only few good jobs available, workers will have little incentive to
train. As a consequence, workers may get caught in a cycle of low productivity, low training
and insufficient skilled jobs, or the “low-skill, bad-job” trap (Snower, 1996).
In developed countries of North America and Europe, there is consistent evidence of
significant higher likelihood of work related training the higher the education level of the
recipient (Arulampalam and Booth, 1997; Booth, 1991; Van Smoorenburg and Van der
Velden, 2000; Bartel and Sicherman, 1998; Green, 1993; Lynch and Black, 1995; Veum,
1995). For developing countries the results are more diverse. High impact of education level
in training likelihood is found in Mexico (Tan and Lopez-Acevedo, 2003; Tan and Batra,
1996), Thailand (Zeufack, 1998), Malaysia (Tan, 2001; Tan and Batra, 1996), and Colombia
(Tan and Batra, 1996). No significant relationship between education level and training was

4
found is Shangai (Ng, forthcoming), and a negative relationship of education with training
was found in Indonesia (Tan and Batra, 1996).
Organization size is another factor that impacts the likelihood of training. Extensive
empirical work in developed countries shows that larger firms provide more work related
training than smaller firms (Van Smoorenburg and Van der Velden, 2000; Booth,1993; Goux
and Maurin, 2000; Veum, 1995; Green, 1993; and Frazis et al, 1995; Lynch and Black,
1995). Looking at results from developing countries, a positive relationship has been found
in Mexico (Tan and Lopez-Acevedo, 2003; Tan and Batra, 1996), Thailand (Zeufack, 1998),
Malaysia (Tan, 2001), Taiwan, Colombia and Indonesia (Tan and Batra, 1996). However, no
significant relationship was found in Shanghai (Ng, forthcoming). One of the explanations
for this are the economies of scale that firms find in provision of training when they have
more employees. For the case of internal (in-firm) training, the fixed costs of training can be
spread over a larger number of employees, and for externally provided services, special
discounts can be arranged based on quantity. Other explanation for the strong association
between firm size and training, is the fact that larger firms are more forward looking and/or
better prepared to face the risks of training (Arulampalam and Booth, 1997). Larger firms
are also often subject to more regulations and bureaucracy, therefore offering more training
to meet safety requirements (Felstead and Green, 1996). Finally, smaller firms might be less
inclined to offer training because of their shorter and more uncertain planning horizons,
which makes them less likely to capture the returns of training (Oi, 1983). Considering that
in most countries micro and small enterprises constitute a large proportion of the private
sector, at least in sharing of employment, this presents important issues regarding the access
of training for the employees of those companies.
The role of trade unions in firm-sponsored training is contested. Theories support
two opposing views. Unions would undermine training opportunities by using their
monopoly role over labor supply to appropriate a larger proportion of surplus to obtain wages
increases (Arampalum and Booth, 1997; Booth, 1995). It is also held that unionized
establishments will have lower incentive to train workers as a result of opposition to the
introduction of new skill-intensive technologies that would threaten union jobs
(Arulampalam and Booth, 1997).

5
On the other hand, unions may be associated to increased training given that
cooperation with employers improves workers’ morale and organization, which promotes
training and increased productivity (Arulampalam and Booth, 1997). In addition to this,
unions would encourage firm-sponsored training through their effect on increased tenure
(lower turnover) (Freeman and Medoff, 1984). Finally, the formal unionized environment
may encourage firms to establish more sophisticated training systems (Green at al, 1996).
Empirical studies lend support to both points of view. In developed countries studies
typically find a significant positive impact of unionization over training provision (Booth,
1991; Veum, 1995; Green et al, 1999). Aidt and Tzannatos (2002) find disagreement among
studies looking at the effect of unions in work related training. However, in developing
countries, evidence from Colombia and Taiwan (Tan and Batra, 1996), Mexico (Tan and
Lopez-Acevedo, 2003; Tan and Batra, 1996) and Malaysia (Tan, 2001), confirms a positive
impact of trade unions in the likelihood of firm-sponsored training.
The relationship between physical and human capital is another factor that has to be
considered when assessing the provision of firm-sponsored training. When workers acquire
skills they make equipment more productive (Booth and Snower, 1996). It is not clear how
investments in human capital relate to the investments in physical capital. Employers may
consider investments in physical capital as a substitute for skilled labor, or they may see
investments in human capital as complements to physical capital investments (Lynch and
Black, 1995). Employers that make large investments in physical capital relative to the
number of workers will be more likely to train those workers in order to assure a higher
return to that investment (Frazis et al, 1995). This relationship has been confirmed in a study
of U.S. firms (Lynch and Black, 1995).
Different industries show dissimilar likelihood of training. Industry differences have
been found among developed and developing countries (Booth, 1991; Goux and Maurin,
2000; Ng, forthcoming). In OECD countries, workers in finance, insurance and business or
community, social or personal services have a higher probability of being trained compared
to other industries (OECD, 1999). Similarly, Frazis et al (1995) found that financing,
insurance and real state sectors are more likely to provide training. These differences might
be related to the technology intensity of each sector (Lillard and Tan, 1992), the market

6
dynamics they face which might require them to innovate at different rates, and different
levels of legal and safety requirements they are subject to.
Foreign equity of firms may have an impact in training practices. Multinational
enterprises have been theorized to have a role in knowledge spillovers through a variety of
means, training of workers among them (Blomstrom and Kokko, 2001). Tan and Lopez-
Acevedo (2003) found foreign ownership of firms (<50 percent) to be related to a higher
probability of training in Mexico than local companies, and Tan and Batra (1996) found this
same relationship for Taiwan and Malaysia. However, in the same study, Mexico and
Indonesia did not show a significant impact of foreign ownership in training. Given the
ubiquity of foreign owned enterprises and joint ventures, and the expectation over knowledge
spillovers for the benefit of recipient developing countries, this is a relevant factor to
consider. Interestingly, it is not commonly included in analysis of firm training practices.
International trade, proxied by the extent to which a firm exports its products, may be
a good indicator of training practices. International trade pushes firms to meet higher
standards in order to satisfy demanding foreign markets and by presenting them with strong
local competition from foreign producers. Empirical work testing the impact of trade shows
contradictory results, with non-significant impact in Mexico (Tan and Lopez-Acevedo, 2003)
but significant positive impact in Malaysia (Tan, 2001) and Taiwan (Tan and Batra, 1996).
Finally, workplace practices, such as just-in-time inventories, worker teams, total
quality management, benchmarking, etc., may impact the probability of training since they
require the development of particular skills. ISO standards are a set of international
industrial standards defining workplace practices based on consensus agreements among
national delegations representing a wide range of economic stakeholders - suppliers,
consumers, and government agencies. The most widespread ISO certifications are the ISO
9000, a quality management to improve performance and customer satisfaction, and ISO
14000, an environmental management certification. ISO standards encompass specifications
and criteria for the classification of materials, the manufacture of products, the provision of
services, testing and analysis of products, and terminology.
Firms benefit from ISO certification because they obtain a base to develop products
and services according to specifications that have wide acceptance in their sectors. Firms
with ISO certification acquire the international recognition of certain quality of outputs and

7
procedures, which enhances competitiveness in global markets through improved
productivity and/or financial performance (Corbett et al, 2002; Berthelot, et al, 2003). ISO
certification provides firms access to the ISO stock of technological know-how helping them
to save resources by not having to “reinvent the wheel”. ISO supports the decision making
processes regarding application and evaluation of new technologies, provides knowledge
about regulations and consumer criteria on foreign markets, facilitates transfer of technology,
and the adaptation of products and services to global requirements. Specifically for the case
of ISO 14000, one of the important motivations and benefits of firms to achieve it is the
enhancement of their corporate image, gaining access to customers that require ISO
certification, and helping firms to answer to pressure from public and environmental groups
(Ofori et al, 2002; Berthelot et al, 2003.)
Achieving ISO certification is supposed to be associated with training since the
certification requires employee training on what is expected from them and how those
expectations are to be met. However, many times firms would adopt new working practices
but would not train their workers accordingly (Frazis et al, 1995). Moreover, some studies
have found that firms see training as one of the problematic aspects of the implementation for
the ISO standards on the firm, in addition to general costs of implementation, and lack of
management and employee involvement (Berthelot et al, 2003, Ofori et al, 2000).
Given the relative scarcity of studies on training practices in developing countries,
and the increasing relevance of international standards for trade, we want to explore to what
extent ISO certification has direct impacts on the possibilities of developing the human
capital of workers. Despite the seemingly natural association between high performance
workplace practices and training, very few studies address the specific relationship of ISO
certification and training. Only for Mexico, a study on the maquiladora industry finds
training provision significantly higher in ISO-certified companies, than in the non-certified
ones (Dowlatshahi and Urias, 2004). Studies in the US confirm this trend of strong
association between workplace practices and training (Frazis et al, 1995; Lynch and Black,
1995).

8
3. Data and Descriptive Analyses
The surveys that provide the material for this paper were sponsored and designed by
the Private Sector Department of the World Bank in order to gather up-to-date information
regarding productivity and business climate in developing countries. The sample unit was the
business establishment, defined as the production location, although in this paper we refer to
them as firms.
The surveys are based on face-to-face interviews to managing directors, accountants,
human resources managers and other relevant company staff. While sampling design varies
somewhat across countries, the questionnaires are mostly consistent in terms of the nature of
questions and their wording. Table 3.1 provides the sample size2 and year of data collection
for each country.
Table 3.1 Overview of Countries, Sample Sizes and Year of Field Work
Country Year Field work Sample size Ethiopia 2002 427 Honduras 2003 450 Indonesia 2003 713 Morocco 2000 859 Nicaragua 2003 452
The selected countries for this paper were chosen based on geographic representation,
availability and comparability of the data pertinent to the present paper. In particular, we
were able to create a comparable set of “core” variables for the five countries shown in Table
3.1. These five countries therefore comprise the analysis sample for this paper.
Definition of Variables
The present analysis will include six dependent variables: three of incidence and three
of intensity of training. All the variables considered in this study reflect responses about the
firm’s training practices of the year previous to the interview. The incidence variables are
binary, taking the value one when the firm offers training, and zero when it does not. The
analysis of incidence of training refers to any training, including internal (in-firm) and
2 The effective estimation sample sizes, however, are lower than these due to missing observations on either dependent or explanatory variables.

9
external (outside the firm), and to any type of worker. The analysis for unskilled workers
reflects the incidence of training for unskilled workers. For external training the analysis
refers to the provision of training from outside of the firm (as opposed to in-firm training).
This last variable is intended as an approximation to the concept of general training
described in training theory, as opposed to firm specific. The relevance of general training is
that, for being portable to other firms, it may have a higher potential to increase the wages of
workers in the long term.
The intensity variables are used in this paper to analyze the proportion of workers
trained. Intensity of training refers to the proportion of workers trained in either internal or
external training, and includes any type of worker. Similarly, intensity of unskilled workers
refers to the proportion of unskilled workers trained over the total amount of unskilled
workers of the firm. Intensity of external training refers to the proportion of workers trained
by external providers over the total amount of workers in the firm.
Our main explanatory variable of interest, ISO certification status, is a binary variable
defined as one if the firm is either ISO 9000 or ISO 14000 certified. The reason for this is
that while the surveys for Honduras and Nicaragua distinguish between ISO 9000 and ISO
14000 certifications, the surveys for Indonesia and Morocco do not; here, a “composite” ISO
question was used, that is, whether the firm had at least one of the certifications. So as to
ensure valid inference for the ISO variable, we include a host of explanatory variables in
addition to ISO-certification status. These variables include foreign ownership share and
exporting share (exports as a share of total sales); firm size, based on the total number of full
time employees; capital-labor ratio, defined as the ratio of net value of production assets
(machinery and equipment) over the total amount of full time workers of the firm (original
responses in local currency were standardized to 2003 USD (market prices)); unionization,
defined as the proportion of unionized workers; sector, according to standard ISIC
classification, revision 3 (classified into four groups: food, garments, textiles and other
industries); education, expressed as the weighed average of years of education per
establishment. Missing observations is particularly a problem with the capital-labor ratio.
So as to retain as many firms in the analyses as possible, we therefore impute missing
observations on this variable with the sample mean of the country by industry.

10
Descriptive Analyses
In order to get an initial grasp of the determinants of firm level training, training
incidence for our three types of training across various firm characteristics are tabulated in
Tables 3.2-3.4.
Table 3.2 Training Incidence, any Training
Ethiopia HondurasIndonesia Morocco NicaraguaFull sample average 0.224 0.530 0.290 0.165 0.407ISO Certification Status: No ISO certification 0.212 0.516 0.223 0.145 0.395Has ISO certification 0.667 0.741 0.527 0.583 0.650Education (Average, Years) < 6 yrs 0.153 0.406 0.169 0.122 0.2506 to 12 0.187 0.548 0.255 0.177 0.41912 and above 0.481 0.636 0.471 0.300 0.532Firm size: 1-15 employees 0.054 0.364 0.143 0.029 0.28316-100 employees 0.289 0.620 0.148 0.113 0.546101-250 employees 0.600 0.647 0.371 0.225 0.800250+ employees 0.636 0.870 0.454 0.426 0.846Unionization: Non-unionized firms 0.142 0.520 0.173 0.137 0.382Unionized firms 0.541 0.846 0.395 0.349 0.759K-L Ratio (2003 prices): Less than USD100 0.120 0.625 0.292 0.165 0.433USD100 or more 0.231 0.526 0.200 0.250 0.405Industry: Textiles 0.500 0.714 0.246 0.210 0.333Garments 0.219 0.638 0.298 0.124 0.321Food 0.271 0.540 0.298 0.158 0.613Other 0.189 0.476 0.303 0.185 0.371Foreign ownership: Less than 10 percent 0.212 0.495 0.254 0.120 0.37710 percent or more 0.444 0.727 0.477 0.335 0.682Exporting share: Less than 10 percent 0.201 0.454 0.222 0.142 0.39710 percent or more 0.565 0.688 0.397 0.188 0.440Number of Observations 362 434 677 799 445
11
Considering Table 3.2 for the case of any training (as opposed to training for
unskilled workers and training by external providers), it is clear that a large fraction of firms
train. Training incidences range from about 17 percent for Morocco to 53 percent for
Honduras.
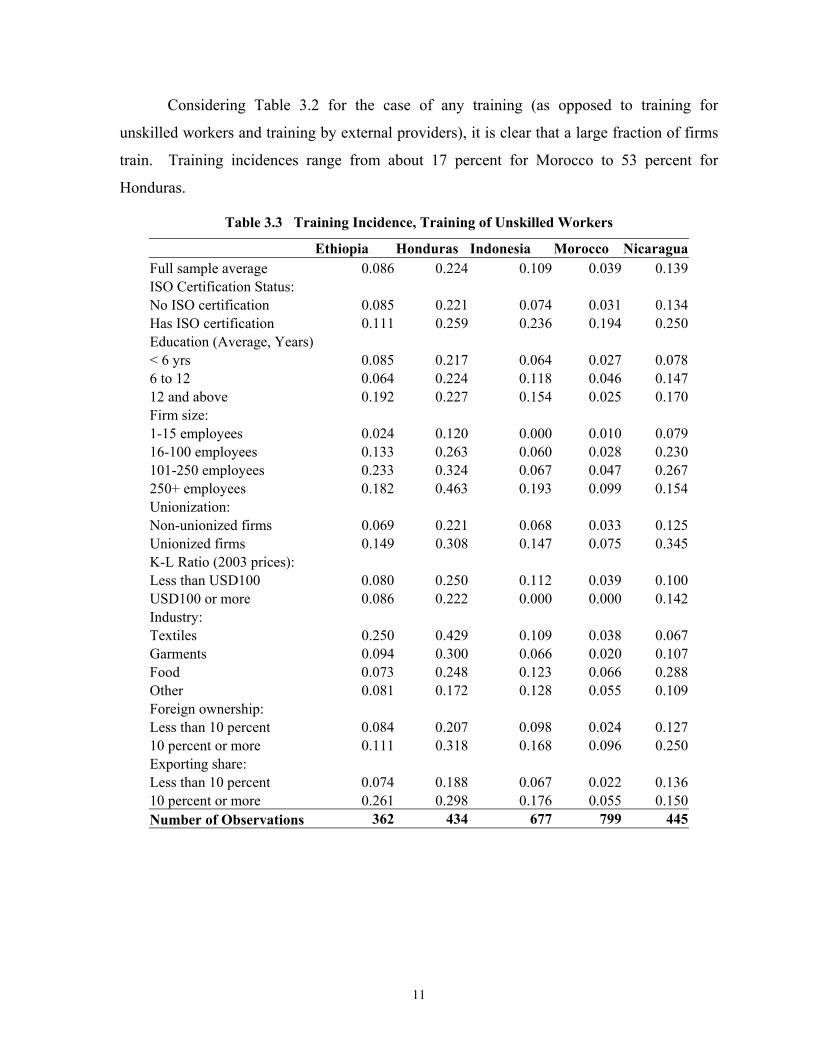
Table 3.3 Training Incidence, Training of Unskilled Workers
Ethiopia Honduras Indonesia Morocco NicaraguaFull sample average 0.086 0.224 0.109 0.039 0.139ISO Certification Status: No ISO certification 0.085 0.221 0.074 0.031 0.134Has ISO certification 0.111 0.259 0.236 0.194 0.250Education (Average, Years) < 6 yrs 0.085 0.217 0.064 0.027 0.0786 to 12 0.064 0.224 0.118 0.046 0.14712 and above 0.192 0.227 0.154 0.025 0.170Firm size: 1-15 employees 0.024 0.120 0.000 0.010 0.07916-100 employees 0.133 0.263 0.060 0.028 0.230101-250 employees 0.233 0.324 0.067 0.047 0.267250+ employees 0.182 0.463 0.193 0.099 0.154Unionization: Non-unionized firms 0.069 0.221 0.068 0.033 0.125Unionized firms 0.149 0.308 0.147 0.075 0.345K-L Ratio (2003 prices): Less than USD100 0.080 0.250 0.112 0.039 0.100USD100 or more 0.086 0.222 0.000 0.000 0.142Industry: Textiles 0.250 0.429 0.109 0.038 0.067Garments 0.094 0.300 0.066 0.020 0.107Food 0.073 0.248 0.123 0.066 0.288Other 0.081 0.172 0.128 0.055 0.109Foreign ownership: Less than 10 percent 0.084 0.207 0.098 0.024 0.12710 percent or more 0.111 0.318 0.168 0.096 0.250Exporting share: Less than 10 percent 0.074 0.188 0.067 0.022 0.13610 percent or more 0.261 0.298 0.176 0.055 0.150Number of Observations 362 434 677 799 445

12
There are, however, wide and systematic differences in training incidence related to
firm characteristics. Firms with ISO certification consistently are much more likely to
provide training for workers than are firms that are not ISO certified. The same is true for
firms with a more educated workforce, firms that are unionized, exporting firms and firms
with foreign ownership. There is also a positive association between firm size and firm
training.
Table 3.4 Training Incidence, Training by External Providers
Ethiopia Honduras Indonesia Morocco Nicaragua Full sample average 0.152 0.263 0.185 0.129 0.238ISO Certification Status: No ISO certification 0.142 0.256 0.132 0.110 0.231Has ISO certification 0.556 0.370 0.372 0.528 0.400Education (Average, Years) < 6 yrs 0.051 0.203 0.084 0.092 0.1566 to 12 0.131 0.271 0.168 0.139 0.23412 and above 0.365 0.318 0.322 0.250 0.383Firm size: 1-15 employees 0.024 0.129 0.000 0.029 0.12516-100 employees 0.133 0.307 0.066 0.083 0.362101-250 employees 0.467 0.500 0.326 0.201 0.600250+ employees 0.568 0.519 0.297 0.307 0.692Unionization: Non-unionized firms 0.076 0.259 0.099 0.104 0.214Unionized firms 0.446 0.385 0.263 0.292 0.586K-L Ratio (2003 prices): Less than USD100 0.080 0.313 0.184 0.128 0.200USD100 or more 0.157 0.261 0.200 0.250 0.241Industry: Textiles 0.167 0.500 0.188 0.177 0.200Garments 0.125 0.363 0.205 0.084 0.071Food 0.177 0.310 0.158 0.105 0.438Other 0.144 0.189 0.182 0.155 0.218Foreign ownership: Less than 10 percent 0.142 0.223 0.165 0.093 0.20910 percent or more 0.333 0.485 0.290 0.263 0.500Exporting share: Less than 10 percent 0.136 0.191 0.142 0.112 0.22010 percent or more 0.391 0.411 0.252 0.146 0.300Number of Observations 362 434 677 799 445

13
Perhaps surprisingly the association between the capital-labor ratio and firm training
is negative for some countries, indicating that capital and training are substitutes. Lastly,
there are large within-industry differences in firm training. The results for training of
unskilled workers and training by external providers are similar (Tables 3.3 and 3.4).
We also present the proportion of workers trained for the three types of training
across various firm characteristics (Tables B1-B3 in Appendix B). The results are similar to
the results for training incidence, although the positive bivariate relationship between share
of workers trained and ISO certification status does not hold up quite as strongly as was the
case for training incidence. The sample averages here are quite low, however, leading to
lower variation and therefore relatively more importance of outlier observations.
4. Methodology
The theoretical framework of this paper is traditional human capital theory, which
links individual and firm behavior for the understanding of firm-sponsored training (Becker,
1964). Training is considered to be result of optimizing decisions made by both the worker
and the employer for whom training represents an investment. Employers and workers will
train if the net present value of training is positive. The expected rate of return of training
depends on the cost, the investment horizon, the increase in productivity and the increase in
wages. Employers will train their workers if they expect the subsequent productivity
increments to be higher than an alternative investment with similar risks. Employees, on the
other hand, will be willing to invest in training following the same logic under the
expectation of future higher wages.
The model differentiates between firm-specific training, particular to the specific
needs of the firm that hence cannot be exported, from general training, which is portable. If
workers quit after obtaining general training, the firm is not able to reap the full benefits of
its investment, thus this model predicts that firms will tend to sponsor only specific training.
General training has especial prominence for economic development purposes due to its
portability to other firms, which enables employees to generate returns later in their life.
An alternative model to explain firm’s willingness to provide general training has
been presented by Acemoglu and Pischke (1998, 1999). The degree of wage compression
will determine the share of training costs between employers and employees. The more

14
compressed the wage structure, often seen in situation in non-competitive labor markets, the
higher the incentive for employers to provide training in order to reap the productivity gains
that are not passed to employees in the form of higher wages. This theory seems to better
explain the fact that employers do pay for substantial amounts of general training. On the
other hand, it has particular relevance at an international policy making level because it
suggests that differences in countries’ labor markets and institutional practices -such as wage
setting, and firing and hiring regulations-, may significantly impact the extent to which
private sector will become a provider of training at an optimal level (OECD, 1999).
Based on these considerations, we propose the following simple model of training
determinants at the firm level:
Ti = T(ISOi, Oi), (4.1)
where T is a measure of training provision for firm i, ISO is ISO certification status of
firm i and O is a vector containing other characteristics of firm I thought to influence the
firm’s training decision. The measure of training provision could be, for example, a binary
measure of whether the firm trains at all or a measure of the amount of training provided,
say, the number of hours of training provided or the number or fraction of workers receiving
training. Moving to the explanatory variables, whether an enterprise is ISO certified or not is
thought to affect training positively, since the standards prescribed by ISO would seem to
require a higher quality of labor to ensure adherence. One issue here, of course, is that ISO
certification status is potentially endogenous. In particular, firms may choose ISO and
training simultaneously. On the other hand, endogeneity might be due to reverse causality,
with training of workers leading firms to become ISO certified as fewer errors are made.
Since the nature of the data does not allow us to include an instrumental variable for ISO
certification status that is, a variable that affects ISO certification status without at the same
time affecting the firm’s training decision directly, however, in the analyses we have to
merely treat ISO certification status (and the other explanatory variables) as predetermined.
While ISO certification status is the factor in the firm’s training decision process that
has our main interest, other factors may also be important. A natural first candidate is the
educational level of workers, which is thought to affect training positively. The reason for
this is that employees who have already shown some aptitude for learning new skills in terms

15
of formal schooling also would seem to be more likely to receive additional human capital
investments from the employer in the form of training (Lynch and Black, 1995). Whether a
firm exports or not and how much is thought to affect the training decision positively;
presumably the pressure from (Western) consumers on firms operating in foreign markets
will force the firm to produce goods of a higher quality which in turn will require higher
quality labor, as well. Additionally, larger firms would seem to be more likely to train due to
economies of scale.
Contrary to what was the case for the previously discussed factors, it is not clear a
priori in which direction the firm’s capital-labor ratio affects the firm’s training decision. At
one extreme, training may serve as a substitute to physical capital so that more capital
intensive firms will train less and less capital intensive firms will train more. At the other
extreme, however, training may serve as a complement to physical capital so that more
capital intensive firms will train more and less capital intensive firms will train less.
To allow the possibility of omitted individual heterogeneity due to the institutional
frameworks and economic conditions and opportunities differing widely across countries,
(4.1) is estimated separately across the five countries. Estimations are carried out for both of
the two different types of measures of training—binary measure, measuring whether the firm
provides training or not and continuous measure, measuring the proportion of workers
trained—and all three different types of training described in the previous section—any
training, training of unskilled workers and training by external providers.
The estimation of (4.1) for the case of the binary training measure will be carried out
by estimation of univariate probit models. Due to the possible censoring of training at zero
or one censoring may be an issue for the second, continuous measure of traioning intensity.
Specifically, OLS will, if censoring is present, lead to biased estimates. To address this
issue, these analyses will therefore be carried out by estimating tobit models, allowing for
censoring both from below (at zero) and from above (at one).

16
5. Results
This section presents the results. First, we review the results for the probit
regressions of the binary training decision that is, whether to train or not. In the subsequent
sub-section follows the results for the tobit regressions of the continuous training decision
that is, how much to train (in terms of the proportion of workers). Descriptive statistics for
the analyses samples are reported in Table A1, Appendix A.
5.1 To Train or not to Train?
We first look at the firm’s binary training decision that is, whether the firm trains any
workers. Starting with the results for any training (that is, not discriminating between
whether the training was given to skilled or unskilled workers and/or provided internally or
externally) there is a large effect from ISO certification status (Table 5.1). The effect ranges
from about 6 percentage-points for Honduras to about 26 percentage-points for Morocco.
Although the impact is statistically significant only for Indonesia and Morocco, the impact is
large in substantive terms for all countries, particularly Ethiopia, Indonesia, Morocco and
Nicaragua, where it exceeds 15 percentage-points. In turn, this indicates that ISO
certification status is an important determinant of the firm’s training decision. This
corresponds to the results of Dowlatshahi and Urias (2004), which to our knowledge is the
only study that examines the possible impact of ISO certification status on firm training.
Again, as previously discussed, wile ISO certification status is potentially endogenous, we do
not have readily available any instrumental variable(s).
Education affects firm training positively with effects ranging between about 0.5 and
about 5 percentage-points. For Nicaragua, for example, each year of education is found to
increase the probability of training with about 3 percentage-points, so that, on average, a
worker with 5 years of education, say, is about 15 percentage points more likely to receive
training that a worker with no education. Larger firms are more likely to train workers than
smaller firms. The evidence for the capital-labor ratio, foreign ownership and exporting
status is more mixed, with both negative and positive effects.

17
Table 5.1 Marginal Probabilities from Probit Regressions for any Training
Ethiopia Honduras Indonesia Morocco Nicaragua Log(number of employees) 0.098*** 0.168*** 0.074*** 0.096*** 0.155*** [0.016] [0.026] [0.016] [0.013] [0.030] Education (years) 0.006 0.054*** 0.017*** 0.005 0.031*** [0.007] [0.012] [0.003] [0.003] [0.011] Capital-labor ratio (log) 0.017* 0.009 -0.006 0.029*** -0.021 [0.009] [0.016] [0.011] [0.009] [0.018] Foreign ownership share -0.016 -0.206* 0.044 0.086*** 0.17 [0.114] [0.112] [0.056] [0.030] [0.112] Exports share 0.148* 0.011 -0.002 -0.043 -0.144 [0.088] [0.101] [0.051] [0.034] [0.102] Unionization 0.023 0.167 0.052 0.063 0.105 [0.064] [0.151] [0.047] [0.039] [0.130] ISO certified 0.179 0.059 0.159*** 0.263*** 0.167 [0.154] [0.111] [0.049] [0.080] [0.144] Garments 0.093 -0.022 0.149** -0.065** -0.045 [0.165] [0.160] [0.063] [0.031] [0.147] Food 0.014 0.047 0.210*** -0.026 0.223 [0.118] [0.156] [0.070] [0.041] [0.145] Other industries -0.028 -0.013 0.100* 0.014 0.028 [0.115] [0.152] [0.051] [0.033] [0.134] Pseudo-R2 0.301 0.153 0.168 0.226 0.140 Number of Observations 362 434 677 799 445
Notes: ***: statistically significant at 1 percent; **: statistically significant at 5 percent; *: statistically significant at 10 percent. Industry reference category is “Textiles”. Numbers in brackets are robust Huber (1967)-White (1980) Sandwich standard errors.
Perhaps surprisingly unionized firms are more likely to provide training, although the
impact is imprecisely measured and so is not statistically significant. One reason for
expecting a negative impact is that unions, according to standard economic theory, are
thought to generally reduce training by bargaining for higher wages and thereby reducing the
ability of employers to lower wages to finance firm-specific training through an apprentice-
ship wage, say. On the other hand, if unions have a longer time-horizon than management,
they may be willing to trade off wage increases for increased training of workers.
Turning to the results of training of unskilled workers, the results differ somewhat
from the results for any training presented previously (Table 5.2). Most notably, ISO
certification status now has a negative impact for Ethiopia and Honduras. For Indonesia,
Morocco and Nicaragua, however, the impacts remain positive and large, between 3.6 and
8.5 percentage-points. The impact from education has decreased substantially but education
still has a positive impact, except for Ethiopia, where it is close to zero.

18
In turn, this implies that the training of unskilled workers is much less responsive to
the human capital stock of the workforce than is that of workers in general. Unskilled
workers, therefore, face a double jeopardy by both having low stocks of human capital (since
they are unskilled/lowskilled in the first place) and also receiving relatively less training per
year of schooling, relative to skilled workers.
Table 5.2 Marginal Probabilities from Probit Regressions for Training of Unskilled Workers
Ethiopia Honduras Indonesia Morocco Nicaragua Log(number of employees) 0.033*** 0.080*** 0.021** 0.013*** 0.032* [0.009] [0.019] [0.009] [0.004] [0.017] Education (years) -0.003 0.014 0.005*** 0.0001 0.010 [0.004] [0.009] [0.002] [0.001] [0.007] Capital-labor ratio (log) 0.007 0.018 -0.008 0.008*** 0.003 [0.006] [0.014] [0.006] [0.003] [0.010] Foreign ownership share -0.039 -0.038 -0.017 0.017* 0.056 [0.061] [0.077] [0.034] [0.009] [0.063] Exports share 0.084* -0.045 0.046 0.022* -0.052 [0.048] [0.070] [0.029] [0.011] [0.072] Unionization -0.027 -0.049 0.005 0.0001 0.082 [0.030] [0.098] [0.031] [0.011] [0.085] ISO certified -0.037 -0.052 0.085** 0.036 0.064 [0.036] [0.070] [0.034] [0.028] [0.092] Garments 0.010 -0.052 -0.023 -0.017 0.051 [0.077] [0.097] [0.031] [0.011] [0.132] Food -0.034 -0.013 0.062 0.027 0.214 [0.049] [0.106] [0.045] [0.031] [0.165] Other industries -0.036 -0.086 0.027 0.022 0.045 [0.066] [0.105] [0.030] [0.016] [0.092] Pseudo-R2 0.137 0.082 0.114 0.188 0.091 Number of Observations 362 434 677 799 445
Notes: ***: statistically significant at 1 percent; **: statistically significant at 5 percent; *: statistically significant at 10 percent. Industry reference category is “Textiles”. Numbers in brackets are robust Huber (1967)-White (1980) Sandwich standard errors.
Moving to the results for external training, the negative impact from ISO certification
status is seen to persist for Honduras, although it is imprecisely measured and therefore not
statistically significant (Table 5.3). For the other countries in the primary analysis sample the
impact remains positive and large, ranging from about 8 percentage points for Nicaragua to
about 22 percentage-points for Morocco. The estimate for average years of education is now
up a bit compared to what was the case for unskilled workers, ranging between 0.5 and 3
percentage-points.

19
Table 5.3 Marginal Probabilities from Probit Regressions for Training by External Providers
Ethiopia Honduras Indonesia Morocco Nicaragua Log(number of employees) 0.057*** 0.116*** 0.068*** 0.067*** 0.126*** [0.011] [0.020] [0.012] [0.010] [0.022] Education (years) 0.012*** 0.030*** 0.013*** 0.005** 0.013 [0.004] [0.009] [0.002] [0.003] [0.009] Capital-labor ratio (log) 0.009* 0.007 0.006 0.027*** -0.007 [0.005] [0.014] [0.009] [0.007] [0.015] Foreign ownership share -0.006 -0.002 -0.001 0.056** 0.140* [0.052] [0.083] [0.044] [0.023] [0.077] Exports share 0.028 -0.021 -0.059 -0.028 -0.151* [0.050] [0.074] [0.040] [0.027] [0.084] Unionization 0.032 -0.095 0.009 0.058* 0.040 [0.042] [0.090] [0.036] [0.034] [0.085] ISO certified 0.094 -0.048 0.106*** 0.224*** 0.078 [0.125] [0.072] [0.041] [0.075] [0.119] Garments 0.307 -0.076 0.099* -0.057** -0.187*** [0.213] [0.107] [0.051] [0.025] [0.059] Food 0.148 0.052 0.077 -0.049** 0.143 [0.116] [0.127] [0.058] [0.022] [0.140] Other industries 0.112** -0.078 0.031 0.007 0.010 [0.056] [0.119] [0.038] [0.026] [0.108] Pseudo-R2 0.385 0.149 0.185 0.244 0.185 Number of Observations 362 434 677 799 445
Notes: ***: statistically significant at 1 percent; **: statistically significant at 5 percent; *: statistically significant at 10 percent. Industry reference category is “Textiles”. Numbers in brackets are robust Huber (1967)-White (1980) Sandwich standard errors.
5.2 Determinants of how much to Train
The analysis of the previous subsection examined the firm’s binary training decision
that is, whether to train at all. While this is interesting in its own right, examining the degree
to which firms train that is, how much training is provided, will potentially shed additional
light on the relationship between international standards and training. Results from the tobit
regressions for the percentage of workers trained overall are provided in Table 5.4. The main
impression from the table is that ISO certification again has a large positive impact,
supporting the earlier findings for any training. Only for Honduras is this not the case; the
impact estimate is imprecisely measured here, however, and therefore not statistically
significant. Education has a positive and statistically significant impact for all countries,
except for Ethiopia. Unionization has a positive impact on the proportion of workers trained,
although it is not statistically significant.

20
Table 5.4 Coefficients from Tobit Regressions of Training Intensity, any Training
Ethiopia Honduras Indonesia Morocco Nicaragua Log(number of employees) 0.115*** 0.091*** 0.088*** 0.161*** 0.147*** [0.027] [0.032] [0.023] [0.027] [0.042] Education (years) 0.006 0.055*** 0.023*** 0.013* 0.055*** [0.010] [0.016] [0.005] [0.008] [0.015] Capital-labor ratio (log) 0.023 0.023 -0.011 0.068*** -0.027 [0.017] [0.022] [0.017] [0.020] [0.025] Foreign ownership share 0.155 -0.081 0.060 0.202*** 0.151 [0.170] [0.138] [0.079] [0.064] [0.152] Exports share 0.154 0.062 0.020 -0.047 -0.202 [0.141] [0.124] [0.071] [0.066] [0.147] Unionization 0.013 -0.018 0.094 0.032 -0.006 [0.096] [0.193] [0.067] [0.064] [0.153] ISO certified 0.037 -0.060 0.231*** 0.327*** 0.215 [0.171] [0.137] [0.063] [0.088] [0.168] Garments 0.064 -0.107 0.151* -0.162** -0.074 [0.194] [0.200] [0.084] [0.068] [0.239] Food 0.018 -0.103 0.225** -0.027 0.375 [0.166] [0.198] [0.089] [0.094] [0.230] Other industries -0.078 -0.205 0.164** 0.045 0.078 [0.161] [0.193] [0.074] [0.065] [0.217] Constant -0.955*** -0.755** -1.220*** -1.313*** -1.008*** [0.261] [0.321] [0.143] [0.158] [0.311] Pseudo-R2 0.203 0.046 0.162 0.238 0.078 Number of Observations 362 434 677 799 445
Notes: ***: statistically significant at 1 percent; **: statistically significant at 5 percent; *: statistically significant at 10 percent. Reference categories are “Textiles”. The estimations take into account censoring from below (at zero) and from above (at one).
The results for training intensity for unskilled workers and training by external
providers (Tables 5.5 and 5.6) are similar to those of any training intensity. One issue here,
however, is that the average proportion of trained workers across firms are quite low for
unskilled workers and training by outside providers (see Table A1, Appendix A), which in
turn leads to relatively little variation in these variables. These results should therefore be
treated with special caution and are mainly included here for comprehensiveness.
Summing up, the results indicate that the five countries in our analysis sample have
distinctly different experiences as far as the determinants of training are concerned. Further,
international standards as proxied by ISO certification status proved important overall as a
major determinant of firms’ decisions to train their workers. Other aspects of globalization
such as foreign ownership and exporting share proved important, as well, although the
pattern was less consistent than what was the case for ISO. Lastly, human capital in terms of

21
formal education appear to be complements to training so that firms with a higher stock of
worker human capital also will train more. This was true both for the average worker, as
well as for unskilled workers.
Table 5.5 Coefficients from Tobit Regressions of Training Intensity, Unskilled Workers
Ethiopia Honduras Indonesia Morocco Nicaragua Log(number of employees) 0.098** 0.117*** 0.060* 0.183*** 0.079 [0.038] [0.042] [0.031] [0.062] [0.063] Education (years) -0.010 0.016 0.017** -0.007 0.038* [0.014] [0.020] [0.007] [0.020] [0.023] Capital-labor ratio (log) 0.025 0.061** -0.039 0.102* 0.005 [0.025] [0.029] [0.024] [0.052] [0.037] Foreign ownership share -0.083 0.071 0.018 0.272* 0.173 [0.258] [0.170] [0.109] [0.142] [0.218] Exports share 0.229 -0.061 0.154 0.296* -0.153 [0.187] [0.159] [0.100] [0.159] [0.219] Unionization -0.080 -0.090 0.040 -0.061 0.202 [0.136] [0.251] [0.092] [0.150] [0.214] ISO certified -0.137 -0.182 0.269*** 0.301* 0.160 [0.275] [0.186] [0.087] [0.182] [0.240] Garments 0.030 -0.095 -0.089 -0.258 0.286 [0.252] [0.236] [0.124] [0.172] [0.423] Food -0.063 -0.061 0.123 0.307 0.666 [0.216] [0.235] [0.122] [0.194] [0.411] Other industries -0.132 -0.200 0.102 0.207 0.206 [0.207] [0.229] [0.101] [0.156] [0.397] Constant -
0.970*** -1.359*** -1.335*** -2.230*** -1.769*** [0.368] [0.424] [0.219] [0.480] [0.556] Pseudo-R2 0.108 0.058 0.141 0.200 0.075 Number of Observations 362 434 677 799 445 Notes: ***: statistically significant at 1 percent; **: statistically significant at 5 percent; *: statistically significant at 10 percent. Reference categories are “Textiles”. The estimations take into account censoring from below (at zero) and from above (at one).

22
Table 5.6 Coefficients from Tobit Regressions of Training Intensity, Training by External Providers
Ethiopia Honduras Indonesia Morocco Nicaragua Log(number of employees) 0.034*** 0.085*** 0.031*** 0.061*** 0.086*** [0.008] [0.024] [0.006] [0.012] [0.024] Education (years) 0.008** 0.034*** 0.006*** 0.008** 0.018** [0.003] [0.012] [0.001] [0.003] [0.008] Capital-labor ratio (log) 0.004 0.019 0.0001 0.033*** -0.007 [0.004] [0.016] [0.004] [0.009] [0.014] Foreign ownership share 0.038 -0.015 0.010 0.066** 0.068 [0.043] [0.094] [0.020] [0.028] [0.083] Exports share 0.015 -0.023 -0.069*** -0.043 -0.087 [0.036] [0.087] [0.019] [0.030] [0.085] Unionization 0.023 -0.041 0.008 0.034 -0.003 [0.025] [0.138] [0.018] [0.028] [0.083] ISO certified 0.022 -0.102 0.041** 0.149*** 0.066 [0.042] [0.101] [0.016] [0.037] [0.095] Garments 0.104* 0.030 0.063*** -0.058* -0.300* [0.061] [0.132] [0.022] [0.030] [0.153] Food 0.070 0.053 0.046* -0.069 0.148 [0.054] [0.132] [0.023] [0.045] [0.128] Other industries 0.095* -0.042 0.043** 0.026 0.01 [0.052] [0.128] [0.019] [0.028] [0.122] Constant
-0.437*** -0.981*** -0.360*** -0.562*** -0.618***
[0.089] [0.239] [0.042] [0.072] [0.177] Pseudo-R2 0.825 0.096 0.471 0.425 0.163 Number of Observations 362 434 677 799 445
Notes: ***: statistically significant at 1 percent; **: statistically significant at 5 percent; *: statistically significant at 10 percent. Reference categories are “Textiles”. The estimations take into account censoring from below (at zero) and from above (at one).
6. Conclusion
While several previous studies have examined what matters in the firm’s decision to
train its workers (Lynch and Black, 1995; Tan and Batra, 1995; Tan and Lopez-Acevedo,
2003) few, if any, of these studies have looked specifically at international product and
management standards as a potential important factor influencing the firm’s training
decision.
This paper examines training determinants using recent employer surveys for five
developing countries across the continents. In so doing, we emphasize the potential impact
from international product and management standards but also include other potentially

23
important determinants of firm training. Among the major findings are that ISO certification
is an important determinant of firm training, both in statistical and substantive terms.
While the endogenity of ISO certification may be an issue, this has potentially
important policy implications. First, globalization (which is one aspect of international
product and management standards) is not necessarily a “bad thing” as far as training of the
workforce is concerned. Further, another aspect of globalization, namely foreign ownership,
is found to also promote training, as is also firms’ exporting share. Second, demanding
international standards, for example ISO, to be adhered to by firms may not necessarily
decrease the firm’s investments in human capital in terms of training accordingly. On the
contrary, the demands of international standards such as the ISO will likely require firms to
increase the technical capabilities of their workers, as these standards will require higher and
more consistent quality of production and management. Third, in this process unions may
play a role, as well. Although the evidence here is much weaker, it does, however, raise the
issue of the labor unions being potentially important players in terms of upgrading the skills
of the work force in developing countries. Fourth, the results hint at the potential importance
of Corporate Social Responsibility (CSR) for the firm’s training decision. While CSR is a
fuzzy concept, the understanding adopted here is that CSR measures values such as
environmental or “green” production and consumption, on the producer and consumer side,
respectively. With this definition, CSR is to some extent captured by the components
inherent in the ISO 14000 definition. In turn, CSR therefore potentially accounts for a
substantial fraction of the variation in firm provided training.
While this study shed additional light on the determinants of the firm’s decision to
train its workforce, especially as this relates to the potential importance of international
product and management standards and CSR, more research is needed. In particular, the
quest to learn more about what determines the firm’s training decision is severely limited by
data constraints, especially as far as the CSR component is concerned. In particular, while
we have argued that several of our variables capture elements of CSR it is hard to define
exactly what CSR is. Future work on the linkages between training and CSR would benefit
tremendously from incorporating questions more related to values into future surveys. For
example, it would be useful to know about management’s attitudes towards consumer values
more broadly, their willingness to adapt to these and the weight they apply to these values as

24
well as the other aspects of CSR. Admittedly, it may be difficult to obtain truthful answers to
these questions so that we are, once again, stuck with whatever proxies we can find in
existing firm surveys.
25
References
Acemoglu, D. and J.S. Pischke (1998) “The Structure of Wages and Investment in General Training”, Working Paper 6357, National Bureau of Economic Research.
Acemoglu, D. and J.S. Pischke (1999) “Beyond Becker: Training in Imperfect Labor Markets”, Economic Journal, 109(453): 112-142.
Aidt, Toke and Zafiris Tzannatos (2002) Unions and Collective Bargaining, Washington D.C.: World Bank
Arulampalam, Wiji and Alison Booth (1997) “Who Gets Over the Training Hurdle? A study of the training experiences of young men and women in Britain”, Journal of Population Economics, 10(2):197-217.
Bartel, Ann and Nachum Sicherman (1998) “Technological Change and the Skill Acquisition of Young Workers”, Journal of Labor Economics, 16(4): 718-755.
Becker, Gary S. (1964) Human Capital, New York: National Bureau of Economic Research.
Berthelot, S., McGraw M.C., and Morril, J. (2003) “ISO 14000: Added Value for Canadian Business?”, Environmental Quality Management, 13(2): 47-57.
Blomstrom, Magnus and Ari Kokko (2001) “FDI and Human Capital: A Research Agenda”, OECD Technical Meeting, 13-14 December, Paris.
Booth, Alison (1991) “Job-related Formal Training: Who Receives It and What is It Worth?”, Oxford Bulletin of Economics and Statistics, 53(3): 281-294.
________(1993) “Private Sector Training and Graduate Earnings”, The Review of Economics and Statistics, 75(1):164-170.
________ (1995) The Economics of the Trade Union, Cambridge: Cambridge University Press.
Booth, Alison and Dennis Snower (1996) “Acquiring Skills, Market Failures, Their Symptoms and Policy Responses”, Cambridge, Cambridge University Press.
Colin Xu, Lixin (1998) “A Survey of Firm-Level Surveys of World Bank”, World Bank Working Paper, Washington D.C.: World Bank. Corbett, C., Montes, M., and Alvarez-Gil, M.J., (2002), “Does ISO 9000 Certification
Pay?”, ISO Management Systems. Special Report, July-August Issue: 31-40.

26
Dowlatshahi, Shad and Cristina Urias (2004) “An Empirical Study of ISO Certification in the Maquiladora Industry”, International Journal of Production Economics, 88: 291-306.
Felstead, A. and F. Green (1996) “Training and the Business Cycle”, in A. Booth and D. Snower (eds.), Acquiring Skills, Cambridge: Cambridge University Press.
Frazis, H., D. Herz, and M. Horrigan (1995) “Employer-provided Training: Results From a New Survey”, Monthly Labor Review, 118(5): 3-17.
Freeman, R. B., and J.L. Medoff (1984) What Do Unions Do?, New York: Basic Books. Goux, Dominique and Eric Maurin (2000) “Returns to Firm-provided Training:
Evidence from French Worker-firm Matched data”, Labour Economics, 7(1):1- 19.
Green, Francis (1993) “The Determinants of Training of Male and Female Employees in Britain”, Oxford Bulletin of Economics and Statistics, 55(1): 103-122.
Green, F., S. Machin, and D. Wilkinson (1996) “Trade Unions and Training Practices in British Workplaces”, Discussion Paper No 278, Centre for Economic Performance.
Huber, P. J. (1967) ”The Behavior of Maximum Likelihood Estimates under Nonstandard Conditions”, In: Proceedings of the Fifth Berkeley Symposium on Mathematical Statistics and Probability Vol. 1, Berkeley, CA: University of California Press.
Lillard, Lee, and Hong Tan (1992) “Private Sector Training: Who Gets it and What are its Effects?” in Ronald Ehrenberg (ed.), Research in Labor Economics, 13, Greenwich, Conn. and London: JAI Press.
Lynch, Lisa M. and Sandra E. Black (1995) “Beyond the Incidence of Training: Evidence from a National Employer Survey”, NBER Working Paper No. 5231, New York: National Bureau of Economic Research.
Mincer, Jacob (1974) Schooling, Experience and Earnings, New York: National Bureau of Economic Research.
Ng, Ying Chu (2005) “Training Determinants and Productivity Impact of Training in China: a Case of Shanghai”, Economics of Education Review, forthcoming.
Ofori, G., Gang, G., and Briffett, C., (2002) “Implementing Environmental Management Systems in Construction: Lessons from Quality Systems”, Building and Environment, 37:1397-1407.
Oi, Walter (1983) “Heterogeneous Firms and the Organization of Production” Economic Inquiry, 21(2):147-171.
OECD (1999), “OECD Employment Outlook 1999 - Giving youth a better start”, Paris.

27
Romer, Paul (1989) “Human Capital and Growth: Theory and Evidence”, NBER Working Paper No. 3173.
Smith, Adam (1776) “The Wealth of Nations”. Snower, Dennis (1996) “The Low-Skill, Bad-Job Trap”, in A. Booth and D. Snower
(eds.), “Acquiring Skills”, Cambridge: Cambridge University Press.
Tan, Hong (2001) “Do Training Levies Work? Malaysia’s HRDF and its Effects on Training and Firm-level Productivity”, World Bank Working Paper, Washington D.C.: World Bank.
Tan, Hong and Geeta Batra (1995) “Enterprise Training in Developing Countries: Overview of Incidence, Determinants, and Productivity Outcomes”, Private Sector Development Department, Occasional Paper No. 9, Washington, D.C.: World Bank.
Tan, Hong and Gladys Lopez-Acevedo (2003) “Mexico: In-Firm Training for the Knowledge Economy”, World Bank Policy Research Working Paper No. 2957, Washington, D.C.: World Bank.
Van Smoorenburg, M.S.M. and R.K.W. Van der Velden (2000) “The Training of School-leavers: Complementarity or Substitution?” Economics of Education Review, 19(2):207-217
Veum, Jonathan (1995) “Sources of Training and their Impact on Wages”, Industrial and Labor Relations Review, 48(4): 812-826.
White, H. (1980) “A Heteroskedasticity-Consistent Covariance Matrix Estimator and a Direct Test for Heteroskedasticity”, Econometrica, 48: 817–830.
Zeufack, Albert (1998) “Explaining Employer-provided Training Incidence and Intensity in Thai Manufacturing Firms”, Mimeo, Washington D.C.: World Bank.

APPENDIX A: Descriptive Statistics for Analyses Samples
Table A1 Descriptive Statistics for Analyses Samples
Ethiopia Honduras Indonesia Morocco Nicaragua Mean Std. Dev. Mean Std. Dev. Mean Std. Dev. Mean Std. Dev. Mean Std. Dev.Any training 0.224 0.417 0.530 0.500 0.290 0.454 0.165 0.372 0.407 0.492Unskilled training 0.086 0.280 0.224 0.417 0.109 0.312 0.039 0.193 0.139 0.347External training 0.152 0.359 0.263 0.441 0.185 0.388 0.129 0.335 0.238 0.426Any training, proportion trained 0.047 0.154 0.243 0.333 0.082 0.215 0.036 0.141 0.170 0.292Unskilled training, proportion trained 0.017 0.082 0.085 0.214 0.028 0.127 0.011 0.076 0.052 0.170External training, proportion trained 0.008 0.031 0.047 0.146 0.011 0.040 0.012 0.054 0.046 0.122Log(total number of employees) 2.874 1.841 3.268 1.570 5.025 1.657 4.088 1.164 2.761 1.118Education (years) 9.051 3.319 8.206 2.276 7.521 5.623 7.313 3.164 8.854 2.586Capital-Labor Ratio (log) 7.076 2.434 7.464 1.539 0.256 1.563 0.856 1.547 7.012 1.569Foreign ownership 0.035 0.165 0.135 0.329 0.138 0.327 0.164 0.343 0.082 0.259Exporting enterprise 0.049 0.199 0.236 0.391 0.295 0.413 0.436 0.472 0.139 0.297Unionization 0.204 0.404 0.030 0.171 0.523 0.500 0.133 0.339 0.065 0.247ISO certification status 0.025 0.156 0.062 0.242 0.219 0.414 0.045 0.208 0.045 0.207Textiles 0.033 0.179 0.032 0.177 0.204 0.403 0.233 0.423 0.034 0.181Garments 0.088 0.284 0.184 0.388 0.223 0.417 0.374 0.484 0.126 0.332Food 0.265 0.442 0.260 0.439 0.168 0.374 0.095 0.294 0.180 0.384Other 0.613 0.488 0.523 0.500 0.405 0.491 0.298 0.458 0.661 0.474Number of Observations 362 434 677 799 445

APPENDIX B: Training Intensity across various Firm Characteristics
Table B1 Training Intensity, any Training
Ethiopia Honduras Indonesia Morocco Nicaragua Full sample average 0.047 0.243 0.082 0.036 0.170ISO Certification Status: No ISO certification 0.047 0.242 0.053 0.028 0.166Has ISO certification 0.046 0.247 0.188 0.202 0.261Education (Average, Years) < 6 yrs 0.044 0.174 0.038 0.025 0.0836 to 12 0.036 0.253 0.078 0.034 0.17312 and above 0.103 0.301 0.139 0.119 0.270Firm size: 1-15 employees 0.023 0.217 0.013 0.006 0.13316-100 employees 0.079 0.259 0.034 0.034 0.225101-250 employees 0.056 0.241 0.070 0.031 0.191250+ employees 0.091 0.299 0.153 0.080 0.255Unionization: Non-unionized firms 0.038 0.243 0.043 0.033 0.166Unionized firms 0.082 0.222 0.118 0.057 0.222K-L Ratio (2003 prices): Less than USD100 0.015 0.322 0.082 0.036 0.226USD100 or more 0.049 0.239 0.083 0.038 0.166Industry: Textiles 0.108 0.390 0.064 0.045 0.128Garments 0.044 0.291 0.064 0.014 0.109Food 0.064 0.253 0.069 0.044 0.283Other 0.036 0.211 0.107 0.053 0.153Foreign ownership: Less than 10 percent 0.042 0.236 0.066 0.020 0.16310 percent or more 0.136 0.279 0.170 0.096 0.230Exporting share: Less than 10 percent 0.044 0.225 0.051 0.033 0.17610 percent or more 0.086 0.280 0.132 0.038 0.149Number of Observations 362 434 677 799 445

30
Table B2 Training Intensity, Training of Unskilled Workers
Ethiopia Honduras Indonesia Morocco NicaraguaFull sample average 0.017 0.085 0.028 0.011 0.052ISO Certification Status: No ISO certification 0.017 0.088 0.013 0.009 0.050Has ISO certification 0.021 0.047 0.082 0.062 0.083Education (Average, Years) < 6 yrs 0.018 0.099 0.006 0.016 0.0206 to 12 0.013 0.082 0.033 0.009 0.05812 and above 0.033 0.086 0.048 0.010 0.046Firm size: 1-15 employees 0.012 0.059 0.000 0.004 0.03716-100 employees 0.022 0.094 0.011 0.008 0.080101-250 employees 0.019 0.107 0.006 0.009 0.011250+ employees 0.028 0.150 0.059 0.037 0.060Unionization: Non-unionized firms 0.015 0.085 0.014 0.011 0.049Unionized firms 0.025 0.088 0.041 0.013 0.094K-L Ratio (2003 prices): Less than USD100 0.011 0.051 0.029 0.011 0.046USD100 or more 0.017 0.087 0.000 0.000 0.052Industry: Textiles 0.031 0.179 0.026 0.013 0.012Garments 0.016 0.123 0.014 0.007 0.054Food 0.032 0.083 0.014 0.029 0.120Other 0.010 0.067 0.043 0.010 0.034Foreign ownership: Less than 10 percent 0.016 0.075 0.019 0.005 0.04910 percent or more 0.031 0.141 0.075 0.035 0.073Exporting share: Less than 10 percent 0.017 0.074 0.013 0.005 0.05010 percent or more 0.020 0.108 0.052 0.017 0.055Number of Observations 362 434 677 799 445

31
Table B3 Training Intensity, Training by External Providers
Ethiopia Honduras Indonesia Morocco NicaraguaFull sample average 0.008 0.047 0.011 0.012 0.046ISO Certification Status: No ISO certification 0.008 0.048 0.009 0.008 0.045Has ISO certification 0.013 0.030 0.020 0.085 0.064Education (Average, Years) < 6 yrs 0.002 0.028 0.004 0.003 0.0176 to 12 0.008 0.048 0.009 0.015 0.04712 and above 0.016 0.094 0.021 0.032 0.078Firm size: 1-15 employees 0.004 0.041 0.000 0.003 0.03716-100 employees 0.007 0.062 0.005 0.012 0.060101-250 employees 0.029 0.028 0.031 0.011 0.036250+ employees 0.015 0.045 0.013 0.019 0.081Unionization: Non-unionized firms 0.005 0.047 0.008 0.010 0.045Unionized firms 0.019 0.066 0.014 0.022 0.061K-L Ratio (2003 prices): Less than USD100 0.003 0.052 0.011 0.011 0.051USD100 or more 0.008 0.047 0.002 0.038 0.046Industry: Textiles 0.002 0.047 0.003 0.012 0.041Garments 0.007 0.074 0.014 0.003 0.003Food 0.006 0.042 0.008 0.008 0.091Other 0.009 0.041 0.014 0.023 0.042Foreign ownership: Less than 10 percent 0.007 0.045 0.010 0.007 0.04510 percent or more 0.028 0.061 0.018 0.029 0.051Exporting share: Less than 10 percent 0.007 0.042 0.014 0.015 0.04610 percent or more 0.016 0.058 0.006 0.009 0.045Number of Observations 362 434 677 799 445