Embed Size (px)
Citation preview
1
Managing and Measuring
Financial Risk in Practice
CIMPA School MarrakechAvril 2007
Nicole El Karoui,Ecole Polytechnique
2
What is Risk
!Risk exists if there is something you don’t want to happen – having a chance to happen!!!
! Risk is measured in terms of consequences on yourbusiness and in terms of likelihood.! Often defined as the standard deviation of the return oftotal investment. ! Degree of uncertainty of return on an asset.! Insurance and financial business are based on riskypositions
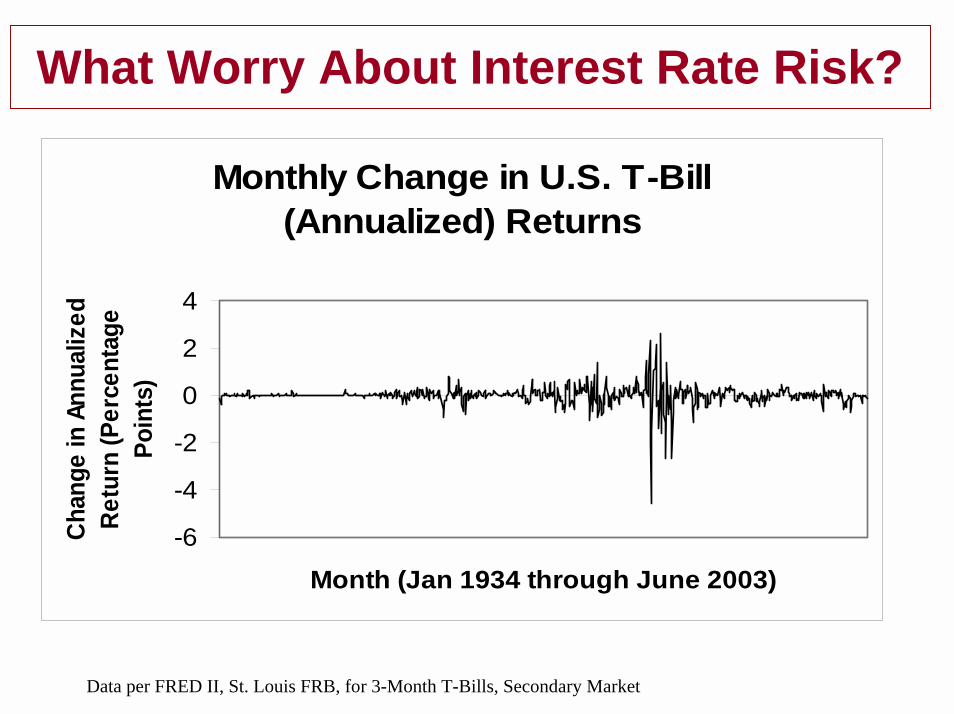
What Worry About Interest Rate Risk?
Monthly Change in U.S. T-Bill (Annualized) Returns
-6
-4
-2
0
2
4
Month (Jan 1934 through June 2003)
Chan
ge in
Ann
ualiz
ed
Retu
rn (P
erce
ntag
e Po
ints
)
Data per FRED II, St. Louis FRB, for 3-Month T-Bills, Secondary Market
4
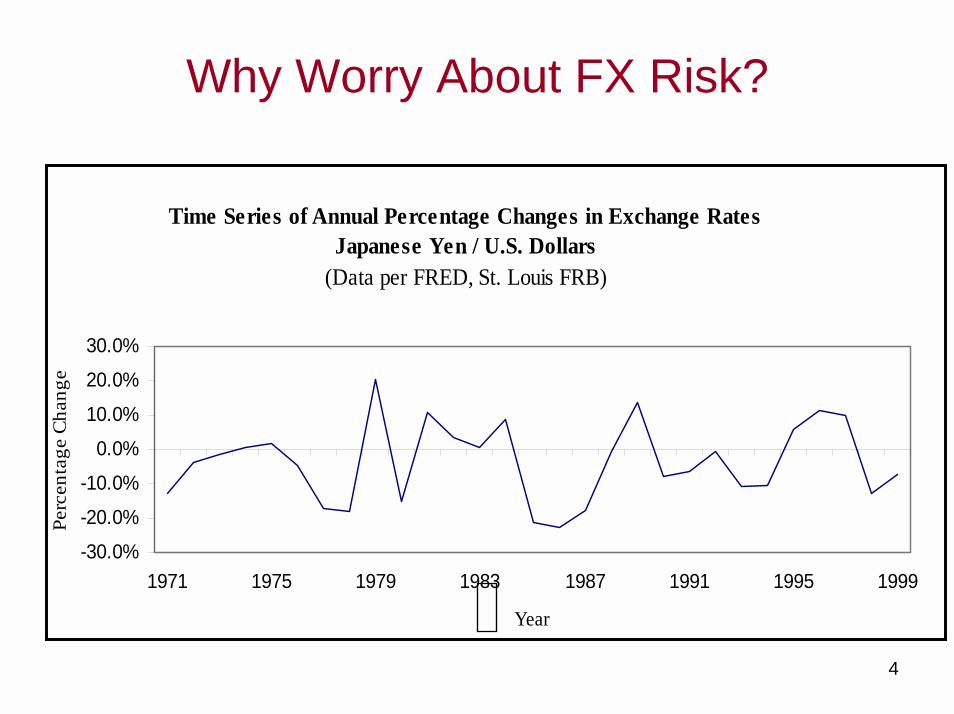
Why Worry About FX Risk?
Time Series of Annual Percentage Changes in Exchange RatesJapanese Yen / U.S. Dollars
(Data per FRED, St. Louis FRB)
-30.0%
-20.0%
-10.0%
0.0%
10.0%
20.0%
30.0%
1971 1975 1979 1983 1987 1991 1995 1999
Year
Perc
enta
ge C
hang
e
5
New Risks Examples
!Loss of Reputation – business scandals
!Currency swings and the effects of a falling dollar, ��
!Globalization��
!Business failures, and credit risk
!Blow-ups of markets and firms
!Natural and man-made disasters (e.g., industrialaccidents, transport calamities)
6
Reactions to Risks! Litigation and law suits
!�� Government regulation
!�� Businesses become more risk-averse
!�� Higher insurance costs
!�� Some governments take a more cost-benefitapproach; others put more emphasis on precautions (“better safe than sorry”)
7
Positive Evolution
!Some risks have become smaller, and more risk isknown today
! New instruments allow to shift some others to other people. (Derivatives Market)
! Workplaces, the wider environment, and manydiseases have become less hazardous
!Greater focus on corporate governance
8
Five Primary Means of Risk Management
Reduce1. Reduce the probability that the event will occur2. Reduce the impact if the event does occur
Transfer3. Transfer the cost of an undesirable outcome to
someone elseAvoid
4. Completely avoid potential events thus providing a zero probability that they will occur
Do Nothing5. Let the risk happen and be ready to bear the
consequences.
9
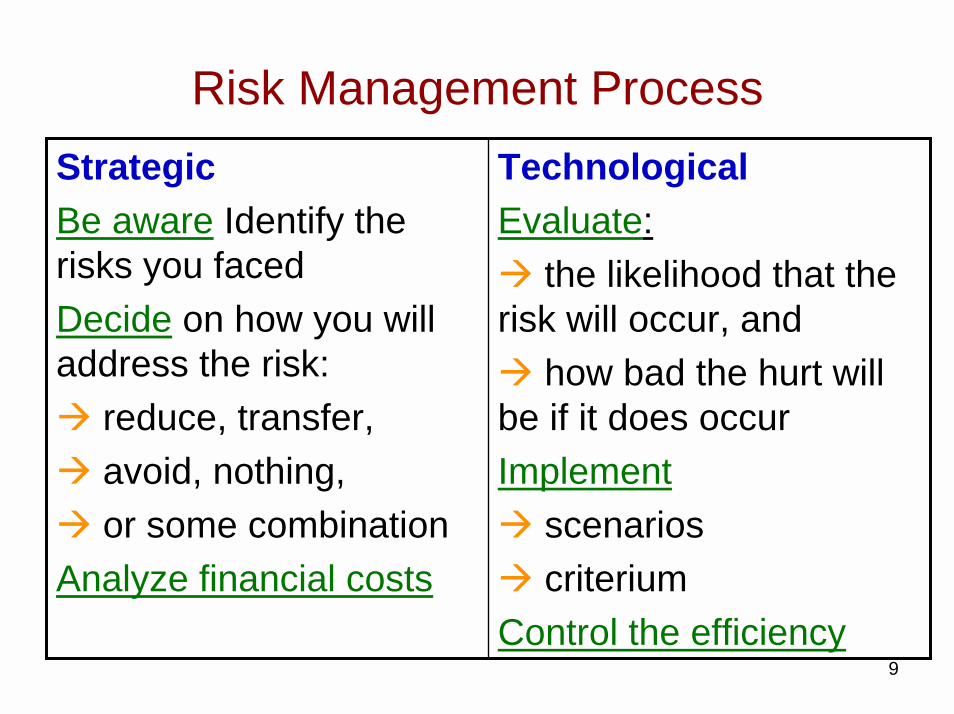
Risk Management ProcessTechnologicalEvaluate:" the likelihood that the risk will occur, and " how bad the hurt will be if it does occurImplement" scenarios" criteriumControl the efficiency
StrategicBe aware Identify therisks you facedDecide on how you will address the risk:" reduce, transfer, " avoid, nothing, " or some combinationAnalyze financial costs
10
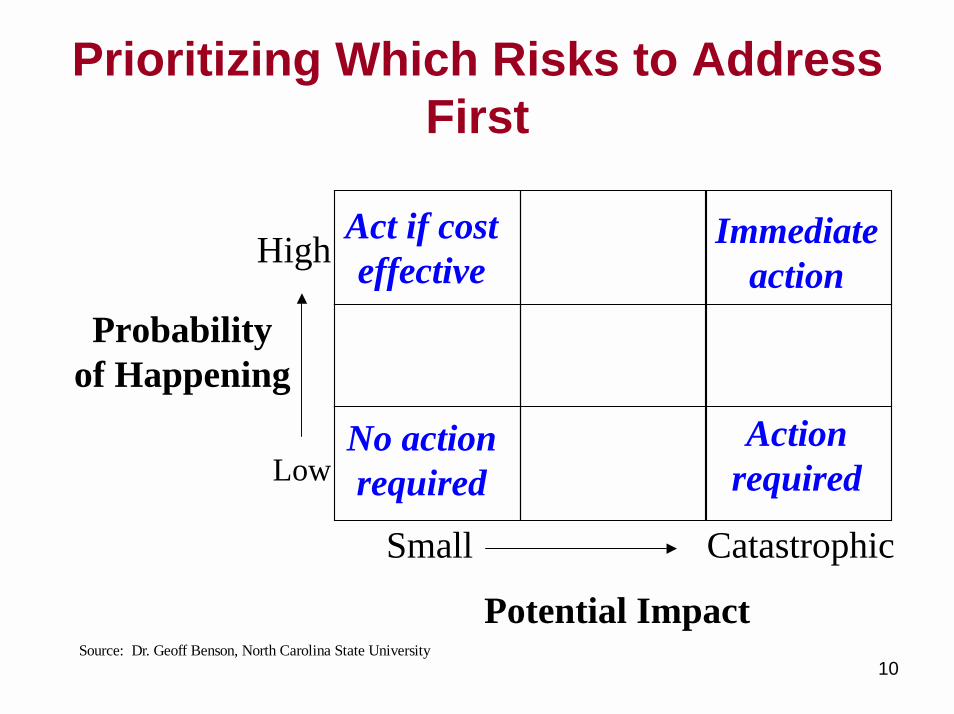
Prioritizing Which Risks to Address First
Probability of Happening
Act if cost effective
No action required
Immediate action
Action required
Small Catastrophic
High
Low
Potential ImpactSource: Dr. Geoff Benson, North Carolina State University
11
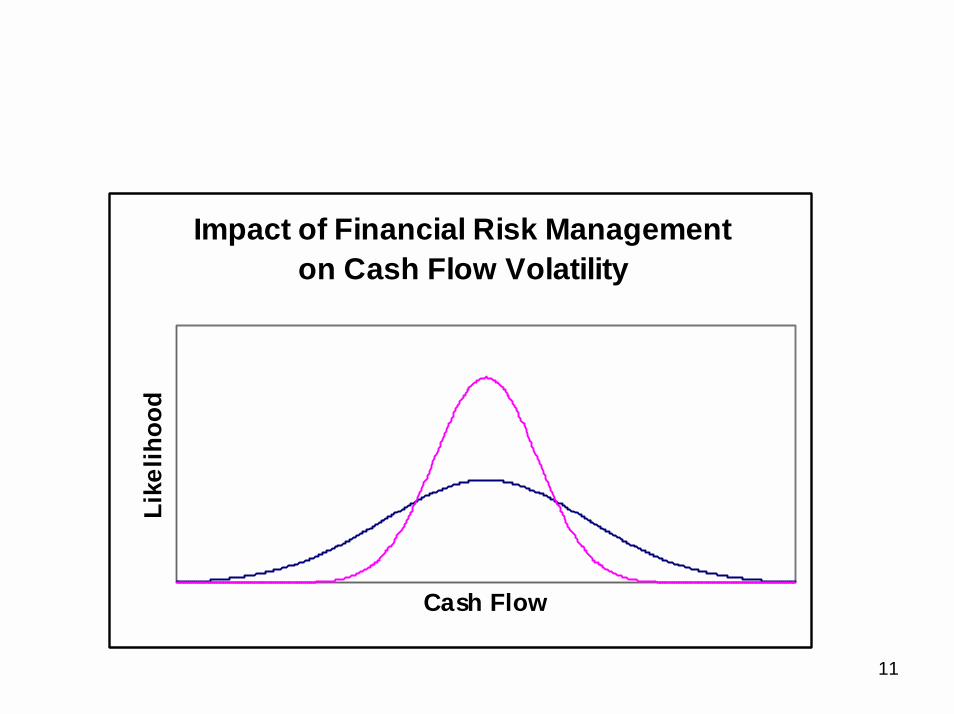
Impact of Financial Risk Managementon Cash Flow Volatility
Cash Flow
Like
lihoo
d
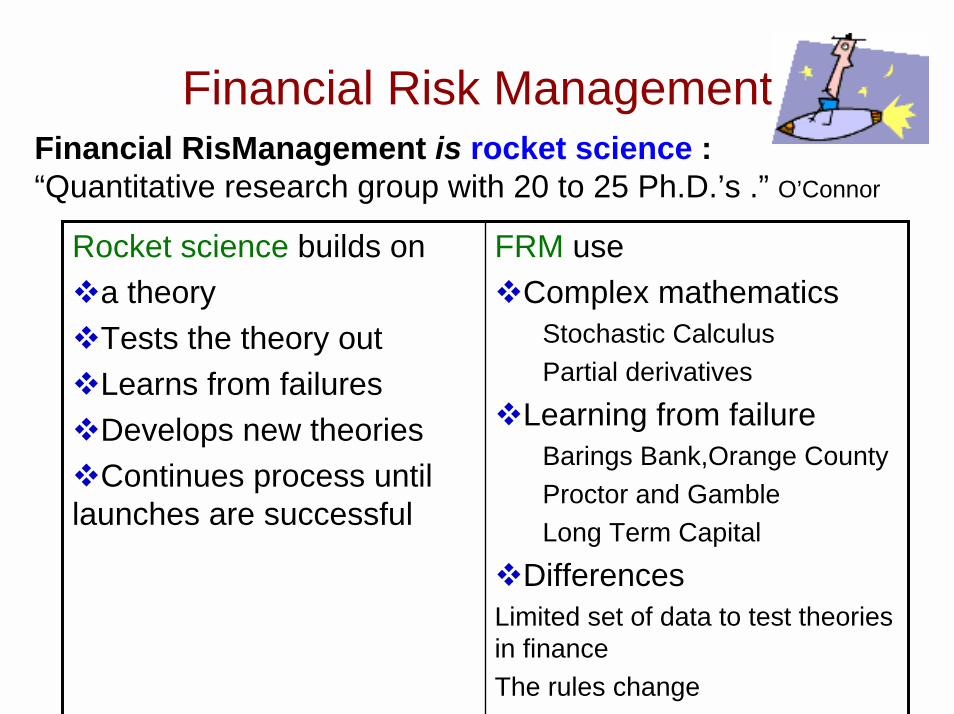
Financial Risk Management
FRM use !Complex mathematics
Stochastic CalculusPartial derivatives
!Learning from failureBarings Bank,Orange CountyProctor and GambleLong Term Capital
!DifferencesLimited set of data to test theoriesin financeThe rules change
Rocket science builds on !a theory!Tests the theory out!Learns from failures!Develops new theories!Continues process untillaunches are successful
Financial RisManagement is rocket science :“Quantitative research group with 20 to 25 Ph.D.’s .” O’Connor
13
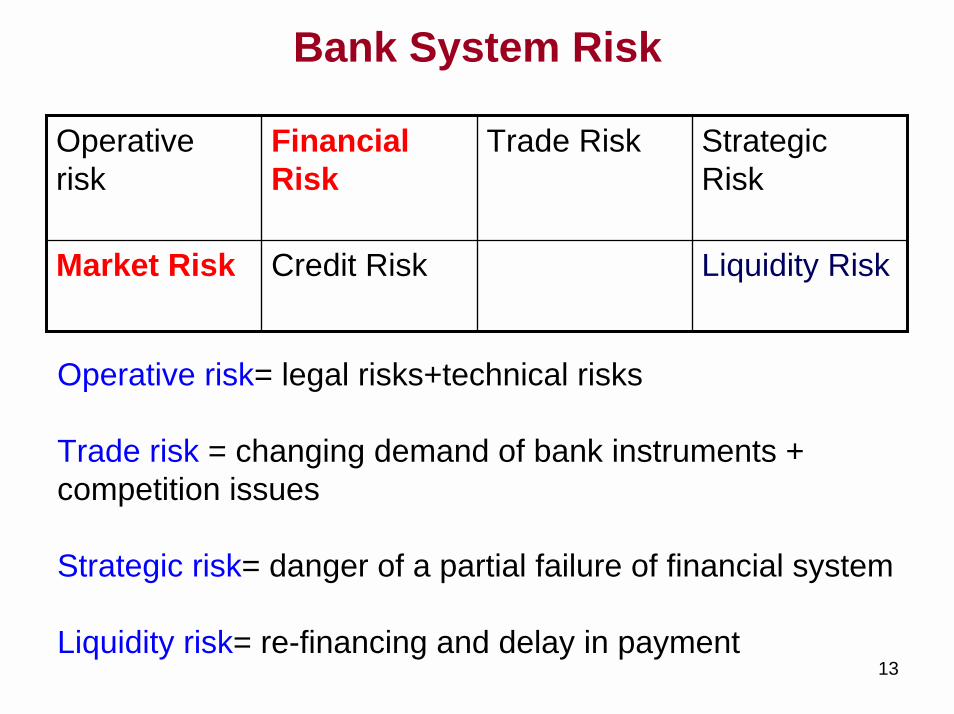
Bank System Risk
Liquidity RiskCredit RiskMarket Risk
Strategic Risk
Trade RiskFinancial Risk
Operative risk
Operative risk= legal risks+technical risks
Trade risk = changing demand of bank instruments + competition issues
Strategic risk= danger of a partial failure of financial system
Liquidity risk= re-financing and delay in payment
14
Risk Measurement in Portfolio Management
# The Markowitz’s pioneering work (1959) investigated the appropriate definition and measurement of risk on portfolio selection, essentially based on risk =variance and return.
#In 1993-97, the growth of trade activity and instances of financial instability impose the need to develop reliable risk measurement techniques.
#Value at Risk is emerging as the industry standard of integrated risk management by choice or by regulation.
#V@R models aggregate the several components of price risk into a single quantitative measure.
15
Regulation and V@R# Recognition of such models by the financial and regulatory communities are obvious since 1997, where the SEC and the Basle Committee endorsed the use of V@R models.#This allows large banks the option to use a Value at Risk measure to set the capital reserves necessary to cover their market risk positions.#Regulators expect social benefit in reducing the likehood of large-scale financial failures.#V@R is usually a statistically calculated risk measurement, offering a degree of practical interpretability often lacking in other risk measures.#V@R builts an information report to apprise senior management of the risk run by trading instrument
16
Controlling traders positions
In order to ensure that all traders act in the best interests of the firm,
#the risk philosophy is known as « the limits »: stating what instruments are allowed to be traded, and by whom and in what amount .
#Decide whether to close the position or not when the limits are reached

17
II - What is the price of the portfolio ?
18
What is the price of the portfolio ?
Three sources :! Organized markets for listed products (stocks, some options on stocks,...)
! Brokers for standard products
! Models for exotic products and more generally when no market price is available
19
Uncertainty sources
Prices are on uneven quality : eg! a stock quote given by a stock exchange may beseveral weeks old, if there were no exchanges on it,! two brokers may give two different prices.Liquidity:! To sell (or to buy) a stock will not affect the market,
but to sell in one day several times the average daily volume will make the stock plummet.
!The liquidation value of a stock is not equal to theproduct quantity * quote, but is often less than it.
20
Model Risk!When no market prices exist, in particular for exoticproducts, models need to be used (e.g Black andScholes)
!No pricing model is acknowledged by everyone; someuncertainty exists as soon as one uses a model.
!Given all these points, one cannot give the price of theportfolio with certainty, ie the quoted market price.
! A « mid-market » result will be computed, from whicha provision will be deducted.
21
IV - TheValue-at-Risk
22
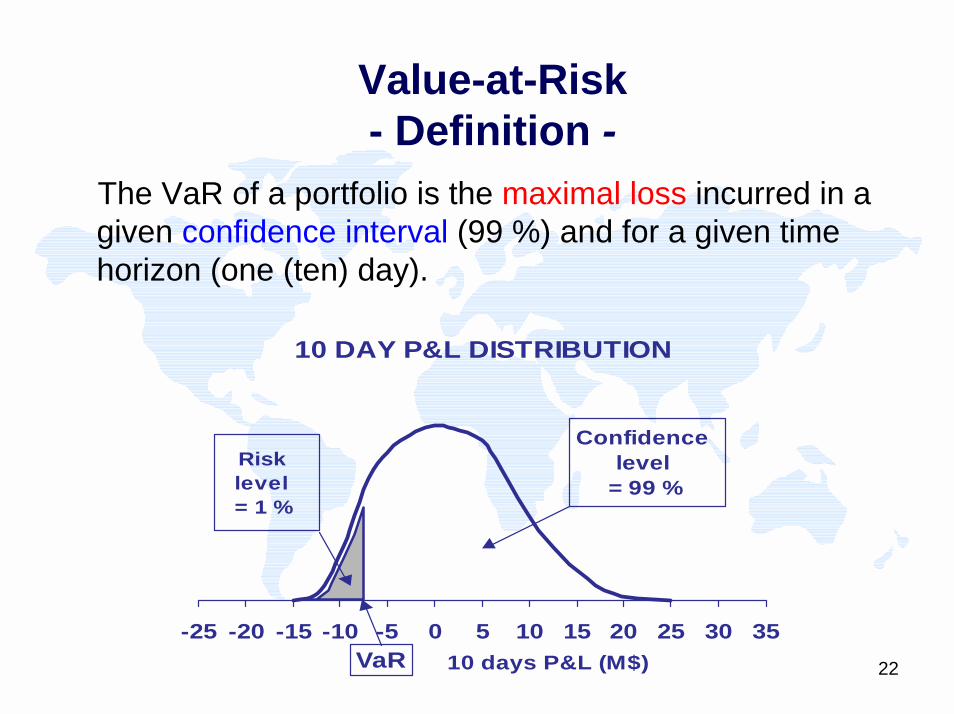
Value-at-Risk - Definition -
10 DAY P&L DISTRIBUTION
-25 -20 -15 -10 -5 0 5 10 15 20 25 30 3510 days P&L (M$)
Risk level = 1 %
Confidence level
= 99 %
VaR
The VaR of a portfolio is the maximal loss incurred in a given confidence interval (99 %) and for a given time horizon (one (ten) day).
23
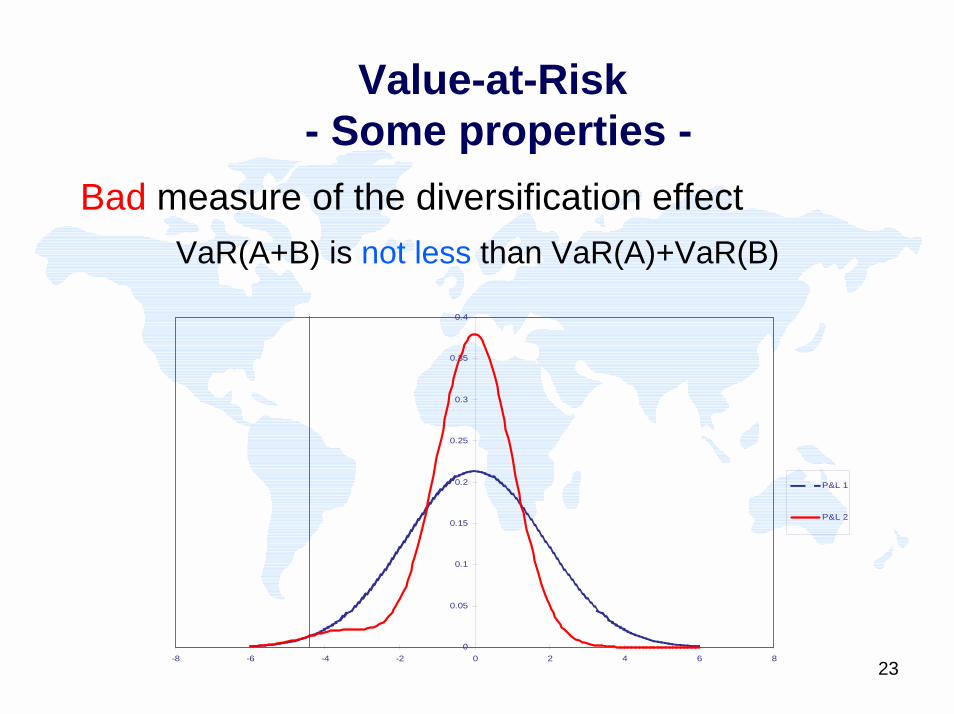
Value-at-Risk- Some properties -
Bad measure of the diversification effectVaR(A+B) is not less than VaR(A)+VaR(B)
0
0.05
0.1
0.15
0.2
0.25
0.3
0.35
0.4
-8 -6 -4 -2 0 2 4 6 8
P&L 1
P&L 2
24
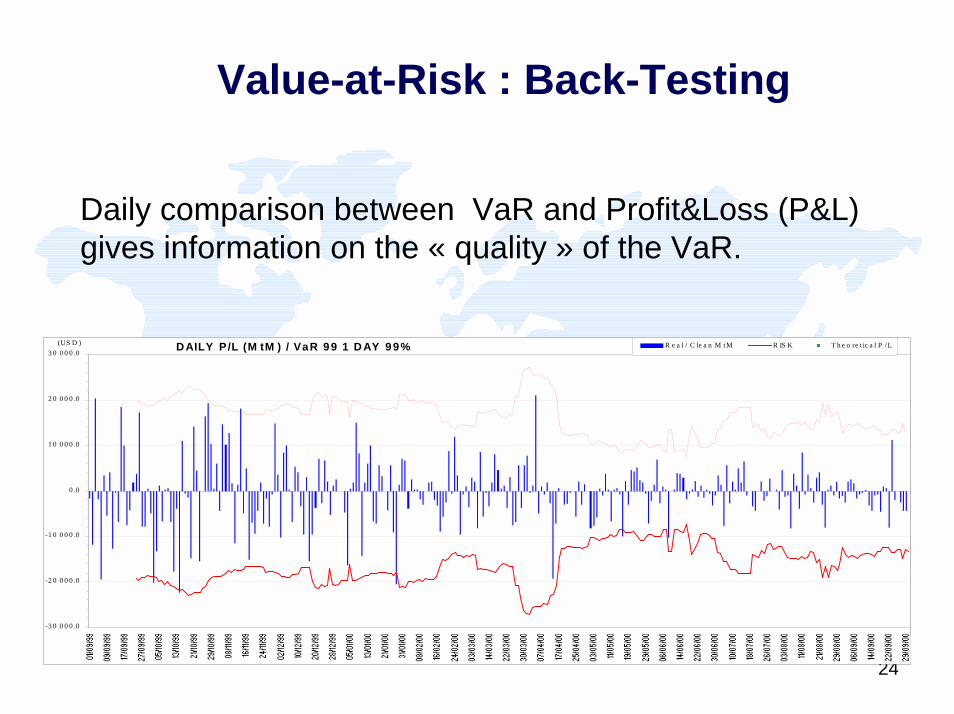
Value-at-Risk : Back-Testing
Daily comparison between VaR and Profit&Loss (P&L) gives information on the « quality » of the VaR.
D AILY P/L (M tM ) / VaR 9 9 1 D AY 9 9%
-3 0 0 0 0 .0
-2 0 0 0 0 .0
-1 0 0 0 0 .0
0 .0
1 0 0 0 0 .0
2 0 0 0 0 .0
3 0 0 0 0 .0(US D ) R e a l / C le a n M t M R IS K T h e o re t ic a l P / L
25
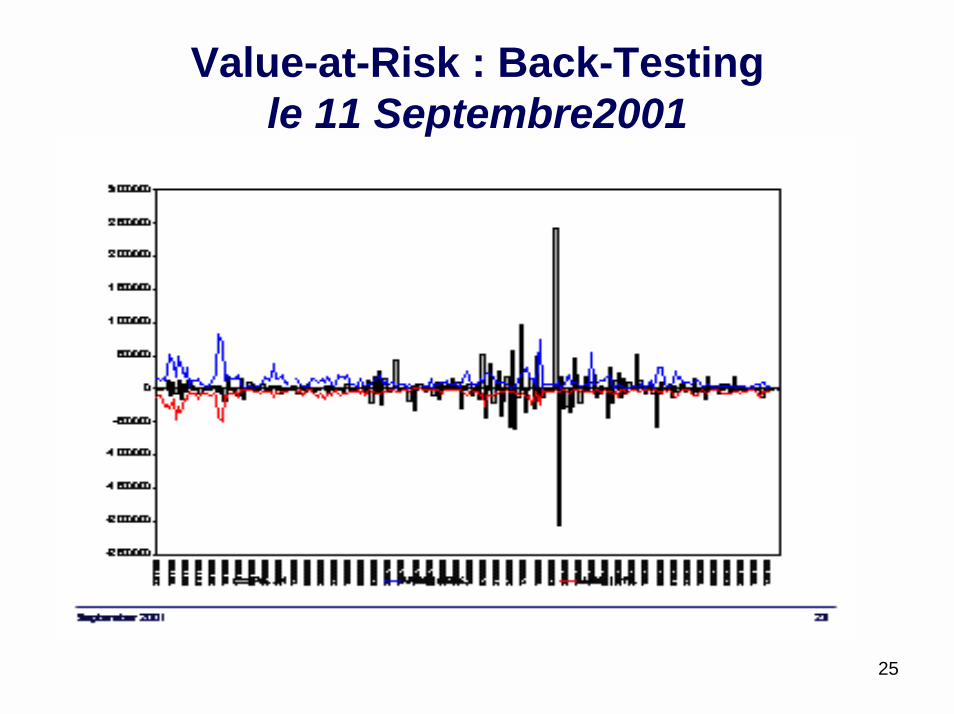
Value-at-Risk : Back-Testing le 11 Septembre2001
26
Value-at Risk Back-testing
If real losses are often more important than the VaR, regulators will not accept its use.! Conversely, if the VaR is much bigger than actuallosses, there will be overestimation of proper funds, andprofitability loss.
!Main official texts :
! Bank for International Settlements (Basel Comity text1997) : www.bis.org
! Fed Reserve, Market Authority in France : www.banque-france.fr
! see also www.gloriamundi.org
27
Value-at-Risk- back-testing (cont ’ed) -
Main official texts :
! Bank for International Settlements (Basel Comity text 1997) : www.bis.org
! Fed Reserve, Market Authority in France : www.banque-france.fr
! see also www.gloriamundi.org
28
Value-at-Risk Computing methods
There are two ways for computing the VaR :
# Analytic
#Simulation! - historic! - Monte-Carlo
29
Value-at-Risk- common first step : risk factors choice
Regulators give minimal constraints.
! But the risk manager has to make choices which mayhave important consequences:
# What kind of interest rates?
# How to distort a curve or a surface ?
! The back-testing constraint can lead to extra riskfactors linked to specific activities (e.g, volatilityarbitrage).
30
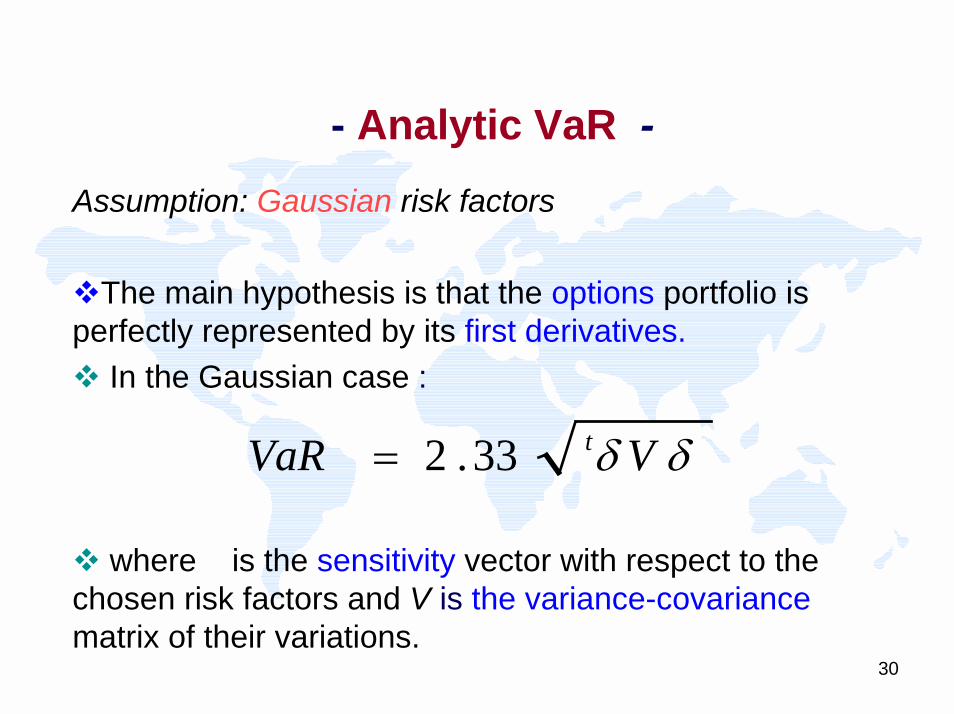
- Analytic VaR -Assumption: Gaussian risk factors
!The main hypothesis is that the options portfolio isperfectly represented by its first derivatives.! In the Gaussian case :
! where is the sensitivity vector with respect to thechosen risk factors and V is the variance-covariancematrix of their variations.
δδ VVaR t33.2=
31
Historical Value-at-Risk
Computing steps are :! make datasets of the risk factors’ variations,
!« apply » them to the risk factors today in order to get their possible evolutions,
!for each possible evolution, compute theassociated P&L, and then the 1%-quantile : the VaR. (On 260 data, the 3rd worst P&L)
32
Historical VaR : hypotheses & properties -
Using historical VaR, ! It allows to measure the risks of non-linear portfolios(i.e containing options).
! Theoretically, the historical VaR convergence is bad(estimation of 1% quantile with only 260 data).
! Practically , it is acceptable. One reason might be thenon-independence of daily variations.
! we need to assume something about risk factors, as stationarity.
33
Monte-Carlo VaR
Similar Methodology to historical VaR, but
! Historical variations are replaced by simulated ones,
! Using statistical estimates of factors distribution
Possibility to simulate the default of an issuer.
34
Monte Carlo VaR : hypotheses & properties
Imprecision sources are :! Choices of the diffusion (non necessarilyGaussian) and estimation of its parameter,
!Quantile estimation by simulations.!This error can be reduced by using a large number of simulations. !In the linear Gaussian case, the first one isalso small.
! Precision is quite good.
35
Importance of market datasets -
!These three methods are « statistical » methods
!They need market datasets that are hard to build
! Depending on the activity, errors in the datasets may have more or less important consequences.
36
Numerical Example(Historical V@R)
!Statistical scenario based on historical data:1year!Confidence Level 99%!Holding period 10 days!Potential loses : 4,9%
!Currencies : 34%!Interest rates: 2%!Volatility: 5%!Equities:59%
37
Numerical Example(Worst Case)
!Historical maximal value scenario : largest daily chnages in the risk factors from 1987data!Holding period 10 days!Potential loses : 9,4%
!Currencies : 13%!Interest rates: 3%!Volatility+Equities: 84%
38
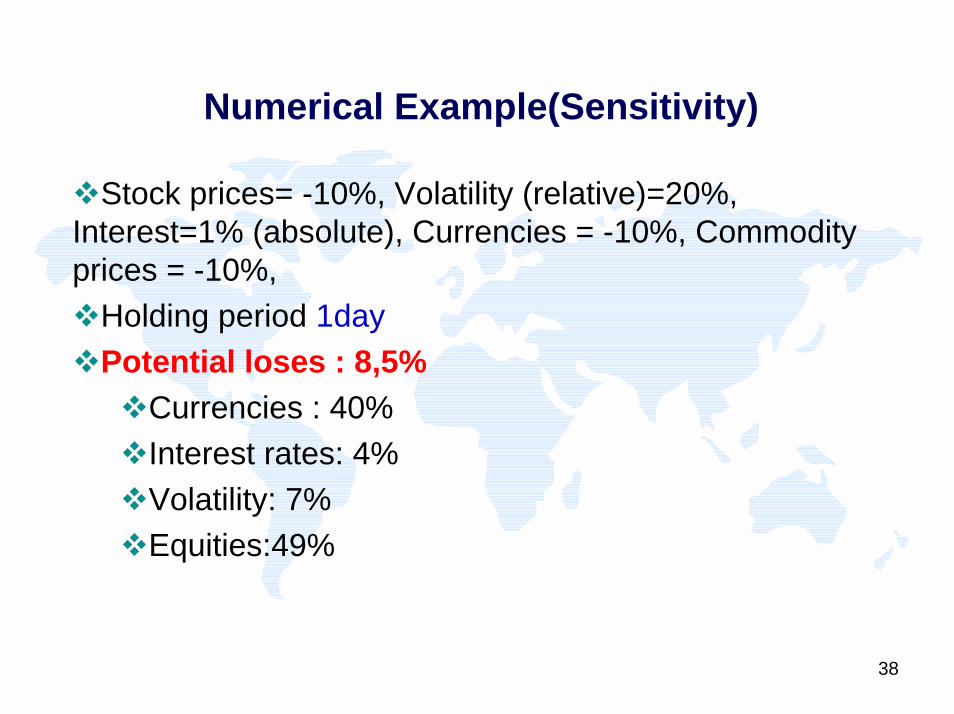
Numerical Example(Sensitivity)
!Stock prices= -10%, Volatility (relative)=20%, Interest=1% (absolute), Currencies = -10%, Commodity prices = -10%, !Holding period 1day!Potential loses : 8,5%
!Currencies : 40%!Interest rates: 4%!Volatility: 7%!Equities:49%
39
Conclusion
Developing an efficient risk management is a challenging task of financial institutions.
!Both Academics and Practitioners are working on the concept of risk measures,
! and on new numerical methods for large portfolios
! Take into account other risks, like operational risk.
40
Similarities Between Rocket Science andFinancial Risk Management
#Complex mathematics!Stochastic Calculus!Partial derivatives!Probability
# Learning from failure!Barings Bank!Orange County!Proctor and Gamble!Long Term Capital
Differences Between Rocket Science andFinancial Risk Management
#FRM researchers can’t hold other variables constant
# Limited set of data to test theories in finance#The rules change
“Every time I find the key, they change the lock.”Kevin Waspi, Finance Professor, University of Illinois
43
Agenda
The new concept of Market Manager
# controlling traders positions
# validating models used by traders
# helping the “Middle Office” to compute the market
value of the market portfolio
# informing the upper management about financial price
risks
44
II - What is a pricing model ?
45
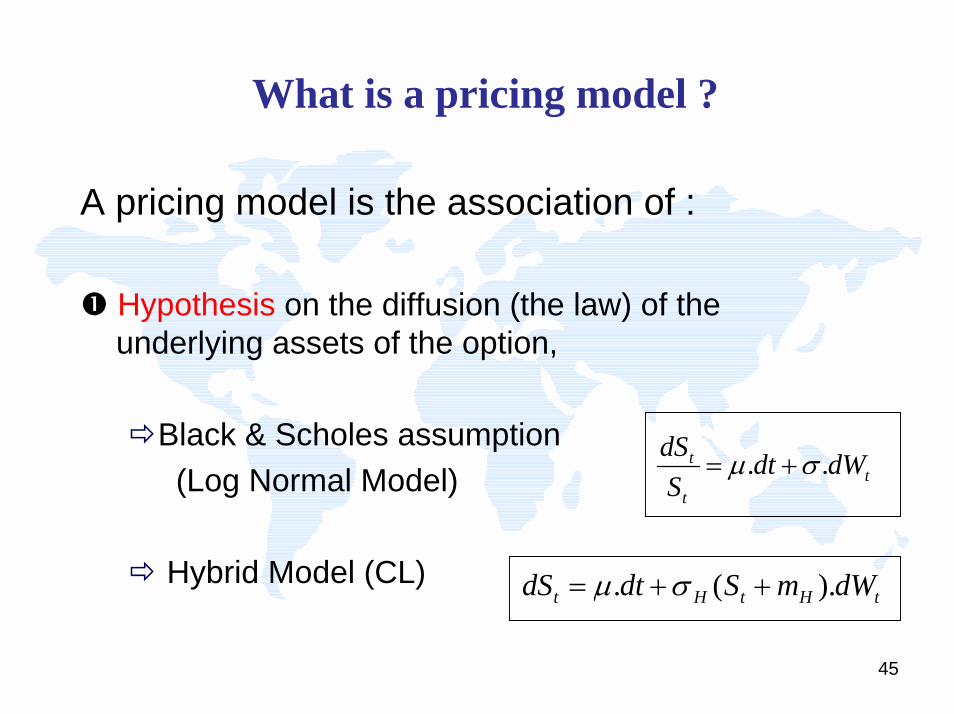
What is a pricing model ?
A pricing model is the association of :
$ Hypothesis on the diffusion (the law) of the underlying assets of the option,
%Black & Scholes assumption (Log Normal Model)
% Hybrid Model (CL)
tt
t dWdtS
dS .. σµ +=
tHtHt dWmSdtdS ).(. ++= σµ
46
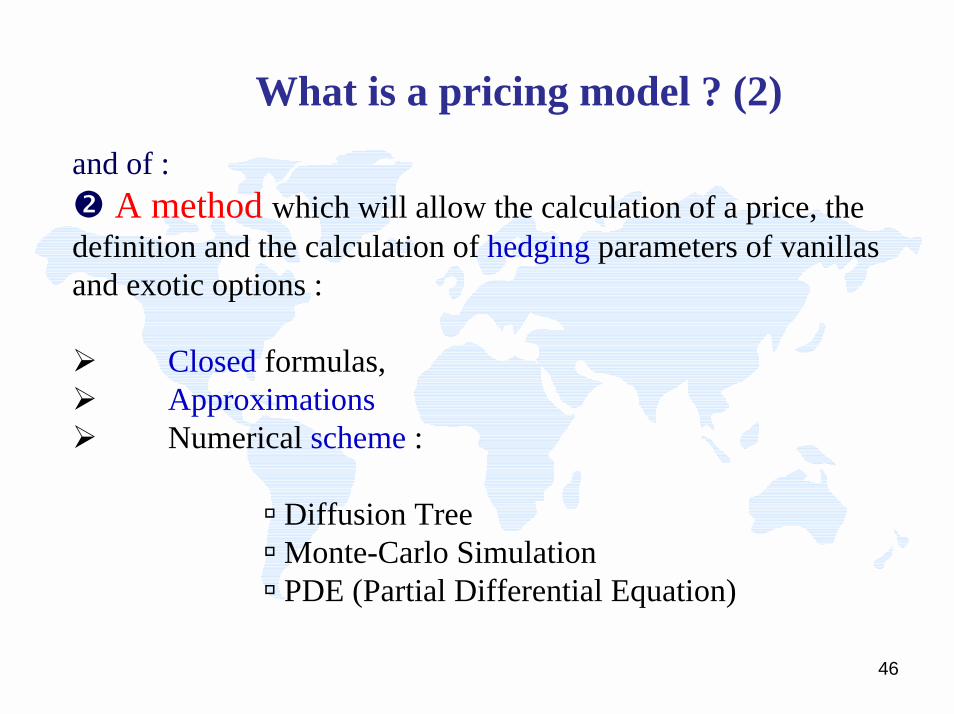
What is a pricing model ? (2)and of :& A method which will allow the calculation of a price, the definition and the calculation of hedging parameters of vanillas and exotic options :
# Closed formulas, # Approximations# Numerical scheme :
' Diffusion Tree' Monte-Carlo Simulation' PDE (Partial Differential Equation)
47
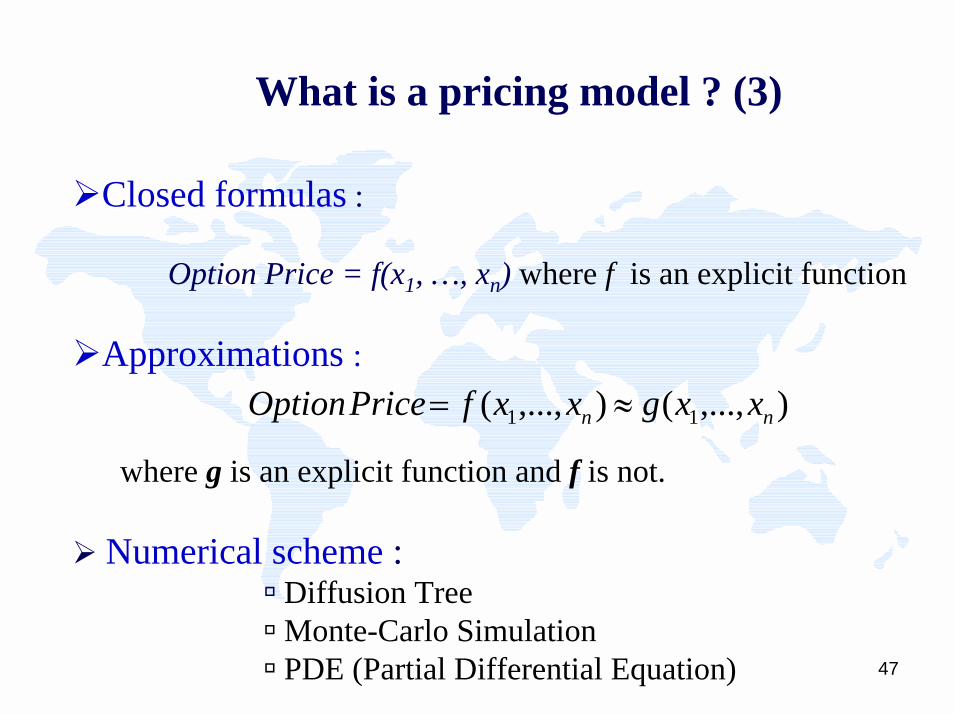
What is a pricing model ? (3)
#Closed formulas :
Option Price = f(x1, …, xn) where f is an explicit function
#Approximations :
where g is an explicit function and f is not.
# Numerical scheme :' Diffusion Tree' Monte-Carlo Simulation' PDE (Partial Differential Equation)
),...,(),...,( 11 nn xxgxxfPrice Option ≈=
48
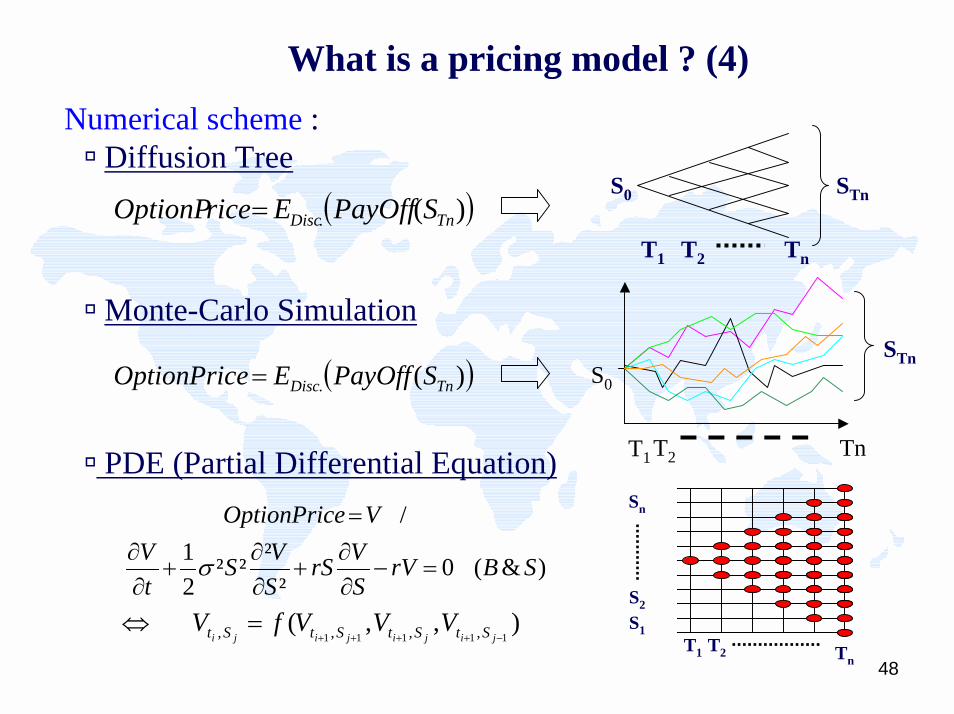
What is a pricing model ? (4)Numerical scheme : ' Diffusion Tree
' Monte-Carlo Simulation
' PDE (Partial Differential Equation)
S0
T1 TnT2
STn( ))(. TnDisc SPayOffEriceOptionP =
S0
TnT2T1
STn( ))(. TnDisc SPayOffEriceOptionP =
)&(0²
²²²21
/
SBrVSVrS
SVS
tV
VriceOptionP
=−∂∂
+∂∂
+∂∂
=
σ
S1
Sn
S2
T1 T2 Tn
),,(11111 ,,,, −++++
=⇔jijijiji StStStSt VVVfV
49
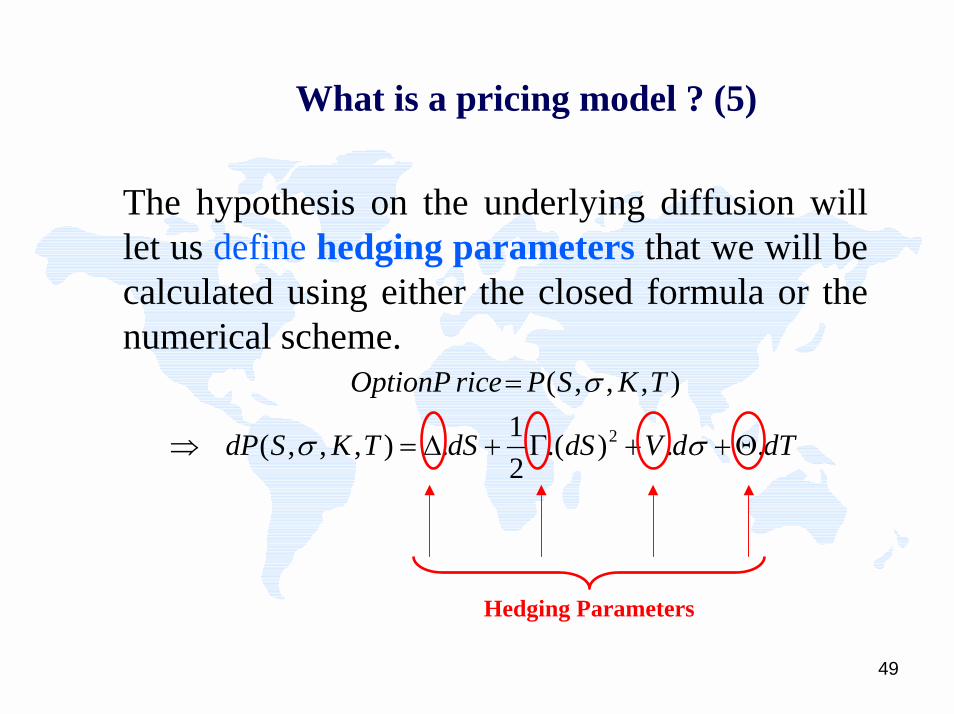
What is a pricing model ? (5)
The hypothesis on the underlying diffusion will let us define hedging parameters that we will be calculated using either the closed formula or the numerical scheme.
dTdVdSdSTKSdP
TKSPriceOptionP
..).(21.),,,(
),,,(
2 Θ++Γ+∆=⇒
=
σσ
σ
Hedging Parameters
50
What is a pricing model ? (5)
#For example, the definition of the volatility, and as a consequence the calculation of the Vega of a portfolio, is made through the Black&Scholes assumption.
#The hedging point of view is the main contribution of Black, Scholes and Merton (1973) to Louis Bachelier’s work (1900).
(The links between pricing and hedging will be developed in the sequel.)

51
III - What will be the price of the portfolio tomorrow
52
Price of portfolio evolution
It is not about ! foreseeing trends,
but about
! giving information on the distribution ( of possible gains and losses ( in fews of days.
53
Portfolio Price Evolution- 1. Risk Factors -
A first list is quite easy to make :
! interest rates, cross-currency rates,(100)! stock prices, (6000)! Implied volatilities,! counterpart risks,!...!Approximately N=10 000 variables
54
Standard Risk Indicators
Widely used indicators are:
! Expected daily variation with associated standard deviation
! For derivatives, sensitivities, generally Greeks.
! Stress scenarii.
55
Standard Risk Indicators(cont ’ed)
Their drawbacks:
! they are not using a single figure to summarize theglobal risk of a given portfolio,
! they do not allow us to have homogeneous riskmeasures for different activities.
They must be adapted to individual management strategies.
56
Portfolio price evolution - 3. toward Value-at-Risk -
Global and homogeneous risk measures are nevertheless necessary
! to give a unique « meaningful » indicator on theaggregated portfolio
! to fairly assign to each activity funds to cover inducedrisks.
Regulators have thus thoughts after a new method for estimation of market risks.