Embed Size (px)
DESCRIPTION
A comparison of the down valley flow for the MAP IOP8 and IOP3 with the numerical laboratory Mesonh model. Nicole Asencio, Joël Stein and Michel Chong. CNRM Météo-France and Laboratoire d’Aérologie. Presentation. Introduction and numerical set-up. IOP3 and IOP8 rain and wind validations. - PowerPoint PPT Presentation
Citation preview
A comparison of the down valley A comparison of the down valley flow for the MAP IOP8 and IOP3 flow for the MAP IOP8 and IOP3
with the numerical laboratory with the numerical laboratory Mesonh model.Mesonh model.
Nicole Asencio, Joël Stein and Michel Chong
CNRM Météo-France and Laboratoire d’Aérologie.
PresentationPresentation
• Introduction and numerical set-up.
• IOP3 and IOP8 rain and wind validations.
• Mesonh numerical laboratory to compare IOP8 and IOP3 reversal flow origins.
• conclusion
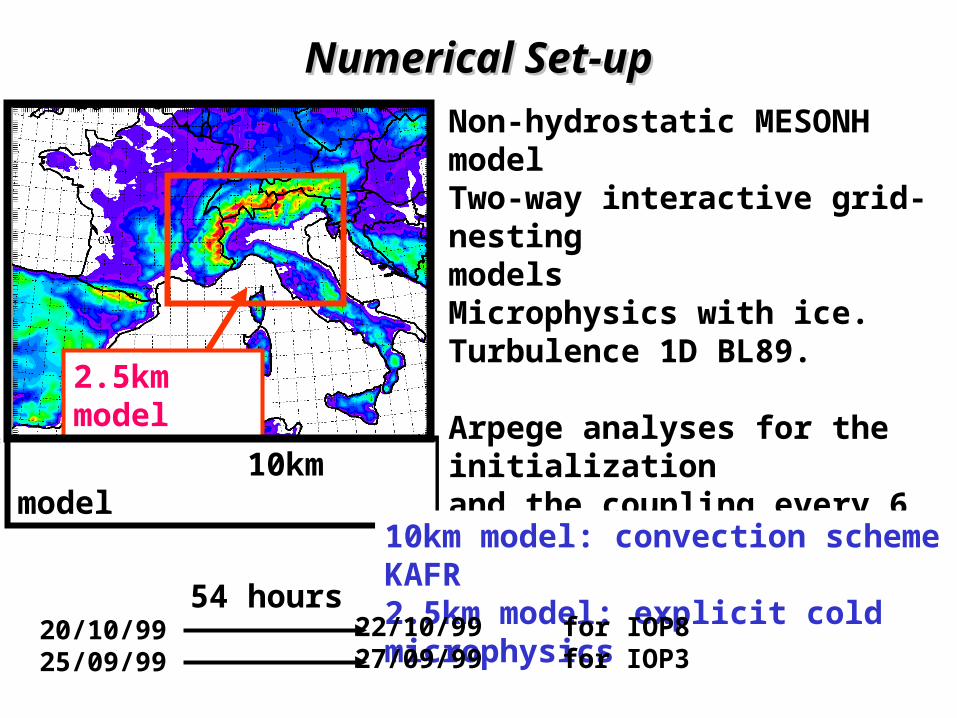
Numerical Set-upNumerical Set-up
10km model
2.5km model
Non-hydrostatic MESONH modelTwo-way interactive grid-nesting modelsMicrophysics with ice.Turbulence 1D BL89.
Arpege analyses for the initializationand the coupling every 6 hours.
10km model: convection scheme KAFR2.5km model: explicit cold microphysics
20/10/9925/09/99
22/10/99 for IOP827/09/99 for IOP3
54 hours
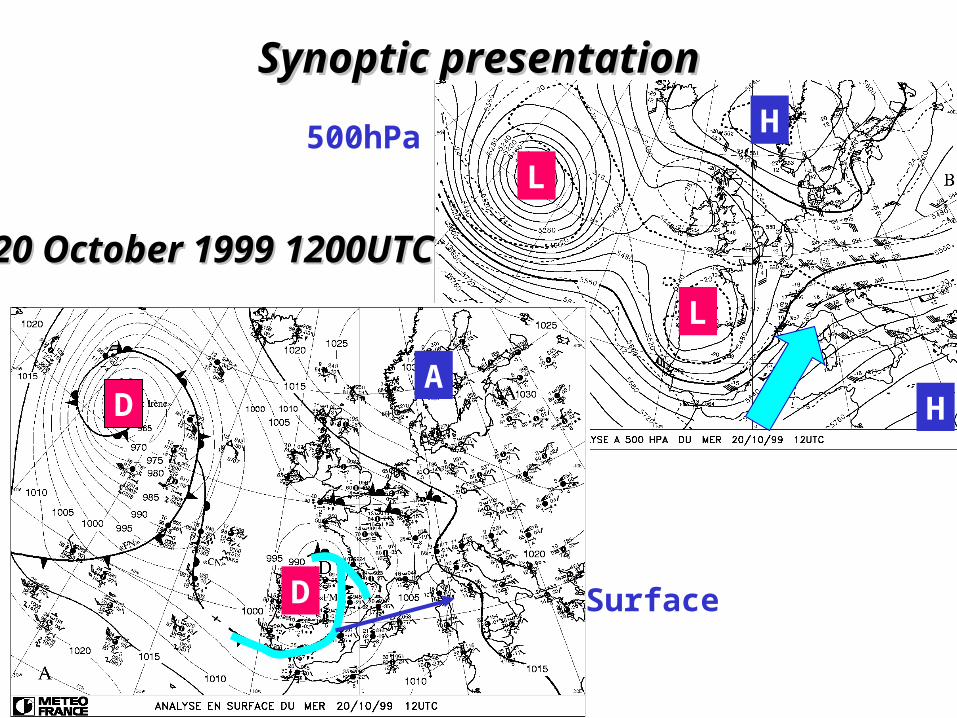
Synoptic presentationSynoptic presentation
500hPa
Surface
D
D
L
L
A
H
H
20 October 1999 1200UTC20 October 1999 1200UTC
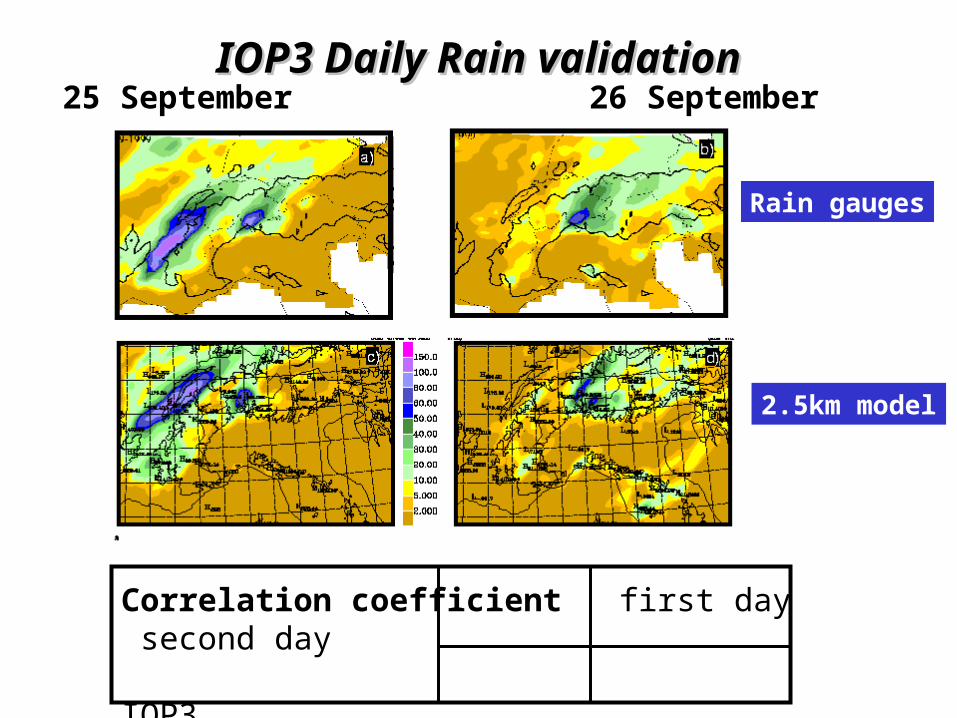
IOP3 Daily Rain validationIOP3 Daily Rain validation25 September 26 September
Rain gauges
2.5km model
Correlation coefficient first day second day
IOP3 0.63 0.81
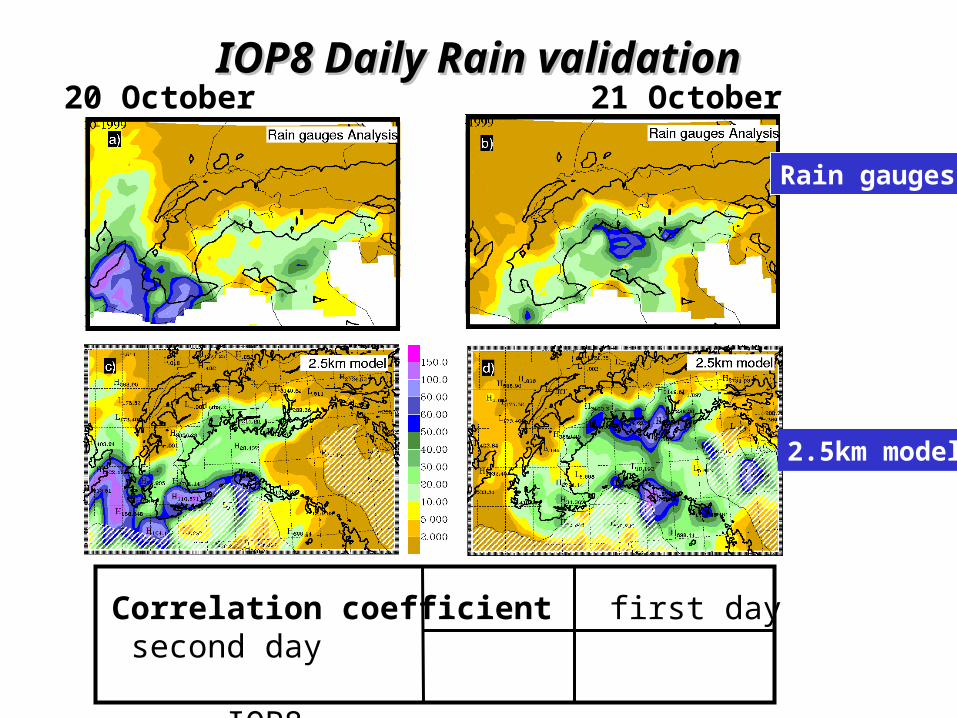
IOP8 Daily Rain validationIOP8 Daily Rain validation20 October 21 October
Correlation coefficient first day second day
IOP8 0.75 0.58
Rain gauges
2.5km model
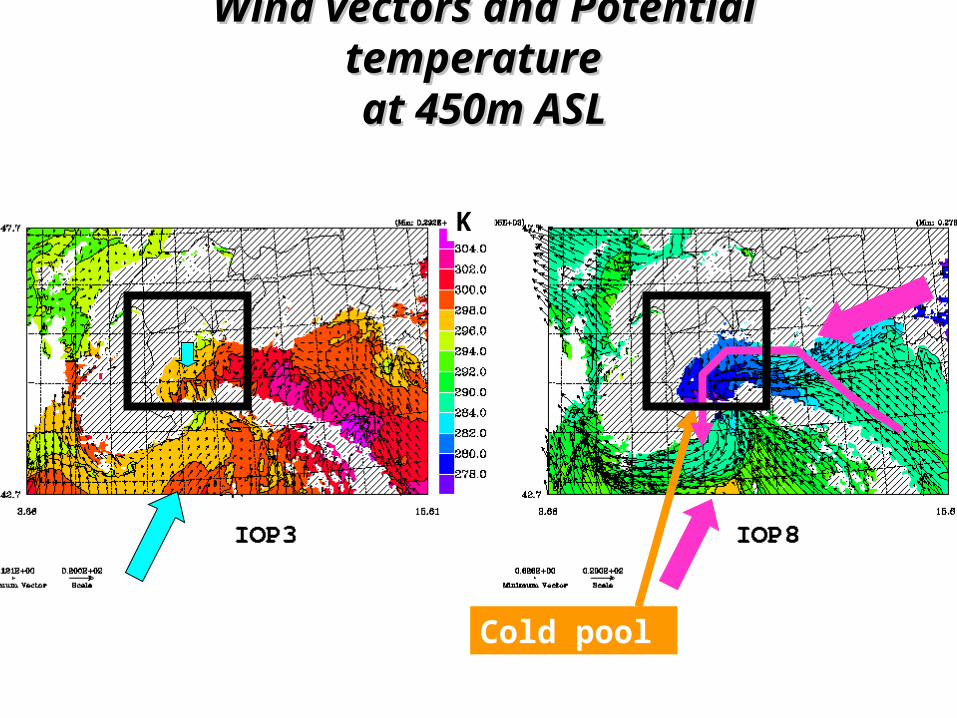
Wind vectors and Potential temperature Wind vectors and Potential temperature at 450m ASL at 450m ASL
Cold pool
K
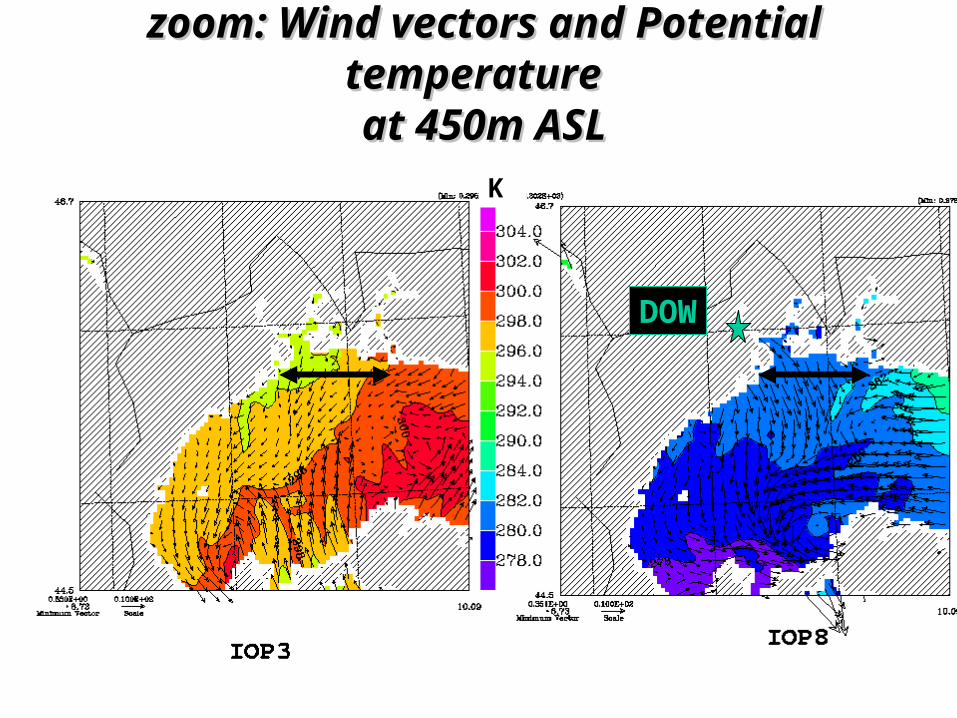
zoom: Wind vectors and Potential zoom: Wind vectors and Potential temperature temperature at 450m ASL at 450m ASL
DOW
K
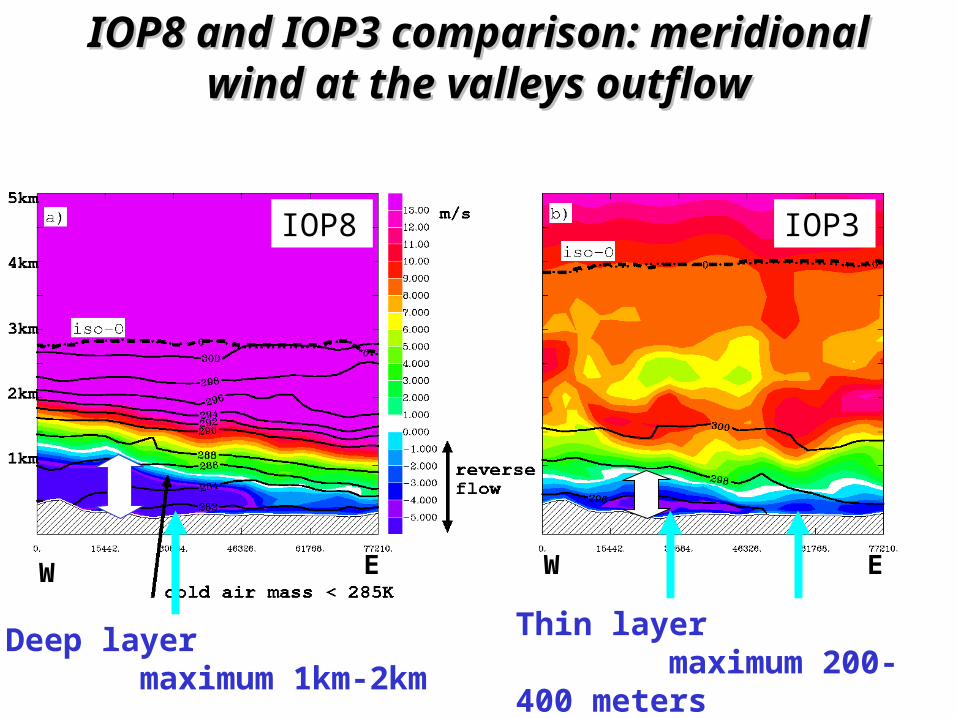
IOP8 and IOP3 comparison: meridional IOP8 and IOP3 comparison: meridional wind at the valleys outflowwind at the valleys outflow
IOP8 IOP3
W WE E
Toce+Ticino Valleys Toce+Ticino valleys Como Valley
Deep layer maximum 1km-2km
Thin layer maximum 200-400 meters
PresentationPresentation
• Introduction and numerical set-up.
• IOP3 and IOP8 rain and wind validations.
• Mesonh numerical laboratory to compare IOP8 and IOP3 reversal flow origins.
• conclusion
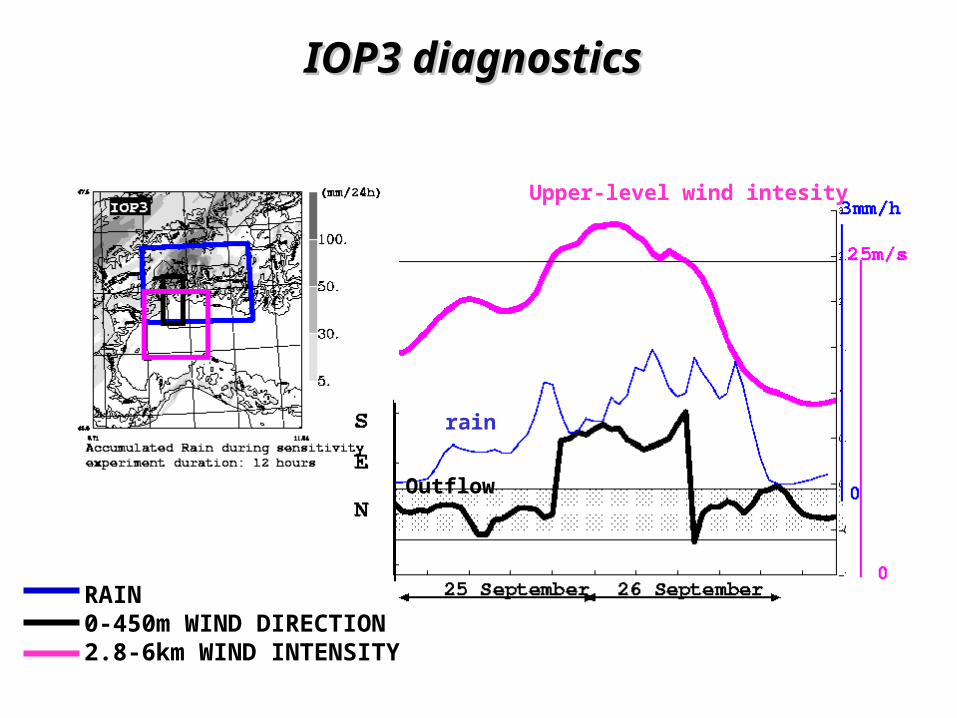
IOP3 diagnostics IOP3 diagnostics
RAIN0-450m WIND DIRECTION2.8-6km WIND INTENSITY
Upper-level wind intesity
rain
Outflow
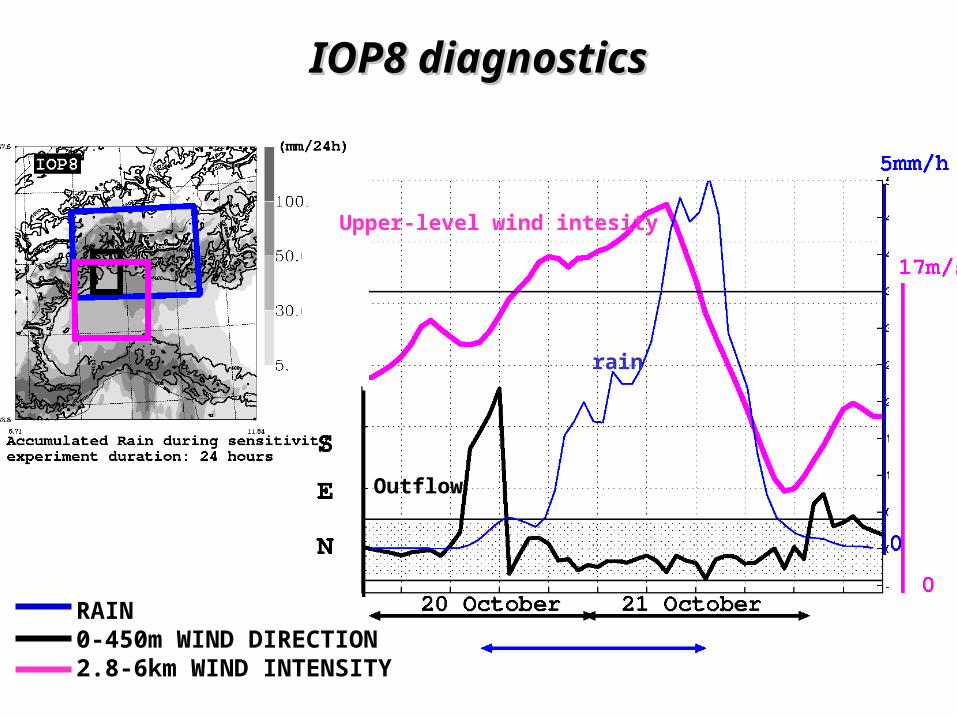
IOP8 diagnosticsIOP8 diagnostics
RAIN0-450m WIND DIRECTION2.8-6km WIND INTENSITY
Upper-level wind intesity
rain
Outflow
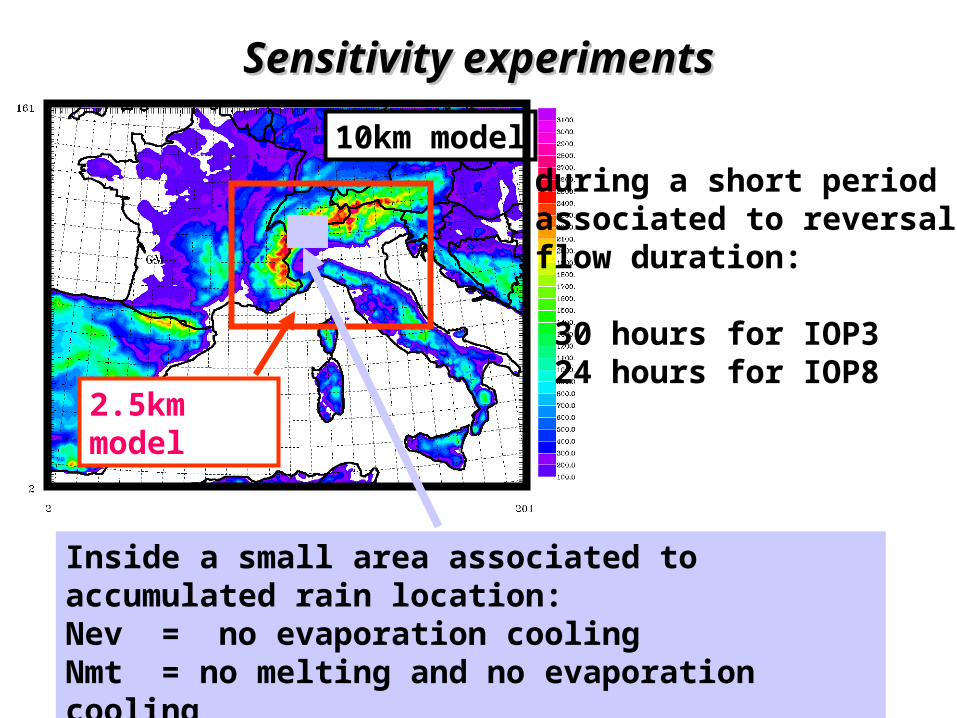
Sensitivity experimentsSensitivity experiments
Inside a small area associated to accumulated rain location:Nev = no evaporation cooling Nmt = no melting and no evaporation coolingSlope= no melting and no evaporation cooling above relief
10km model
2.5km model
during a short periodassociated to reversal flow duration:
30 hours for IOP3 24 hours for IOP8
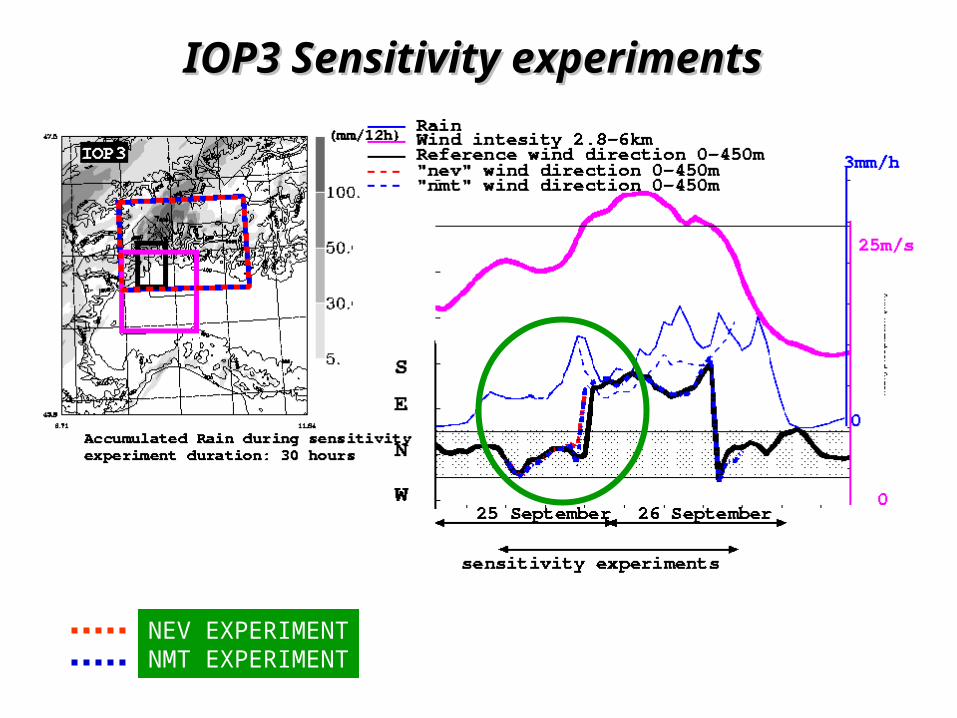
IOP3 Sensitivity experiments IOP3 Sensitivity experiments
NEV EXPERIMENTNMT EXPERIMENT
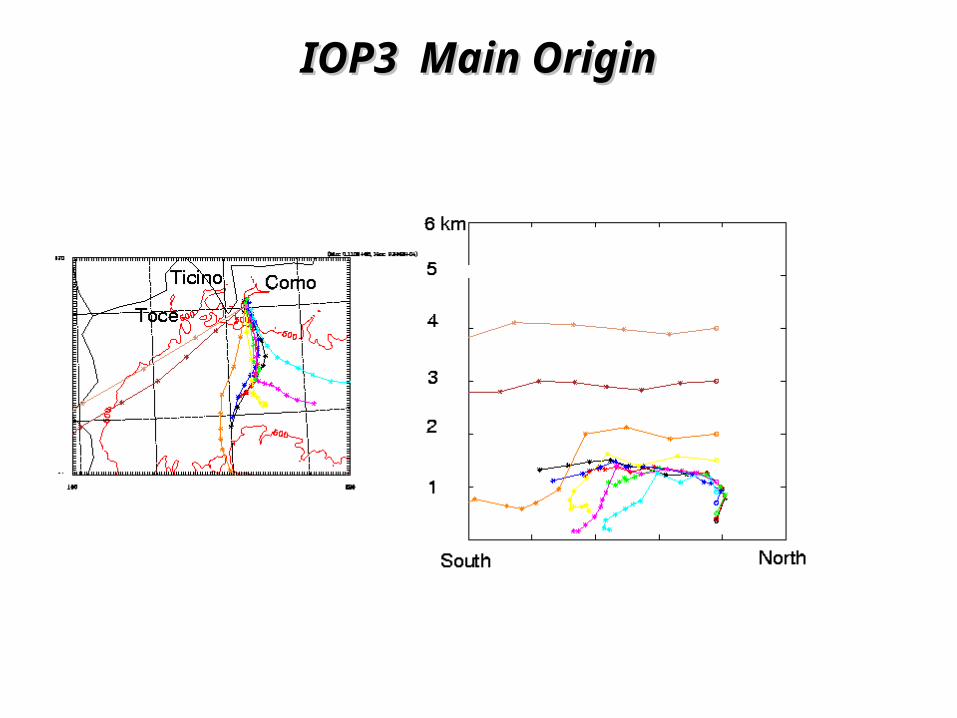
IOP3 Main OriginIOP3 Main Origin
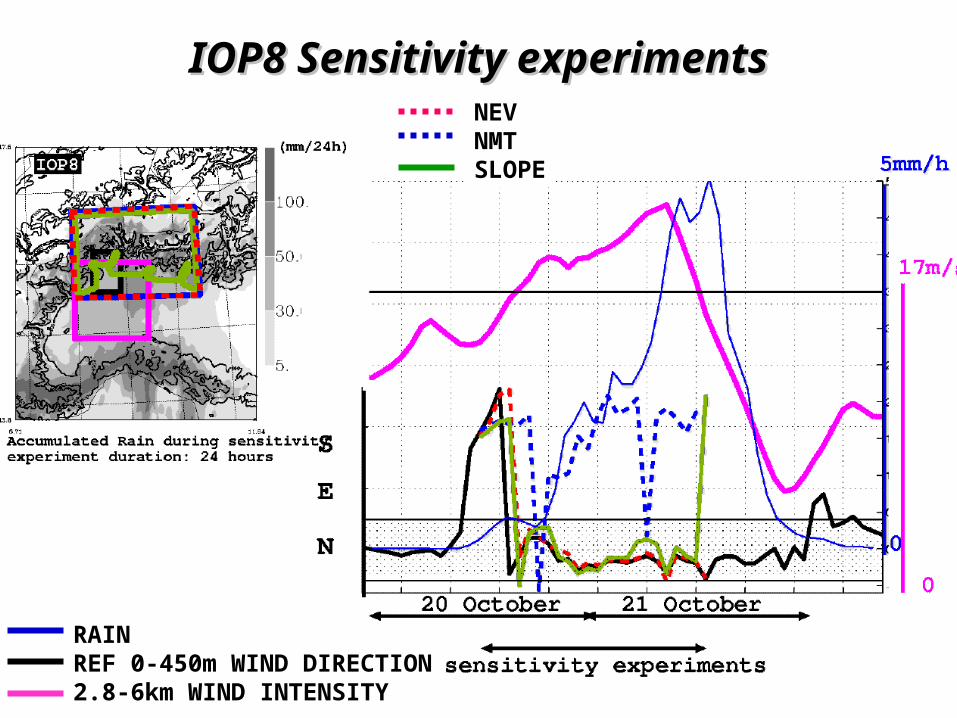
IOP8 Sensitivity experimentsIOP8 Sensitivity experiments
RAINREF 0-450m WIND DIRECTION2.8-6km WIND INTENSITY
NEVNMTSLOPE
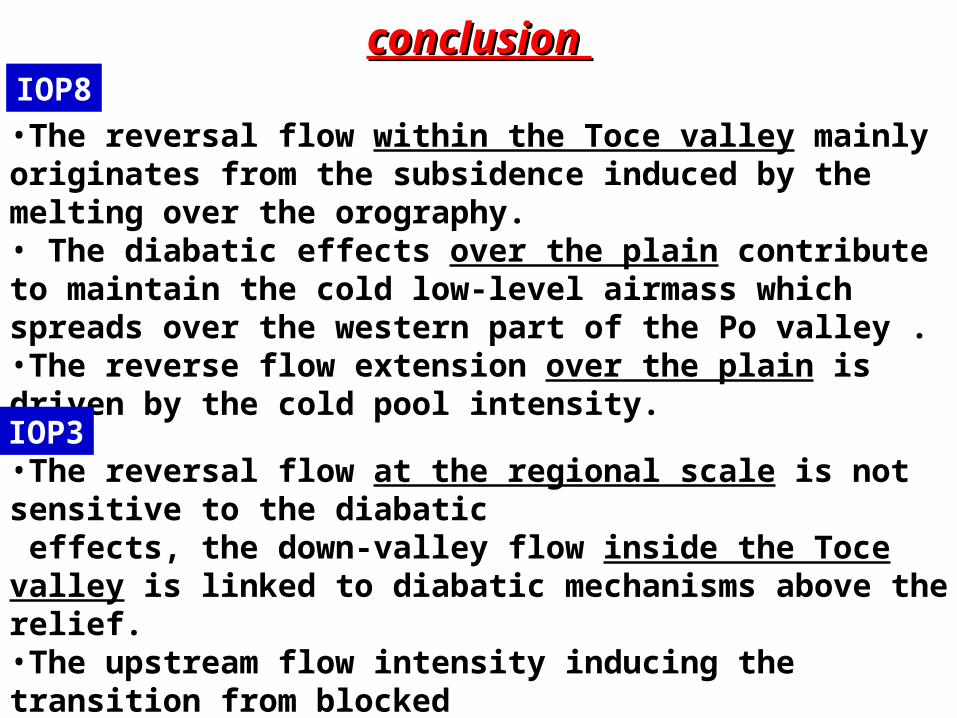
conclusion conclusion IOP8•The reversal flow within the Toce valley mainly originates from the subsidence induced by the melting over the orography.• The diabatic effects over the plain contribute to maintain the cold low-level airmass which spreads over the western part of the Po valley .•The reverse flow extension over the plain is driven by the cold pool intensity.
IOP8
•The reversal flow at the regional scale is not sensitive to the diabatic effects, the down-valley flow inside the Toce valley is linked to diabatic mechanisms above the relief.•The upstream flow intensity inducing the transition from blocked to unblocked regime drives the duration of the reverse flow.
IOP3