Embed Size (px)
Citation preview
Nick Lavingia 1
Total Cost Management
Dr. Nick J. Lavingia, P.E.
Chevron
Project Management Consultant
APEGGA Annual Conference, Calgary
April 26-27, 2007
Nick Lavingia 2
Dr. Nick J. Lavingia, P.E.Project Management ConsultantChevron
Nick has over 30 years of Global Project Engineering, Management, Consulting and Training experience in the Energy industry. As a Project Management Consultant at Chevron, he provides Consultation and Training to Project Professionals worldwide.
Nick has a B.S. and M.S. in Chemical & Petroleum-Refining Engineering and a Ph.D. in Engineering Economics & Management from the Colorado School of Mines. He is a registered Professional Chemical Engineer in the State of California.
Nick is a member of Project Management subcommittee for Athabasca Oil Sands expansion project. He has published and presented many papers at technical organizations and is a recipient of industry award from Pathfinder for outstanding Contribution to the advancement of Project Management Technology and Chevron Chairman’s award for implementing Value Engineering throughout the corporation.
Nick Lavingia 3
Agenda
Total Cost Management:• Economic Analysis• Cost Estimating• Planning / Scheduling• Benchmarking• Contracting / Procurement• Performance Measurement• Cost Control / Forecasting• Progress Reporting• Finance / Audit
Nick Lavingia 4
•Contracting/Procurement (Strategy)
•Cost Control/Forecasting (WBS)
•Progress reporting
•Finance/Audit
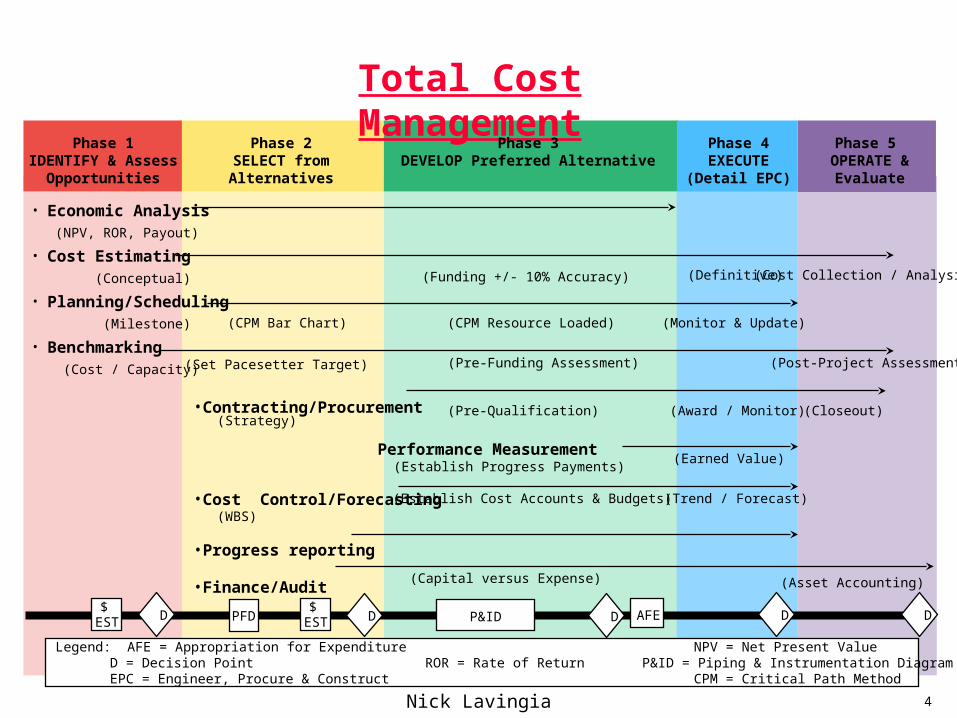
Total Cost Management
Phase 1IDENTIFY & Assess
Opportunities
Phase 2SELECT fromAlternatives
Phase 3DEVELOP Preferred Alternative
Phase 4EXECUTE
(Detail EPC)
Phase 5 OPERATE &
Evaluate
• Economic Analysis (NPV, ROR, Payout)
• Cost Estimating (Conceptual)
• Planning/Scheduling (Milestone)
• Benchmarking (Cost / Capacity)
Legend: AFE = Appropriation for Expenditure NPV = Net Present Value PFD = Process Flow DiagramD = Decision Point ROR = Rate of Return P&ID = Piping & Instrumentation DiagramEPC = Engineer, Procure & Construct CPM = Critical Path Method WBS = Work Breakdown Structure
P&ID$
EST AFEPFD D D D D D$
EST
(Funding +/- 10% Accuracy) (Definitive)
(CPM Bar Chart) (CPM Resource Loaded) (Monitor & Update)
(Pre-Funding Assessment) (Post-Project Assessment)
(Pre-Qualification) (Award / Monitor)
Performance Measurement (Establish Progress Payments)
(Earned Value)
(Establish Cost Accounts & Budgets) (Trend / Forecast)
(Closeout)
(Cost Collection / Analysis)
(Set Pacesetter Target)
(Asset Accounting) (Capital versus Expense)
Nick Lavingia 5
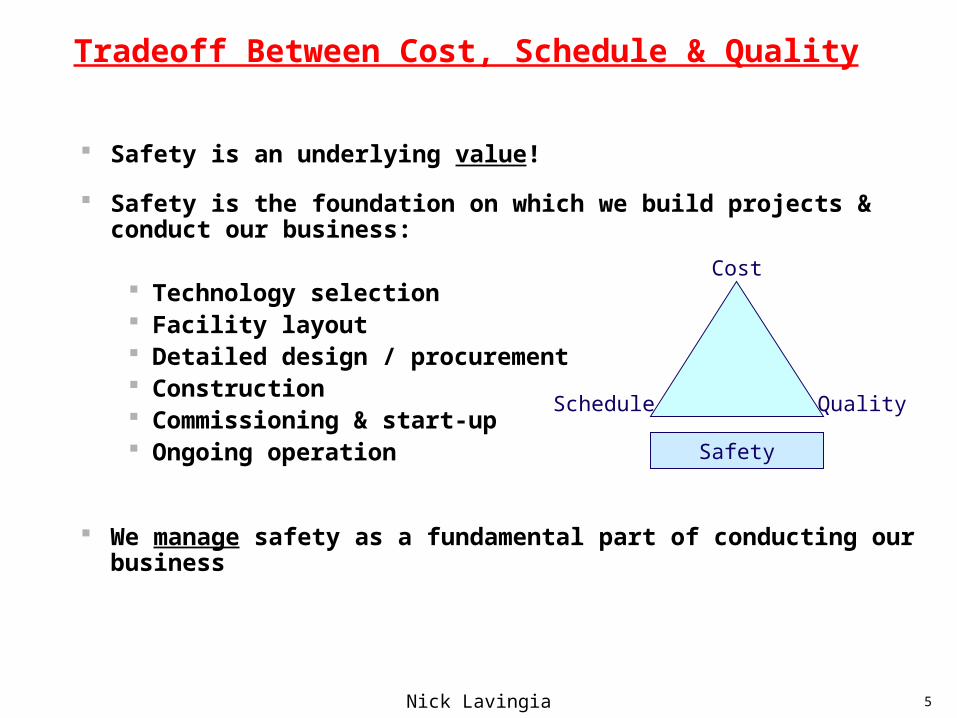
Safety is an underlying value!
Safety is the foundation on which we build projects & conduct our business:
Technology selection Facility layout Detailed design / procurement Construction Commissioning & start-up Ongoing operation
We manage safety as a fundamental part of conducting our business
Cost
Schedule Quality
Safety
Tradeoff Between Cost, Schedule & Quality
Nick Lavingia 6
Economic Analysis
Nick Lavingia 7
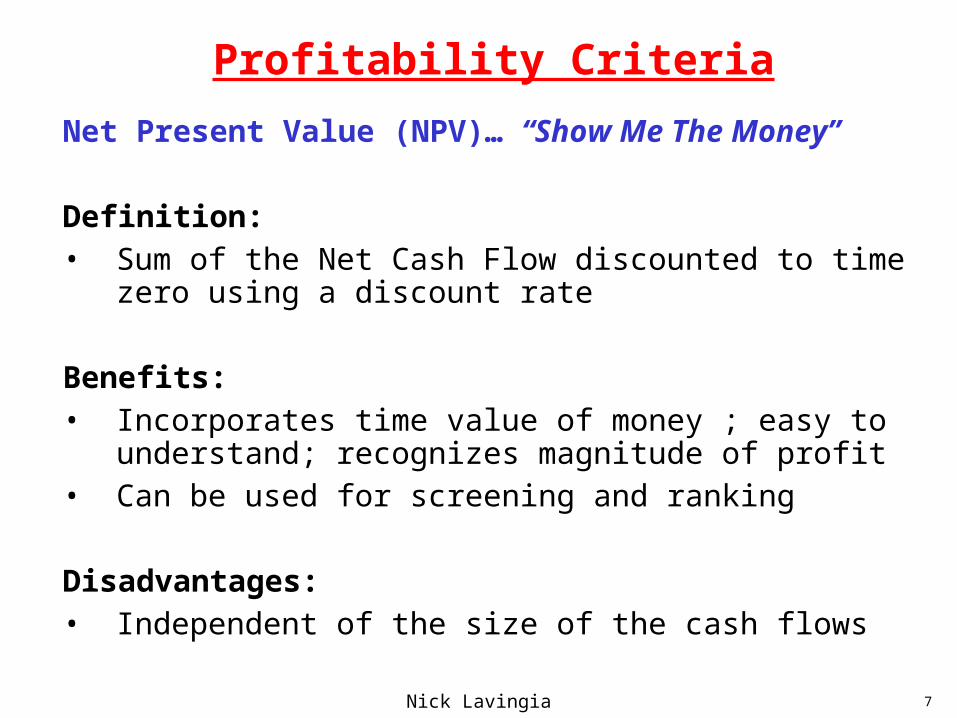
Net Present Value (NPV)… “Show Me The Money”
Definition: • Sum of the Net Cash Flow discounted to time zero using a
discount rate
Benefits: • Incorporates time value of money ; easy to understand;
recognizes magnitude of profit• Can be used for screening and ranking
Disadvantages: • Independent of the size of the cash flows
Profitability Criteria
Nick Lavingia 8
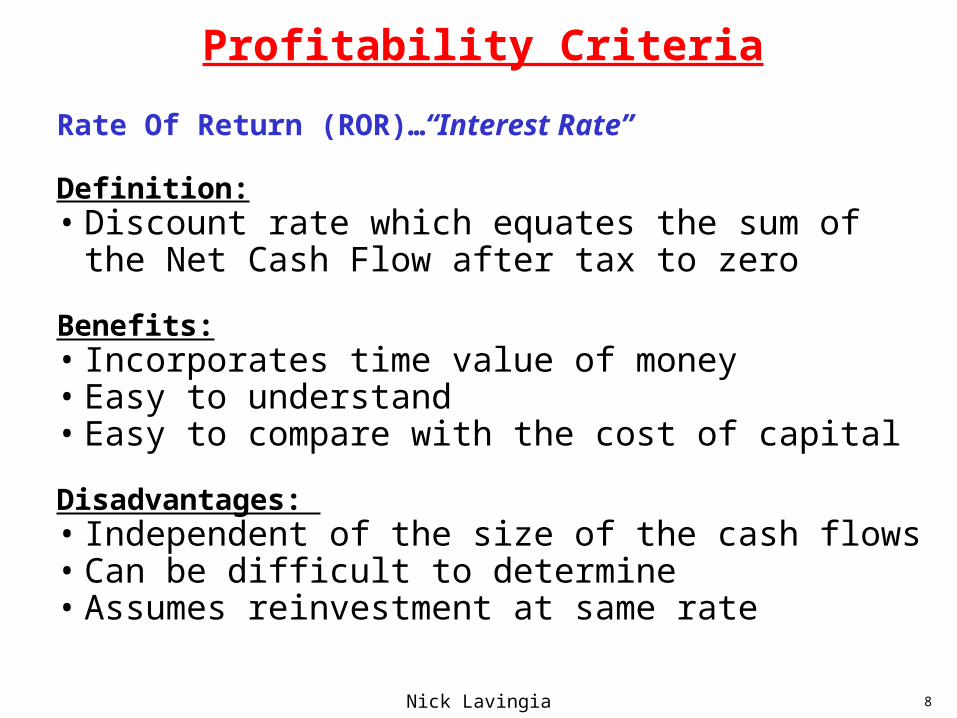
Profitability Criteria
Rate Of Return (ROR)…“Interest Rate”
Definition: • Discount rate which equates the sum of the Net Cash
Flow after tax to zero
Benefits: • Incorporates time value of money • Easy to understand• Easy to compare with the cost of capital
Disadvantages: • Independent of the size of the cash flows• Can be difficult to determine• Assumes reinvestment at same rate
Nick Lavingia 9
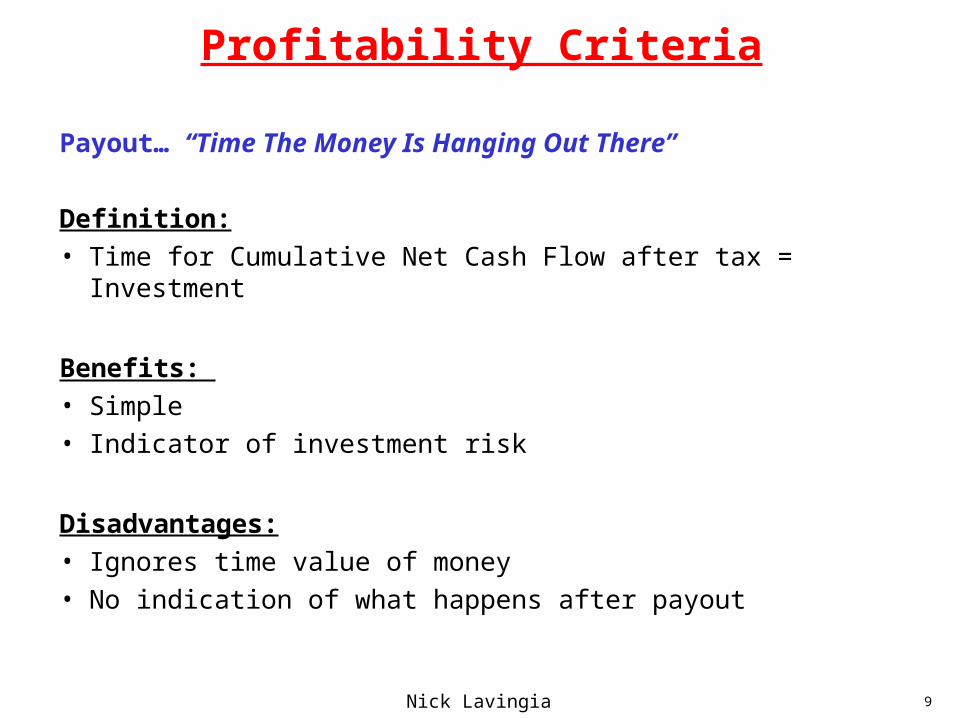
Profitability Criteria
Payout… “Time The Money Is Hanging Out There”
Definition:
• Time for Cumulative Net Cash Flow after tax = Investment
Benefits:
• Simple
• Indicator of investment risk
Disadvantages:
• Ignores time value of money
• No indication of what happens after payout
Nick Lavingia 10
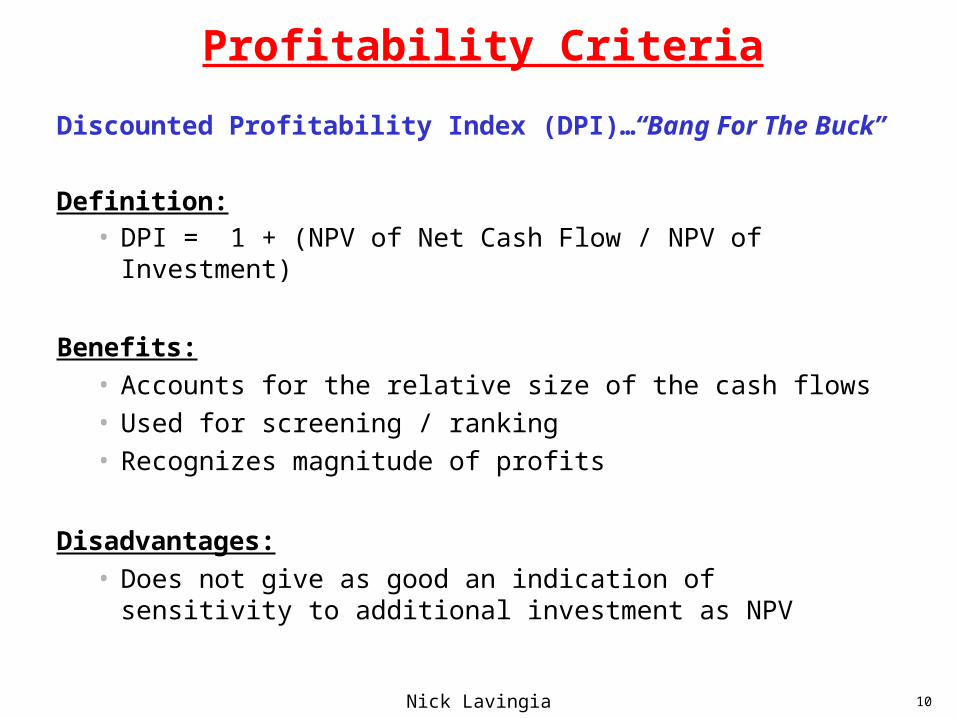
Profitability Criteria
Discounted Profitability Index (DPI)…“Bang For The Buck”
Definition: • DPI = 1 + (NPV of Net Cash Flow / NPV of Investment)
Benefits: • Accounts for the relative size of the cash flows• Used for screening / ranking • Recognizes magnitude of profits
Disadvantages:• Does not give as good an indication of sensitivity to additional
investment as NPV
Nick Lavingia 11
Cost Estimating
Nick Lavingia 12
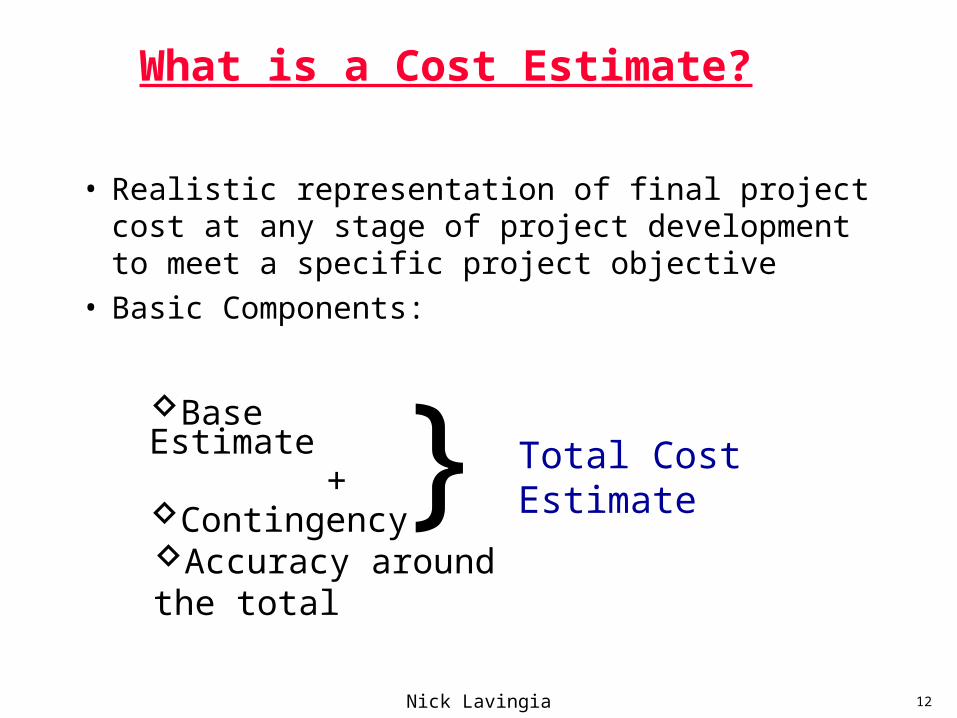
What is a Cost Estimate?
• Realistic representation of final project cost at any stage of project development to meet a specific project objective
• Basic Components:
Base Estimate +
ContingencyTotal Cost Estimate
Accuracy around the total
}
Nick Lavingia 13
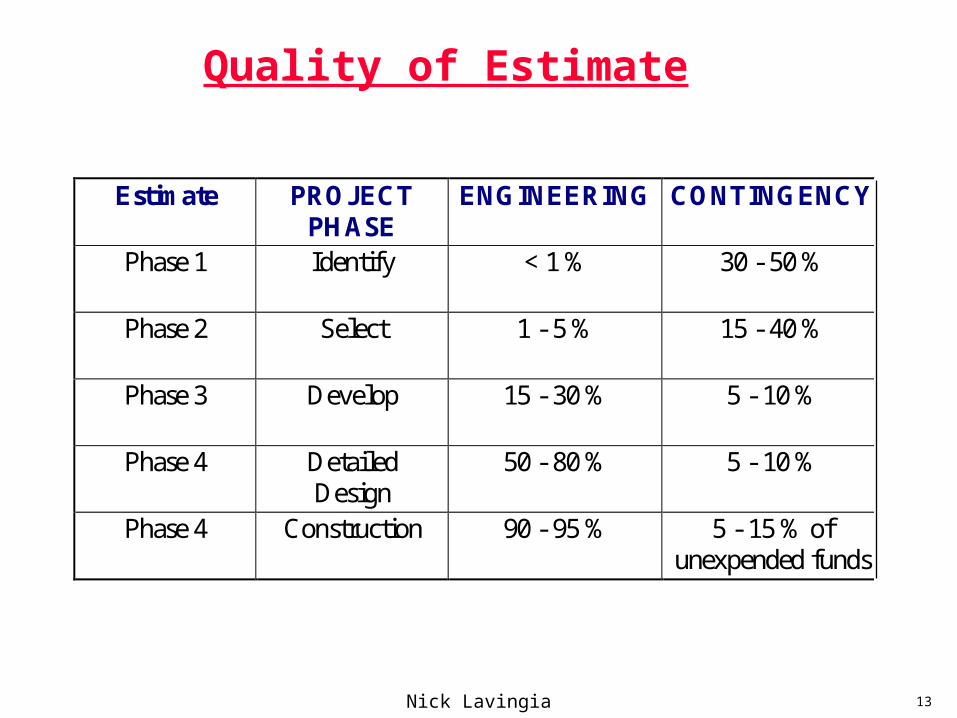
Quality of Estimate
Estimate PROJECT PHASE
ENGINEERING CONTINGENCY
Phase 1 Identify < 1 % 30 - 50 %
Phase 2 Select 1 - 5 % 15 - 40 %
Phase 3 Develop 15 - 30 % 5 - 10 %
Phase 4 Detailed Design
50 - 80 % 5 - 10 %
Phase 4 Construction 90 - 95 % 5 - 15 % of unexpended funds
Nick Lavingia 14
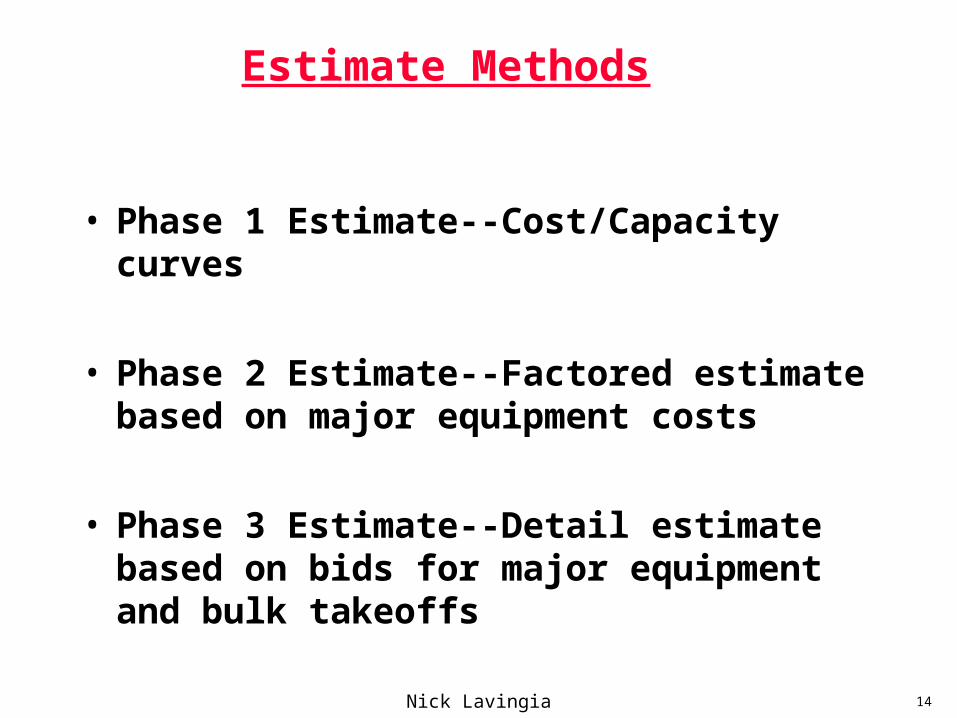
Estimate Methods
• Phase 1 Estimate--Cost/Capacity curves
• Phase 2 Estimate--Factored estimate based on major equipment costs
• Phase 3 Estimate--Detail estimate based on bids for major equipment and bulk takeoffs
Nick Lavingia 15
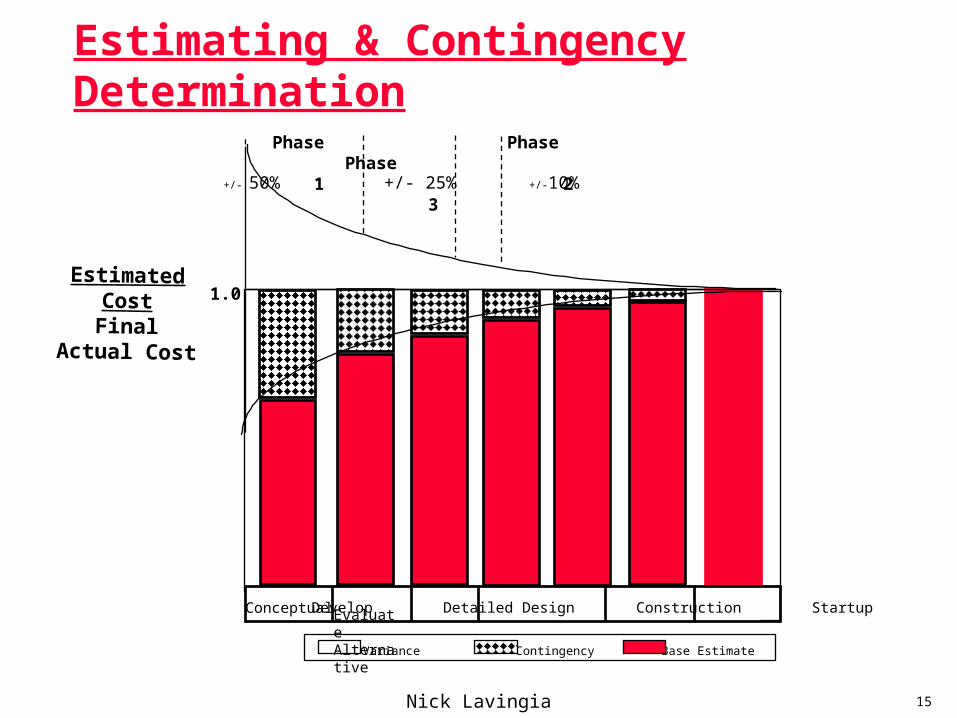
Estimating & Contingency Determination
Estimated CostFinal Actual
Cost
ContingencyVariance Base Estimate
+/- 50% +/- 25% +/-10%
Phase Phase Phase 1 2 3
1.0
Evaluate Alternative Develop Detailed Design Construction StartupConceptual
Nick Lavingia 16
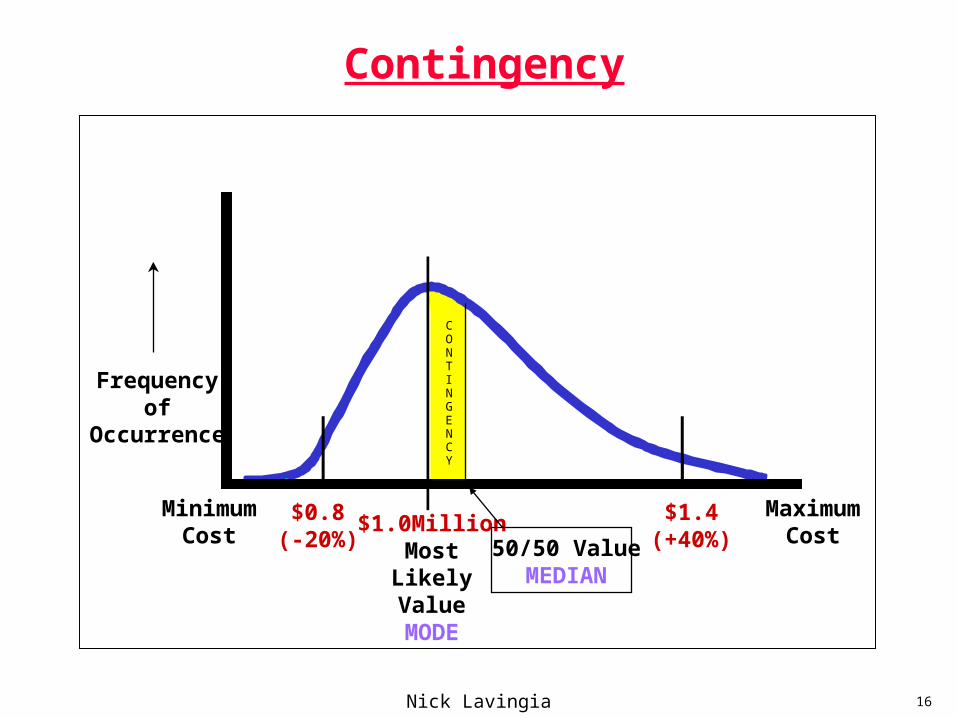
MinimumCost
MaximumCost$1.0Million
MostLikelyValueMODE
Frequencyof
Occurrence
$1.4(+40%)
$0.8(-20%) 50/50 Value
MEDIAN
CONTINGENCY
Contingency
Nick Lavingia 17
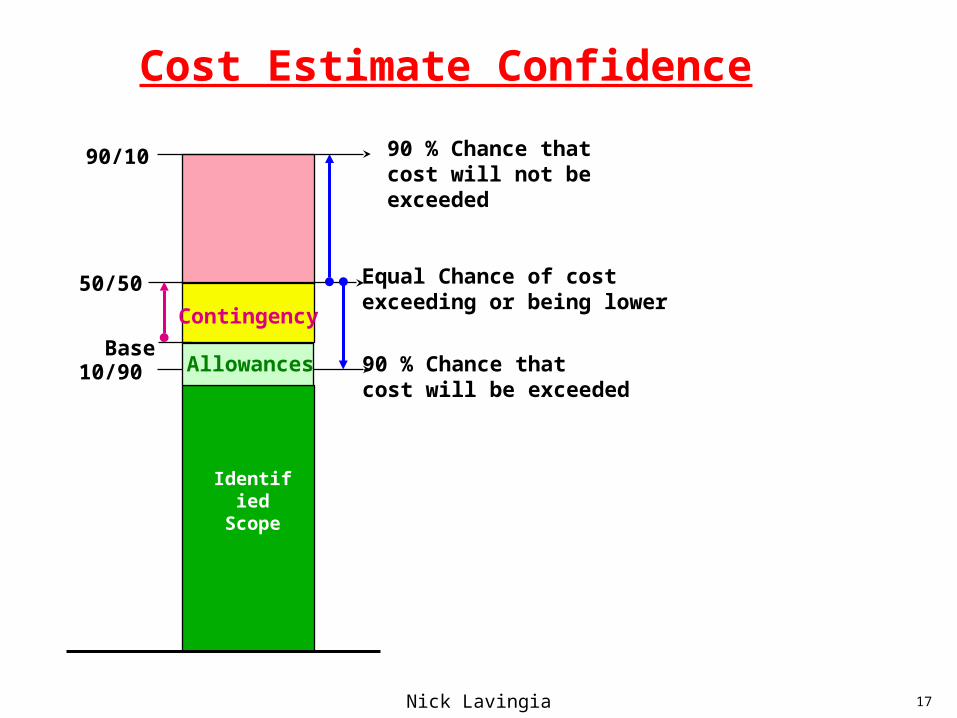
Cost Estimate Confidence
90 % Chance thatcost will not be exceeded
90 % Chance thatcost will be exceeded
Equal Chance of costexceeding or being lower
90/10
50/50
Base10/90
Contingency
Allowances
IdentifiedScope
Nick Lavingia 18
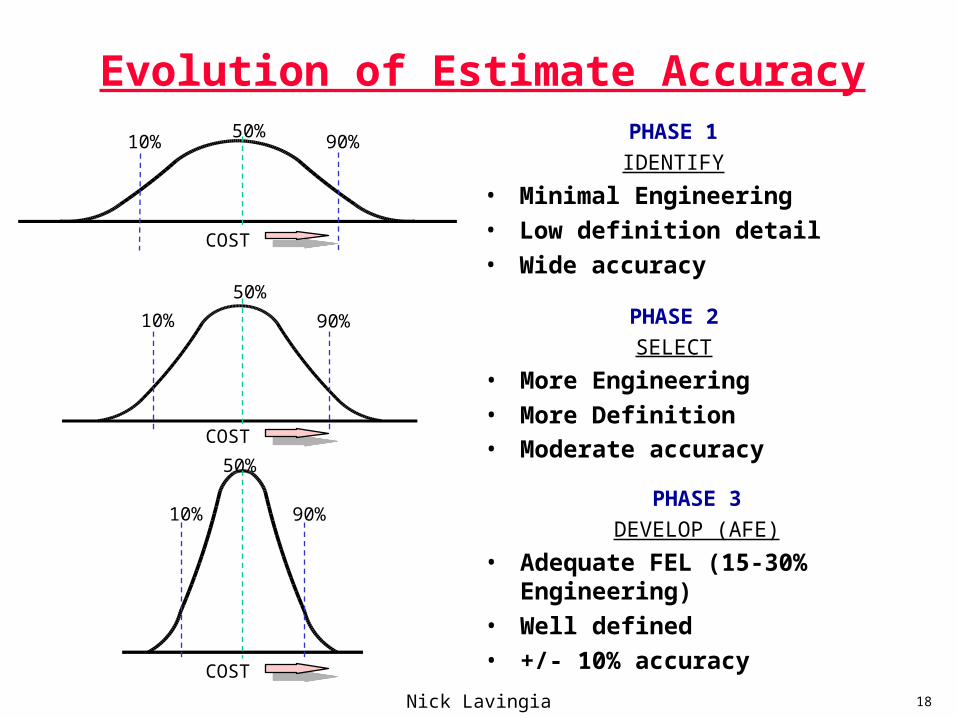
Evolution of Estimate Accuracy
PHASE 3
DEVELOP (AFE)
• Adequate FEL (15-30% Engineering)
• Well defined
• +/- 10% accuracy
PHASE 2
SELECT
• More Engineering
• More Definition• Moderate accuracy
PHASE 1
IDENTIFY
• Minimal Engineering
• Low definition detail
• Wide accuracy
COST
50%
COST
50%
COST
50%
10% 90%
10% 90%
10% 90%
Nick Lavingia 19
Planning / Scheduling
Nick Lavingia 20
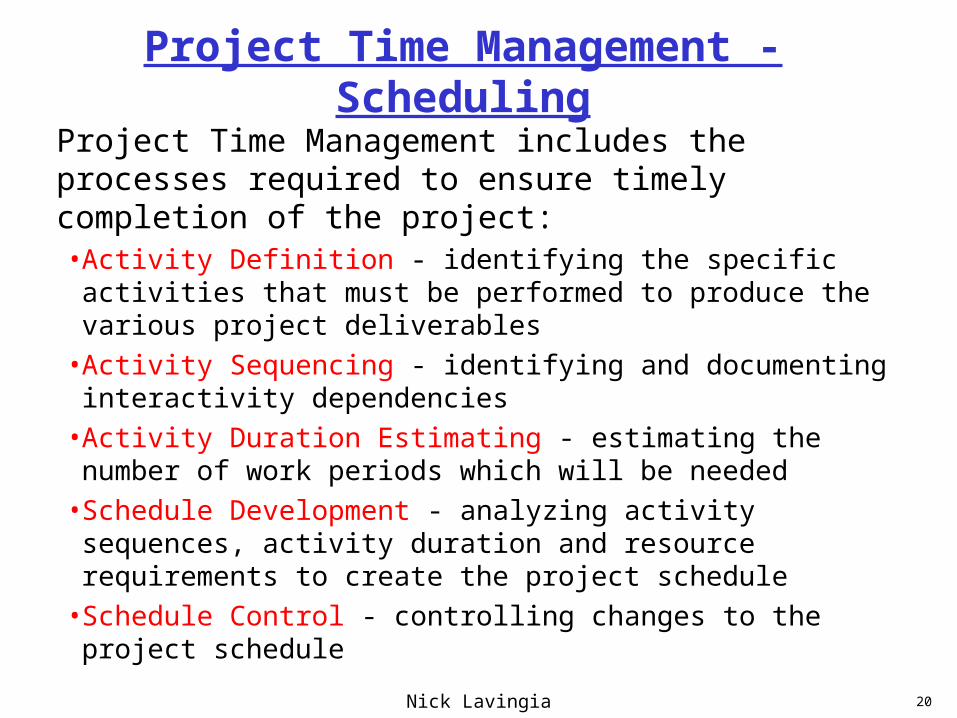
Project Time Management - Scheduling
Project Time Management includes the processes required to ensure timely completion of the project:• Activity Definition - identifying the specific activities that
must be performed to produce the various project deliverables
• Activity Sequencing - identifying and documenting interactivity dependencies
• Activity Duration Estimating - estimating the number of work periods which will be needed
• Schedule Development - analyzing activity sequences, activity duration and resource requirements to create the project schedule
• Schedule Control - controlling changes to the project schedule
Nick Lavingia 21
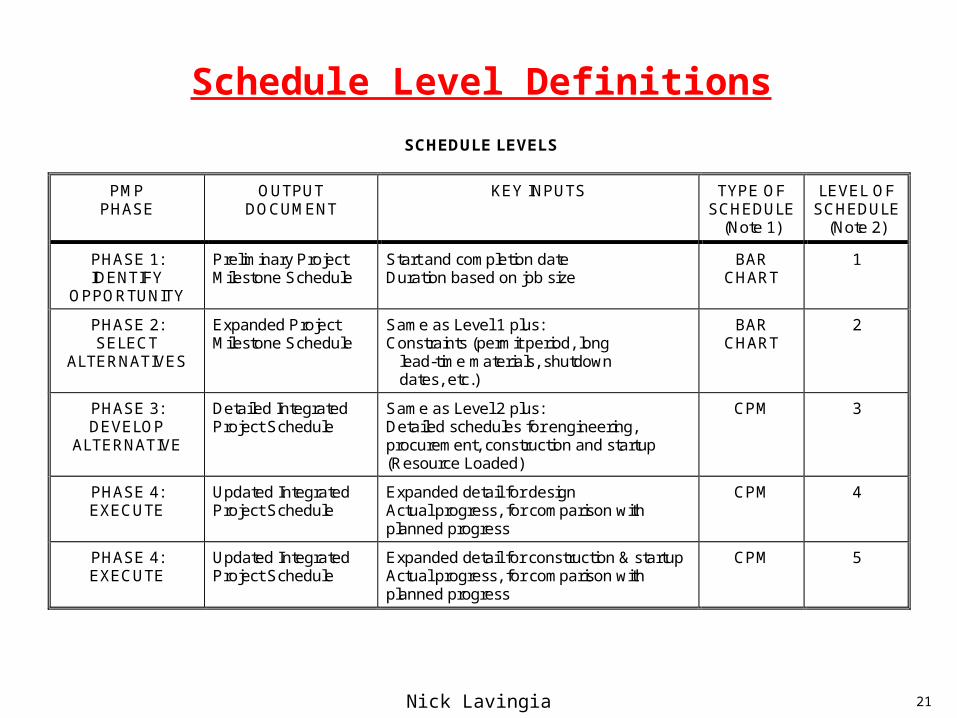
Schedule Level Definitions
SCHEDULE LEVELS
PMP PHASE
OUTPUT DOCUMENT
KEY INPUTS TYPE OF SCHEDULE
(Note 1)
LEVEL OF SCHEDULE
(Note 2)
PHASE 1: IDENTIFY
OPPORTUNITY
Preliminary Project Milestone Schedule
Start and completion date Duration based on job size
BAR CHART
1
PHASE 2: SELECT
ALTERNATIVES
Expanded Project Milestone Schedule
Same as Level 1 plus: Constraints (permit period, long lead-time materials, shutdown dates, etc.)
BAR CHART
2
PHASE 3: DEVELOP
ALTERNATIVE
Detailed Integrated Project Schedule
Same as Level 2 plus: Detailed schedules for engineering, procurement, construction and startup (Resource Loaded)
CPM 3
PHASE 4: EXECUTE
Updated Integrated Project Schedule
Expanded detail for design Actual progress, for comparison with planned progress
CPM 4
PHASE 4: EXECUTE
Updated Integrated Project Schedule
Expanded detail for construction & startup Actual progress, for comparison with planned progress
CPM 5
Nick Lavingia 22
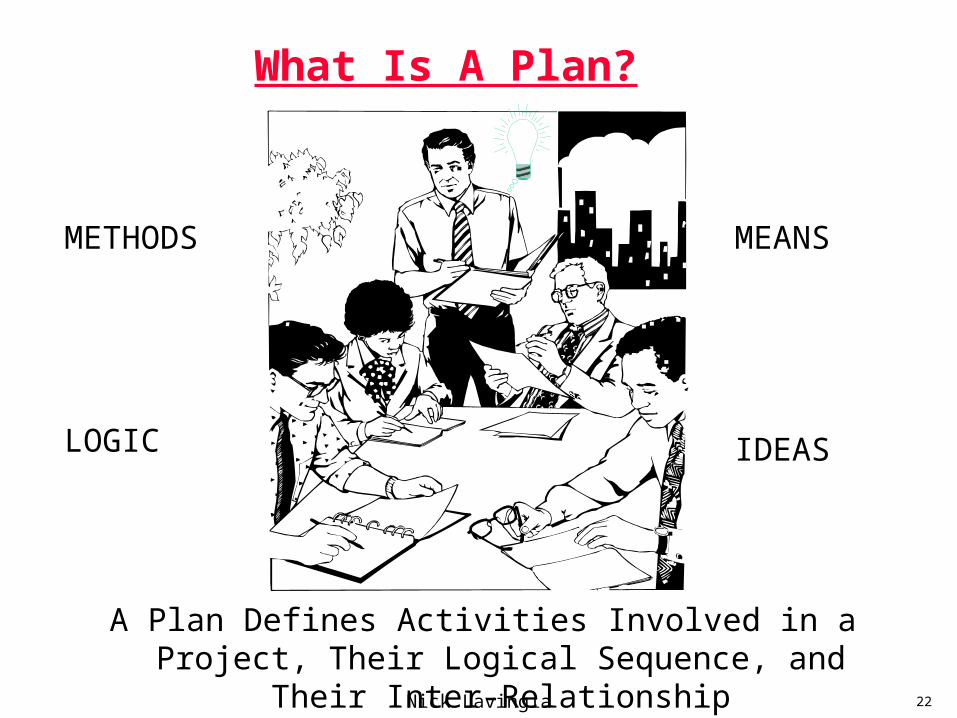
What Is A Plan?
A Plan Defines Activities Involved in a Project, Their Logical Sequence, and Their Inter-Relationship
METHODS
IDEASLOGIC
MEANS
Nick Lavingia 23
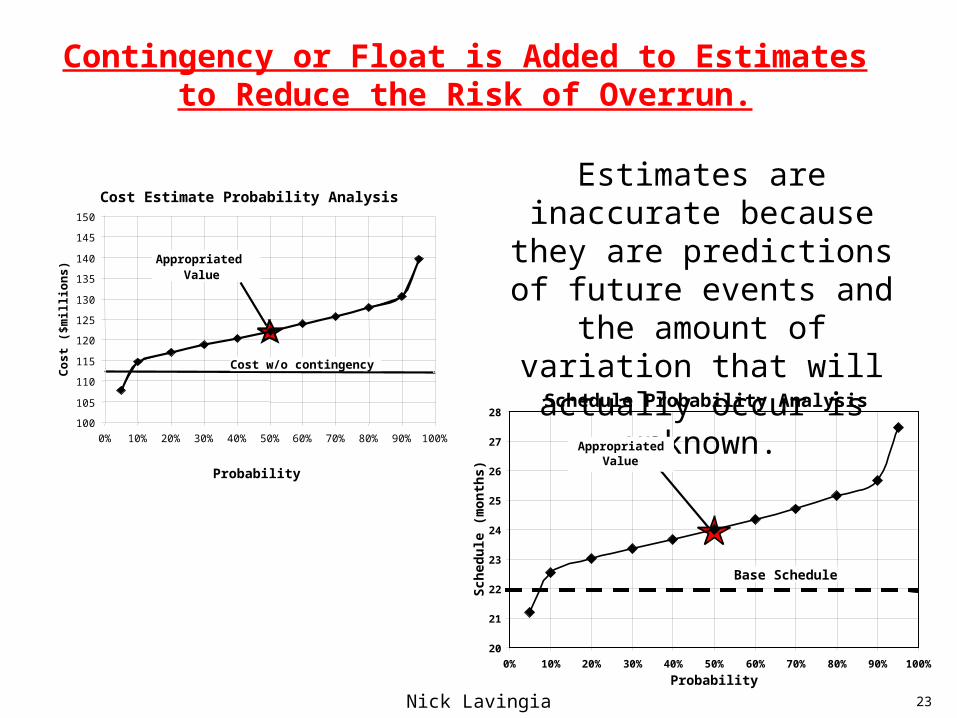
Estimates are inaccurate because they are predictions
of future events and the amount of variation that will actually occur is unknown.
Contingency or Float is Added to Estimates to Reduce the Risk of Overrun.
Cost Estimate Probability Analysis
100
105
110
115
120
125
130
135
140
145
150
0% 10% 20% 30% 40% 50% 60% 70% 80% 90% 100%
Probability
Co
st
($m
illi
on
s)
Appropriated Value
Cost w/o contingency
Schedule Probability Analysis
20
21
22
23
24
25
26
27
28
0% 10% 20% 30% 40% 50% 60% 70% 80% 90% 100%
Probability
Sch
edu
le (
mo
nth
s)
Appropriated Value
Base Schedule
Nick Lavingia 24
Contracting / Procurement
Nick Lavingia 25
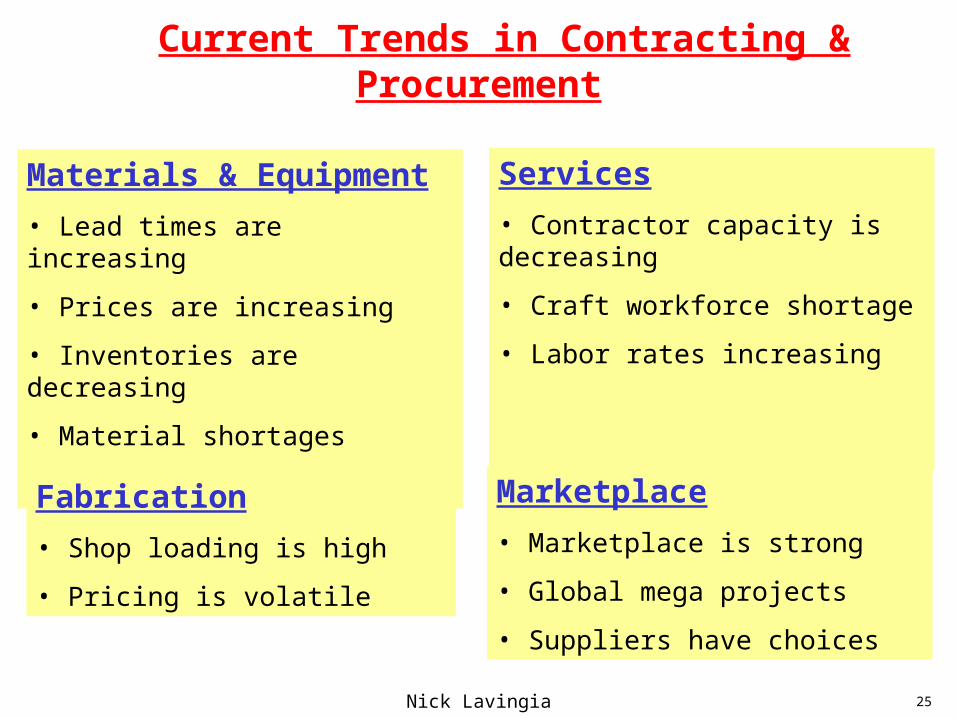
Current Trends in Contracting & Procurement
Materials & Equipment
• Lead times are increasing
• Prices are increasing
• Inventories are decreasing
• Material shortages
Services
• Contractor capacity is decreasing
• Craft workforce shortage
• Labor rates increasing
Fabrication
• Shop loading is high
• Pricing is volatile
Marketplace
• Marketplace is strong
• Global mega projects
• Suppliers have choices
Nick Lavingia 26
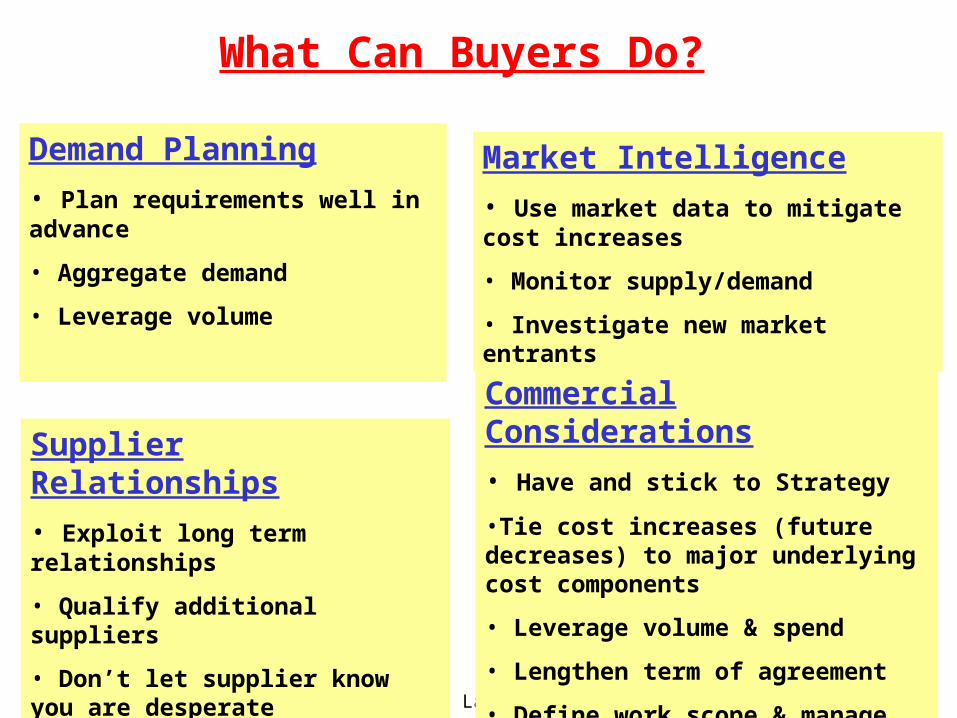
What Can Buyers Do?
Demand Planning
• Plan requirements well in advance
• Aggregate demand
• Leverage volume
Market Intelligence
• Use market data to mitigate cost increases
• Monitor supply/demand
• Investigate new market entrants
Supplier Relationships
• Exploit long term relationships
• Qualify additional suppliers
• Don’t let supplier know you are desperate
Commercial Considerations
• Have and stick to Strategy
•Tie cost increases (future decreases) to major underlying cost components
• Leverage volume & spend
• Lengthen term of agreement
• Define work scope & manage contractors
Nick Lavingia 27
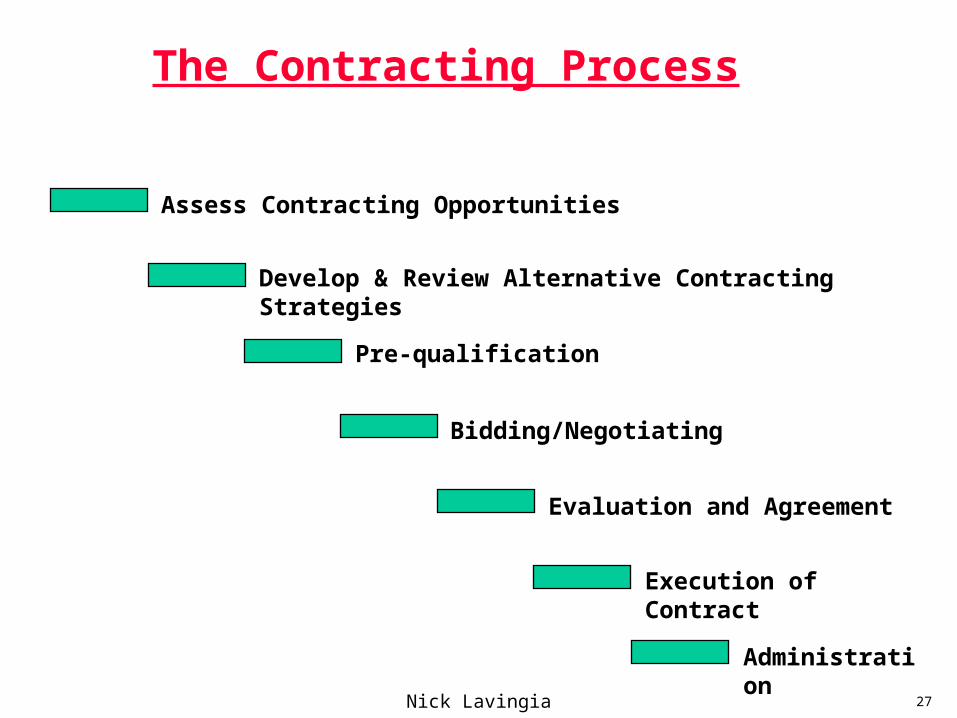
The Contracting Process
Assess Contracting Opportunities
Evaluation and Agreement
Bidding/Negotiating
Pre-qualification
Develop & Review Alternative Contracting Strategies
Administration
Execution of Contract
Nick Lavingia 28
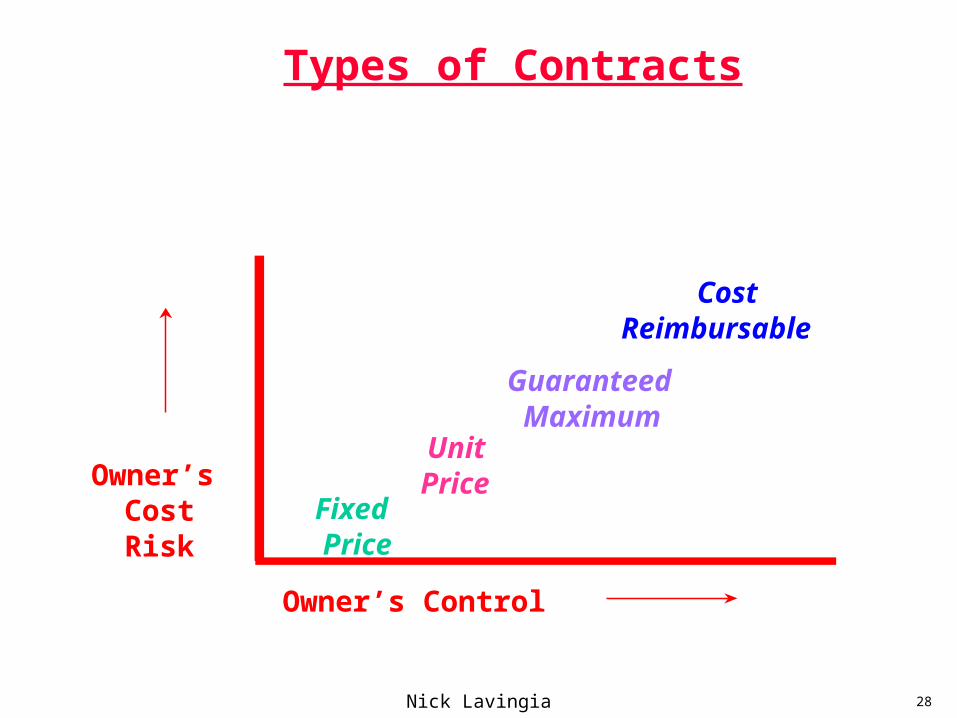
Owner’s Control
Cost Reimbursable
Fixed Price
Owner’sCostRisk
UnitPrice
GuaranteedMaximum
Types of Contracts
Nick Lavingia 29
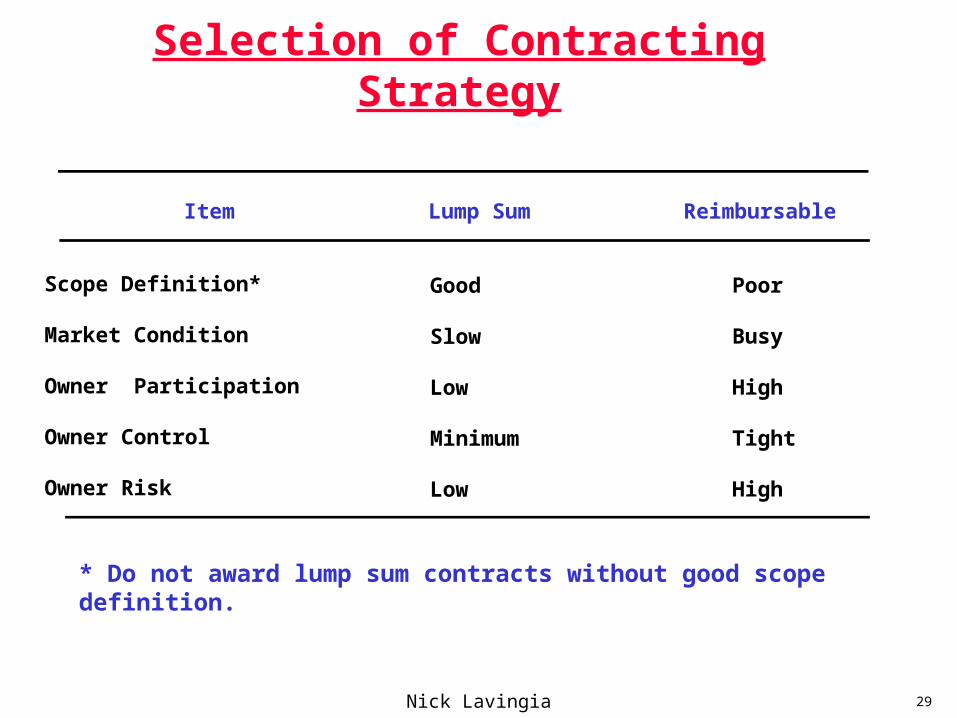
Selection of Contracting Strategy
Item Lump Sum Reimbursable
Scope Definition*
Market Condition
Owner Participation
Owner Control
Owner Risk
Good
Slow
Low
Minimum
Low
Poor
Busy
High
Tight
High
* Do not award lump sum contracts without good scope definition.
Nick Lavingia 30
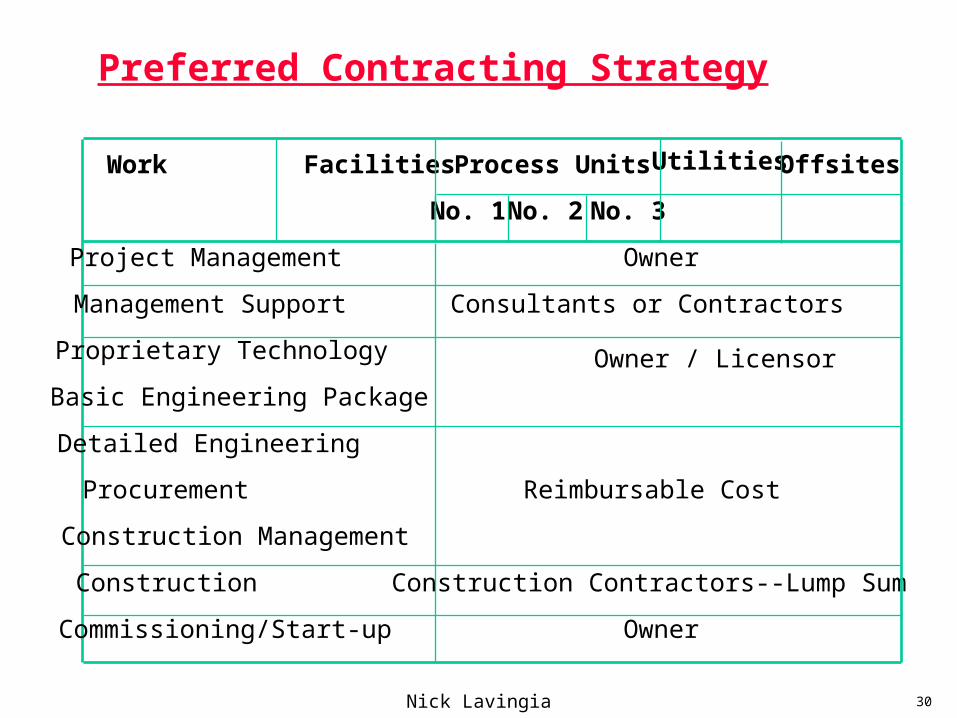
Preferred Contracting Strategy
Work Facilities Process Units Utilities Offsites
No. 1 No. 2 No. 3
Project Management Owner
Management Support Consultants or Contractors
Proprietary Technology Owner / Licensor
Basic Engineering Package
Detailed Engineering
Procurement Reimbursable Cost
Construction Management
Construction Construction Contractors--Lump Sum
Commissioning/Start-up Owner
Nick Lavingia 31
Performance Measurement
Nick Lavingia 32
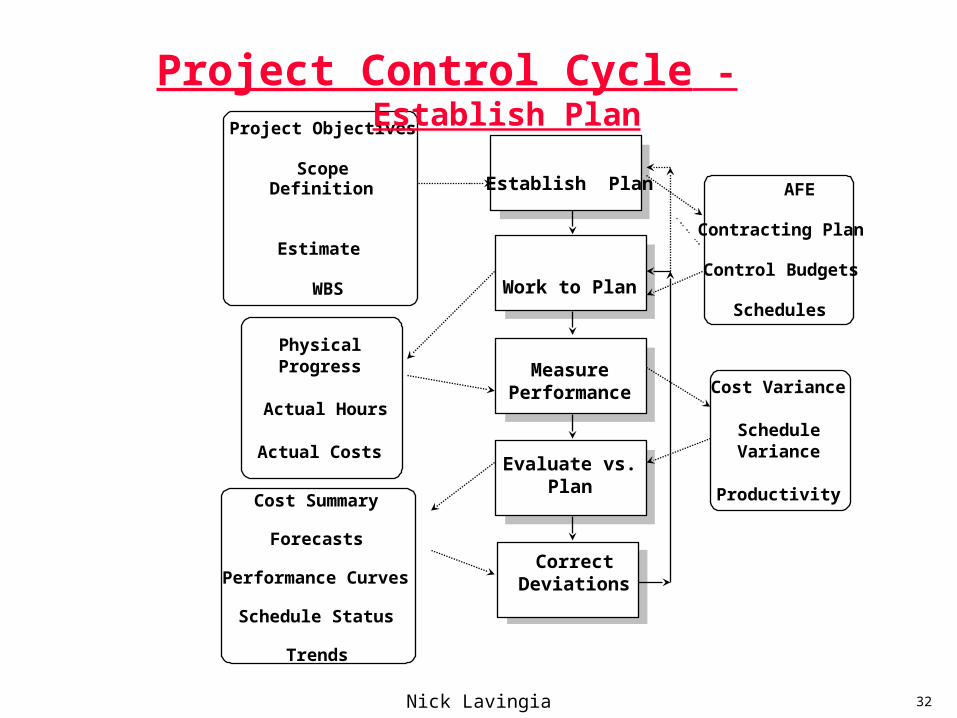
Project Objectives
Definition
Estimate
WBS
Project Control Cycle - Establish Plan
PhysicalProgress
Actual Hours
Actual Costs
Cost Summary
Forecasts
Performance Curves
Schedule Status
Trends
Scope
Work to Plan
Evaluate vs.Plan
Establish Plan
MeasurePerformance
CorrectDeviations
AFE
Contracting Plan
Control Budgets
Schedules
Cost Variance
ScheduleVariance
Productivity
Nick Lavingia 33
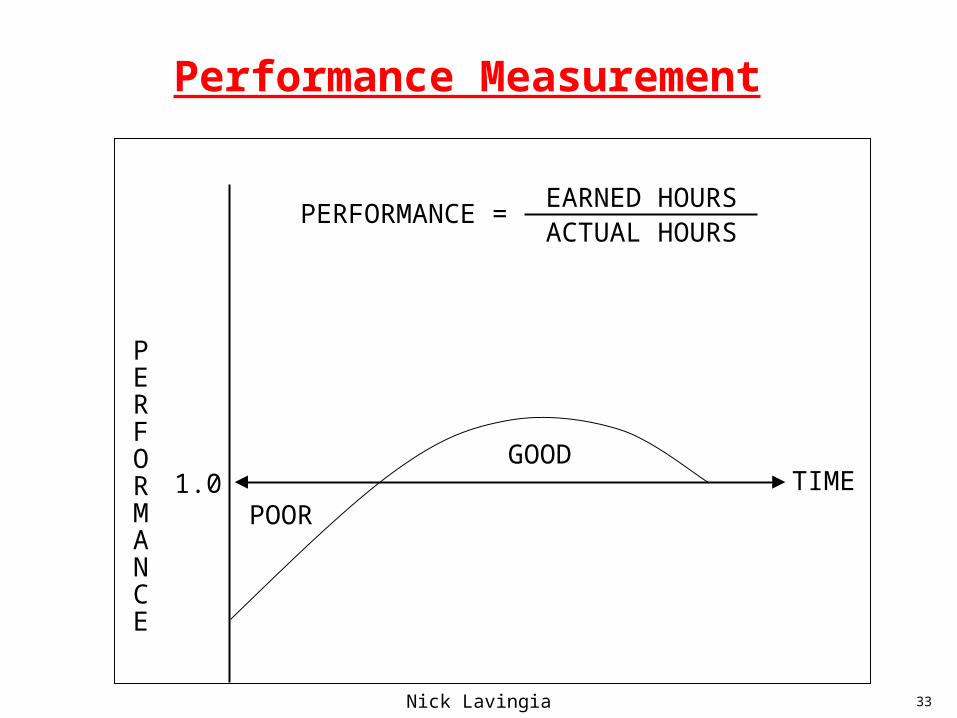
Performance Measurement
PERFORMANCE =EARNED HOURSACTUAL HOURS
POOR
PERFORMANCE
GOODTIME1.0
Nick Lavingia 34
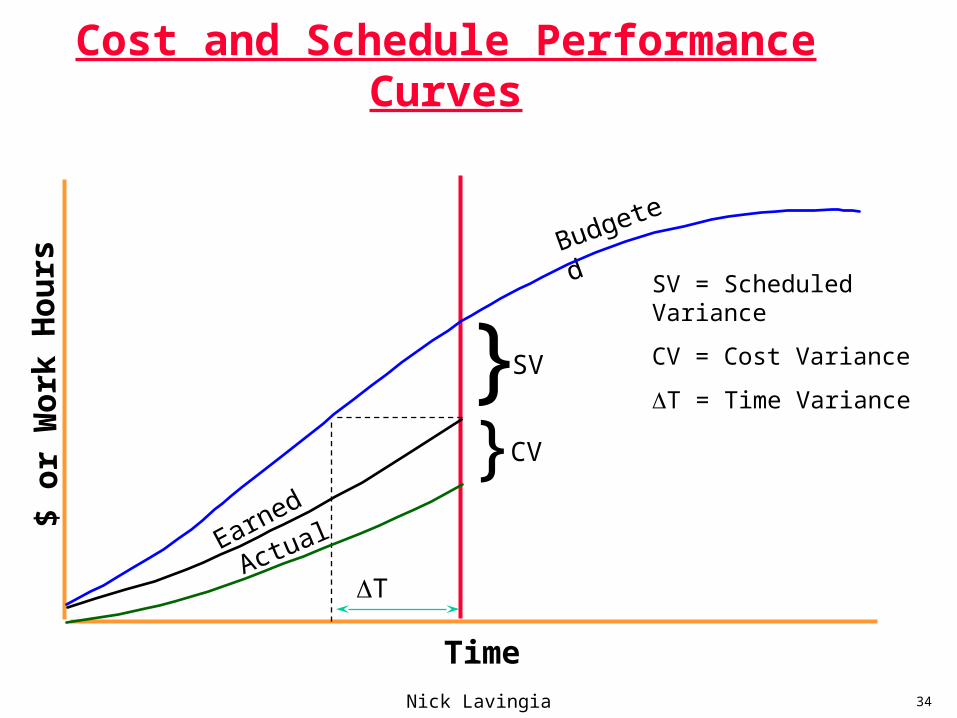
Cost and Schedule Performance Curves
SV}CV}
Budgeted
Earned
Actual
T
$ or
Wor
k H
ours
Time
SV = Scheduled Variance
CV = Cost Variance
T = Time Variance
Nick Lavingia 35
Cost Control / Forecasting
Nick Lavingia 36
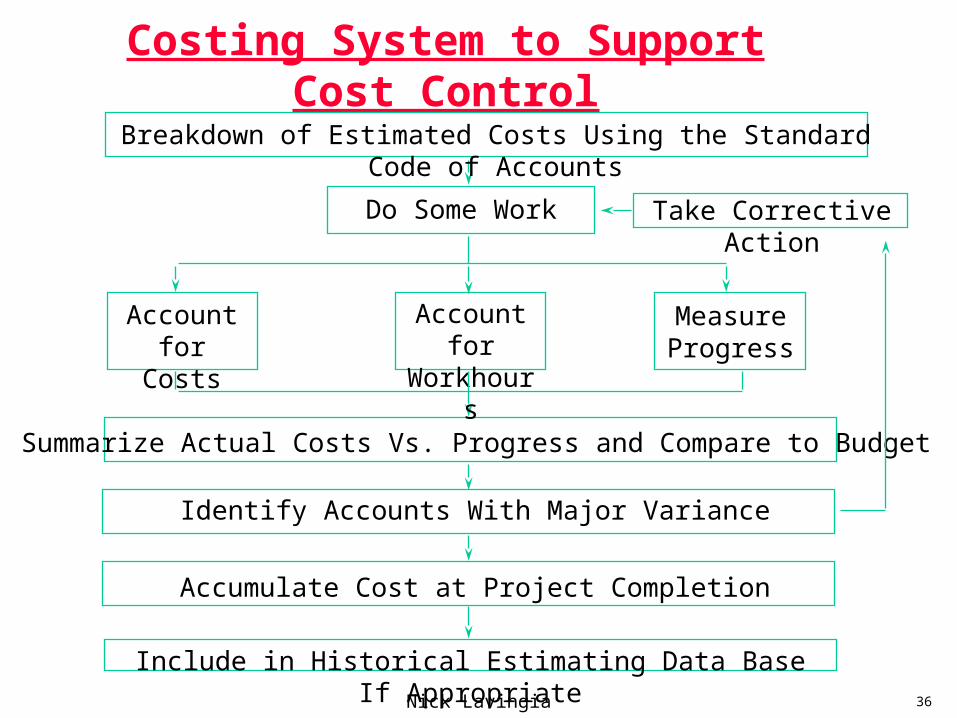
Costing System to Support Cost Control
Summarize Actual Costs Vs. Progress and Compare to Budget
Identify Accounts With Major Variance
Accumulate Cost at Project Completion
Include in Historical Estimating Data Base If Appropriate
Breakdown of Estimated Costs Using the Standard Code of Accounts
Do Some Work
Account for Costs
Account for Workhours
Measure Progress
Take Corrective Action
Nick Lavingia 37
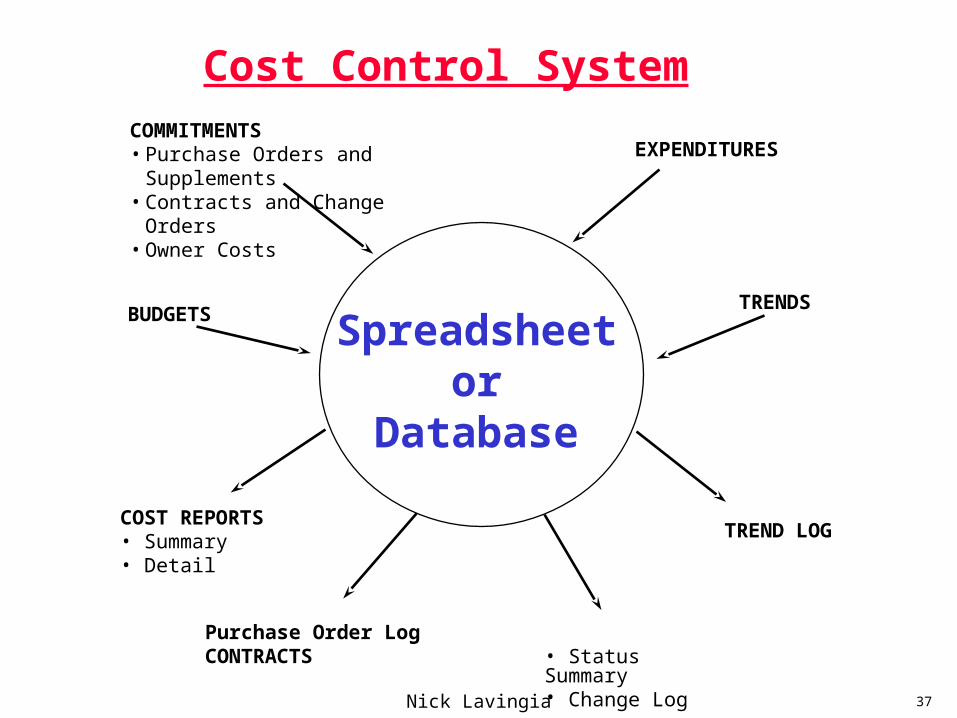
Cost Control System
Spreadsheetor
Database
COMMITMENTS• Purchase Orders and Supplements• Contracts and Change Orders• Owner Costs
BUDGETS
COST REPORTS• Summary • Detail
EXPENDITURES
Purchase Order Log CONTRACTS
TREND LOG
TRENDS
• Status Summary• Change Log
Nick Lavingia 38
Progress Reporting
Nick Lavingia 39
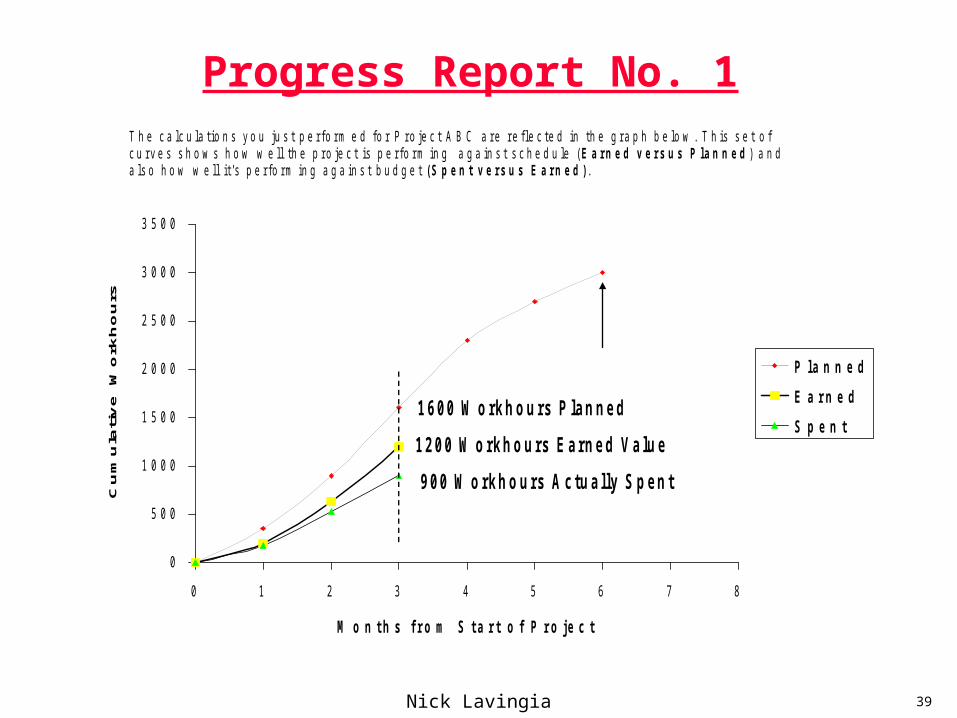
T h e c a l c u l a t i o n s y o u j u s t p e r f o r m e d f o r P r o j e c t A B C a r e r e f l e c t e d i n t h e g r a p h b e l o w . T h i s s e t o fc u r v e s s h o w s h o w w e l l t h e p r o j e c t i s p e r f o r m i n g a g a i n s t s c h e d u l e ( E a r n e d v e r s u s P l a n n e d ) a n da l s o h o w w e l l i t ’ s p e r f o r m i n g a g a i n s t b u d g e t ( S p e n t v e r s u s E a r n e d ) .
0
5 0 0
1 0 0 0
1 5 0 0
2 0 0 0
2 5 0 0
3 0 0 0
3 5 0 0
0 1 2 3 4 5 6 7 8
M o n t h s f r o m S t a r t o f P r o j e c t
Cum
ulat
ive
Wor
khou
rs
P l a n n e dE a r n e dS p e n t
9 0 0 W o r k h o u r s A c t u a l l y S p e n t
1 2 0 0 W o r k h o u r s E a r n e d V a l u e
1 6 0 0 W o r k h o u r s P l a n n e d
Progress Report No. 1
Nick Lavingia 40
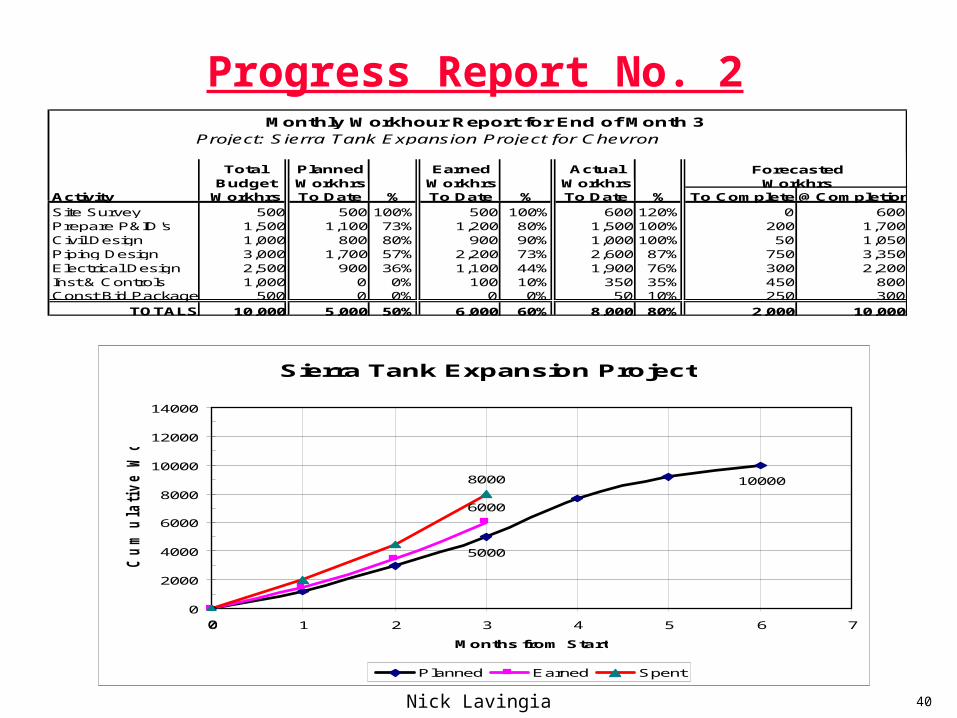
Sierra Tank Expansion Project
0
5000
10000
6000
8000
0
2000
4000
6000
8000
10000
12000
14000
0 1 2 3 4 5 6 7
Months from Start
Cu
mu
lati
ve W
orkh
ou
rs
Planned Earned Spent
Total Planned Earned ActualBudget Workhrs Workhrs Workhrs
Activity Workhrs To Date % To Date % To Date % To Complete @Completion
Site Survey 500 500 100% 500 100% 600 120% 0 600Prepare P&ID's 1,500 1,100 73% 1,200 80% 1,500 100% 200 1,700Civil Design 1,000 800 80% 900 90% 1,000 100% 50 1,050Piping Design 3,000 1,700 57% 2,200 73% 2,600 87% 750 3,350Electrical Design 2,500 900 36% 1,100 44% 1,900 76% 300 2,200Inst & Controls 1,000 0 0% 100 10% 350 35% 450 800Const Bid Package 500 0 0% 0 0% 50 10% 250 300
TOTALS 10,000 5,000 50% 6,000 60% 8,000 80% 2,000 10,000
ForecastedWorkhrs
Monthly Workhour Report for End of Month 3Project: Sierra Tank Expansion Project for Chevron
Progress Report No. 2
Nick Lavingia 41
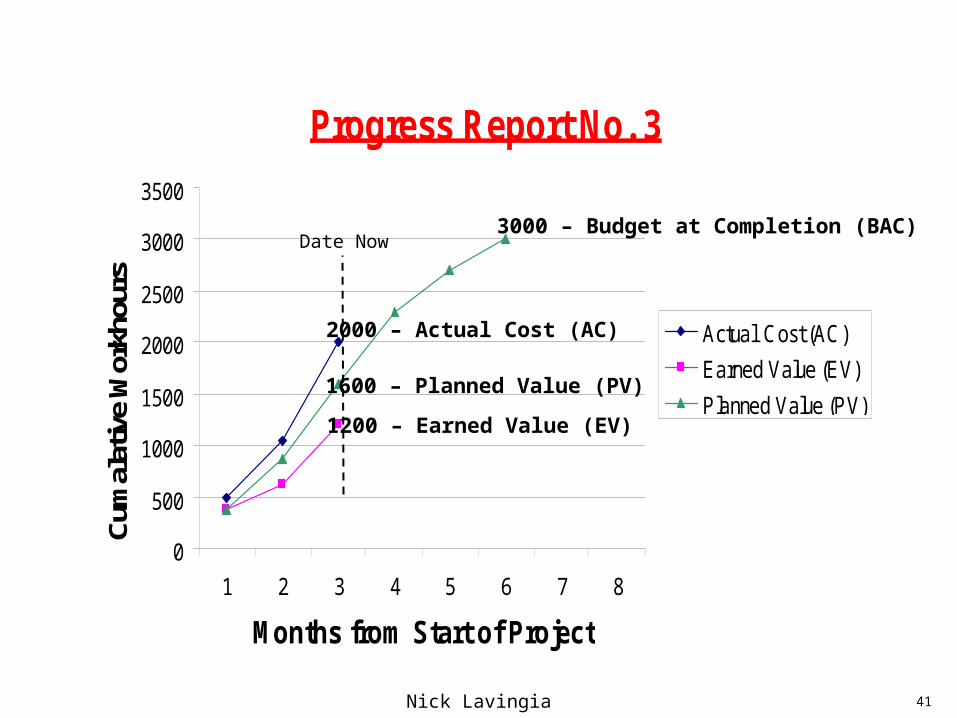
Progress Report No. 3
0
500
1000
1500
2000
2500
3000
3500
1 2 3 4 5 6 7 8
Months from Start of Project
Cum
alat
ive
Wor
khou
rs
Actual Cost (AC)
Earned Value (EV)
Planned Value (PV)
3000 – Budget at Completion (BAC)
2000 – Actual Cost (AC)
1600 – Planned Value (PV)
1200 – Earned Value (EV)
Date Now
Nick Lavingia 42
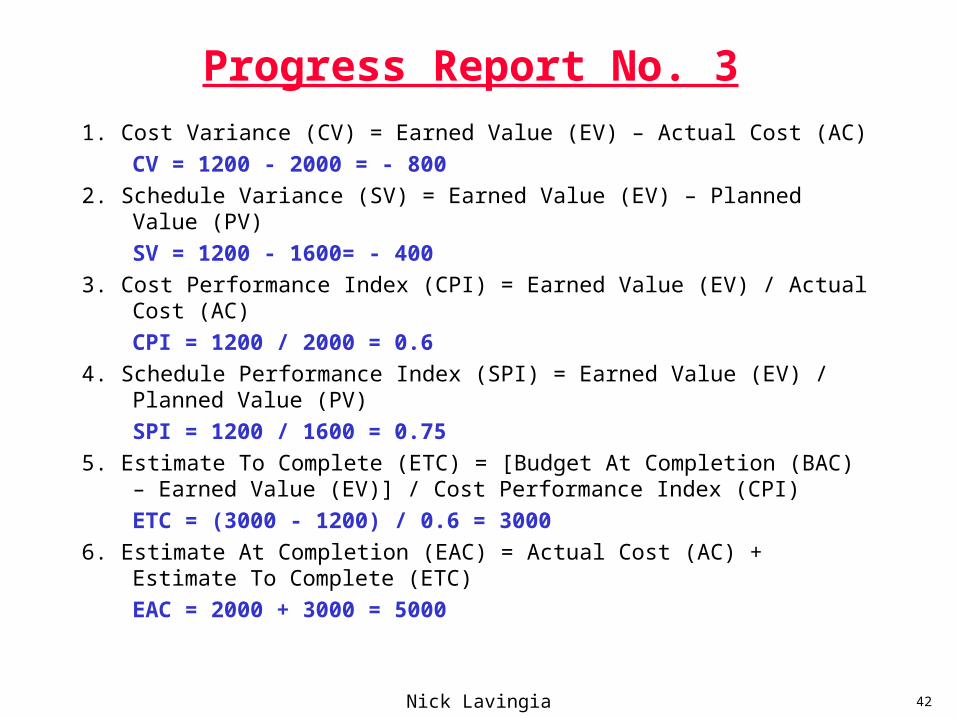
Progress Report No. 3
1. Cost Variance (CV) = Earned Value (EV) – Actual Cost (AC)
CV = 1200 - 2000 = - 800
2. Schedule Variance (SV) = Earned Value (EV) – Planned Value (PV)
SV = 1200 - 1600= - 400
3. Cost Performance Index (CPI) = Earned Value (EV) / Actual Cost (AC)
CPI = 1200 / 2000 = 0.6
4. Schedule Performance Index (SPI) = Earned Value (EV) / Planned Value (PV)
SPI = 1200 / 1600 = 0.75
5. Estimate To Complete (ETC) = [Budget At Completion (BAC) – Earned Value (EV)] / Cost Performance Index (CPI)
ETC = (3000 - 1200) / 0.6 = 3000
6. Estimate At Completion (EAC) = Actual Cost (AC) + Estimate To Complete (ETC)
EAC = 2000 + 3000 = 5000
Nick Lavingia 43
Summary
Structured Project Development & Execution Process and Total Cost Management can help achieve World-Class Project Performance:
• Better• Cheaper• Faster• Safer
PROJECTS