Embed Size (px)
Citation preview
Nomura Conference March 2012
Nick Fanandakis Executive Vice President & CFO
Nomura Conference March 2012
The attached charts include company information that does not conform to generally accepted accounting principles (GAAP). Management believes that an analysis of this data is meaningful to investors because it provides insight with respect to ongoing operating results of the company and allows investors to better evaluate the financial results of the company. These measures should not be viewed as an alternative to GAAP measures of performance. Furthermore, these measures may not be consistent with similar measures provided by other companies.
This data should be read in conjunction with previously published company reports on forms 10-K, 10-Q, and 8-K. These reports, along with reconciliations on non-GAAP measures to GAAP are available on the Investor Center website at www.dupont.com.
Forward Looking Statements During the course of this presentation we may make forward-looking statements or provide forward-looking information. All statements that address expectations or projections about the future are forward-looking statements. Some of these statements include words such as “plans,” “expects,” “will,” "believes," “intends,” and “estimates.” Although they reflect our current expectations, these statements are not guarantees of future performance, but involve a number of risks, uncertainties, and assumptions. Some of those risk factors include: fluctuations in energy and raw material prices; failure to develop and market new products and optimally manage product life cycles; global economic and capital markets conditions; litigation and environmental matters; changes in laws and regulations or political conditions; and business or supply disruptions. The Company does not undertake to update any forward-looking statements as a result of future developments or new information.
Developing Markets Total developing markets is comprised of Developing Asia, Developing Europe, Middle East & Africa, and Latin America. A detailed list of all developing countries is available on the Earnings News Release link on the Investor Center website at www.dupont.com.
Regulation G
2
Nomura Conference March 2012
DuPont is a Market-Driven Science Company
To be the world’s most dynamic science company, creating sustainable solutions essential to
a better, safer, healthier life for people everywhere
DuPont
Vision
3
Nomura Conference March 2012
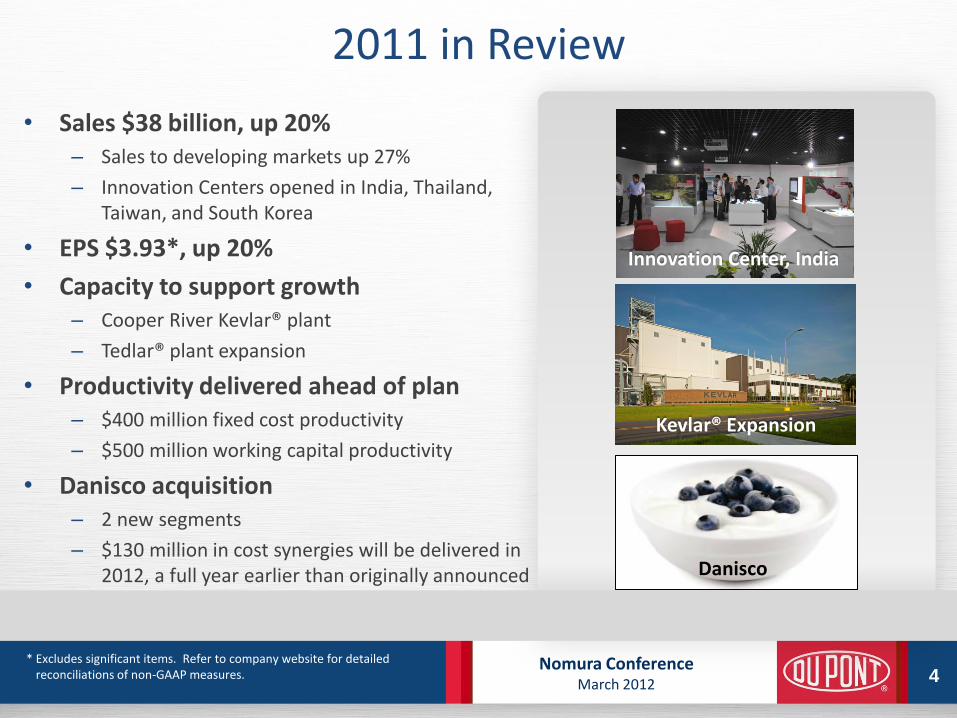
2011 in Review
• Sales $38 billion, up 20% – Sales to developing markets up 27%
– Innovation Centers opened in India, Thailand, Taiwan, and South Korea
• EPS $3.93*, up 20%
• Capacity to support growth – Cooper River Kevlar® plant
– Tedlar® plant expansion
• Productivity delivered ahead of plan – $400 million fixed cost productivity
– $500 million working capital productivity
• Danisco acquisition – 2 new segments
– $130 million in cost synergies will be delivered in 2012, a full year earlier than originally announced
4
Innovation Center, India
Kevlar® Expansion
* Excludes significant items. Refer to company website for detailed reconciliations of non-GAAP measures.
Danisco
Nomura Conference March 2012
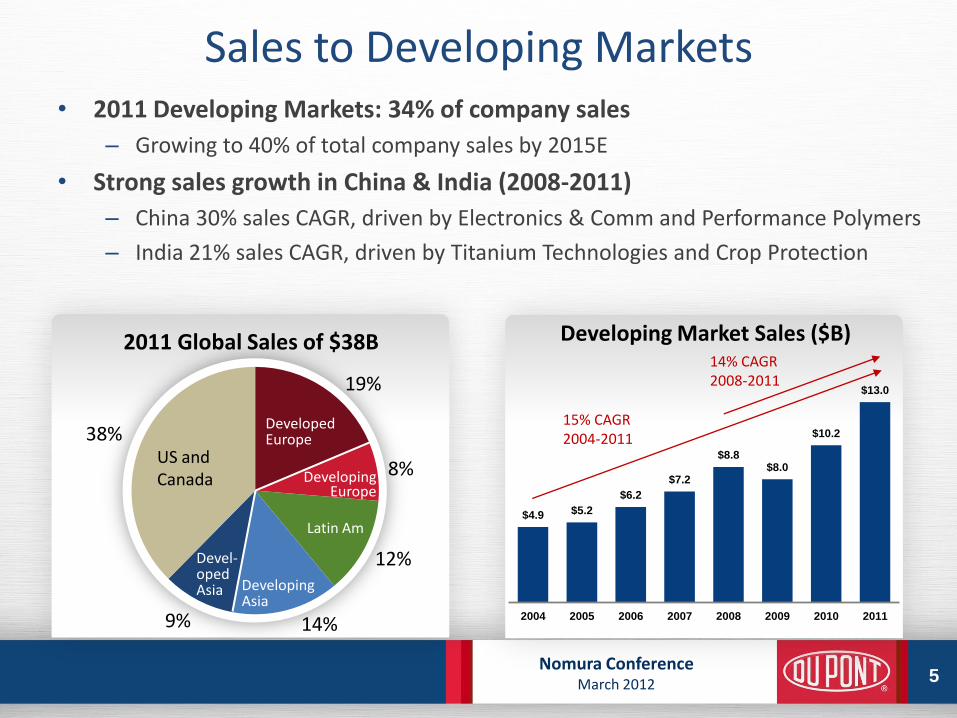
$4.9 $5.2
$6.2
$7.2
$8.8 $8.0
$10.2
$13.0
2004 2005 2006 2007 2008 2009 2010 2011
Sales to Developing Markets • 2011 Developing Markets: 34% of company sales
– Growing to 40% of total company sales by 2015E
• Strong sales growth in China & India (2008-2011)
– China 30% sales CAGR, driven by Electronics & Comm and Performance Polymers
– India 21% sales CAGR, driven by Titanium Technologies and Crop Protection
5
2011 Global Sales of $38B Developing Market Sales ($B)
19%
8%
12%
14% 9%
38% US and Canada Developing
Europe
Developing Asia
Latin Am
Devel- oped Asia
Developed Europe
14% CAGR 2008-2011
15% CAGR 2004-2011
Nomura Conference March 2012
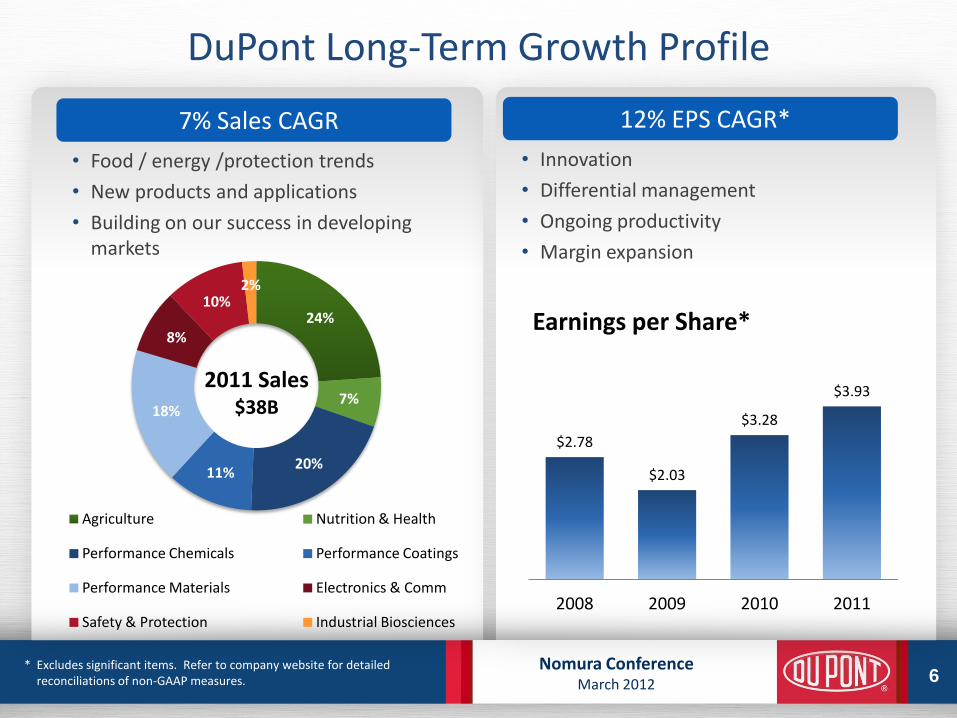
DuPont Long-Term Growth Profile
7% Sales CAGR
• Food / energy /protection trends
• New products and applications
• Building on our success in developing markets
* Excludes significant items. Refer to company website for detailed reconciliations of non-GAAP measures. 6
12% EPS CAGR*
• Innovation
• Differential management
• Ongoing productivity
• Margin expansion
$2.78
$2.03
$3.28
$3.93
2008 2009 2010 2011
Earnings per Share* 24%
7%
20% 11%
18%
8%
10% 2%
2011 Sales $38B
Agriculture Nutrition & Health
Performance Chemicals Performance Coatings
Performance Materials Electronics & Comm
Safety & Protection Industrial Biosciences
Nomura Conference March 2012
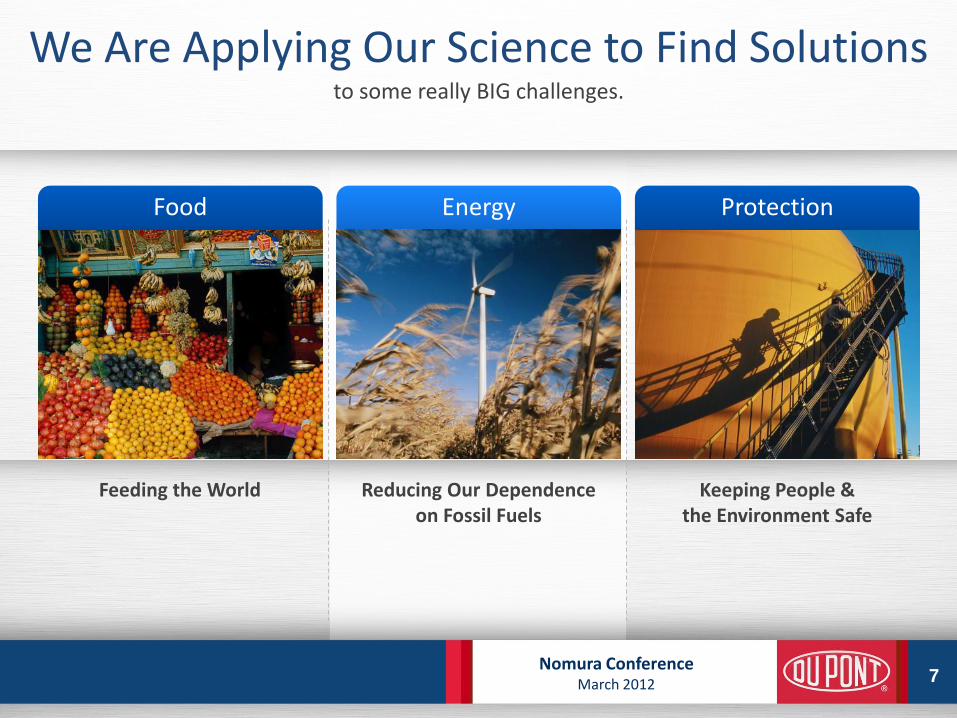
to some really BIG challenges.
We Are Applying Our Science to Find Solutions
7
Food Energy Protection
Feeding the World Reducing Our Dependence on Fossil Fuels
Keeping People & the Environment Safe
Nomura Conference March 2012
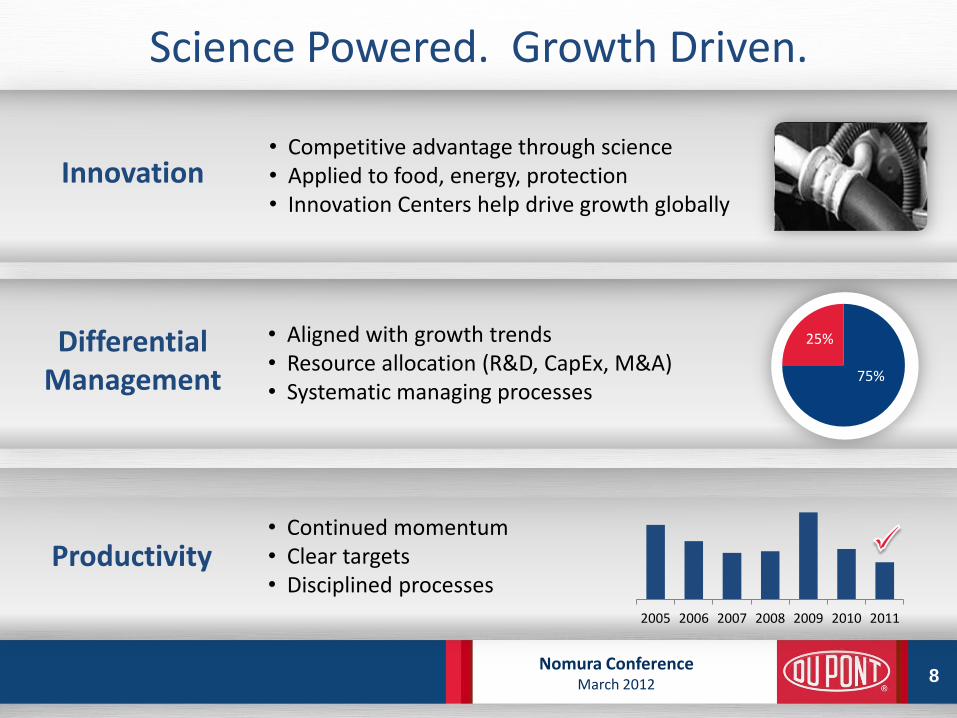
Innovation • Competitive advantage through science • Applied to food, energy, protection • Innovation Centers help drive growth globally
Science Powered. Growth Driven.
8
Differential Management
• Aligned with growth trends • Resource allocation (R&D, CapEx, M&A) • Systematic managing processes
Productivity
25%
75%
2005 2006 2007 2008 2009 2010 2011
• Continued momentum • Clear targets • Disciplined processes
Nomura Conference March 2012
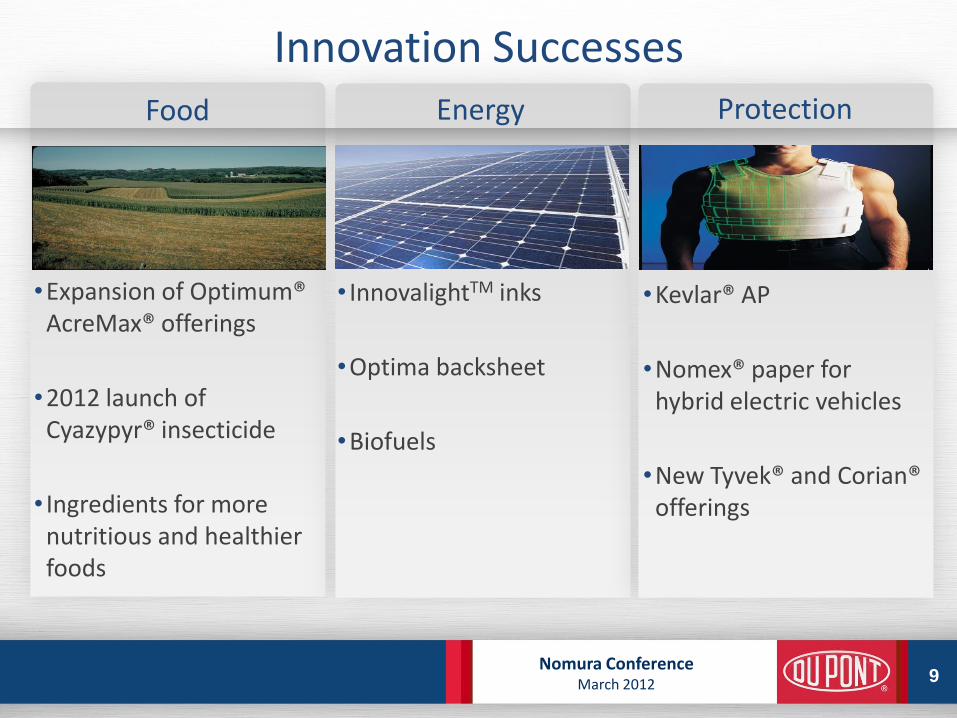
Innovation Successes
•Expansion of Optimum® AcreMax® offerings
•2012 launch of Cyazypyr® insecticide
• Ingredients for more nutritious and healthier foods
9
Food Energy Protection
• InnovalightTM inks
•Optima backsheet
•Biofuels
•Kevlar® AP
•Nomex® paper for hybrid electric vehicles
•New Tyvek® and Corian® offerings
Nomura Conference March 2012
DuPont Growth Strategy
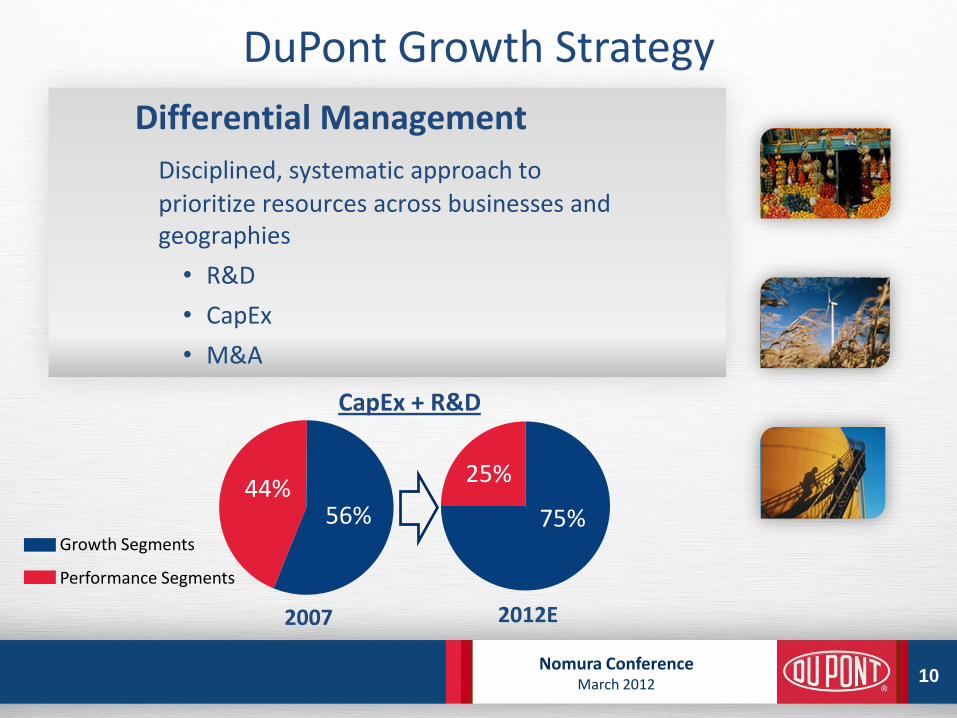
Differential Management
Disciplined, systematic approach to
prioritize resources across businesses and geographies
• R&D
• CapEx
• M&A
10
44% 56%
25%
75% Growth Segments
Performance Segments
CapEx + R&D
2012E 2007
Nomura Conference March 2012
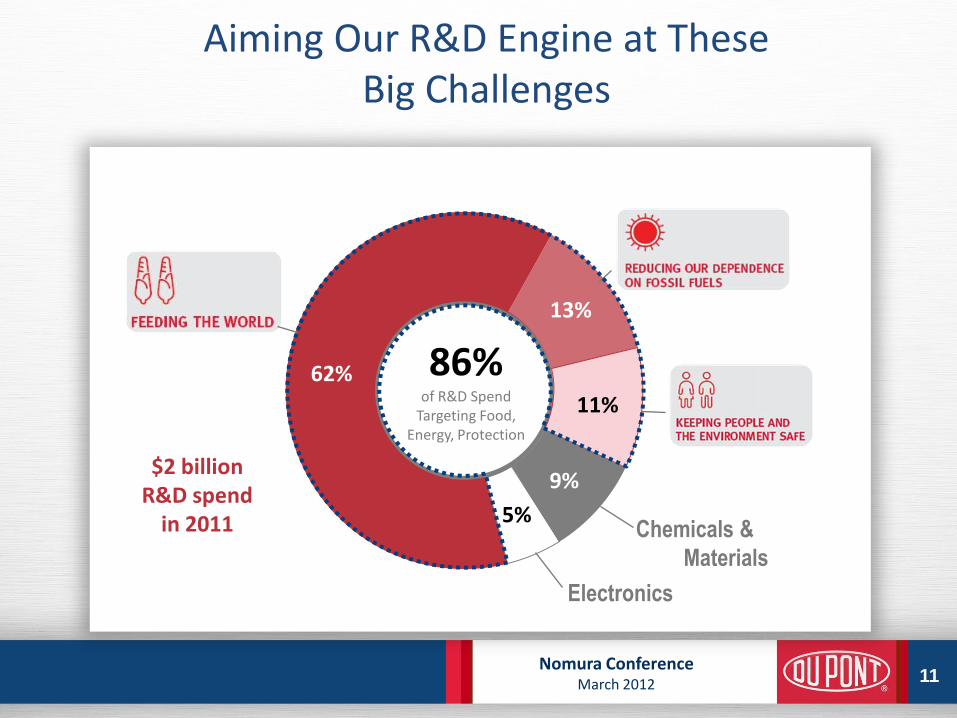
62%
13%
11%
9%
5%
11
86% of R&D Spend
Targeting Food, Energy, Protection
Chemicals &
Materials
Electronics
$2 billion R&D spend
in 2011
Aiming Our R&D Engine at These Big Challenges
Nomura Conference March 2012
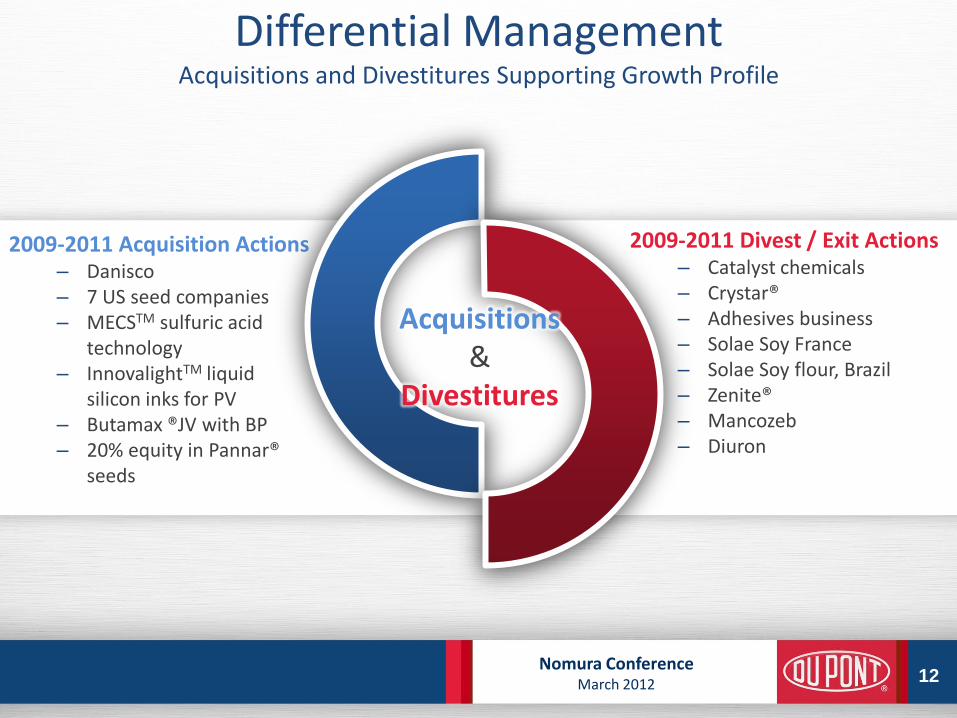
Differential Management Acquisitions and Divestitures Supporting Growth Profile
2009-2011 Acquisition Actions – Danisco – 7 US seed companies – MECSTM sulfuric acid
technology – InnovalightTM liquid
silicon inks for PV – Butamax ®JV with BP – 20% equity in Pannar®
seeds
12
2009-2011 Divest / Exit Actions – Catalyst chemicals – Crystar® – Adhesives business – Solae Soy France – Solae Soy flour, Brazil – Zenite® – Mancozeb – Diuron
Acquisitions &
Divestitures
Nomura Conference March 2012
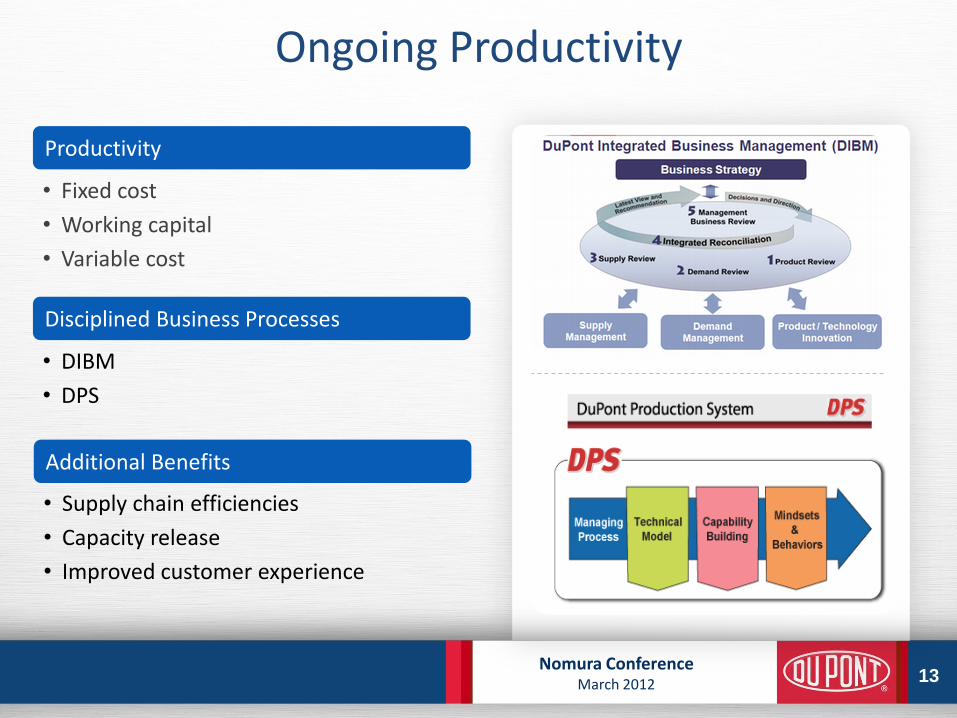
Ongoing Productivity
Productivity
• Fixed cost
• Working capital
• Variable cost
Disciplined Business Processes
• DIBM
• DPS
13
• Supply chain efficiencies
• Capacity release
• Improved customer experience
Additional Benefits
Nomura Conference March 2012
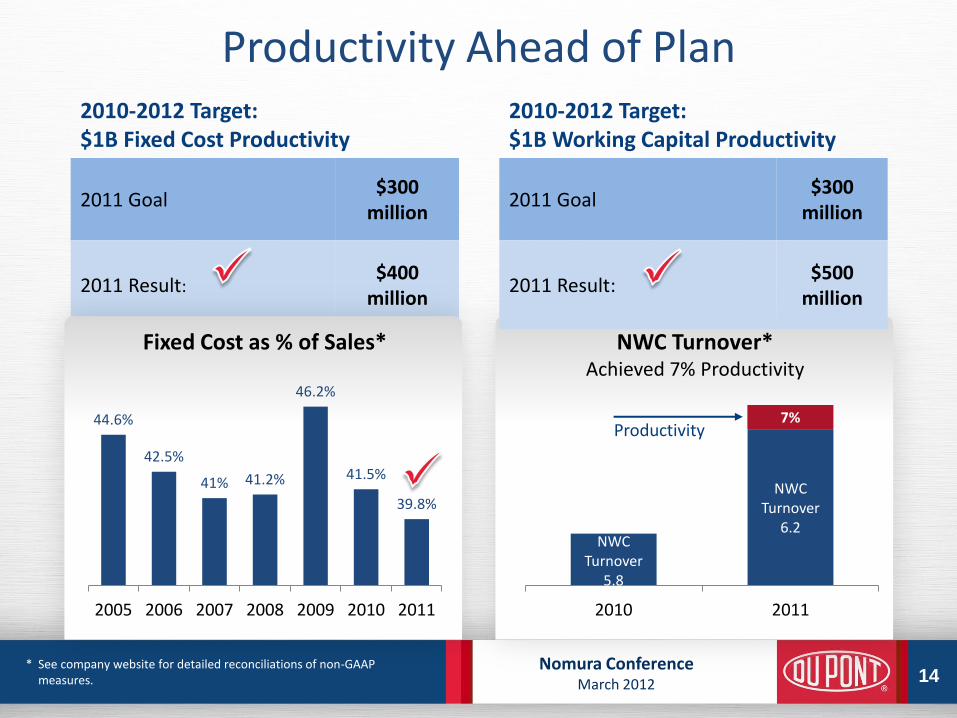
NWC Turnover
5.8
NWC Turnover
6.2
2010 2011
2010-2012 Target: $1B Working Capital Productivity
2011 Goal $300
million
2011 Result: $500
million
2010-2012 Target: $1B Fixed Cost Productivity
2011 Goal $300
million
2011 Result: $400
million
Productivity Ahead of Plan
14
NWC Turnover* Achieved 7% Productivity
* See company website for detailed reconciliations of non-GAAP measures.
Fixed Cost as % of Sales*
44.6%
42.5%
41% 41.2%
46.2%
41.5%
39.8%
2005 2006 2007 2008 2009 2010 2011
7% Productivity
Nomura Conference March 2012
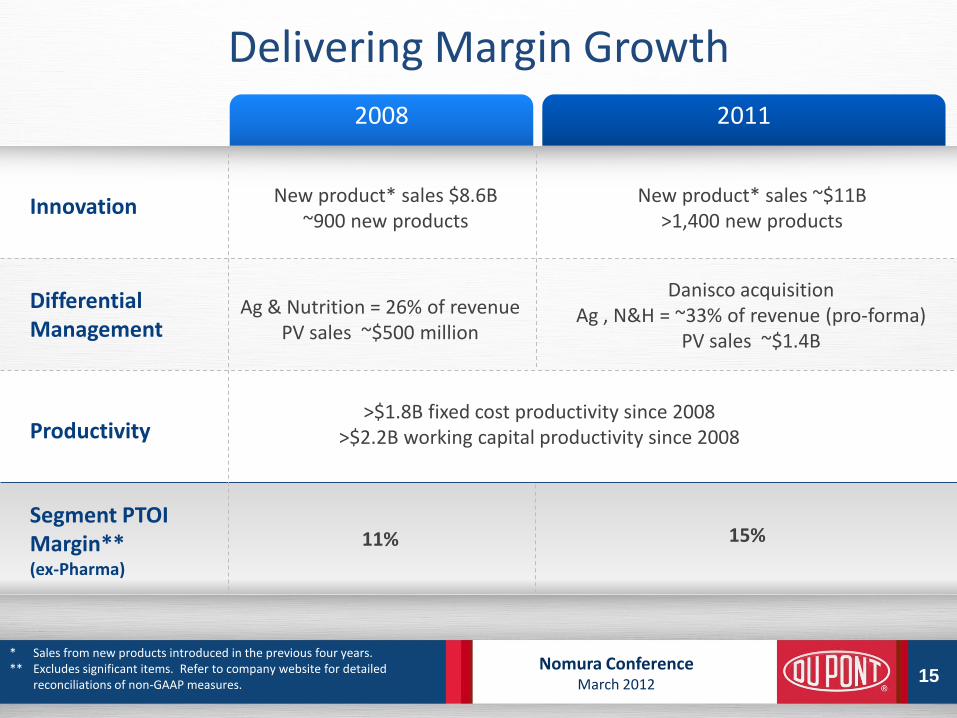
2008 2011
Delivering Margin Growth
15
Innovation
Differential Management
Productivity
Segment PTOI Margin** (ex-Pharma)
New product* sales $8.6B ~900 new products
11%
Ag & Nutrition = 26% of revenue PV sales ~$500 million
Danisco acquisition Ag , N&H = ~33% of revenue (pro-forma)
PV sales ~$1.4B
>$1.8B fixed cost productivity since 2008 >$2.2B working capital productivity since 2008
15%
New product* sales ~$11B >1,400 new products
* Sales from new products introduced in the previous four years. ** Excludes significant items. Refer to company website for detailed
reconciliations of non-GAAP measures.
Nomura Conference March 2012
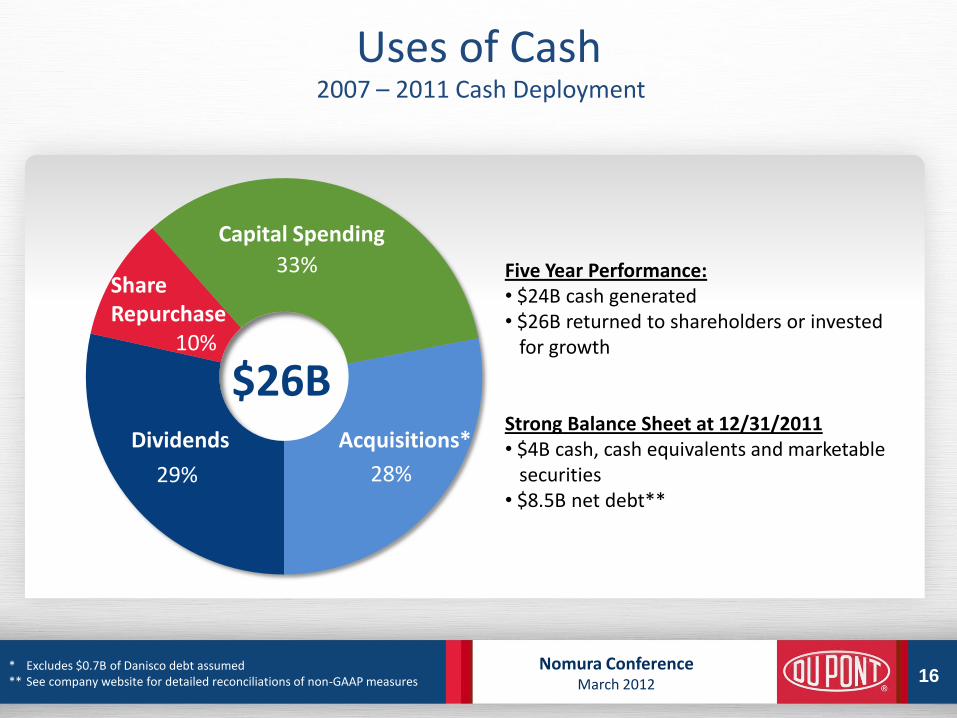
Uses of Cash 2007 – 2011 Cash Deployment
16
29%
10%
33%
28%
Share Repurchase
Dividends Acquisitions*
Capital Spending
Five Year Performance: • $24B cash generated • $26B returned to shareholders or invested for growth Strong Balance Sheet at 12/31/2011 • $4B cash, cash equivalents and marketable securities • $8.5B net debt**
$26B
* Excludes $0.7B of Danisco debt assumed ** See company website for detailed reconciliations of non-GAAP measures
Nomura Conference March 2012
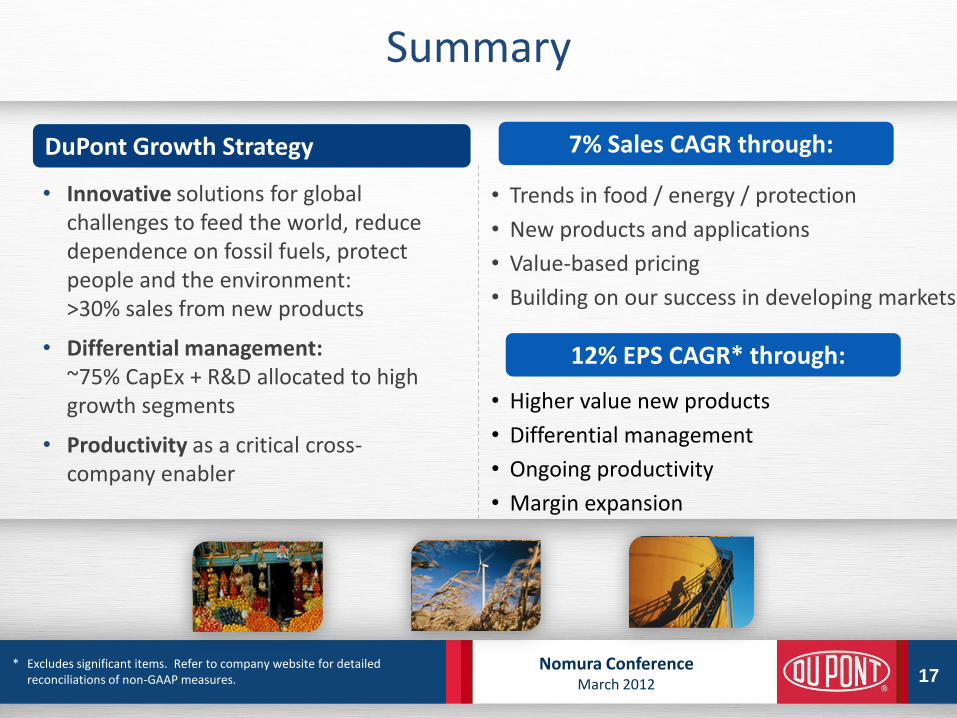
Summary
• Innovative solutions for global challenges to feed the world, reduce dependence on fossil fuels, protect people and the environment: >30% sales from new products
• Differential management: ~75% CapEx + R&D allocated to high growth segments
• Productivity as a critical cross-company enabler
17 * Excludes significant items. Refer to company website for detailed
reconciliations of non-GAAP measures.
DuPont Growth Strategy
• Trends in food / energy / protection
• New products and applications
• Value-based pricing
• Building on our success in developing markets
7% Sales CAGR through:
12% EPS CAGR* through:
• Higher value new products
• Differential management
• Ongoing productivity
• Margin expansion