Embed Size (px)
Citation preview

NICK CALHOUN
DARIUS DOUGLAS
BRITTANY DOUGLAS
Three Year Strategic Plan for 2013-
2015

PRESENTATION OUTLINE I. Introduction of McDonald’s
i. Company Overview
ii. Mission Statement a) McDonald’s
b) Burger King
iii. Vision Statement
II. Internal Assessment
I. Company Values
II. Financial Ratios
III. Organizational Chart I. Current Chart
II. Revised Chart
IV. Marketing Strategy I. Current
II. Revised
V. Strengths/Weakness
VI. IFE
III. External Assessment
I. Competitor Analysis
I. CPM
IV. Strategic Formulation
I. SWOT Matrix
II. Space
III. BCG
IV. Grand Strategy Matrix
V. QSPM
VI. Recommendations
V. Strategy Implementation
I. Strategy Timeline
II. EPS
III. Predicted Financial Statements
IV. Financial Ratios
VI. Conclusion

VISION STATEMENT
Our goal is becoming customers favorite way
and place to eat and drink by serving core
favorites such as the world famous French
Fries, Big Mac, Quarter Pounder and Chicken
McNuggets.

COMPANY OVERVIEW
• McDonald’s began it’s operation in 1948
In 1963 the 500th restaurant was opened
Currently 33,000 locations world wide
• By 1965 the stock offering was $22.50 per share
Current stock price is $87.97
McDonald’s now operates in 119 countries Current Chief Executive Officer is Don Thompson

MCDONALD’S
MISSION STATEMENT
McDonald's brand mission is to be our customers' favorite
place and way to eat. Our worldwide operations are aligned
around a global strategy called the Plan to Win, which
center on an exceptional customer experience – People,
Products, Place, Price and Promotion. We are committed to
continuously improving our operations and enhancing our
customers' experience

MCDONALD’S
MISSION STATEMENT ANALYSIS
Mission Statement only includes the following components:
Market
Concern for survival, growth, and profitability
Philosophies
Mission statement are missing the following components:
Specific Customers
Specific products or services
Technologies
Self-Concept
Concern for public image
Concern for employees
Statement endorses the concept of the four p’s Product
Place
Price
Promotion

BURGER KING MISSION STATEMENT
Every day, more than 11 million guests visit BURGER
KING® restaurants around the world. And they do so
because our restaurants are known for serving high-
quality, great-tasting, and affordable food. Founded in
1954, BURGER KING® is the second largest fast food
hamburger chain in the world. The original HOME OF
THE WHOPPER®, our commitment to premium
ingredients, signature recipes, and family-friendly
dining experiences is what has defined our brand for
more than 50 successful years.

BURGER KING
MISSION STATEMENT ANALYSIS
Does not show any type of technological advances
which could appeal to a younger generation
No self concept and social responsibility to go that
extra mile
Although they are the 2nd largest hamburger fast-food
chain in the world, this should not be indicated
because it shows they are not the best

COMPANY VALUES
We place the customer experience at the core
of all we do.
We are committed to our people
We believe in the McDonald’s System
We operate our business ethically
We grow our business profitably.
We strive continually to improve

FINANCIAL RATIO ANALYSIS
Ratios McDonalds Industry
Price/Earnings 16.45 21.20
Quick Ratio 1.00 0.70
Current Ratio 1.2 1.00
Long Term debt/ Equity 0.48 0.95
Total Debt/ Equity 0.97 1.03
Net Profit Margin 18.1% 8.20%
Return on Assets 16.5% 10.70%
Gross Margin 44.8% 36.70%
Return on Equity 30.3% 25.69%
Return on Capital 20.5% 15.10%
Receivable Turnover 21.6 34.20
Inventory Turnover 133.6 47.00
Asset Turnover 0.8 1.20
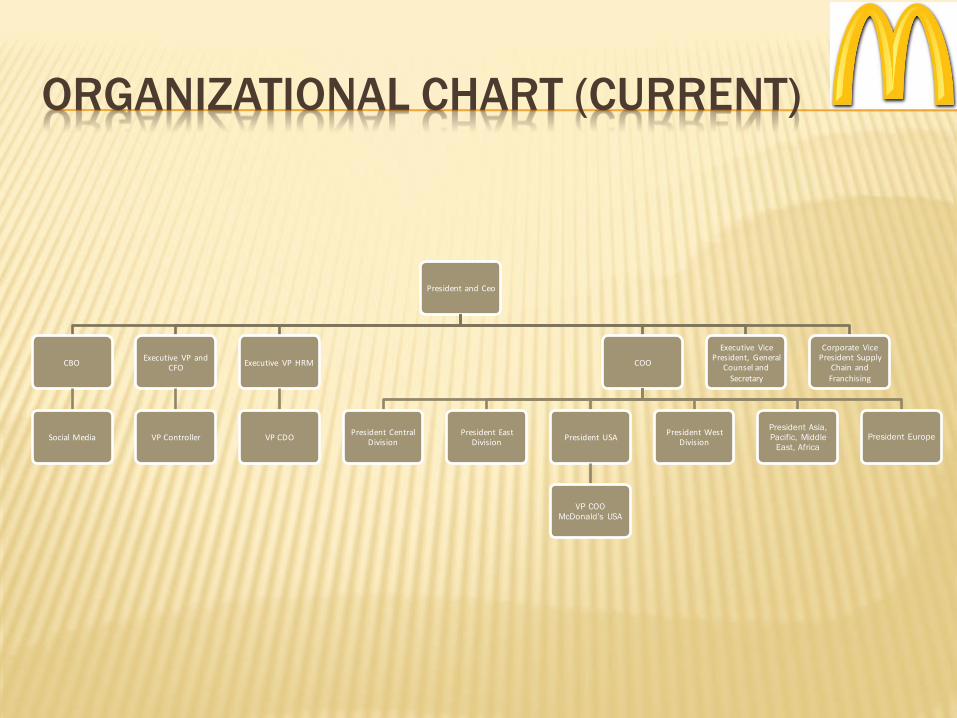
ORGANIZATIONAL CHART (CURRENT)
President and Ceo
CBO
Social Media
Executive VP and CFO
VP Controller
Executive VP HRM
VP CDO
COO
President Central Division
President East Division
President USA
VP COO
McDonald’s USA
President West Division
President Asia,
Pacific, Middle East, Africa
President Europe
Executive Vice President, General
Counsel and Secretary
Corporate Vice President Supply
Chain and Franchising

PROBLEMS WITH ORGANIZATIONAL CHART
Double titles of Top executives; such as CEO and President
Some of the titles are obscure, such as “President USA” and “Executive Vice
President HRM”
President title of Asia, Pacific, Africa, and Middle East should be broken up
into two presidential positions for more effective leadership and region
concentration
No research and development business unit
Unnecessary positions such as “CDO (Chief Diversity Officer)” and “Social
Media”.
Chart shows two COO’s, one for the overall company and one for
McDonald’s USA

REVISED ORGANIZATIONAL CHART
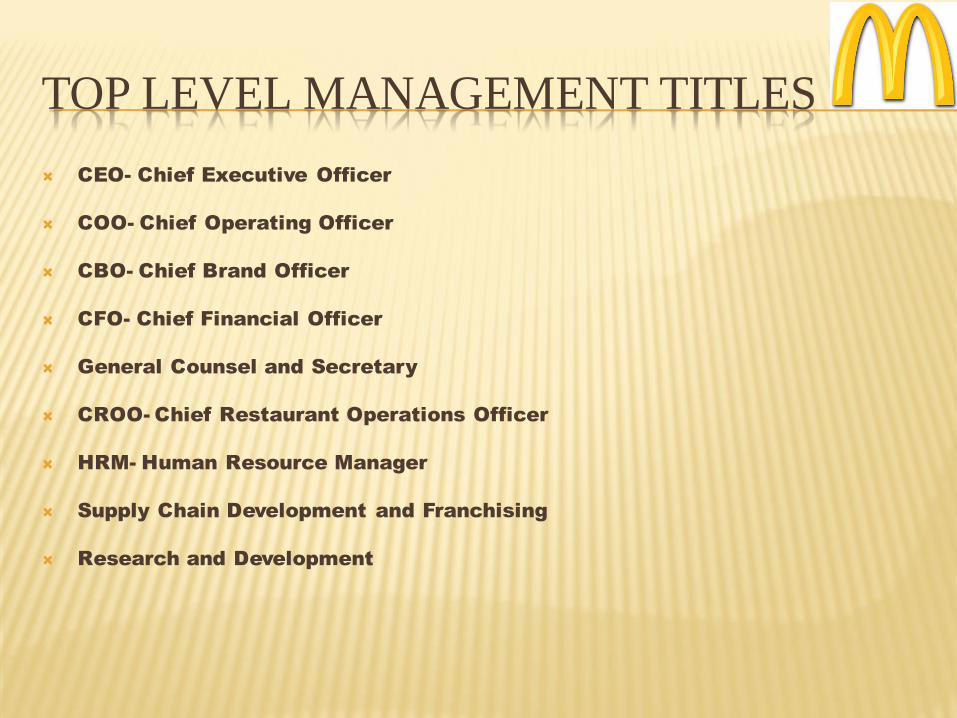
TOP LEVEL MANAGEMENT TITLES
CEO- Chief Executive Officer
COO- Chief Operating Officer
CBO- Chief Brand Officer
CFO- Chief Financial Officer
General Counsel and Secretary
CROO- Chief Restaurant Operations Officer
HRM- Human Resource Manager
Supply Chain Development and Franchising
Research and Development

ORGANIZATIONAL CHART IMPROVEMENTS
Eliminates double titles
Addition of a Research and Development Function
Shows all divisional presidents reporting to the COO
Eliminates the extra COO for McDonald's USA and other unnecessary
positions
President over Asia, Pacific, Middle East, and Africa is broken up into two
positions:
President Asia and Pacific
President Middle East and Africa

PRESENT MARKETING
A restaurant that offers a consistent value menu.
Using a worldwide market and adapt to the needs of their many locations.
President figures in USA, Asia, Europe, Pacific, Middle East, Africa, and even Latin America
Advertising Channels: Internet
Radio
Television
Direct mail
Billboards
-Current Target Market- Families in all cultures

MARKETING POSITIONING MAP
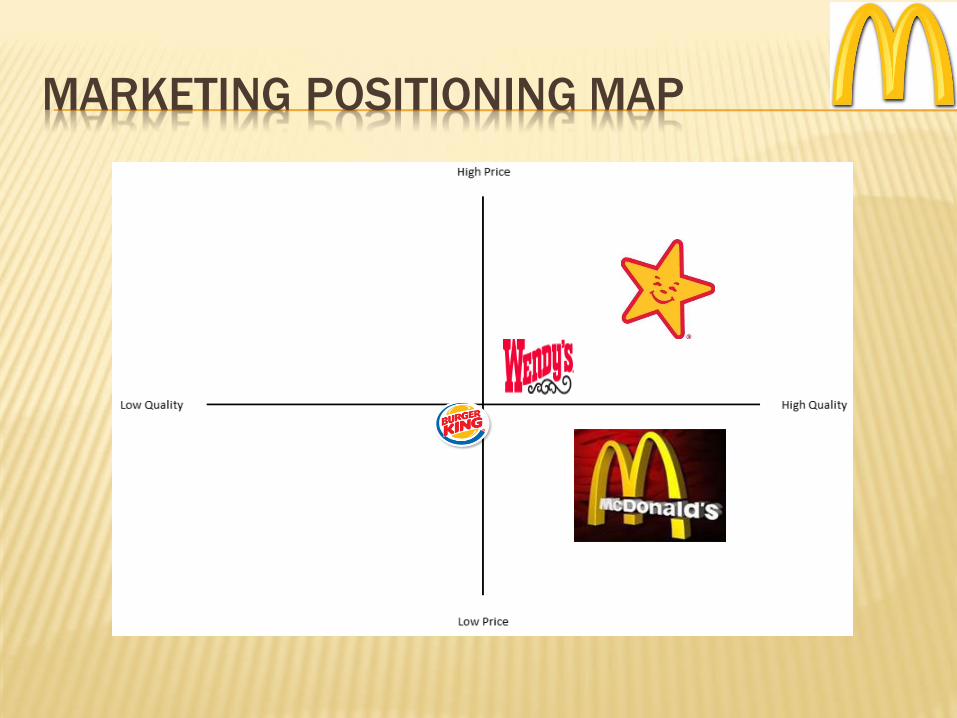
MARKETING POSITIONING MAP

NEW MARKETING STRATEGIES
-Advertise more on social media sites such as Instagram and also on mobile apps such as Pandora.
-Offer more weekly giveaways such as $1000 for one lucky contestant or a $100 McDonald’s gift card.
-Correlate McDonald’s with both basketball AND football.
-Offer different side items for individuals who do not have a desire for french fries. Wendy’s for example offers a variety of side items which can cater to everyone’s needs.
-Invest more in African countries such as Guana. It is one of the more profitable countries in the continent
UPDATED MARKETING SLOGAN

PROGRESSION PLAN
An official progression plan is needed in order to maintain the
success of McDonald’s as the #1 fast-food restaurant in the
world and stay current with an ever-growing world population.
We suggest that each top level manager meet with one another
four times out of the year due to some of them being fairly new
to their positions.
CEO Don Thompson should use an experienced advisor for his
first 2 years in order to ensure accurate running of the
company and command of subordinates.

MAP OF STORE LOCATION
MCDONALD’S BURGER KING
Counties with Burger King
Countries without Burger King

HOW MUCH IS MCDONALD’S WORTH? Method 1: Stock Holders' Equity (in millions) (2011)
Common Stock 16.6
Additional Paid-In Capital 5487
Retained Earnings 36710
Goodwill & Intangibles -2653
Net Worth 39560.6
Method 2: Net Profits
2007 7905
2008 8639
2009 8792
2010 9637
2011 10690
5-Year AVG 9132.6
Method 3: Price-Earnings Ratio
PE Ratio 16.09
AVG Net Inc 5-Years 9132.6M
Worth 146943.5
Method 4: Outstanding Shares
# of Outstanding Shares 157M
MKT Price per Share $93.20 14632.4
AVG of 4 Methods 52567.28
~52 Billion

WEBSITE

WEBSITE

MCDONALD’S WEBSITE ANALYSIS
Homepage shows current promotion o “Monopoly Game”
Categories are clearly listed on the left side of the website
The topic food is at the top showing that it is their main priority o The food section of the website list all of the various items McDonalds
has to offer
o It provides nutritional information
The website is clear and concise with only the important pieces of
information
Website is more interactive in comparison to competitor
The background of the website does not possess much detail that
may attract a customer
Not a clear link to McDonald’s Company website

BURGER KING HOMEPAGE

BURGER KING WEBSITE ANALYSIS
Menu options are listed at the top of the website
Offer social network options Twitter
Offers an option to help find customers the closest restaurant
Company Information is accessible from main page
Option for careers is not easily found on the website
Offers a mobile website and application

STRENGTHS
Operates in 33,000 locations
Has reduced sodium by 10% in various chicken items on the menu
Restaurants have increased the amount of cardboard recycled by 20%
On average 15.8 menu items per market share include a 1/2 serving of fruit
Created a new division line of product such as McCafe
Serves over 47 million customers daily
Created a partnership with the Olympics
Sales have increased by 2.94 billion dollars in 2012

WEAKNESS
Turnover rate for employees is 44%
Quality control throughout the different franchise
Top level management is new to the company
Only operates in three countries in the continent of Africa
Difficult to become a franchisee
Very little training is offered to employees
Website only shows top level management but not the organizational chart

STRENGTHS (IFEM)

WEAKNESSES (IFEM)

COMPETITIVE PROFILE MATRIX
McDonalds Burger King Wendy's
Cri teria Weight Rating Weighted Score Wieght Rating
Weighted Score Weight Rating
Weighted Score
Brand Name 0.25 4 1 0.2 3 0.75 0.18 2 0.5
Product Quality 0.2 2 0.4 0.19 3 0.6 0.21 4 0.8
Price 0.08 4 0.32 0.09 3 0.24 0.11 2 0.16
Advertising 0.05 4 0.2 0.06 3 0.15 0.09 2 0.1
Customer Service 0.2 2 0.4 0.25 4 0.8 0.23 3 0.6
# of Locations 0.15 4 0.6 0.06 2 0.3 0.1 3 0.45
Variety of Menu i tems 0.07 2 0.14 0.15 4 0.6 0.08 3 0.24
Total 1 2.92 1 2.84 1 2.61

OPPORTUNITIES
3% in worldwide population
Fast food industry growth by 5%
25% of consumers eat fast food everyday
Not as many grocery stores in urban areas
Release of new Disney movies
Unemployment rates falls to 6%

THREATS
Multiple stores in a geographic area
Society views on fast food
Fast Food restaurants are required to show
nutritional information.
Imitated by competitors
Sales at local grocery stores
Unemployment rate rises to 9.9%

EFE MATRIX
Opportunities Wieght Rating
Wieghted
Score
3% increase in worldwide population 0.09 3 0.27
Fast-food industry growth by 5% 0.05 4 0.2
Increase in the number of franchisees 0.09 3 0.27
Release of new Disney movies could create
new marketing opportunities 0.05 3 0.15
25% of consumers eat fast-food everyday 0.09 2 0.18
Urban areas struggle to get grocery stores 0.02 3 0.06
Economic growth of 5% in Guana, Kenya, and Angola 0.01 1 0.01
Invest more in northwest areas that lack a restaurant 0.02 3 0.06
Calorie count on menu allows more nutritional info 0.06 4 0.24
The multitasking of Generation Y allows for
more
fast food sales. 0.01 2 0.02
Threats
11. Multiple stores in one geogrphic area 0.04 2 0.08
12. Society's view on fast food 0.06 3 0.18
13. Being imitated by compettitors 0.07 1 0.07
14. Displaying Nutritional data 0.07 4 0.28
15. Competitors have more side items for meals 0.03 2 0.06
16. Gas prices up 14% 0.06 1 0.06
17. Society's perception of fast food 0.05 4 0.2
18.Competitors offer online ordering 0.05 3 0.15
19. Family sized meals 0.02 1 0.02
20. Sales at local grocery stores 0.06 4 0.24
Total 1 2.07
STRATEGIC DIRECTION
The strength of the alignment among the Company, its franchisees and suppliers (collectively referred to as the System) has been key to McDonald’s success. This business model enables McDonald’s to deliver consistent, locally-
relevant restaurant experiences to customers and be an integral part of the communities we serve. In addition, it facilitates our ability to identify, implement and scale innovative ideas that meet customers’ changing needs and
preferences.
McDonald’s customer-focused Plan to Win provides a common framework for our global business yet allows for local adaptation. Through the execution of initiatives surrounding the five elements of our Plan to Win – People, Products,
Place, Price and Promotion – we have enhanced the restaurant experience for customers worldwide and grown comparable sales and customer visits in each of the last eight years. This Plan, combined with financial discipline, has
delivered strong results for our shareholders.

SWOT MATRIX
SO Strategies ST Strategies
Offer more franchises in states with the
least number
Offer family sized meal that have four
servinngs
Provide healthier meal combinations Create an iPhone app that shows
store with shortest lines
Increase dividends by 5% Ceate more side items and desserts
Offer jobs to teenagers Aquire smaller fast food chains
Increase advertising spending by 15% Offer table service to customers that
dine-in

SWOT MATRIX (CONTINUED)
WO Strategies WT StrategiesIncrease MCD stock trade volume Build more stores in African Countries
Incrase treasury stock Offer servings that are beloew 400
calories
Create a new and imroved organiztional
chart
Create more McCafe products
Hire more experienced leaders for top
management
Buy fruits and vegetables locally if
they are availabe
Make the company's website more
interactive
Offer catering at major events

SPACE MATRIX
6
5
4
3
2
1
-6 -5 -4 -3 -2 -1 1 2 3 4 5 6
-1
-2
X Plot
2.8 -3
-4
-5
Y Plot
2.2 -6
FSConservative Aggressive
CA IS
DefensiveES
Competitive
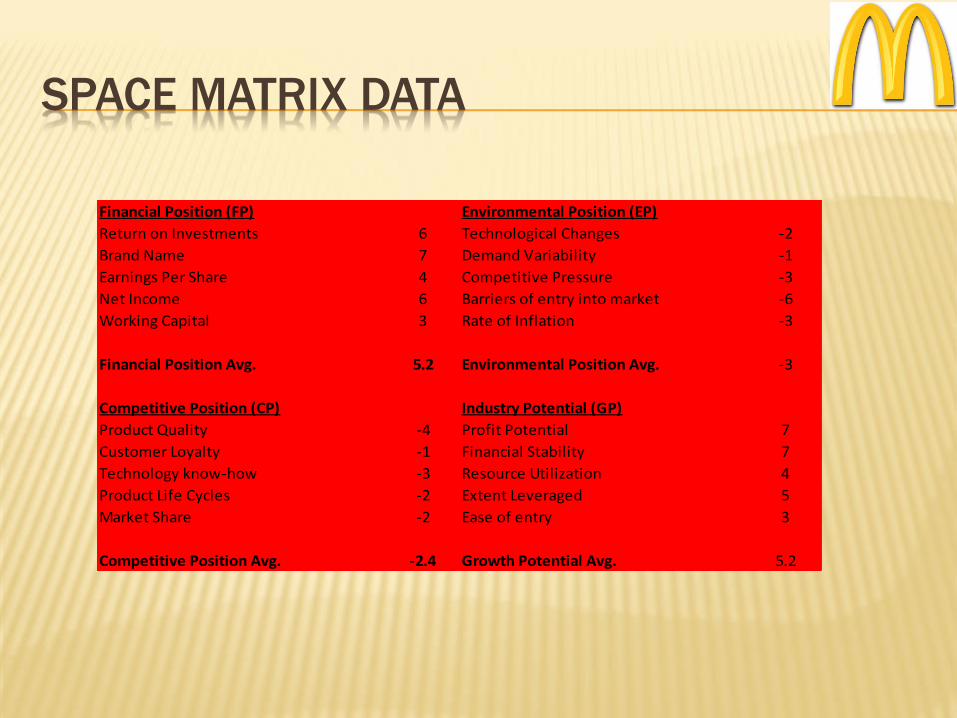
SPACE MATRIX DATA
Financial Position (FP) Environmental Position (EP)
Return on Investments 6 Technological Changes -2
Brand Name 7 Demand Variability -1
Earnings Per Share 4 Competitive Pressure -3
Net Income 6 Barriers of entry into market -6
Working Capital 3 Rate of Inflation -3
Financial Position Avg. 5.2 Environmental Position Avg. -3
Competitive Position (CP) Industry Potential (GP)
Product Quality -4 Profit Potential 7
Customer Loyalty -1 Financial Stability 7
Technology know-how -3 Resource Utilization 4
Product Life Cycles -2 Extent Leveraged 5
Market Share -2 Ease of entry 3
Competitive Position Avg. -2.4 Growth Potential Avg. 5.2

BCG DATA TABLE

BCG MATRIX

GRAND STRATEGY MATRIX
Rapid Market Growth
Weak Strong
Competitive Competitive
Advantage Position
Slow Market GrowthSaturated Market
Moderate Integration
Stronger than Competitors
Slow Company Growth


QSPM (CONTINUED)

QSPM (CONTINUED)

QSPM (CONTINUED)
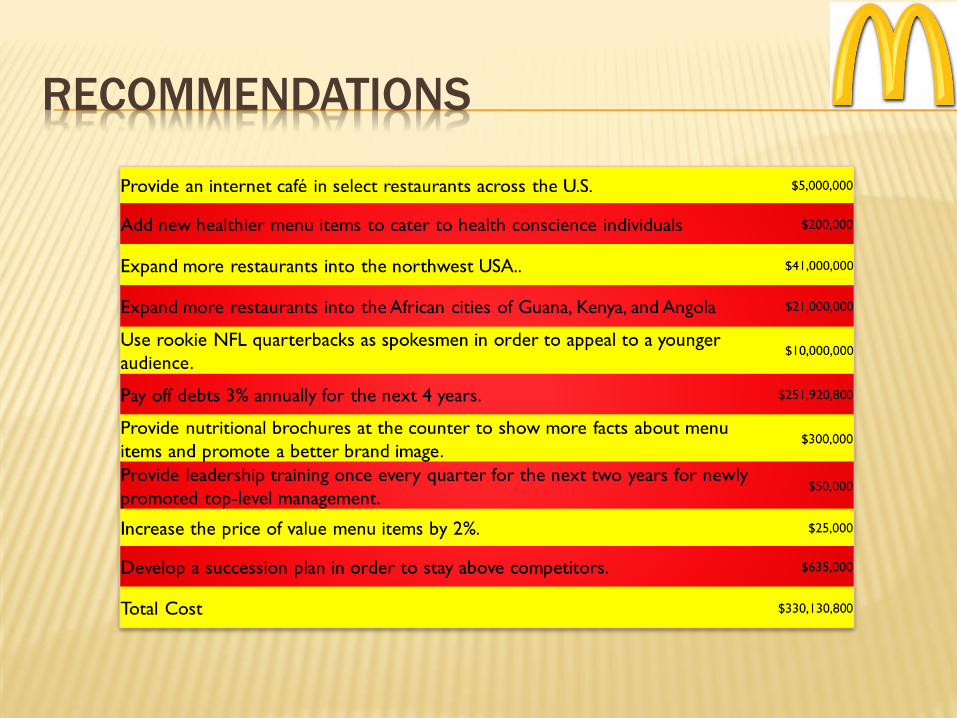
RECOMMENDATIONS

STRATEGICAL TIMELINE

EPIS/EPS ANALYSIS
Common Stock Financing Debt Financing
Recession Normal Boom Recession Normal Boom
$EBIT 900,000,000 450,000,000 900,000,000 900,000,000 450,000,000 900,000,000
$Interest 0 0 0 65,000,000 65,000,000 65,000,000
$EBT 900,000,000 450,000,000 900,000,000 965,000,000 385,000,000 835,000,000
$Taxes 360,000,000 180,000,000 360,000,000 289,500,000 115,500,000 250,500,000
$EAT 540,000,000 270,000,000 540,000,000 675,500,000 269,500,000 584,500,000
#Shares 1044.9 1044.9 1044.9 1008.63 1008.63 1008.63
$ EPS 5.17 2.58 5.17 6.7 2.63 5.8
70% Stock - 30% Debt 70% Debt - 30% Stock
Recession Normal Boom Recession Normal Boom
$EBIT 900,000,000 450,000,000 900,000,000 900,000,000 450,000,000 900,000,000
$Interest 19,500,000 19,500,000 19,500,000 45,500,000 45,500,000 45,500,000
$EBT 919,500,000 430,500,000 880,500,000 945,500,000 404,500,000 854,500,000
$Taxes 275,850,000 129,150,000 264,150,000 283,650,000 121,350,000 256,350,000
$EAT 643,650,000 301,350,000 616,350,000 661,850,000 283,150,000 598,150,000
#Shares 929.4 929.4 929.4 971.58 971.58 971.58
$ EPS 6.92 3.24 6.63 6.81 2.91 6.16
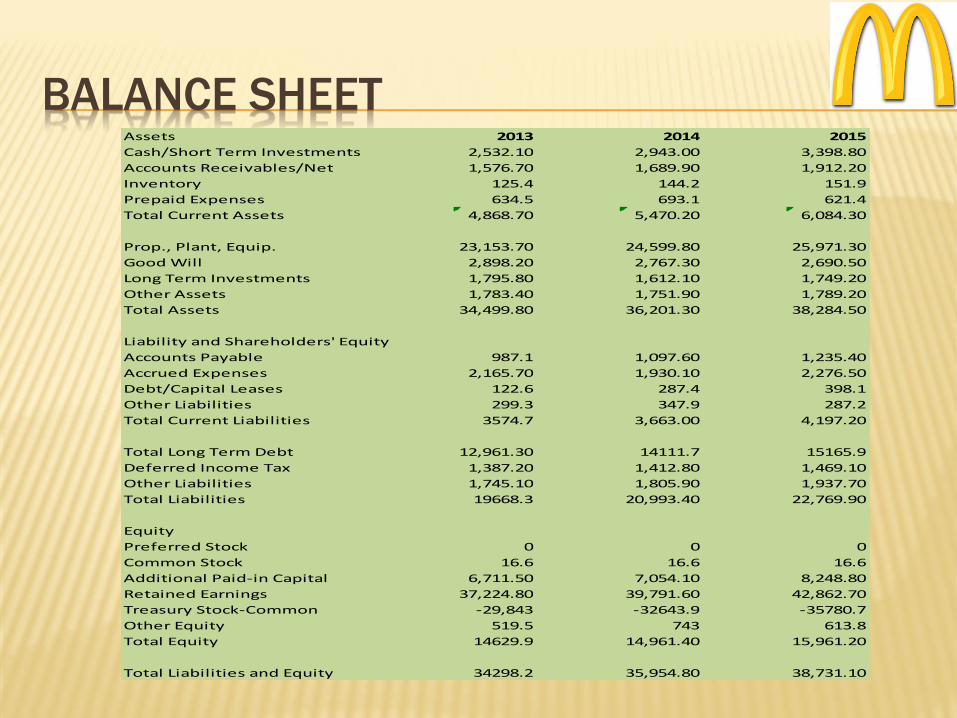
BALANCE SHEET
Assets 2013 2014 2015
Cash/Short Term Investments 2,532.10 2,943.00 3,398.80
Accounts Receivables/Net 1,576.70 1,689.90 1,912.20
Inventory 125.4 144.2 151.9
Prepaid Expenses 634.5 693.1 621.4
Total Current Assets 4,868.70 5,470.20 6,084.30
Prop., Plant, Equip. 23,153.70 24,599.80 25,971.30
Good Will 2,898.20 2,767.30 2,690.50
Long Term Investments 1,795.80 1,612.10 1,749.20
Other Assets 1,783.40 1,751.90 1,789.20
Total Assets 34,499.80 36,201.30 38,284.50
Liability and Shareholders' Equity
Accounts Payable 987.1 1,097.60 1,235.40
Accrued Expenses 2,165.70 1,930.10 2,276.50
Debt/Capital Leases 122.6 287.4 398.1
Other Liabilities 299.3 347.9 287.2
Total Current Liabilities 3574.7 3,663.00 4,197.20
Total Long Term Debt 12,961.30 14111.7 15165.9
Deferred Income Tax 1,387.20 1,412.80 1,469.10
Other Liabilities 1,745.10 1,805.90 1,937.70
Total Liabilities 19668.3 20,993.40 22,769.90
Equity
Preferred Stock 0 0 0
Common Stock 16.6 16.6 16.6
Additional Paid-in Capital 6,711.50 7,054.10 8,248.80
Retained Earnings 37,224.80 39,791.60 42,862.70
Treasury Stock-Common -29,843 -32643.9 -35780.7
Other Equity 519.5 743 613.8
Total Equity 14629.9 14,961.40 15,961.20
Total Liabilities and Equity 34298.2 35,954.80 38,731.10

INCOME
STATEMENT
Revenue 23,788.0 26,589.6 27,173.7
Other Revenue, Total 0.0 0.0 0.0
Total Revenue 23,788.0 26,589.6 27,173.7
Cost of Revenue, Total 14,549.1 14,068.3 12,745.9
Gross Profit 9,238.9 12,521.3 14,427.8
Selling/General/Administrative Expenses, Total 2,182.7 2,054.3 1,995.2
Research & Development 0.0 0.0 0.0
Depreciation/Amortization 0.0 0.0 0.0
Interest Expense (Income), Net Operating 0.0 0.0 0.0
Unusual Expense (Income) -10.8
77.4
-101.6
Other Operating Expenses, Total 0.0 0.0 0.0
Operating Income
7,056.2
10,467.0 12,432.6
Interest Income (Expense), Net Non-Operating 0.0 0.0 0.0
Gain (Loss) on Sale of Assets 0.0 0.0 0.0
Other, Net -32.5 -41.2 -17.6
Income Before Tax 6,761.2 10,085.3 11,987.0
Income Tax - Total 1,978.1 2,122.0 2,343.0
Income After Tax 5,783.1 7,963.3 9,644.0
Minority Interest 0.0 0.0 0.0
Equity In Affiliates 0.0 0.0 0.0
U.S. GAAP Adjustment 0.0 0.0 0.0
Net Income Before Extra. Items 5,783.1 7,963.3 9,644.0
Total Extraordinary Items 0.0 0.0 0.0
Net Income 5,783.1 7,963.3 9,644.0
2013 2014 2015

PROJECTED FINANCIAL RATIOS