Embed Size (px)
Citation preview

Nick Bard Hydro Services
25/06/2007
Nick Bard Hydro Services [email protected]
+44 (0)7765 996 581
River Dart Hydro Performance Assessment
By Nick Bard Hydro Services
For Mannpower Consulting Ltd
Client Mannpower Consulting Ltd
Title River Dart Country Park Archimedes Screw System Performance
Assessment
Author N. Bard
Document No. 038
Revision Description Issue Date
A Draft 20/06/2007 B Final for Approval 22/06/2007
C 1 Amendment made, Section 8.1 25/06/2007

Nick Bard Hydro Services
River Dart Hydro Performance Assessment Page 2 of 28
Revision C, June 2007
1 Executive Summary
This study was commissioned by Mannpower Consulting as an independent assessment of the performance of the first UK installation of the Archimedes Screw Turbine, manufactured by Ritz Atro in Germany. The installation is at River Dart Country Park in Devon. The installation features an innovative variable speed control system, manufactured by GP Electronics, which allows the turbine to rotate at variable speed. This allows the turbine to operate at part flow with no reduction in head. The equipment has a maximum output of 65kW although the capacity of the leat currently limits output to 48 kW. The aims of the testing were to chart the system performance and compare it to manufacturer predictions and to compare the variable speed control system to the traditional constant speed system. The comparison to manufacturer predictions was not straightforward as the predictions are for a constant speed system. The testing involved use of a Dumpy level to measure head, ultrasonic flow sensor to measure flow and clamp meter to measure electrical power. The accuracy of each measurement was estimated and used to provide bounds on the results obtained. A single day of testing was carried out on 4th June 2007. Due to time constraints it was not possible to obtain accurate flow readings at reduced flows. 8 separate measurements were obtained:
• 2 at maximum flow (constrained by the availability of water on the test day) with the turbine operating at variable speed
• 1 at maximum flow with the turbine operating at a constant speed • 5 at reduced flows with the turbine operating at variable speed
The key measurement was with the turbine operating at maximum flow at variable speed. This gave a water to wire efficiency of 0.73 ± 0.07 at approximately 60% of the turbine’s rated capacity. This exceeds the manufacturer’s prediction for a constant speed system by 4%. If the manufacturer’s data on generator and transmission performance is used (there may be variation as the system is operating at a different speed) this equates to a turbine efficiency of 0.86 ± 0.07. The reading at constant speed allowed comparison with manufacturer’s data under almost the same conditions. With some manipulation to account for a variation in the testing speed, the result is shown in Figure 1 below.

Nick Bard Hydro Services
River Dart Hydro Performance Assessment Page 3 of 28
Revision C, June 2007
Figure 1 – Constant speed comparison to manufacturer’s data
0%
10%
20%
30%
40%
50%
60%
70%
80%
0 0.2 0.4 0.6 0.8 1
Flow Fraction F
Gro
ss S
yste
m E
ffic
iency
Manufacturer Prediction
Test Result
At reduced flows, the results obtained followed roughly the manufacturer’s prediction however the inaccuracy in flow measurement at reduced flows meant that conclusions could not be drawn. The inverter system was tested over a range of power outputs and found to have a maximum efficiency of 96% ± 5% at 40kW output reducing to 86% at 9 kW. Based on the measurements taken at maximum available flow, the efficiency of the variable speed system was 3% (with bounds of ± 14%) higher than the constant speed system. When comparing the constant and variable speed systems the two key factors affecting the system efficiency are:
• The inefficiency in the variable speed system due to the requirement for an inverter to condition the power output.
• The inefficiency in the constant speed system due to reduced net head. This is most important at low flow fractions.
Initial calculations quantifying these two effects suggest that the variable speed system may be more efficient at below a critical flow fraction and the constant speed system may be more efficient above this value. This implies that the flow duration curve at any site will affect the value of the variable speed drive. This critical flow fraction will be higher at sites with lower head and lower for higher head sites and therefore the head at the site also affects the worth of the variable speed drive. At this site, the critical flow fraction is estimated to be 73% of the rated flow of the turbine. At this site the turbine operates at a flow of less than 73% for 100% of the time and it is therefore likely that the variable speed drive is a worthwhile investment. An innovation in the control system could be a switch to constant speed operation above the critical flow fraction bypassing the inverter. This would maximise output across the entire range of flows. Overall, the testing was sufficient to draw some preliminary conclusions about system performance, comparison to manufacturer’s predictions and the use of variable/constant speed operation. Further testing is recommended to verify the results observed and carry out full and accurate measurements over the entire range of flows.
Nick Bard Hydro Services
River Dart Hydro Performance Assessment Page 4 of 28
Revision C, June 2007
2 Contents
1 Executive Summary .............................................................................................................. 2
2 Contents............................................................................................................................... 4
3 Overview .............................................................................................................................. 5
3.1 Introduction……………………………………………………………………………………………………………5
3.2 Aims and Objectives……………………………………………………………………………………………….5
4 Method ................................................................................................................................. 7
4.1 Variables………………………………………………………………………………………………………………..7
4.2 Test Procedure……………………………………………………………………………………………………..11
5 System Operation............................................................................................................... 12
6 Predicted Performance ....................................................................................................... 13
6.1 Ritz Atro………………………………………………………………………………………………………………13
6.2 GP Electronics………………………………………………………………………………………………………15
7 Test Results........................................................................................................................ 16
7.1 Maximum Flow Test………………………………………………………………………………………………16
7.2 Constant Speed…………………………………………………………………………………………………….17
7.3 Reduced Flow……………………………………………………………………………………………………….17
7.4 Inverter Performance…………………………………………………………………………………………….18
8 Discussion .......................................................................................................................... 19
8.1 Maximum Flow……………………………………………………………………………………………………..19
8.2 Constant Speed…………………………………………………………………………………………………….21
8.3 Reduced Flow……………………………………………………………………………………………………….22
8.4 Inverter Performance…………………………………………………………………………………………….23
9 Conclusions ........................................................................................................................ 25
Appendix A. Symbols Used..................................................................................................... 27
Nick Bard Hydro Services
River Dart Hydro Performance Assessment Page 5 of 28
Revision C, June 2007
3 Overview
3.1 Introduction
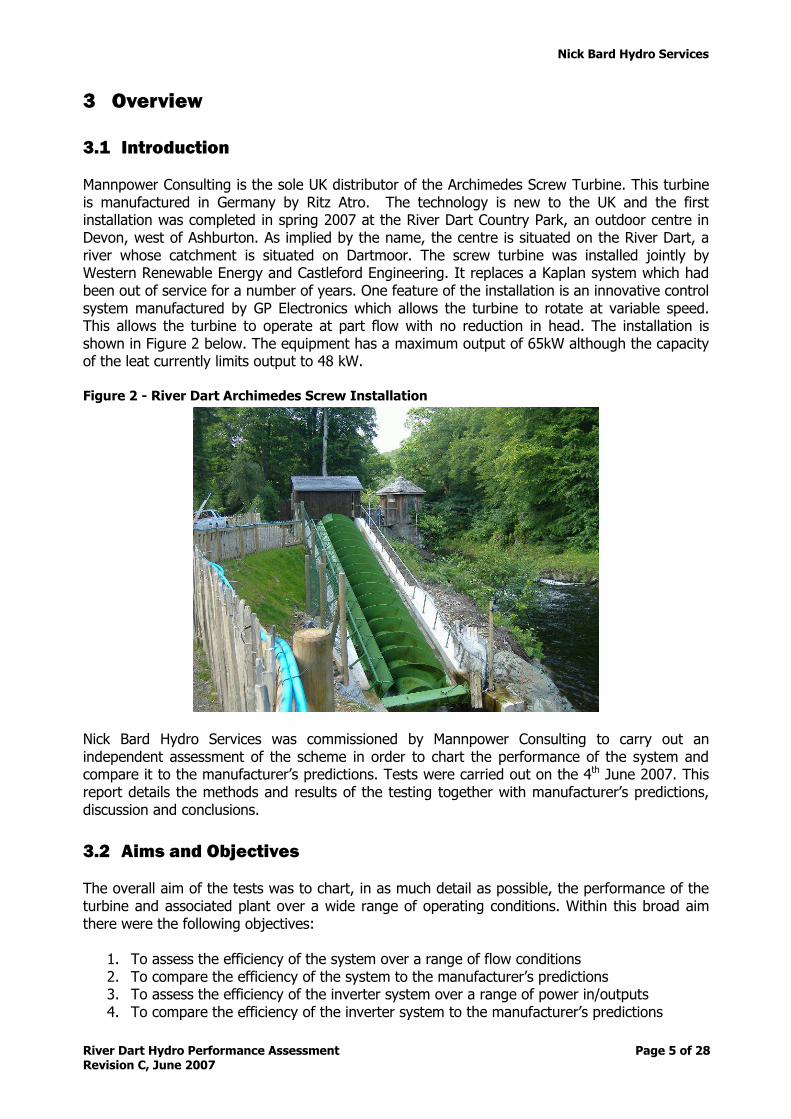
Mannpower Consulting is the sole UK distributor of the Archimedes Screw Turbine. This turbine is manufactured in Germany by Ritz Atro. The technology is new to the UK and the first installation was completed in spring 2007 at the River Dart Country Park, an outdoor centre in Devon, west of Ashburton. As implied by the name, the centre is situated on the River Dart, a river whose catchment is situated on Dartmoor. The screw turbine was installed jointly by Western Renewable Energy and Castleford Engineering. It replaces a Kaplan system which had been out of service for a number of years. One feature of the installation is an innovative control system manufactured by GP Electronics which allows the turbine to rotate at variable speed. This allows the turbine to operate at part flow with no reduction in head. The installation is shown in Figure 2 below. The equipment has a maximum output of 65kW although the capacity of the leat currently limits output to 48 kW. Figure 2 - River Dart Archimedes Screw Installation
Nick Bard Hydro Services was commissioned by Mannpower Consulting to carry out an independent assessment of the scheme in order to chart the performance of the system and compare it to the manufacturer’s predictions. Tests were carried out on the 4th June 2007. This report details the methods and results of the testing together with manufacturer’s predictions, discussion and conclusions.
3.2 Aims and Objectives
The overall aim of the tests was to chart, in as much detail as possible, the performance of the turbine and associated plant over a wide range of operating conditions. Within this broad aim there were the following objectives:
1. To assess the efficiency of the system over a range of flow conditions 2. To compare the efficiency of the system to the manufacturer’s predictions 3. To assess the efficiency of the inverter system over a range of power in/outputs 4. To compare the efficiency of the inverter system to the manufacturer’s predictions

Nick Bard Hydro Services
River Dart Hydro Performance Assessment Page 6 of 28
Revision C, June 2007
5. To compare the variable speed control system installed to the standard constant speed system and assess whether it will significantly increase the energy yield of a hydropower site.
Nick Bard Hydro Services
River Dart Hydro Performance Assessment Page 7 of 28
Revision C, June 2007
4 Method
This Section contains two subsections. The first defines all the relevant variables which were measured or calculated as part of this assessment as well as describing the measurement methodology and accuracy. The section subsection describes the procedure used to carry out each full test of system performance. It should be noted that an ad hoc approach to inaccuracy in measurement has been taken. For each measured quantity, an estimate of the inaccuracy (or tolerance) of the measurement has been made based on the capabilities of the equipment and the variations observed during measurement. These estimates have then been used to provide bounds within which results of efficiency calculations are expected to lie.
4.1 Variables
All variables requiring measurement/calculation, together with their assessment method, accuracy and symbol are presented in the sections below. Appendix A contains a reproduction of all symbols used in order to facilitate quick reference.
4.1.1 Head
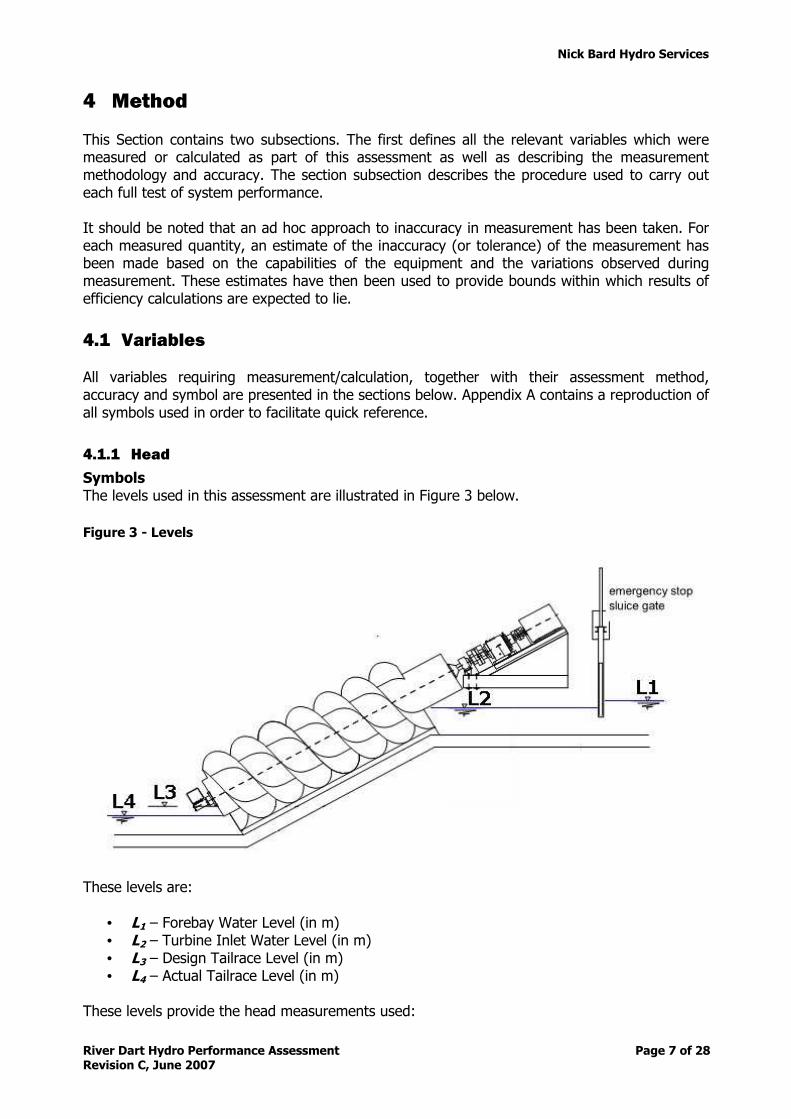
Symbols The levels used in this assessment are illustrated in Figure 3 below.
Figure 3 - Levels
These levels are:
• L1 – Forebay Water Level (in m) • L2 – Turbine Inlet Water Level (in m) • L3 – Design Tailrace Level (in m) • L4 – Actual Tailrace Level (in m)
These levels provide the head measurements used:

Nick Bard Hydro Services
River Dart Hydro Performance Assessment Page 8 of 28
Revision C, June 2007
• Hgross – Gross Head (in m). [Hgross = L1 – L4] • Hnet – Net Head (in m). [Hnet = L2 – L4] • Hz – Intake head loss (in m). [Hz = L1 – L2]
Measurement Levels were measured using a Dumpy level to provide the levels of the forebay tank wall, turbine inlet wall, tailrace wall and the top edge of the lower bearing beam relative to a datum level. L1, L2, L3 and L4 were then measured relative to these fixed levels using a staff in the case of L1, L2 and L4 and by measuring from the ‘As Installed’ drawing in the case of L3. Accuracy The accuracy in taking Dumpy levels was estimated to be ± 0.5 cm per reading. The accuracy of measuring L1 and L2 from these dumpy levels was a further ± 0.5 cm as the upstream levels were stable during turbine operation. The accuracy of measuring L3 from the Dumpy level was taken as zero (drawing assumed to be correct). There was a notable oscillation in the tailrace level due to the uneven release rate of water caused by the finite number of blades. This oscillation was greater for larger flow rates and therefore the accuracy of measurement was dependent on flow rate. It varied from ± 1 cm at the lowest flow to ± 3 cm at the highest flow. During an individual test variation in head during the test period may have added a further ±0.5 cm inaccuracy. Based on these values, the accuracy of the head measurements is shown in Table 1 below. Table 1 – Head Measurement Accuracy
Quantity Accuracy Typical percentage
Hgross ± 3 – 5 cm ± 0.9%
Hnet ± 3 – 5 cm ± 0.9%
4.1.2 Flow
Symbols The symbols used for flow measurements in this assessment are:
• Q – Flow through the turbine (in m3s-1) • Qrated – Rated flow of the turbine (in m
3s-1) Based on these flows, the following quantities are used:
• F – Flow Fraction (dimensionless). [F = Q/Qrated] Measurement To measure flows, the Nivus Portable Flow Meter PCM4 was used in combination with the Water Ultrasonic Combi Sensor. This uses an ultrasonic wedge sensor to measure the velocity profile of the water and uses an algorithm to calculate the flow based on this profile and the geometry of the channel it is installed in. During the testing, the flow sensor was installed in two different positions:
• Position 1 – The sensor was installed in a straight section of the leat which feeds the turbine. The leat has a rectangular cross section and the sensor was installed at the midpoint of the leat bottom pointing directly upstream. The sensor was installed 7 metres downstream of a bend (of approximately 45 degrees) and 6.5m upstream of a bend (of approximately 90 degrees). The channel is 2.152m wide at this point. It is

Nick Bard Hydro Services
River Dart Hydro Performance Assessment Page 9 of 28
Revision C, June 2007
assumed that measurements taken with the sensor at this position are reasonably accurate. Full flow performance measurements were taken with the sensor in this position. The straight section of leat in which the sensor was installed is shown in Figure 4 below.
Figure 4 – Straight Section of Leat
• Position 2 – the sensor was installed in the bottom of the channel approximately 1m
upstream of the turbine. This allowed measurement of flows lower than the full leat flow as flow could be discharged through the bywash gate. The straight portion of channel upstream of the sensor was approximately 3.8 m long. The width of channel at this point was 2.70m. This length of straight channel was not long enough to be able to guarantee straight streamlines.
Accuracy Supplier’s guidance suggests that flow readings in good conditions are accurate to approximately ± 5 %. This value has been used for readings taken with the sensor at Position 1. At Position 2, the accuracy of the readings is reduced especially at low flows due to the short length of straight section and asymmetric approach of the water. The accuracy of the readings is difficult to quantify. An initial measurement of the full flow gave a reading that was extremely close to that observed with the sensor in Position 1. At reduced flows, the bywash water was discharged immediately upstream of the straight section and a vortex could be perceived as well as increased turbulence in the approach to the sensor. Therefore no figure for accuracy of flow measurement has been used for the sensor at Position 2 and minimum and maximum bounds have not been placed on flow or efficiency readings.
4.1.3 Power
Symbols The flow of power through the system is illustrated in Figure 5 below.

Nick Bard Hydro Services
River Dart Hydro Performance Assessment Page 10 of 28
Revision C, June 2007
Figure 5 – Power Symbols
The symbols used are:
• Pgross – Gross water power (in kW). [Pgross = ρgHgrossQ/1000] • Pnet – Net water power (in kW). [Pnet = ρgHnetQ/1000] • Pshaft – Turbine shaft power (in kW) • Ptrans – Transmission output shaft power (in kW) • Pgen – Generator output power (in kW) • Pout – Hydro system output power (in kW)
Measurement Electrical power, Pgen and Pout were measured using a hand held current clamp meter. This involves a current measurement taken on 1 phase and a voltage measurement between the other two phases. The real component of the power is automatically calculated by the device. A reading was taken on each phase in order to average out phase imbalances. Accuracy The published data for the clamp meter used for power measurements (LEM HEME Analyist 2060) data states that power measurements are accurate to ± 2.5 %]. However readings of power output were taken during a period of approximately 3 minutes whilst flow readings were averaged over a period of at least 15 minutes per test. Based on observations made of the variation in power output during a typical test, the inaccuracy of the power output readings compared to the mean power during the test is estimated to be ± 1%. Therefore the overall accuracy of the result is estimated to be ± 3.5%. For the basis of inverter efficiency calculations, the figure of ± 2.5% was used.
4.1.4 Acceleration due to gravity
Symbols The following quantity is used in this assessment:
• g – Acceleration due to gravity Measurement The value of g was taken to be constant throughout this assessment. The standard value of acceleration due to gravity at the earth’s surface of 9.80665 ms-2 was used. Accuracy Any inaccuracy in this quantity was taken as negligible.
4.1.5 Density of Water
Symbols The following symbols used in this assessment is:
• ρ – Density of water (in kgm-3) • T – Water Temperature (in °C)

Nick Bard Hydro Services
River Dart Hydro Performance Assessment Page 11 of 28
Revision C, June 2007
Measurement/Calculation The density of water at the earth’s surface is dependent on its temperature T. T was measured using the Nivus Water Ultrasonic Combi Sensor. ρ was calculated from T based on the function:
ρ = 1000(1 - (T+288.9414)/(508929.2 x (T+68.12963)) x (T-3.9863)2)
It is assumed that the water contains minimal salinity. Accuracy The accuracy in temperature measurement specified in the sensor manufacturer’s data is ± 0.5K. Based on the above calculation method this leads to an accuracy of ± 0.006% for any individual value and therefore the error in density was taken as being negligible in comparison to other sources of error.
4.1.6 Efficiency
Symbols The following symbols for efficiency are used in this assessment:
• ηgross – System efficiency using gross head. [ηgross = Pout/Pgross] • ηgrossC – System efficiency using gross head for constant speed measurement [ηgrossC =
Pgen/Pgross]
• ηnet – System efficiency using net head. [ηnet = Pout/Pnet] • ηnetC – System efficiency using net head for fixed speed measurement [ηgrossC =
Pgen/Pnet]
• ηhead – Head efficiency. [ηhead = Pnet/Pgross] • ηscrew – Turbine efficiency. [ηscrew = Pshaft/Pnet] • ηtrans – Transmission Efficiency. [ηturb = Ptrans/Pnet] • ηgen – Generator Efficiency. [ηgen = Pgen/Ptrans] • ηinv – Inverter Efficiency. [ηinv = Pout/Pgen]
4.2 Test Procedure
8 separate readings of system performance were taken during the testing. Each reading consisted of:
• A measurement of L1, L2 and L4 • Q and T measurement averaged over at least 15 minutes • Measurement of Pgen and Pout taken on each phase

Nick Bard Hydro Services
River Dart Hydro Performance Assessment Page 12 of 28
Revision C, June 2007
5 System Operation
In order to understand the predicted performance of the system and compare it to test results it is necessary to have an understanding of the operation of screw system. The flow passing through the screw is determined by the volume of ‘chambers’ filling per second. The volume of each chamber is related to the diameter of the screw and its shaft, the angle of inclination of the screw, the number of blades on the screw and the water level at the inlet to the turbine (L2). The number of chambers filling per second is then dependent on the rotational speed of the screw. Hydro schemes generally need to be able to vary the flow through the system in order to be able to adjust to varying conditions of water availability in the watercourse in which they are installed. There are (at least) two possible ways to control the flow through the screw.
• Constant Speed Control
• Variable Speed Control
5.1.1 Constant Speed
The constant speed operation mode is the ‘traditional’ system of controlling the screw turbine. The generator is conventionally grid connected and therefore must rotate at constant speed. The transmission provides a constant gear ratio between generator and screw and therefore the screw itself rotates at constant speed. For an installation of given geometry, the sole way to vary the passage of flow through the turbine is to vary the water level at the inlet to the turbine. This is achieved by the use of a sluice gate to control the inlet water level and results in a drop in the net head (Hnet) across the screw by an amount given by Hz. This reduces the gross system efficiency ηgross by an equivalent amount ηhead.
5.1.2 Variable Speed
The variable speed method of flow control is a recent innovation. The installation at River Dart Country Park is the first full scale deployment. Using this method the turbine inlet level is kept constant and thus the chamber volume is kept constant. Thus in order to vary the flow through the turbine the speed of the turbine must be varied. A level sensor senses the level in the forebay tank (L1) and adjusts the speed of the turbine to vary the flow and keep the forebay level constant. The generator voltage and frequency vary due to the variable screw speed and therefore an inverter system must be used to fully condition the power to grid voltage and frequency allowing the system to be grid connected. Thus an increase in Pshaft is achieved compared to constant speed operation due to the increased net head however there is the introduction of the inverter efficiency ηinv which results in reduced power output Pout.

Nick Bard Hydro Services
River Dart Hydro Performance Assessment Page 13 of 28
Revision C, June 2007
6 Predicted Performance
6.1 Ritz Atro Figure 6 – Ritz Atro Predictions
Nick Bard Hydro Services
River Dart Hydro Performance Assessment Page 14 of 28
Revision C, June 2007
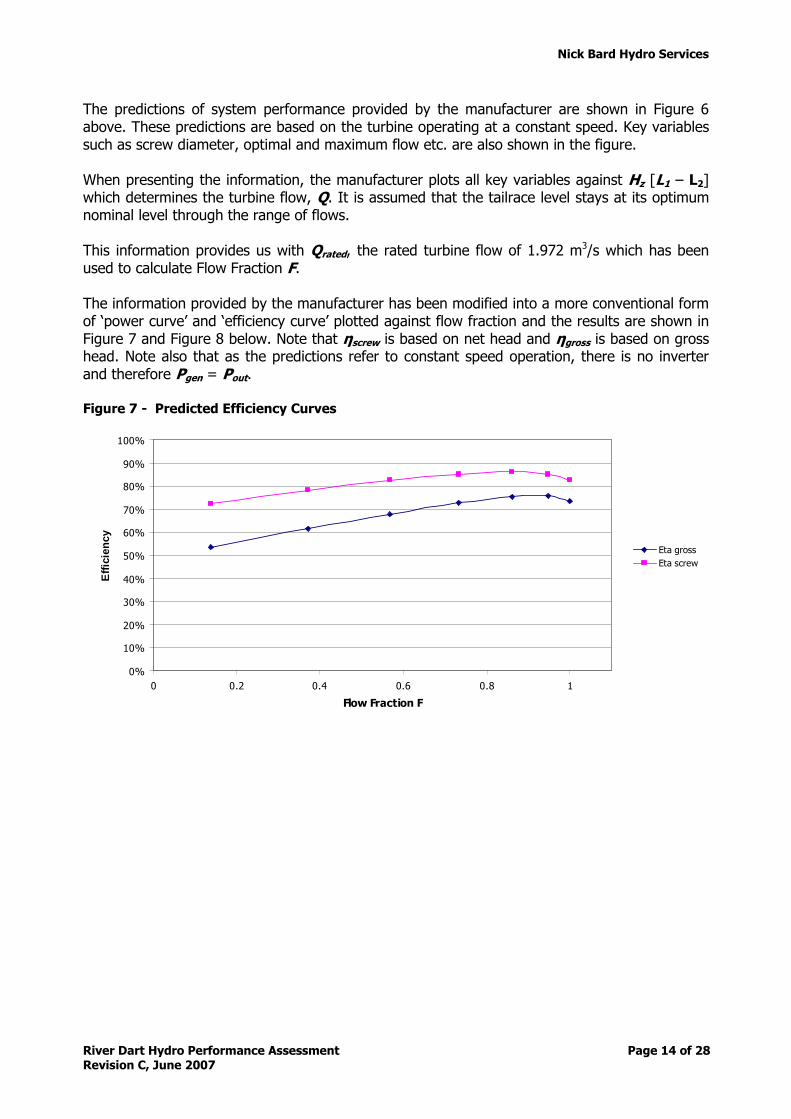
The predictions of system performance provided by the manufacturer are shown in Figure 6 above. These predictions are based on the turbine operating at a constant speed. Key variables such as screw diameter, optimal and maximum flow etc. are also shown in the figure. When presenting the information, the manufacturer plots all key variables against Hz [L1 – L2] which determines the turbine flow, Q. It is assumed that the tailrace level stays at its optimum nominal level through the range of flows. This information provides us with Qrated, the rated turbine flow of 1.972 m
3/s which has been used to calculate Flow Fraction F. The information provided by the manufacturer has been modified into a more conventional form of ‘power curve’ and ‘efficiency curve’ plotted against flow fraction and the results are shown in Figure 7 and Figure 8 below. Note that ηscrew is based on net head and ηgross is based on gross head. Note also that as the predictions refer to constant speed operation, there is no inverter and therefore Pgen = Pout. Figure 7 - Predicted Efficiency Curves
0%
10%
20%
30%
40%
50%
60%
70%
80%
90%
100%
0 0.2 0.4 0.6 0.8 1
Flow Fraction F
Eff
icie
ncy
Eta gross
Eta screw

Nick Bard Hydro Services
River Dart Hydro Performance Assessment Page 15 of 28
Revision C, June 2007
Figure 8 – Predicted Power Curves
0
10
20
30
40
50
60
70
80
0 0.2 0.4 0.6 0.8 1
Flow Fraction F
Pow
er (k
W)
Pgen
Pshaft
6.2 GP Electronics
G.P. Electronics was able to confirm that the maximum rating for the variable speed control system is 55 kW but was not able to provide predicted performance figures. The system was sized at 55 kW because the capacity of the leat currently restricts the output of the scheme to 48 kW.

Nick Bard Hydro Services
River Dart Hydro Performance Assessment Page 16 of 28
Revision C, June 2007
7 Test Results
7.1 Maximum Flow Test
Maximum flows test was carried out initially to assess the performance of the system at the highest flow possible. This flow was governed by flow in the River Dart on the day of the test and the capacity of the leat. Two test results were obtained with the system operating in variable speed mode, the first was an initial test, and a measurement of L2 was not taken therefore results for net system efficiency could not be obtained. The results of the tests are shown in Table 2 and Table 3 below. The bounds given are the minimum and maximum results based on the accuracies of measurement put forward in Section 4.1. Table 2- Maximum Flow Test Result 1
Quantity Result Bounds
Min Max
Gross Head Hgross 4.54 m 4.49 m 4.59 m
Net Head Hnet
Flow Q 1.18 m3/s 1.12 m3/s 1.23 m3/s
Flow Fraction F 0.596 0.566 0.626
Temperature T 14 14 14
Density ρ 999.3 999.3 999.3
Generator Power Pgen 40.1 kW 38.7 kW 41.5 kW
Output Power Pout 38.0 kW 36.6 kW 39.3 kW
Inverter Efficiency ηinv 0.95 0.90 1.00
Gross System Efficiency ηgross 0.72 0.66 0.80
Net System Efficiency ηnet
Table 3- Maximum Flow Test Result 2
Quantity Result Bounds
Min Max
Gross Head Hgross 4.55 m 4.50 m 4.60 m
Net Head Hnet 4.49 m 4.44 m 4.54 m
Flow Q 1.16 m3/s 1.11 m3/s 1.22 m3/s
Flow Fraction F 0.59 0.56 0.62
Temperature T 14.0 °C 14.0 °C 14.0 °C
Density ρ 999.3 kgm-3 999.3 kgm-3 999.3 kgm-3
Generator Power Pgen 39.2 kW 37.9 kW 40.6 kW
Output Power Pout 37.7 kW 36.4 kW 39.0 kW
Inverter Efficiency ηinv 0.96 0.91 1.00
Gross System Efficiency ηgross 0.73 0.66 0.80
Net System Efficiency ηnet 0.74 0.67 0.81

Nick Bard Hydro Services
River Dart Hydro Performance Assessment Page 17 of 28
Revision C, June 2007
7.2 Constant Speed
It is beneficial to test the entire performance of the turbine at fixed speed as fixed speed measurements are (almost) directly comparable to the manufacturer’s predictions. The use of the sluice gate to reduce the flow through the turbine during fixed speed operation caused too much turbulence to obtain a flow measurement at reduced flow with the flow sensor at Position 2. Therefore a single fixed speed measurement was taken at the maximum flow available on the test day. The results are shown in Table 4 below. Table 4 – Fixed Speed Test Results
Quantity Result Bounds
Min Max
Turbine Speed 34 rpm
Gross Head Hgross 4.52 m 4.48 m 4.57 m
Net Head Hnet 4.26 m 4.22 m 4.31 m
Flow Q 1.18 m3s-1 1.12 m3 s-1 1.24 m3 s-1
Flow Fraction F 0.60 0.57 0.63
Temperature T 14.0 °C 14.0 °C 14.0 °C
Density ρ 999.3 kgm-3 999.3 kgm-3 999.3 kgm-3
Generator Power Pgen 36.2 kW 35.0 kW 37.5 kW
Output Power Pout 35.0 kW 33.7 kW 36.2 kW
Inverter Efficiency ηinv 0.96 0.92 1.00
Gross System Efficiency ηgrossC 0.70 0.63 0.77
Net System Efficiency ηnetC 0.74 0.67 0.81
7.3 Reduced Flow
As discussed previously, a flow reduction through the turbine was achieved by opening the bywash gate upstream of the turbine so that a fraction of the leat flow was discharged prior to entering the turbine. 5 readings were taken at outputs of approximately 10 kW, 17.5 kW, 25 kW, 32.5 kW and 35 kW. The results of these tests are shown in Table 5. It should be noted that as an estimate of the accuracy of flow measurement could not be made, maximum and minimum bounds on the quantities have not been calculated.

Nick Bard Hydro Services
River Dart Hydro Performance Assessment Page 18 of 28
Revision C, June 2007
Table 5 – Reduced Flow Test Results
Result 1 2 3 4 5
Gross Head Hgross 4.58 m 4.55 m 4.54 m 4.63 m 4.63 m
Net Head Hnet 4.55 m 4.54 m 4.52 m 4.61 m 4.61 m
Flow Q 1.12 m3/s 1.03 m3/s 0.88 m3/s 0.51 m3/s 0.42 m3/s
Flow Fraction F 0.57 0.52 0.44 0.26 0.21
Temperature T 15.2 °C 15.20 15.1 °C 14.9 °C 15.0 °C
Density ρ 999.1 999.1 999.1 999.1 999.1
Generator Power Pgen 36.7 kW 31.4 kW 24.6 kW 17.5 kW 10.7 kW
Output Power Pout 35.1 kW 30.1 kW 22.2 kW 15.9 kW 9.2 kW
Inverter Efficiency ηinv 0.95 0.96 0.91 0.90 0.86
Gross System Efficiency ηgross 0.70 0.65 0.57 0.69 0.49
Net System Efficiency ηnet 0.70 0.66 0.57 0.69 0.49
7.4 Inverter Performance
Measurement of inverter performance required a simple measurement of 2 quantities: Pgen and Pout. Eight readings were obtained during the day of testing: 2 No. at maximum flow, 5 No. at reduced flow, and 1 No. at maximum flow with constant speed operation. The constant speed value was not used in the assessment of inverter performance as the inverter is only required in a system with variable speed operation. As discussed in Section 4.1.3 the accuracy of these power readings was estimated to be ± 2.5% based on the manufacturer’s data. The test results are shown in Table 6 below. Table 6 – Inverter Performance Results
Result 1 2 3 5 6 7 8
Measured 40.1 39.2 36.7 31.4 24.6 17.5 10.7
Min 39.1 38.3 35.8 30.6 23.9 17.1 10.4
Generator
Power Pgen
(kW) Max 41.1 40.2 37.7 32.1 25.2 18.0 11.0
Measured 38.0 37.7 35.1 30.1 22.2 15.9 9.2
Min 37.0 36.8 34.2 29.3 21.7 15.5 9.0
Output
Power Pout (kW) Max 38.9 38.6 36.0 30.8 22.8 16.3 9.5
Calculated 0.95 0.96 0.95 0.96 0.91 0.90 0.86
Min 0.90 0.91 0.91 0.91 0.86 0.86 0.82
Inverter
Efficiency ηinv
Max 1.00 1.00 1.00 1.00 0.95 0.95 0.91
Nick Bard Hydro Services
River Dart Hydro Performance Assessment Page 19 of 28
Revision C, June 2007
8 Discussion
This section of the report contains discussion of the results obtained as well as comparison with manufacturer’s data.
8.1 Maximum Flow
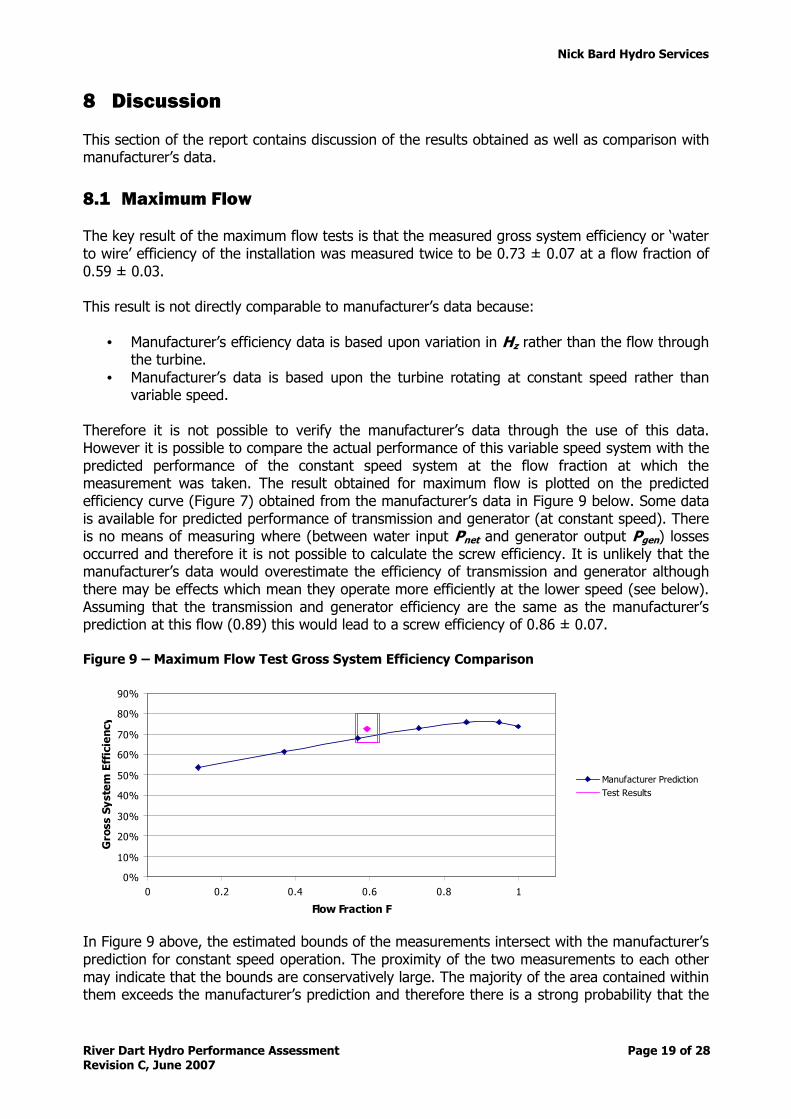
The key result of the maximum flow tests is that the measured gross system efficiency or ‘water to wire’ efficiency of the installation was measured twice to be 0.73 ± 0.07 at a flow fraction of 0.59 ± 0.03. This result is not directly comparable to manufacturer’s data because:
• Manufacturer’s efficiency data is based upon variation in Hz rather than the flow through the turbine.
• Manufacturer’s data is based upon the turbine rotating at constant speed rather than variable speed.
Therefore it is not possible to verify the manufacturer’s data through the use of this data. However it is possible to compare the actual performance of this variable speed system with the predicted performance of the constant speed system at the flow fraction at which the measurement was taken. The result obtained for maximum flow is plotted on the predicted efficiency curve (Figure 7) obtained from the manufacturer’s data in Figure 9 below. Some data is available for predicted performance of transmission and generator (at constant speed). There is no means of measuring where (between water input Pnet and generator output Pgen) losses occurred and therefore it is not possible to calculate the screw efficiency. It is unlikely that the manufacturer’s data would overestimate the efficiency of transmission and generator although there may be effects which mean they operate more efficiently at the lower speed (see below). Assuming that the transmission and generator efficiency are the same as the manufacturer’s prediction at this flow (0.89) this would lead to a screw efficiency of 0.86 ± 0.07. Figure 9 – Maximum Flow Test Gross System Efficiency Comparison
0%
10%
20%
30%
40%
50%
60%
70%
80%
90%
0 0.2 0.4 0.6 0.8 1
Flow Fraction F
Gro
ss S
yste
m E
ffic
iency
Manufacturer Prediction
Test Results
In Figure 9 above, the estimated bounds of the measurements intersect with the manufacturer’s prediction for constant speed operation. The proximity of the two measurements to each other may indicate that the bounds are conservatively large. The majority of the area contained within them exceeds the manufacturer’s prediction and therefore there is a strong probability that the

Nick Bard Hydro Services
River Dart Hydro Performance Assessment Page 20 of 28
Revision C, June 2007
variable speed system installed is exceeding the manufacturer’s prediction for a constant speed system at this flow. Assuming the measured values are the correct values and interpolating between the figures provided by the manufacturer, at a flow fraction of 0.59, the gross efficiency of the constant speed system is 0.69 and the variable speed system has an efficiency of 0.73 which is 4% higher. The two primary effects which are coming into play are:
• Variable speed system has Hz = 0 compared to 0.34m with the constant speed system. Therefore the head and thus gross efficiency are increased by 8% compared to the constant speed.
• Variable speed system contains an inverter with an efficiency of 0.96. Therefore the head and gross efficiency are reduced by 4% compared to the constant speed system.
The combination of these two effects would predict that the variable speed system would be 4% more efficient than the constant speed. This fits perfectly with the value of 4% which was obtained. Secondary effects which would affect results are:
• With the variable speed system the chambers are fuller and the water spends longer in during its passage through the screw. This would lead to greater leakage and thus slightly lower turbine efficiency compared to the constant speed system.
• With the variable speed system, the slower rotation speed leads to less splashing and thus a slight increase in turbine efficiency compared to the constant speed system.
• The variable speed system begins to release the water at the optimum height L3 which is higher than the tailwater height L4. This results in the water ‘spilling’ out rather than being gently released and thus a slightly lowered turbine efficiency compared to the constant speed system as the full head is not captured. The difference between L3 and L4 was 0.15 m. This means that the full screw efficiency is not obtained over 3% of the head.
• The variable speed system rotates more slowly than the constant speed system and therefore bearing losses are likely to be lower compared to the constant speed system.
• The variable speed system transmits power through the gearbox and belt drive at lower speed and higher torque. These losses are largely dependent on speed and therefore the transmission efficiency is likely to be higher than with the constant speed system.
• The generator generates with higher current and lower voltage with the variable speed system due to the lower speed. Therefore winding ‘I2R’ losses are higher and generator efficiency lower than with the constant speed system.
The conclusion is that at this flow fraction, the variable speed system has a slightly better efficiency than that of the constant speed. At lower flows, Hz increases and therefore the net head reduces with the constant speed system. However the inverter efficiency also reduces. At higher flows Hz reduces and the inverter efficiency increases slightly. The change in head is anticipated to be more important than the change in inverter efficiency therefore the variable speed drive is likely to be most valuable at low flows. Therefore the flow duration at the site will have a large impact on whether the installation of a variable speed system is worthwhile. The head efficiency of the constant speed system is lower for sites with lower head as Hz remains constant for a given flow. Therefore the variable speed system will also be most worthwhile for sites with the lowest head. More study is required to quantify the benefits of variable speed drive and draw firm conclusions.

Nick Bard Hydro Services
River Dart Hydro Performance Assessment Page 21 of 28
Revision C, June 2007
8.2 Constant Speed
The constant speed test was performed with two aims:
• To mimic (as far as possible) the conditions for which manufacturer’s predictions are available and carry out a comparison.
• To compare the performance of the installation under constant speed and variable speed control.
8.2.1 Comparison to Manufacturer Data
The constant speed test was performed with a screw rotation speed of 34 rpm. The rated speed of the turbine is 31.9 rpm. In relation to the first aim therefore, a direct comparison to manufacturer’s predictions is not possible. The manufacturer’s data has therefore been manipulated to allow a comparison. This has been carried out by assuming that screw efficiency, generator efficiency, transmission efficiency are identical for 32 rpm and 34 rpm. Therefore the sole difference is that for a given a given Hz, the turbine would pass more water. Therefore the predicted efficiency curve would be identical to Figure 7 except that the measurement taken would be plotted on in with a flow fraction F calculated from a rated flow Qrated which would be 2.114 m3s-1 rather than 1.972 m3s-1 - an increase in the ratio 34:32. Figure 10 - Constant Speed Comparison to Manufacturer's Prediction
0%
10%
20%
30%
40%
50%
60%
70%
80%
0 0.2 0.4 0.6 0.8 1
Flow Fraction F
Gro
ss S
yste
m E
ffic
iency
Manufacturer Prediction
Test Result
The reading taken has been plotted on the predicted gross efficiency curve and the result is shown in Figure 10 above. This shows that the reading taken agrees precisely with the manufacturer’s prediction. The bounds indicated show that the inaccuracy in measurement could lead to a variation in efficiency of 7% therefore we can say with confidence that the performance of the system is within ± 7% of the manufacturer’s prediction. This is based on the assumption stated above that screw, generator and transmission efficiencies are the same for the turbine at 34 rpm and 32 rpm.
8.2.2 Comparison to Measured Data
With relation to the second aim it would be reasonable to assume that screw, transmission and generator efficiency would be the same for the system operating at 34rpm at 32rpm. However the inlet head loss Hz observed at this flow is higher than it would have been with the screw rotating at 32rpm. The performance observed would therefore have been observed at a lower flow had the turbine been rotating at 32 rpm. Therefore on Figure 11 below, the constant speed result has been plotted at a flow scaled by the ratio 32:34.

Nick Bard Hydro Services
River Dart Hydro Performance Assessment Page 22 of 28
Revision C, June 2007
Figure 11 – Fixed/Constant Speed Performance Comparison
0.0
0.2
0.4
0.6
0.8
1.0
0.50 0.55 0.60 0.65 0.70
Flow Fraction F
Gro
ss S
yste
m E
ffic
iency
0.0
0.2
0.4
0.6
0.8
1.0
0.50 0.55 0.60 0.65 0.70
Flow Fraction FNet Syste
m E
ffic
iency
Fixed Speed Variable Speed
Figure 11 above shows the comparison between the measured efficiencies for variable (Result 2 used) and constant speed operation. It shows that the gross system efficiency measured was 3% higher with the variable speed system than the constant speed system. The net efficiency measured was identical for both systems. This would indicate that the secondary effects noted in Section 8.1 are not highly significant. As mentioned in Section 8.1, there is an effect caused by the tailwater level being lower than the design level and water spilling out of the chambers without giving up its potential energy. This effect would not be noted in the constant speed system as the water level in the chambers drops by a greater amount than [L3 – L4]. If we assumed that no benefit was obtained from this head with the variable speed system, the net efficiency would rise to 0.76 making it appear that the variable speed system outperforms the constant speed system by 2%.
8.3 Reduced Flow
As for the maximum flow test, it is possible to compare the measured performance of the variable speed system with the predicted performance of the constant speed system. The measured results are displayed in Figure 12 below.

Nick Bard Hydro Services
River Dart Hydro Performance Assessment Page 23 of 28
Revision C, June 2007
Figure 12 – Reduced Flow Test Results
0%
10%
20%
30%
40%
50%
60%
70%
80%
90%
0 0.2 0.4 0.6 0.8 1
Flow Fraction F
Gro
ss S
yste
m E
ffic
iency
Manufacturer Prediction
Test Results
The results observed are non conclusive due to the variability in measured efficiency. The results show that the variable speed system appears to approximately follow the manufacturer’s prediction for a constant speed system at low flows. The results do not follow a smooth curve and it is assumed that this inconsistency is due to the accuracy of flow measurement. A more accurate flow measurement method is required to determine more accurately the performance of the system at low flows. This could be obtained by reducing the flow into the leat using the leat intake sluice and measuring flows with the sensor at Position 1. This was not carried out due to the long stabilisation time of the leat and constraints on testing time.
8.4 Inverter Performance
G.P. Electronics was able to confirm that the maximum rating for the variable speed control system is 55 kW but was not able to provide predicted performance figures. The results from all tests are shown in graphical form in Figure 13 below. Figure 13 – Inverter efficiency curve
0.0
0.2
0.4
0.6
0.8
1.0
0 5 10 15 20 25 30 35 40 45
Output Power (kW)
Invert
er Effic
iency

Nick Bard Hydro Services
River Dart Hydro Performance Assessment Page 24 of 28
Revision C, June 2007
This curve shows that at high outputs, the inverter efficiency is approximately 96% and that this efficiency stays relatively constant over a wide range of power outputs, reducing gradually as power output reduces. It should be noted that due to availability of water, it was not possible to test the inverter performance at the high end of its range. The proximity of the results at the top of the performance range suggests that the bounds are conservative and that the accuracy in power readings may be better than ± 2.5%. The clamp meter was correlated with the ROC meter and found to agree very precisely and this fact also supports that supposition. As discussed in Section 8.1, the key factors in comparison between variable speed and constant speed operation are the inverter efficiency and the head efficiency. Using the figures for head loss Hz provided by the manufacturer and the efficiency measurements taken, a comparison of the performance of the system over a range of flows can be made. The comparison is shown in Figure 14 below. It should be noted that there is inaccuracy in the flow fraction readings at which the inverter efficiency is plotted. As the inverter efficiency curve is relatively flat, this is not thought to be too significant. Figure 14 – Inverter and Head Efficiency Comparison
0
0.2
0.4
0.6
0.8
1
0 0.2 0.4 0.6 0.8 1
Flow Fraction F
Eff
icie
ncy
Head Efficiency
Inverter Efficiency
Figure 14 above appears to indicate that at low flows, the inverter efficiency is higher than the head efficiency and therefore the variable speed drive is likely to be more efficient than the constant speed drive. At high flows, information on inverter performance is not available. It is unlikely that inverter efficiency will exceed 0.96. If the inverter performance was constant at 0.96 at high flows, the head efficiency for the constant speed drive would exceed the inverter efficiency in the variable speed drive for flow fractions above approximately 0.73. Therefore the use of variable speed control will be dependent on the flow duration curve at the site and the number of units of electricity that will be generated above and below this critical flow fraction (estimated to be 0.73). More accurate measurements are required to confirm this. As a further innovation, the control system could switch over to constant speed drive at high flows, bypassing the inverter and thus maximising efficiency and power output over the entire range of flows.

Nick Bard Hydro Services
River Dart Hydro Performance Assessment Page 25 of 28
Revision C, June 2007
9 Conclusions
As stated in Section 3.2, the objectives of the testing and analysis were:
1. To assess the efficiency of the system over a range of flow conditions 2. To compare the efficiency of the system to the manufacturer’s predictions 3. To assess the efficiency of the inverter system over a range of power in/outputs 4. To compare the efficiency of the inverter system to the manufacturer’s predictions 5. To compare the variable speed control system installed to the standard constant speed
system and assess whether it will significantly increase the energy yield of a hydropower site.
With relation to Objective 1 the testing facilitated limited success. The availability of water in the River Dart meant that the system could be tested up to a flow fraction of 0.6. The time constraints on the testing meant that accurate flow measurements could not be taken at reduced flows as the long leat has a very long stabilisation time and therefore leat flow control using the sluice at the intake to the leat was not feasible. An accurate reading was taken at the maximum available flow giving a gross system efficiency or ‘water to wire’ efficiency of the installation as 0.73 ± 0.05 at a flow fraction of 0.59 ± 0.03. Using the measured inverter efficiency and generator and transmission efficiencies calculated from the manufacturer’s predictions at this flow, the screw efficiency is 0.86 ± 0.05. Measurements were taken with lower flows, down to a flow fraction of 0.2. The reduced flow results obtained were not consistent with each other and this is assumed to be due to inaccuracies in measurement of flows with the sensor in Position 2. With relation to Objective 2, the manufacturer’s predictions are for a constant speed system. A single measurement was made with the turbine operating at constant speed and this agreed precisely with manufacturer’s predictions with the manufacturer’s prediction curve centrally located within the bounds defined by the accuracy of the measurements. With relation to Objective 3, 7 measurements of inverter efficiency were taken between power outputs of 9 kW and 37 kW. The rated output of the system is 55 kW. The measurements showed efficiencies to be between 0.95 ± 0.05 and 0.86 ± 0.05. The efficiency was shown to stay relatively flat over the operational range studied with the highest efficiency at the highest output power. With relation to Objective 4, manufacturer’s predictions were not available for the inverter system. With relation to Objective 5, some (almost) direct comparison was possible between the system operating under variable speed and constant speed conditions. This showed that at a Flow Fraction of approximately 0.6, the efficiency (based on gross head) was 3% higher (with bounds of ± 14%) using the variable speed control. The two key factors affecting the gross system efficiency when comparing the constant and variable speed system are:
• The inefficiency in the variable speed system due to the requirement for an inverter to condition the power output.
• The inefficiency in the constant speed system due to reduced net head. This is most important at low flow fractions.
There are also a number of other secondary factors affecting the performance of the system although these are thought to have a minimal effect on efficiency.

Nick Bard Hydro Services
River Dart Hydro Performance Assessment Page 26 of 28
Revision C, June 2007
Initial calculations comparing the head efficiency with the constant speed system to the inverter efficiency with the variable speed system suggest that the variable speed system may be more efficient at below a critical flow fraction (estimated to be 0.73) and the constant speed system may be more efficient above this value. This implies that the flow duration curve at any site will affect the value of the variable speed drive. This critical flow fraction will be higher at sites with lower head and lower for higher head sites and therefore the head at the site also affects the worth of the variable speed drive. At this site, the flow fraction is below 0.73 for 100% of the time and it is therefore likely that the variable speed drive is a worthwhile investment. An innovation in the control system could be a switch to constant speed operation above the critical flow fraction bypassing the inverter. This would maximise output across the entire range of flows. Overall, the testing was sufficient to draw some preliminary conclusions about system performance, comparison to manufacturer’s predictions and the use of variable/constant speed operation. Further testing is recommended to verify the results observed and carry out full and accurate measurements over the entire range of flows.

Nick Bard Hydro Services
River Dart Hydro Performance Assessment Page 27 of 28
Revision C, June 2007
Appendix A. Symbols Used
This section is to be used as a reference Figure 15 - Levels
Levels:
• L1 – Forebay Water Level (in m) • L2 – Turbine Inlet Water Level (in m) • L3 – Design Tailrace Level (in m) • L4 – Actual Tailrace Level (in m)
Head:
• Hgross – Gross Head (in m). [Hgross = L1 – L4]
• Hnet – Net Head (in m). [Hnet = L2 – L4] • Hz – Intake head loss (in m). [Hz = L1 – L2]
Flow
• Q – Flow through the turbine (in m3s-1) • Qrated – Rated flow of the turbine (in m
3s-1) • F – Flow Fraction (dimensionless). [F = Q/Qrated]
Power Figure 16 – Power Symbols
• Pgross – Gross water power (in kW). [Pgross = ρgHgrossQ/1000] • Pnet – Net water power (in kW). [Pnet = ρgHnetQ/1000] • Pshaft – Turbine shaft power (in kW)
• Ptrans – Transmission output shaft power (in kW) • Pgen – Generator output power (in kW)

Nick Bard Hydro Services
River Dart Hydro Performance Assessment Page 28 of 28
Revision C, June 2007
• Pout – Hydro system output power (in kW) Physical Properties
• g – Acceleration due to gravity • ρ – Density of water (in kgm-3)
• T – Water Temperature (in °C) Efficiency
• ηgross – System efficiency using gross head. [ηgross = Pout/Pgross] • ηgrossC – System efficiency using gross head for constant speed measurement [ηgrossC =
Pgen/Pgross]
• ηnet – System efficiency using net head. [ηnet = Pout/Pnet] • ηnetC – System efficiency using net head for fixed speed measurement [ηgrossC =
Pgen/Pnet]
• ηhead – Head efficiency. [ηhead = Pnet/Pgross = Hnet/Hgross] • ηscrew – Turbine efficiency. [ηscrew = Pshaft/Pnet] • ηtrans – Transmission Efficiency. [ηturb = Ptrans/Pnet] • ηgen – Generator Efficiency. [ηgen = Pgen/Ptrans] • ηinv – Inverter Efficiency. [ηinv = Pout/Pgen]