Embed Size (px)
Citation preview

Niagara Region Housing Affordability and Growth Plan 2051
April 2021
PDS 17-2021 - Appendix 5.2
Niagara Region Housing Affordability and Growth Plan 2051
Page | 2
About the Canadian Centre for Economic
Analysis
About the Report
The Canadian Centre for Economic Analysis
(CANCEA) is a socio-economic research and data
firm. CANCEA provides objective, independent
and evidence-based analysis and is dedicated to
a comprehensive, collaborative, and
quantitative understanding of the short- and
long-term risks and returns behind market
changes, policy decisions and economic
behaviour.
CANCEA uses modern techniques in data
science, including agent-based modelling, for
econometric analysis, risk management
assessments, demographic forecasts and
epidemiology. CANCEA’s work includes market
analysis, policy evaluation and risk
management, business model optimization,
cost-effectiveness and rate of return analysis,
macroeconomic analysis, insurance risk
evaluation, land use and infrastructure
planning, logistics, and labour market analysis.
CANCEA also provides comprehensive Canadian
data services.
At the centre of CANCEA’s analytical capabilities
is an agent-based platform called Prosperity at
Risk® that is an extensive, data-driven model of
56,000 locations across Canada. Given the
systems focus behind all of CANCEA’s work,
CANCEA has a one model approach to its
analysis which allows various disciplines and
stakeholders to be incorporated into a single
analysis.
CANCEA does not accept any research funding
or client engagements that require a pre-
determined result or policy stance, or otherwise
inhibits its independence.
In keeping with CANCEA’s guidelines for funded
research, the design and method of research, as
well as the content of this study, were
determined solely by CANCEA.
This information is not intended as specific
investment, accounting, legal or tax advice.
©2021 Canadian Centre for Economic Analysis
Printed in Canada • All rights reserved
Citation: Niagara Region Housing Affordability
and Growth Plan 2051. April 2021.
Niagara Region Housing Affordability and Growth Plan 2051
Page | 3
TABLE OF CONTENTS Table of Contents .......................................................................................................................................... 3 List of Figures ................................................................................................................................................ 4 List of Tables ................................................................................................................................................. 4 1.0 Introduction ...................................................................................................................................... 5
1.1 Background ................................................................................................................................... 5 1.2 Objectives...................................................................................................................................... 5 1.3 Summary of Results ...................................................................................................................... 5
2.0 Methodology ..................................................................................................................................... 7 2.1 Overview ....................................................................................................................................... 7 2.2 Updated Data ................................................................................................................................ 7
3.0 Growth Scenario Analysis ................................................................................................................. 8 3.1 Current Housing Stock .................................................................................................................. 8 3.2 Growth Scenarios ........................................................................................................................ 10
4.0 Conclusions ..................................................................................................................................... 17

Niagara Region Housing Affordability and Growth Plan 2051
Page | 4
LIST OF FIGURES
Figure 1 Average and Market Rents, 2016-2020 .................................................................................... 9
Figure 2 Number of Households in Different Growth Scenarios, 2021-2051 ....................................... 10
Figure 3 Single-Detached Dwellings Under Growth Scenarios ............................................................. 11
Figure 4 Apartments, Row Houses, and Semi-Detached Dwellings Under Growth Scenarios ............. 12
Figure 5 Labour Force Breakdown in 2016 (on left) and 2051 (on right) ............................................. 13
Figure 6 Niagara Region Employment Over Time ................................................................................. 13
Figure 7 Percentage of Households in Core Housing Need by Growth Scenario ................................. 14
Figure 8 Households in Core Housing Need to 2051 ............................................................................ 15
LIST OF TABLES
Table 1 Estimated Housing Stock by Dwelling Type, 2021 .................................................................... 8
Table 2 Recent Market Average Home Prices, 2016-2020 .................................................................... 9
Table 3 Affordable Housing, December 2019 ........................................................................................ 9
Table 4 Percentage of Households in Core Housing Need by Income ................................................ 15

Niagara Region Housing Affordability and Growth Plan 2051
Page | 5
1.0 INTRODUCTION
1.1 BACKGROUND
In 2019, the Canadian Centre for Economic Analysis examined the trends, current state and forecasts for
housing for the Niagara Region up to 20411. In August 2020, the Ontario Government released
updated population and employment targets for the Greater Golden Horseshoe in A Place to Grow
Growth Plan for the Greater Golden Horseshoe (the Growth Plan) up to 2051. The Growth Plan outlines
obligations for upper- and single-tier municipalities, which must plan for housing to meet population
targets, as well as meet intensification and density targets. Furthermore, per the Growth Plan, an
adequate mix of housing options much be ensured, and municipalities must set targets for affordable
housing.
1.2 OBJECTIVES
As a follow up to the Niagara Region Housing Market Analysis and Growth Scenario Analysis, 2018-2041,
this study examines Niagara Region’s future housing stock up to the year 2051 under different scenarios.
These scenarios are designed to present the implications of pursuing differing growth trends over the
coming three decades for the population, housing stock and local economic development.
Growth scenarios are used to project the characteristics of Niagara Region’s population and housing stock
up to a defined planning horizon under different construction rates, including a baseline that represents
the Region’s status quo growth to determine the risks, benefits and potential pressures the Region could
face under alternative growth paths. The results are intended to support evidence-based policy-making
that considers the consequences of these different paths.
1.3 SUMMARY OF RESULTS
The trends identified in Niagara Region Housing Market Analysis and Growth Scenario Analysis,
2018-2041, are expected to continue under the new Growth Plan to 2051. Meeting core housing need
will continue to be an issue. To meet the growth targets, the rate of construction of new units would have
to increase significantly, particularly for higher-density building forms. By 2051, the status quo rate
of construction could result in just over 24,000 fewer households in the region than required in the
Growth Plan. In that case, the Region risks not only falling short of the 2051 population targets set out
by the Provincial government, but also increasing the percentage of the population in core housing need.
To reach the population growth targets to 2051 in the Growth Plan and to minimize overall levels of
core housing need, Niagara Region can continue to consider adopting policies that incentivize the
development of a mix of housing to accommodate the future population. This could include a
variety of housing densities, tenures and affordability levels, as well as right-sizing and maximizing the
1 Niagara Region Housing Market Analysis, CANCEA. June, 2019; Niagara Region Growth Scenario
Analysis 2018-2041, CANCEA. October 2019

Page | 6
Niagara Region Housing Affordability and Growth Plan 2051
the productivity of Niagara Region’s existing housing stock. By providing a wider range of options to
households, a more diversified housing stock can help mitigate some of the demographic trends
identified in this report and the previous report, and make it easier for people of all ages and income
levels to live in the Niagara Region.
Niagara Region Housing Affordability and Growth Plan 2051
Page | 7
2.0 METHODOLOGY
2.1 OVERVIEW
The analysis was completed using CANCEA’s statistical analysis and data simulation platform. The new
population targets, along with life expectancies and birth rates, were used to determine the number of
households under different conditions and over time, and the dwelling sizes that would be required.
Information about the current housing stock, the way in which the current population is housed
(i.e. affordability, suitability, and adequacy), and dwelling formation rates (both market and non-market)
are used to assess the supply of housing over time and the corresponding population housed in a
given scenario.
This study draws primarily from Statistics Canada census datasets and CMHC tables. Additional data was
provided by Niagara Region, including population targets and community housing data.
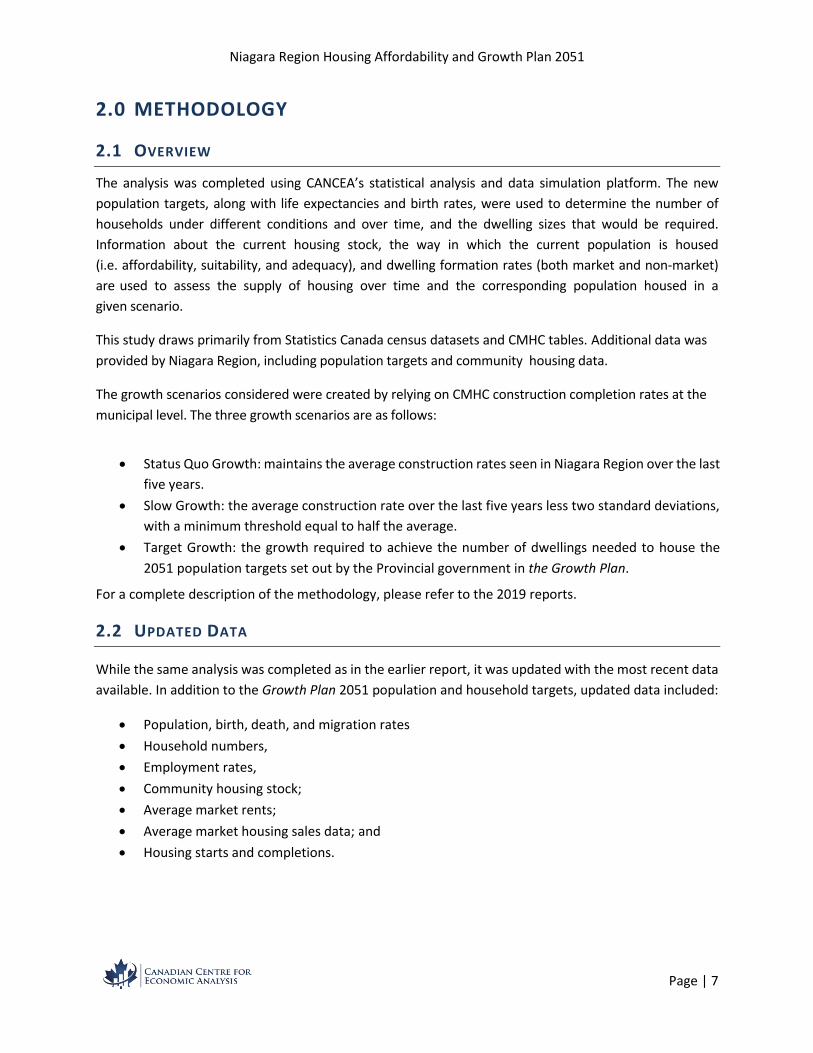
The growth scenarios considered were created by relying on CMHC construction completion rates at the
municipal level. The three growth scenarios are as follows:
• Status Quo Growth: maintains the average construction rates seen in Niagara Region over the last five years.
• Slow Growth: the average construction rate over the last five years less two standard deviations, with a minimum threshold equal to half the average.
• Target Growth: the growth required to achieve the number of dwellings needed to house the 2051 population targets set out by the Provincial government in the Growth Plan.
For a complete description of the methodology, please refer to the 2019 reports.
2.2 UPDATED DATA
While the same analysis was completed as in the earlier report, it was updated with the most recent data
available. In addition to the Growth Plan 2051 population and household targets, updated data included:
• Population, birth, death, and migration rates
• Household numbers,
• Employment rates,
• Community housing stock;
• Average market rents;
• Average market housing sales data; and
• Housing starts and completions.

Niagara Region Housing Affordability and Growth Plan 2051
Page | 8
3.0 GROWTH SCENARIO ANALYSIS
3.1 CURRENT HOUSING STOCK
Niagara Region’s current housing stock consists primarily of low-density dwelling types like single-
detached and semi-detached homes. Table 1 below provides a breakdown of the estimated housing stock
in the region by dwelling type based on census data and CMHC completions. Single-detached homes are
by far the most common dwelling type, followed by low-rise apartments and row houses.
Table 1 Estimated Housing Stock by Dwelling Type, 2021
Dwelling Type Number of Dwellings Percentage of Total Stock
Single-detached 138,900 68%
Semi-detached 10,600 5%
Duplex Apartment 6,600 3%
Row house 14,900 7%
Apartment 5 stories or less 21,800 11%
Apartment over 5 stories 10,600 5%
Other 540 0%
Total 203,000 100%
As an update to CANCEA’s previous analysis of the Region’s housing market, recent market prices
for homes and recent market rents are shown below. Table 2 shows the average market price for newly
built and newly sold homes from 2016 to 2020. Prices have increased 42% in this time, including a 6%
increase in 2020. CMHC average rents and average market rents are shown in Figure 1. As a result of
Ontario’s rent control system, which combines rent increase limits for sitting tenants and vacancy
decontrol, average rents are considerably less than market rents that must be paid by households
looking for a new home. For example, average rent paid for a one bedroom apartment was just over
$900 in 2019, whereas average market rent for a one bedroom was $1200 that year. Both rents and
house prices are increasing at rates considerably greater than wages resulting in increased affordability
pressures across the region.

Niagara Region Housing Affordability and Growth Plan 2051
Page | 9
Table 2 Recent Market Average Home Prices, 2016-2020
Year All Dwelling Types Change from previous year Change from 2016
2016 $333,030 — —
2017 $403,099 21% 21%
2018 $405,063 0.5% 22%
2019 $444,571 10% 33%
2020 $473,045 6.4% 42%
Figure 1 Average and Market Rents, 2016-2020
An update to the community housing stock is shown in Table 3. The 8,510 units of community housing
(as of December 31, 2019) represents an increase of more than 100 units from the data included in our
previous report. The most common type of community housing is not-for-profit/co-op buildings, and
senior housing makes up a third of all community housing units. This housing stock is concentrated
largely in St. Catharines (3,804 units), Niagara Falls (2091 units), and Welland (1,180 units), which
together account for over 83% of community housing.
Table 3 Community Housing, December 2019
Mandate NFP / Co-op
NRH Owned
Rent Supplement
New Development
Total
Family 2,158 888 0 20 3,066
Senior 918 1,642 0 315 2,875
None 371 0 1,433 0 1,804
Adult 0 154 0 356 510
Aboriginal 128 0 0 0 128
Alternative 84 0 0 43 127
Total 3,659 2,684 1,433 734 8,510

Niagara Region Housing Affordability and Growth Plan 2051
Page | 10
3.2 GROWTH SCENARIOS
The growth scenario analysis conducted allows one to understand the implications of different rates of
housing construction for Niagara Region. Three different forward looking scenarios were analyzed:
1. Status Quo Growth: maintaining current construction rates, or the average construction rates
seen in Niagara Region over the last five years.
2. Slow Growth: growing at a slower pace, or the average construction rate over the last five
years less two standard deviations, with a minimum threshold equal to half the average.
3. Target Growth: increasing the pace of housing construction to achieve the number of
dwellings needed for municipalities set out in the Growth Plan.
The population and housing targets for each municipality to year 2051 used in this analysis align with
those presented in Niagara Region’s Draft Land Needs Assessment.
Accommodating the target population would mean accommodating approximately 91,900 additional
households, with the number of households varying slightly for the same target population depending on
the average household size by 2051. It is important to note that the housing mix that is constructed can
significantly alter the population housed. For example, 1,000 units of 1 bedroom apartments could
suitably house at most 2,000 people (but would likely be less in practice.) However, 1,000 units of 3
bedroom row-houses could provide housing for over twice that population.
As we can see below, in Figure 2, if the status quo rate of construction is maintained, there will be
insufficient dwellings to house the region’s target population. By 2051, the status quo growth rate of
construction could result in just over 24,000 fewer households in the region than in the target growth
scenario. If housing construction rates decrease so as to be in line with the slow growth scenario, this
shortfall could reach nearly 53,000 households by 2051. Aside from the ability to adequately house its
target population, status quo growth or slow growth could result in increased affordability pressures in the
region and the displacement of lower income families.
Figure 2 Number of Households in Different Growth Scenarios, 2021-2051
-
50,000
100,000
150,000
200,000
250,000
300,000
350,000
2016 2021 2026 2031 2036 2041 2046 2051
# o
f H
ou
seh
old
s
# of Households by Growth Scenario
Slow Status Quo Target

Page | 11
Niagara Region Housing Affordability and Growth Plan 2051
Housing Niagara’s target population while also meeting the Regions housing mix targets will require
increasing construction rates for higher density housing types, like apartments and row houses. This is can
be seen by examining the results of the growth scenario analysis by different dwelling types. Maintaining
current construction rates would not only result in the region falling short of its growth targets, but would
also result in an over-supply of single-detached homes, as we can see in Figure 3. Under the status quo
scenario, over 2,500 more single-detached dwellings would be completed than in the target growth
scenario in which the target population is housed and the Region’s housing mix targets achieved.
Figure 3 Single-Detached Dwellings Under Growth Scenarios
100,000
110,000
120,000
130,000
140,000
150,000
160,000
170,000
180,000
20
11
20
13
20
15
20
17
20
19
20
21
20
23
20
25
20
27
20
29
20
31
20
33
20
35
20
37
20
39
20
41
20
43
20
45
20
47
20
49
20
51
# o
f D
wel
lings
Single Detached Dwellings
Slow Status Quo Target
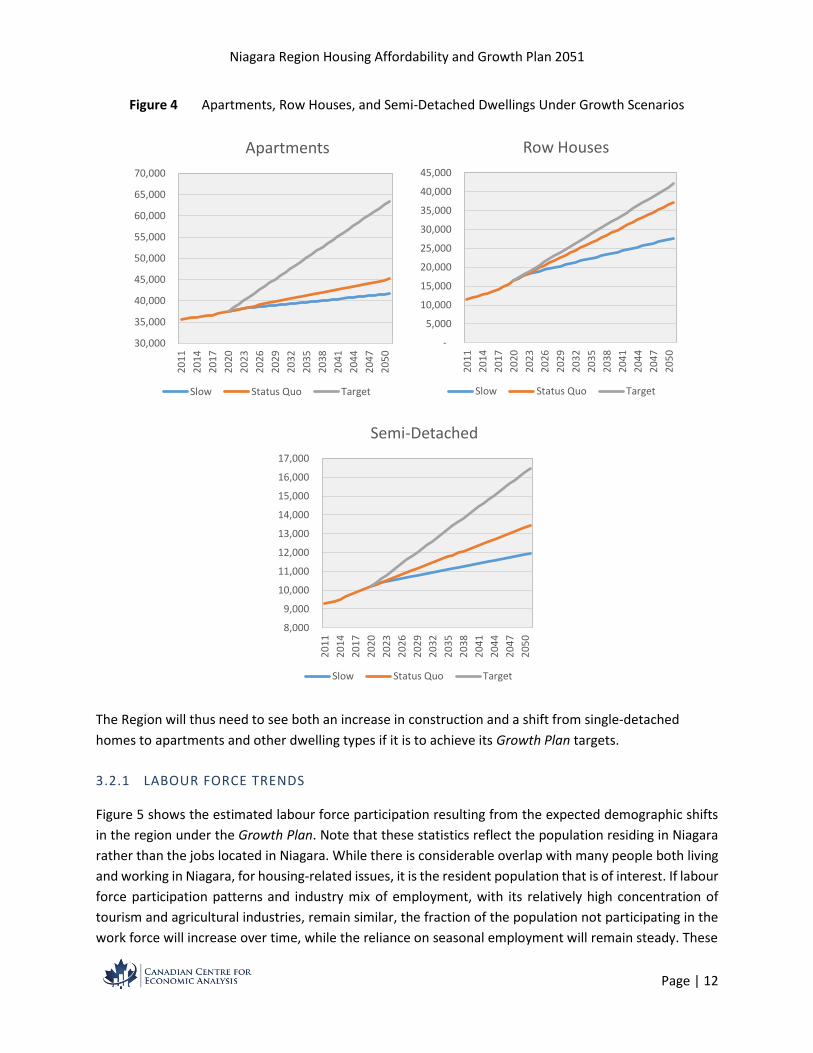
Meanwhile, the status quo growth scenario would result in an under-supply of row houses, semi-detached
homes, and, most significantly, apartments, relative to the growth plan targets. Figure 4 shows the supply
of apartments, row houses, and semi-detached homes in the different growth scenarios. The gap between
the target scenario and the status quo scenario is over 18,000 units in the case of apartments, over 4,500
in the case of row houses, and over 3,000 in the case of semi-detached homes, by 2051. As we can see,
this gap only widens when the target growth scenario is compared to the slow growth scenario.
Niagara Region Housing Affordability and Growth Plan 2051
Page | 12
Figure 4 Apartments, Row Houses, and Semi-Detached Dwellings Under Growth Scenarios
30,000
35,000
40,000
45,000
50,000
55,000
60,000
65,000
70,0002
01
1
20
14
20
17
20
20
20
23
20
26
20
29
20
32
20
35
20
38
20
41
20
44
20
47
20
50
Apartments
Slow Status Quo Target
-
5,000
10,000
15,000
20,000
25,000
30,000
35,000
40,000
45,000
20
11
20
14
20
17
20
20
20
23
20
26
20
29
20
32
20
35
20
38
20
41
20
44
20
47
20
50
Row Houses
Slow Status Quo Target
8,000
9,000
10,000
11,000
12,000
13,000
14,000
15,000
16,000
17,000
20
11
20
14
20
17
20
20
20
23
20
26
20
29
20
32
20
35
20
38
20
41
20
44
20
47
20
50
Semi-Detached
Slow Status Quo Target
The Region will thus need to see both an increase in construction and a shift from single-detached
homes to apartments and other dwelling types if it is to achieve its Growth Plan targets.
3.2.1 LABOUR FORCE TRENDS
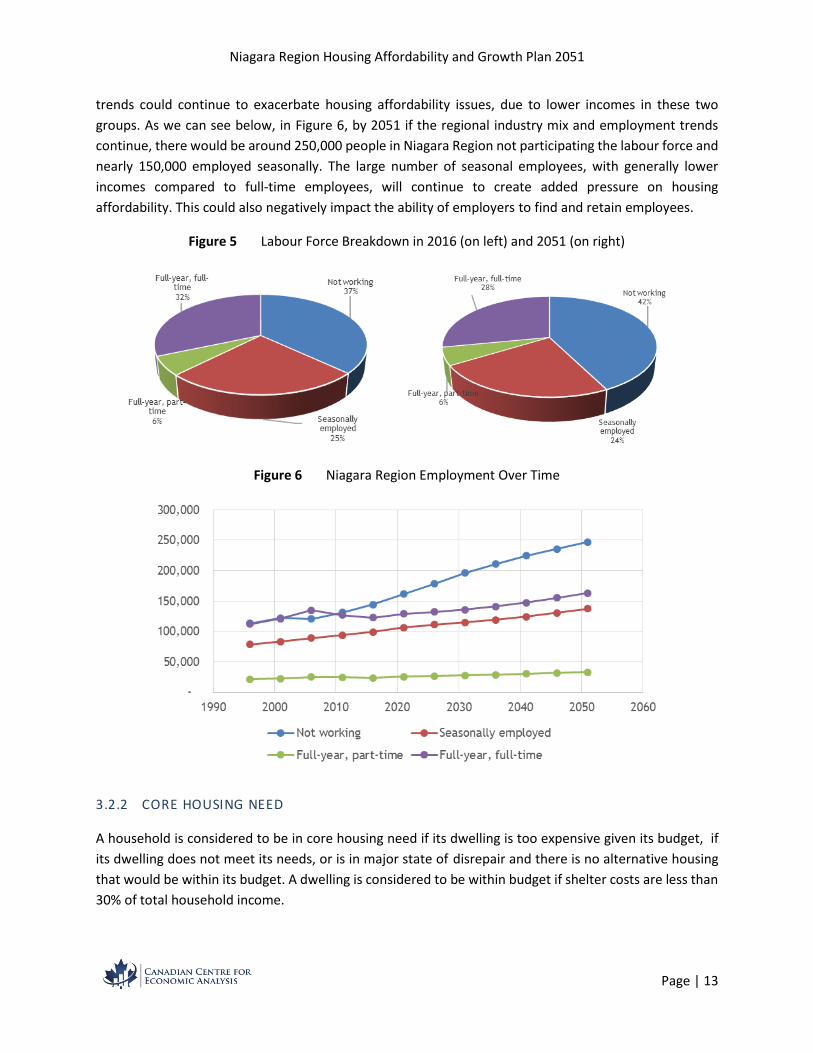
Figure 5 shows the estimated labour force participation resulting from the expected demographic shifts
in the region under the Growth Plan. Note that these statistics reflect the population residing in Niagara
rather than the jobs located in Niagara. While there is considerable overlap with many people both living
and working in Niagara, for housing-related issues, it is the resident population that is of interest. If labour
force participation patterns and industry mix of employment, with its relatively high concentration of
tourism and agricultural industries, remain similar, the fraction of the population not participating in the
work force will increase over time, while the reliance on seasonal employment will remain steady. These
Niagara Region Housing Affordability and Growth Plan 2051
Page | 13
trends could continue to exacerbate housing affordability issues, due to lower incomes in these two
groups. As we can see below, in Figure 6, by 2051 if the regional industry mix and employment trends
continue, there would be around 250,000 people in Niagara Region not participating the labour force and
nearly 150,000 employed seasonally. The large number of seasonal employees, with generally lower
incomes compared to full-time employees, will continue to create added pressure on housing
affordability. This could also negatively impact the ability of employers to find and retain employees.
Figure 5 Labour Force Breakdown in 2016 (on left) and 2051 (on right)
Figure 6 Niagara Region Employment Over Time
3.2.2 CORE HOUSING NEED
A household is considered to be in core housing need if its dwelling is too expensive given its budget, if
its dwelling does not meet its needs, or is in major state of disrepair and there is no alternative housing
that would be within its budget. A dwelling is considered to be within budget if shelter costs are less than
30% of total household income.

Niagara Region Housing Affordability and Growth Plan 2051
Page | 14
Both the slow growth and status quo growth scenarios would result in an increase in the percentage of
households in core housing need in the region. As shown in Figure 7, 16% of households could be in core
housing need by 2051 if construction rates remain stable, and 19% of households could be in core housing
need by 2051 in the slow growth scenario. In the target growth scenario, core housing need would remain
at around 13% of households. Thus, by simply meeting target growth, core housing pressures could be
maintained, but the percentage of households in core housing need is not expected to decrease without
additional housing or supports.
Figure 7 Percentage of Households in Core Housing Need by Growth Scenario
Maintaining the fraction of households in core housing need would mean the number of households in
core need will increase as the region’s population increases towards its growth targets. Figure 8 shows
how the number of families in core housing need may increase over time in the target growth scenario.
Shown are the number of households in core need spending 30% to 50% of household income on shelter
and households spending more than 50%, sorted by tenure type.
Niagara Region Housing Affordability and Growth Plan 2051
Page | 15
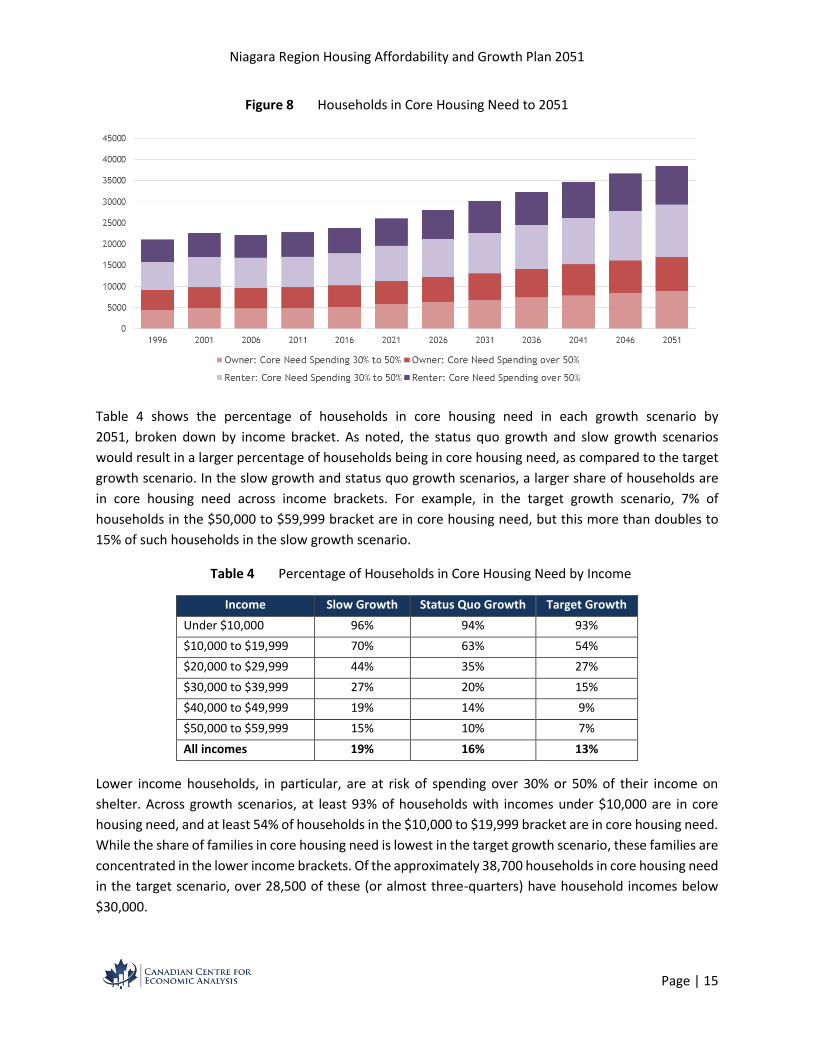
Figure 8 Households in Core Housing Need to 2051
Table 4 shows the percentage of households in core housing need in each growth scenario by
2051, broken down by income bracket. As noted, the status quo growth and slow growth scenarios
would result in a larger percentage of households being in core housing need, as compared to the target
growth scenario. In the slow growth and status quo growth scenarios, a larger share of households are
in core housing need across income brackets. For example, in the target growth scenario, 7% of
households in the $50,000 to $59,999 bracket are in core housing need, but this more than doubles to
15% of such households in the slow growth scenario.
Table 4 Percentage of Households in Core Housing Need by Income
Income Slow Growth Status Quo Growth Target Growth
Under $10,000 96% 94% 93%
$10,000 to $19,999 70% 63% 54%
$20,000 to $29,999 44% 35% 27%
$30,000 to $39,999 27% 20% 15%
$40,000 to $49,999 19% 14% 9%
$50,000 to $59,999 15% 10% 7%
All incomes 19% 16% 13%
Lower income households, in particular, are at risk of spending over 30% or 50% of their income on
shelter. Across growth scenarios, at least 93% of households with incomes under $10,000 are in core
housing need, and at least 54% of households in the $10,000 to $19,999 bracket are in core housing need.
While the share of families in core housing need is lowest in the target growth scenario, these families are
concentrated in the lower income brackets. Of the approximately 38,700 households in core housing need
in the target scenario, over 28,500 of these (or almost three-quarters) have household incomes below
$30,000.

Page | 16
Niagara Region Housing Affordability and Growth Plan 2051
3.2.3 AFFORDABLE HOUSING TARGETS
The number of households in deep core housing need (spending more than 50% of their income on
shelter) could grow to over 15,000 households by 2051 under the target growth scenario while the total
number of households in core need (spending more than 30% of their income on shelter) could increase
to 38,000 households (or about 13% of all households.) This in an increase of 12,500 above the 2021
estimates of households in core need. The majority of households in core need are renters in apartments
and over 70% of households in deep core need residing in apartments.
The number of households potentially in core housing need provides a natural target for affordable
housing in Niagara Region. At a minimum, in order to prevent an increase in the number of households in
core need, an additional 12,500 affordable units would be needed over the next 30 years. This
corresponds to about 14% of all new dwelling construction. However, in order the actually reduce core
housing need, a greater rate of affordable construction is required. To reduce the number of households
in core need by 50% compared to the number in 2021, 28% of all new dwellings would need to be
affordable. Therefore, it would be reasonable to target at least 25% of new dwellings to be affordable in
order to significantly reduce core housing need in Niagara Region.

Page | 17
Niagara Region Housing Affordability and Growth Plan 2051
4.0 CONCLUSIONS
The analysis of the updated growth targets indicates that the conclusions presented in the earlier analysis
remain relevant under the updated 2051 targets. Maintaining the region’s current housing growth rate
could result in the region falling short of the updated population targets set out by the provincial
government. In addition, the rate at which Niagara Region builds new housing does not only impact the
future population the region can accommodate, but also the affordability of housing. If current growth
rates are maintained, the percentage of the population in core housing need may increase from around
13% to 16%, by 2051. However, even if sufficient housing is built to house the 2051 population targets,
core housing need will remain a considerable challenge.
Achieving its population and housing mix targets will require to continue the shift from a focus on single-
detached homes to increased construction of higher density dwellings, including row houses and,
particularly, apartments. In doing so, Niagara Region may not only ensure adequate housing to
accommodate its target population, but do so in a way that ensures households of varying sizes
find dwellings that are more likely able meet their housing needs. However, the ongoing shift to higher-density should not come at the expense of being able to house a wide variety of household type and
sizes, or the Region may fall short of its growth targets.