Embed Size (px)
DESCRIPTION
QIPP Right Care. NHS West Kent PCT Health investment slide pack July 2010. About this health investment pack. - PowerPoint PPT Presentation
Citation preview
NHS West Kent PCTHealth investment slide pack
July 2010
QIPP Right Care

QIP
P R
igh
t C
are
22
About this health investment pack
• Purpose / Objectives – to highlight the scale of variation in healthcare at PCT and GP Practice level and demonstrate how Programme Budgeting tools can help the search for unwarranted variation and support the health investment process
• The analysis presented provides a high level narrative in terms of expenditure, expenditure drivers, and the resulting outcomes for one disease area per PCT
• By triangulating data from a variety of sources, the analysis draws on a wide evidence base to provide
consistent messages and therefore minimises opportunities to highlight data quality issues
• This pack cannot draw comprehensive conclusions but provides a summary of readily available and
free to use national level information sets for local organisations to raise questions and investigate
further
• PCTs who want to explore these variations in more detail should take this forward through their DPH
and Public Health Observatories and Quality Observatories
• As the NHS moves towards commissioning by GP Consortia it is imperative that PCTs establish a
clear framework and evidence base for making and evaluating health investment decisions

QIP
P R
igh
t C
are
33
Overview
These slides use Programme Budgeting tools to show that, compared to similar PCTs, West Kent has;
• Average expenditure on Respiratory problems
• High rate of mortality from COPD
• Below average prescription expenditure on Respiratory problems
• High reported prevalence of COPD and a high ratio of reported to expected prevalence of COPD
• Below above average flu vaccinations for patients with COPD
• Spend of £500,000 more than the national average for inpatient admissions for Respiratory problems adjusting for age, sex and need of population
QIP
P R
igh
t C
are
4
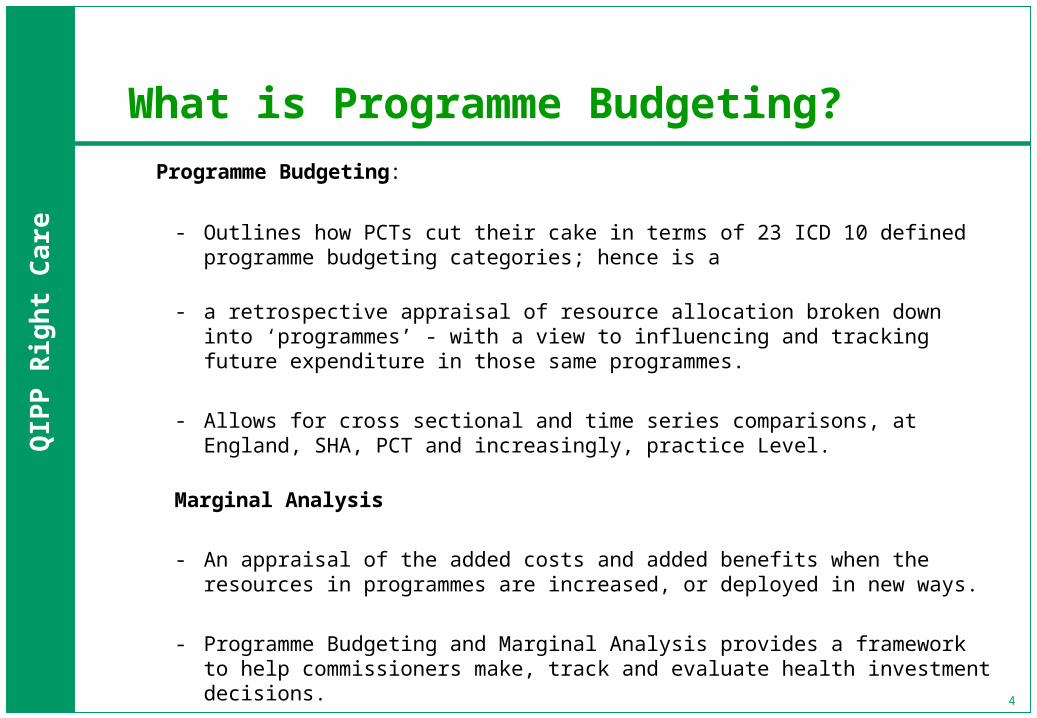
What is Programme Budgeting?
Programme Budgeting:
- Outlines how PCTs cut their cake in terms of 23 ICD 10 defined programme budgeting categories; hence is a
- a retrospective appraisal of resource allocation broken down into ‘programmes’ - with a view to influencing and tracking future expenditure in those same programmes.
- Allows for cross sectional and time series comparisons, at England, SHA, PCT and increasingly, practice Level.
Marginal Analysis
- An appraisal of the added costs and added benefits when the resources in programmes are increased, or deployed in new ways.
- Programme Budgeting and Marginal Analysis provides a framework to help commissioners make, track and evaluate health investment decisions.

QIP
P R
igh
t C
are
5
23 Programme Budgeting Categories
1 Infectious Diseases2 Cancers & Tumours3 Blood Disorders4 Endocrine, Nutritional and Metabolic
Problems5 Mental Health Problems6 Learning Disability Problems7 Neurological System Problems8 Eye/Vision Problems9 Hearing Problems10 Circulation Problems (CVD)11 Respiratory System Problems12 Dental Problems13 Gastro Intestinal System Problems
14 Skin Problems15 Musculoskeletal System Problems
(excludes Trauma)16 Trauma & Injuries17 Genito Urinary System Disorders
(except infertility)18 Maternity & Reproductive Health19 Neonates20 Poisoning21 Healthy Individuals22 Social Care Needs23 Other Conditions
What is Programme Budgeting?

QIP
P R
igh
t C
are
6
2007/08 and 2008/09 Programme Level Expenditure for England

QIP
P R
igh
t C
are
7
Information Available for PCTs
This pack will provide an update on the products available to commissioners including:
• Programme Budgeting Spreadsheet;• SPOT (Spend & Outcome Tool);• Programme Budgeting Atlas;• NHS Comparators.• Inpatient Variation Expenditure Tool (IVET)
These tools allow commissioners to compare expenditure and outcomes at disease level.
To access these tools visit;
www.networks.nhs.uk/nhs-networks/health-investment-network/key-tools
These tools are a starting point for the process of making health investment decisions.

QIP
P R
igh
t C
are
8
2006-07 2007-08 2008-09% change from
2007-08
01 Infectious Diseases 9,279 10,280 11,128 8%02 Cancers and Tumours 53,857 60,416 62,271 3%03 Disorders of Blood 12,025 17,710 17,095 -3%04 Endocrine, Nutritional and Metabolic 23,396 24,713 28,025 13%05 Mental Health Disorders 56,800 106,636 97,321 -9%06 Problems of Learning Disability 32,305 27,341 37,546 37%07 Neurological 32,141 34,027 42,962 26%08 Problems of Vision 14,582 19,805 22,017 11%09 Problems of Hearing 3,489 3,716 3,875 4%10 Problems of Circulation 76,044 75,331 76,424 1%11 Problems of the Respiratory System 38,424 42,941 45,609 6%12 Dental Problems 22,720 25,005 28,165 13%13 Problems of Gastro Intestinal System 45,606 48,055 43,839 -9%14 Problems of the Skin 14,936 16,317 19,400 19%15 Problems of Musculo Skeletal System 34,964 43,203 50,844 18%16 Problems due to Trauma and Injuries 37,523 46,914 46,388 -1%17 Problems of Genito Urinary System 34,941 36,226 41,443 14%18 Maternity and Reproductive Health 38,978 34,207 34,335 0%19 Conditions of Neonates 7,541 7,157 10,843 52%20 Adverse effects and poisoning 9,384 9,176 10,334 13%21 Healthy Individuals 10,690 12,917 21,531 67%22 Social Care Needs 10,971 11,497 13,978 22%23 Other 127,509 117,966 141,973 20%All Total 748,105 831,556 907,346 9%
Programme Budgeting Category
Expenditure on own population (£000s)
West Kent PCT
Programme Budgeting Spreadsheet – West Kent PCT

QIP
P R
igh
t C
are
9
PCT Selected
Selected Cluster details
Population (as per Allocations)
Dist from Target £'000 (Under/ Over)Dist from Target % (Under/ Over)
2006-07 Rank 2007-08 Rank 2008-09 Rank % Change
01 Infectious Diseases 1,593,296 96 1,756,364 81 1,881,777 72 7%
02 Cancers and Tumours 9,247,776 25 10,322,228 24 10,530,206 31 2%
03 Disorders of Blood 2,064,811 41 3,025,799 8 2,890,814 12 -4%
04 Endocrine, Nutritional and Metabolic 4,017,323 33 4,222,279 50 4,739,108 42 12%
05 Mental Health Disorders 9,753,118 152 18,219,034 70 16,457,262 116 -10%
06 Problems of Learning Disability 5,547,086 45 4,671,280 99 6,349,137 45 36%
07 Neurological 5,518,926 67 5,813,600 99 7,264,998 38 25%
08 Problems of Vision 2,503,873 88 3,383,735 42 3,723,138 28 10%
09 Problems of Hearing 599,096 86 634,888 101 655,274 108 3%
10 Problems of Circulation 13,057,502 46 12,870,494 63 12,923,519 79 0%
11 Problems of the Respiratory System 6,597,779 71 7,336,580 49 7,712,614 84 5%
12 Dental Problems 3,901,247 138 4,272,168 147 4,762,783 141 11%
13 Problems of Gastro Intestinal System 7,830,999 46 8,210,320 47 7,413,301 102 -10%
14 Problems of the Skin 2,564,658 96 2,787,801 93 3,280,596 64 18%
15 Problems of Musculo Skeletal System 6,003,663 98 7,381,343 81 8,597,867 50 16%
16 Problems due to Trauma and Injuries 6,443,068 47 8,015,377 13 7,844,345 24 -2%
17 Problems of Genito Urinary System 5,999,713 110 6,189,305 107 7,008,131 99 13%
18 Maternity and Reproductive Health 6,692,906 40 5,844,354 75 5,806,148 87 -1%
19 Conditions of Neonates 1,294,864 82 1,222,792 110 1,833,583 56 50%
20 Adverse effects and poisoning 1,611,325 44 1,567,743 69 1,747,509 84 11%
21 Healthy Individuals 1,835,578 106 2,206,903 109 3,640,954 71 65%
22 Social Care Needs 1,883,829 95 1,964,292 109 2,363,720 94 20%
23 Other 21,894,549 47 20,154,793 98 24,008,044 60 19%
All Total 128,456,983 142,073,474 153,434,827 8%
Programme Budgeting Category
-0.03% -0.04%
£ per 100,000 population
EXPENDITURE ON OWN POPULATION
2006/ 07 2007/ 08
(301)
2008/ 09
-0.04%
582,378 585,300 591,356
(195) (285)
West Kent PCT
Prospering UK1 SUPER (7 groups)
Programme Budgeting Spreadsheet – Expenditure per 100,000 population (weighted by age, sex and need)
West Kent PCT has average spend on Respiratory compared to PCTs nationally adjusting for age, sex and need of population

QIP
P R
igh
t C
are
10
2008/2009 Programme Budgeting Spreadsheet – Respiratory Expenditure per 100,000 population (weighted by age, sex and need)
Green circle shows West Kent PCT has average expenditure on Respiratory both nationally (blue diamonds) and when compared to similar PCTs (purple triangles)

QIP
P R
igh
t C
are
11
APHO Spend and Outcomes tool (SPOT)
• The Spend and Outcomes tool has been developed by the Association of Public Health Observatories.
• The tool allows PCTs to compare their expenditure and outcome data for each of the 23 Programme Budget disease categories on a single page.
• The tool is interactive and allows PCTs to select different outcome measures and different views of the data – including a comparison with any other selected PCT.
• A very useful tool that quickly allows PCTs to identify areas of expenditure that warrant further investigation.

QIP
P R
igh
t C
are
12
2008/2009 APHO Spend and Outcomes Tool – Each diamond represents a disease category and shows spend and outcomes compared to the national average
West Kent PCT has average spend and better outcome for Respiratory compared to PCTs nationally
Mortality from
bronchitis, emphysema,
COPD
QIP
P R
igh
t C
are
13
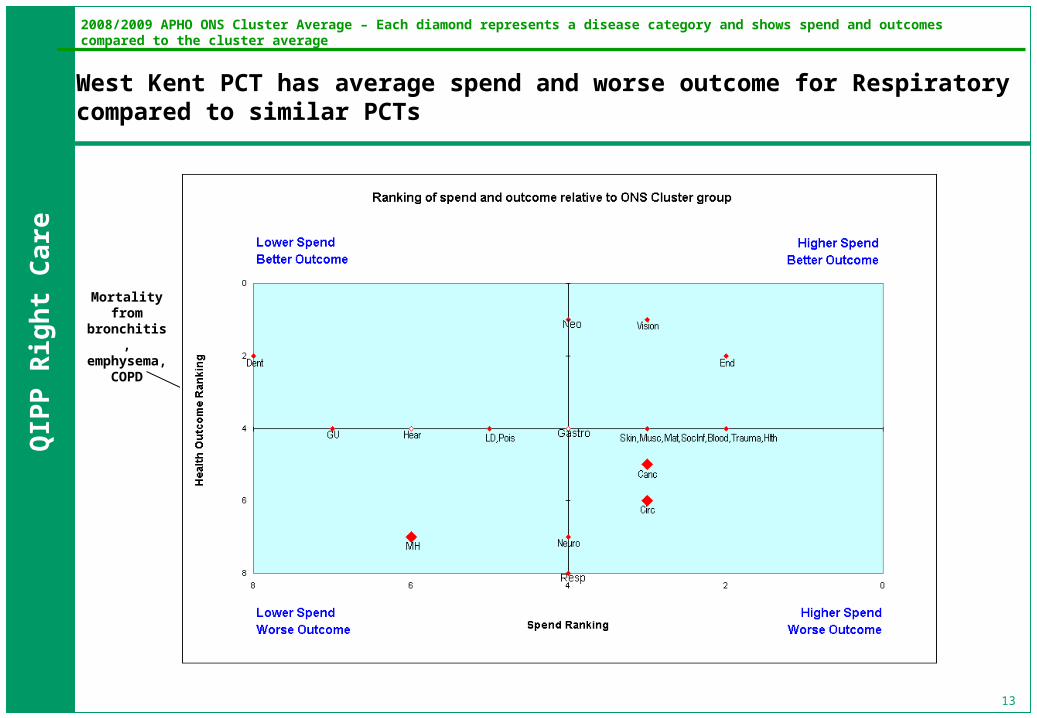
2008/2009 APHO ONS Cluster Average – Each diamond represents a disease category and shows spend and outcomes compared to the cluster average
West Kent PCT has average spend and worse outcome for Respiratory compared to similar PCTs
Mortality from
bronchitis, emphysema,
COPD

QIP
P R
igh
t C
are
14
Programme Budgeting Atlases
• The Programme Budgeting Atlases are provided on our behalf by the National Centre for Health Outcomes Development, under contract to the Information Centre for Health and Social as part of the Compendium of Public Health Indicators.
• The Atlas links programme budgeting expenditure data, as presented in the programme budgeting spreadsheet with an array of outcome data.
• By using mapping software, bar charts and correlation plots, the Atlases provides an illuminating and user-friendly way of analysing and presenting data.
• Atlases available via an NHS Net connection from:
nww.nchod.nhs.uk

QIP
P R
igh
t C
are
15
Mortality from bronchitis, emphysema and other COPD: Directly age-standardised rate per 100,000 population, all ages, all persons 2005-2007
West Kent PCT has the highest mortality rate from bronchitis, emphysema and other COPD when compared to similar PCTs

QIP
P R
igh
t C
are
16
FHS prescription expenditure: Respiratory system: Thousand pounds per 100,000 unified weighted population, 2007/2008
West Kent PCT has below average FHS prescribing expenditure on Respiratory compared to similar PCTs

QIP
P R
igh
t C
are
17
Prevalence of COPD (QOF), Percent, all ages, 2007/2008
West Kent PCT has high reported prevalence of COPD compared to similar PCTs

QIP
P R
igh
t C
are
18
Fev1 checks for patients with COPD (QOF), Percent, all ages, 2007/2008
West Kent PCT has a high rate of Fev1 checks for patients with COPD compared to similar PCTs

QIP
P R
igh
t C
are
19
Vaccinations against influenza for patients with COPD (QOF); Percent, all ages, 2007/2008
West Kent PCT has below above average flu vaccinations for patients with COPD compared to similar PCTs

QIP
P R
igh
t C
are
20
Emergency readmission to hospital within 28 days of discharge: Respiratory system. Admissions excluding day cases, indirectly age-standardised percent, all ages. 2007/2008
West Kent PCT has a high rate of emergency readmissions for Respiratory problems when compared to similar PCTs
QIP
P R
igh
t C
are
21
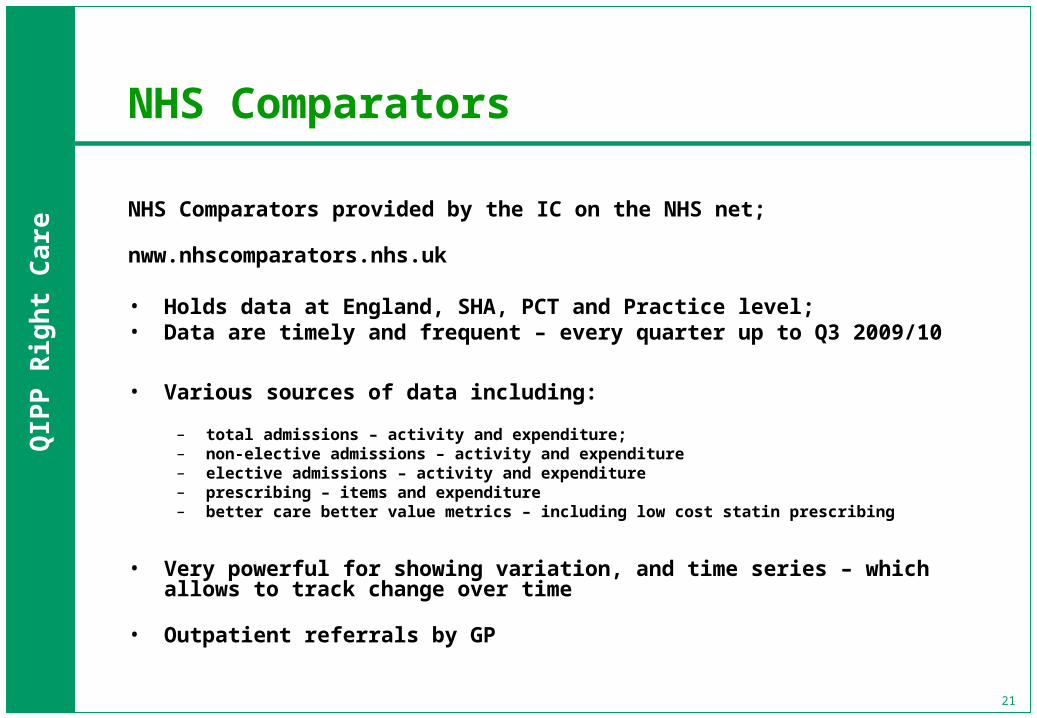
NHS Comparators
NHS Comparators provided by the IC on the NHS net;
nww.nhscomparators.nhs.uk
• Holds data at England, SHA, PCT and Practice level;• Data are timely and frequent – every quarter up to Q3 2009/10
• Various sources of data including:
– total admissions – activity and expenditure;– non-elective admissions – activity and expenditure– elective admissions – activity and expenditure– prescribing – items and expenditure– better care better value metrics – including low cost statin prescribing
• Very powerful for showing variation, and time series – which allows to track change over time
• Outpatient referrals by GP

QIP
P R
igh
t C
are
22
NHS Comparators – Expenditure on Respiratory emergency admissions – Comparison with similar PCTs
West Kent PCT have an average expenditure on Respiratory emergency admissions compared to similar PCTs

QIP
P R
igh
t C
are
23
NHS Comparators – Expenditure on Obstructive Airways Disease emergency admissions – Comparison with similar PCTs
West Kent PCT has high expenditure on Obstructive Airways Disease emergency admissions compared to similar PCTs

QIP
P R
igh
t C
are
24
West Kent PCT has a large variation at GP practice level for expenditure on Respiratory emergency admissions
Easy to identify high and low spending practices. Can compare practices within groups based on
need of population
NHS Comparators – Expenditure on Respiratory emergency admissions – GP Practice level

QIP
P R
igh
t C
are
25
NHS Comparators – COPD Reported vs Expected Prevalence – Comparison with similar PCTs
West Kent PCT has a high ratio of reported to expected prevalence of COPD compared to similar PCTs

QIP
P R
igh
t C
are
26
NHS Comparators – Breakdown of Actual and Expected Expenditure on admissions by Programme Budget or Disease Category for Barking & Dagenham PCT – Also available for FHS Prescribing Expenditure
This table is available at SHA, PCT, and Practice level, on a quarterly or annual basis.
The table shows for inpatient admissions in each disease area, actual spend, expected based on national averages, and expenditure differences in absolute and % terms.
Because expenditure is calculated as activity multiplied by tariff, the table is less useful where tariff is less well developed – e.g. Mental Health.
NHS Comparators – Breakdown of actual and expected expenditure on admissions by Programme Budget or disease category for West Kent PCT – Also available for FHS Prescribing expenditure

QIP
P R
igh
t C
are
27
Inpatient Variation Expenditure Tool (IVET)
The tool provides PCTs with:
• inpatient expenditure data (2008/9) on different diseases and interventions;
• Inpatient expenditure per 1000 population, standardising for age, sex and need;
• The change in inpatient expenditure and activity required to meet a user-defined benchmark for each disease and intervention;
• Comparative data to other PCTs – allowing variation between PCTs to be seen.
• A novel feature of this tool is that the standardisation accounts for age, sex and needs - with needs (e.g. deprivation) built up to PCT level from the Person Based Resource Allocation at practice level

QIP
P R
igh
t C
are
28
IVET: PCT inpatient expenditure above or below the benchmark for diseases in 2008-09.
West Kent PCT spend £500,000 more than the national average on Respiratory inpatient admissions adjusting for age, sex and need of population

QIP
P R
igh
t C
are
29
IVET: PCT inpatient expenditure for selected disease/intervention compared to a user defined benchmark.
The Inpatient Variation Tool allows PCTs to select a high cost disease or procedure, choose a benchmark level (e.g. median, lowest 10%) and view potential savings.

QIP
P R
igh
t C
are
30
Conclusion
These slides used Programme Budgeting tools to show that, compared to similar PCTs, West Kent has;
• Average expenditure on Respiratory problems
• High rate of mortality from COPD
• Below average prescription expenditure on Respiratory problems
• High reported prevalence of COPD and a high ratio of reported to expected prevalence of COPD
• Below above average flu vaccinations for patients with COPD
• Spend of £500,000 more than the national average for inpatient admissions for Respiratory problems adjusting for age, sex and need of population
QIP
P R
igh
t C
are
31
Next Steps• Visit the Health Investment Network website:
www.networks.nhs.uk/nhs-networks/health-investment-network• Use the E guides to understand how the tools use in this slidepack work and to
gain a better understanding of expenditure and associated outputs and outcomes.
• Produce versions of this slidepack for other programme budgeting categories.
• Download the annual population value review which provides a contextual guide to the health investment process.
• Access a video learning module that explores the definitions, tools and practical application of Programme Budgeting Marginal Analysis (PBMA)
• Find Useful links to other tools, data sources, reports and guidance.
• Further information regarding QIPP Right Care can be found at:
www.rightcare.nhs.uk
31