Embed Size (px)
Citation preview

NHS South East London
Quality, Innovation, Productivity and Prevention (QIPP) plan
November 2010 Submission

The People of South East London
• The population is relatively young and the growth of population will be mainly in those of working age
• Many parts of the borough are amongst the most deprived while other areas are amongst the most affluent

The profile of South East London
Ethnic populations for South East London sector by borough, 2009 (Source: Based on data from GLA 2007 Round Ethnic Group Projections - PLP Low©)
• There is considerable ethnic diversity in South East London• Diabetes, hypertension and stroke affect Black African, Caribbean
and Asian people more than the white population• Service will need to designed to respond to the needs of these
communities
05000
100001500020000250003000035000400004500050000
BlackAfrican
BlackCaribbean
Black Other Indian Other
Po
pu
lati
on
siz
e
Bexley Bromley Greenwich Lambeth Lewisham Southwark

Map of NHS services in South East London
Map of SE London, including hospitals and PCTs
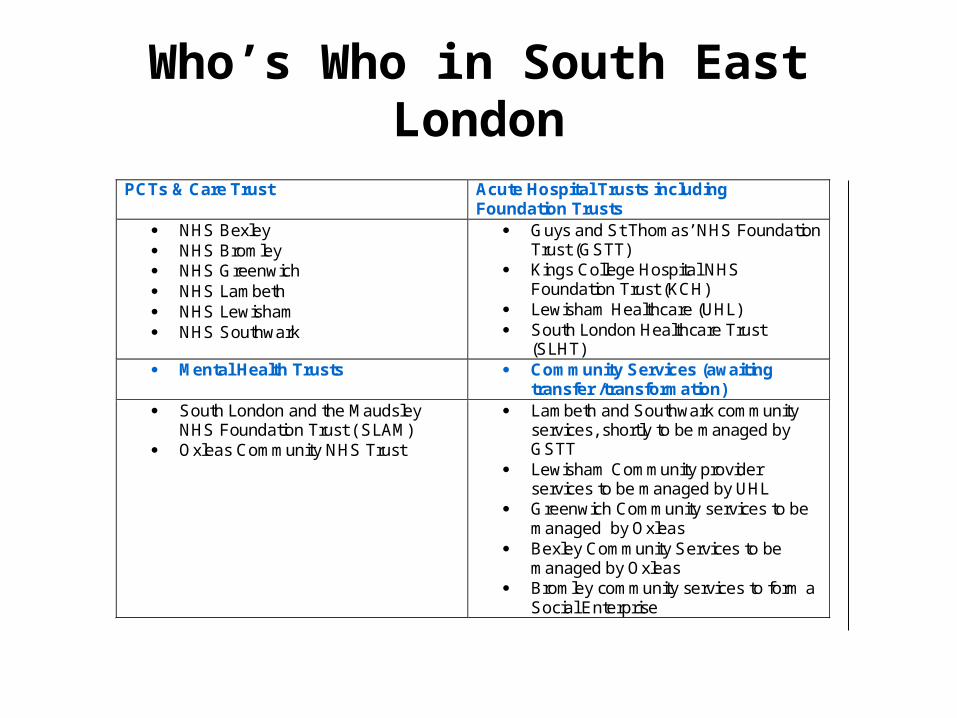
Who’s Who in South East London
PCTs & Care Trust Acute Hospital Trusts including Foundation Trusts
NHS Bexley NHS Bromley NHS Greenwich NHS Lambeth NHS Lewisham NHS Southwark
Guys and St Thomas’ NHS Foundation Trust (GSTT)
Kings College Hospital NHS Foundation Trust (KCH)
Lewisham Healthcare (UHL) South London Healthcare Trust
(SLHT) Mental Health Trusts
Community Services (awaiting
transfer /transformation) South London and the Maudsley
NHS Foundation Trust ( SLAM) Oxleas Community NHS Trust
Lambeth and Southwark community services, shortly to be managed by GSTT
Lewisham Community provider services to be managed by UHL
Greenwich Community services to be managed by Oxleas
Bexley Community Services to be managed by Oxleas
Bromley community services to form a Social Enterprise
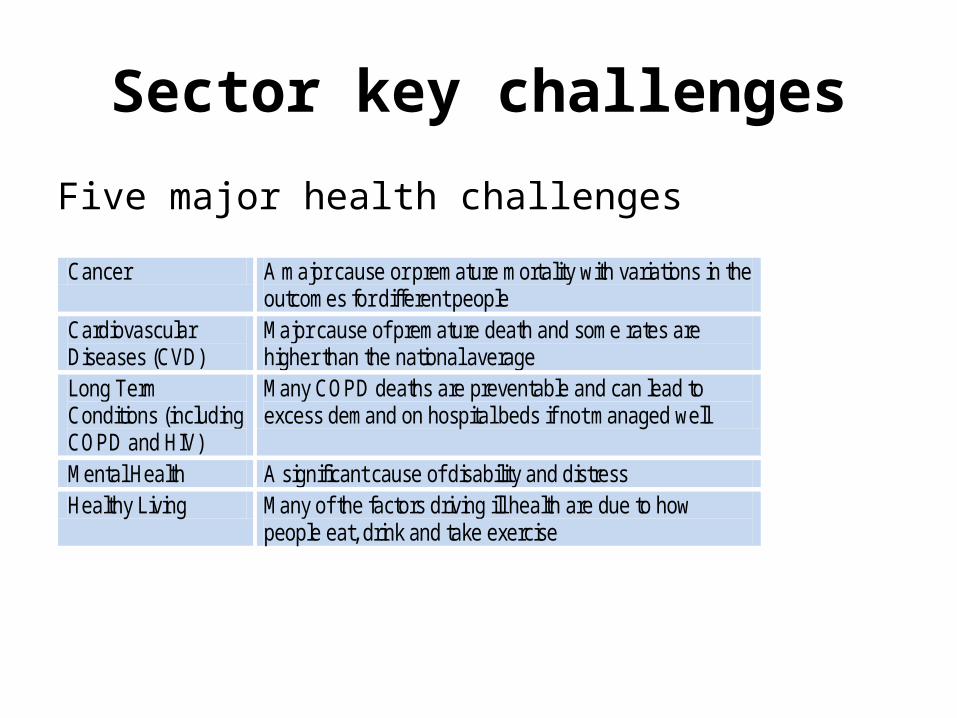
Sector key challenges
Five major health challenges
Cancer A major cause or premature mortality with variations in the outcomes for different people
Cardiovascular Diseases (CVD)
Major cause of premature death and some rates are higher than the national average
Long Term Conditions (including COPD and HIV)
Many COPD deaths are preventable and can lead to excess demand on hospital beds if not managed well
Mental Health A significant cause of disability and distress Healthy Living Many of the factors driving ill health are due to how
people eat, drink and take exercise
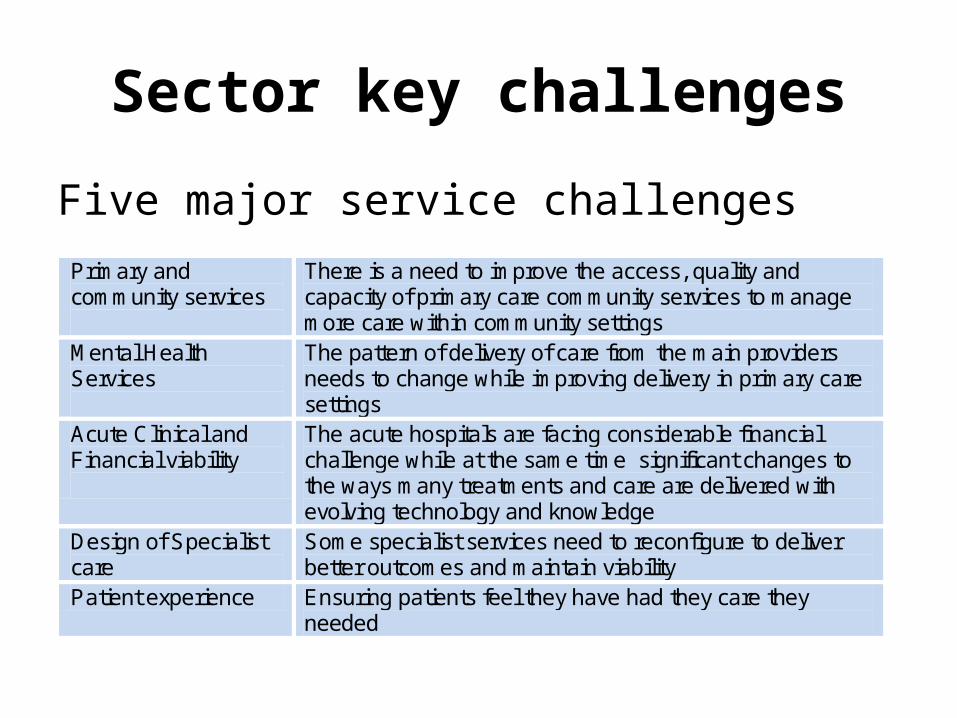
Sector key challenges
Five major service challenges
Primary and community services
There is a need to improve the access, quality and capacity of primary care community services to manage more care within community settings
Mental Health Services
The pattern of delivery of care from the main providers needs to change while improving delivery in primary care settings
Acute Clinical and Financial viability
The acute hospitals are facing considerable financial challenge while at the same time significant changes to the ways many treatments and care are delivered with evolving technology and knowledge
Design of Specialist care
Some specialist services need to reconfigure to deliver better outcomes and maintain viability
Patient experience Ensuring patients feel they have had they care they needed

Clinical case for change
• Improve survival rates and outcomes of cancer• More intensive support and care at primary care level required to
improve poor outcome rates for heart disease• Significant variations between PCT areas in the prevalence of
severe mental illness• Continue to address the determinants and risk factors for major
illnesses such as smoking, alcohol and physical activity
Five Major Health ChallengesCancerCirculatory diseaseLong term conditionsMental healthStaying healthy

Clinical case for change
Patients w ith COPD with a Record of FeV1 in the Previous 15 Months (COPD10),
April 2009 - March 2010, (QOF)
82%83%84%85%86%87%88%89%
CO
PD
10 U
nd
erly
ing
ach
ieve
men
t
• There are variations between PCTs in prevalence of long term conditions
• There is variation between PCTs in the achievement of good quality control of long term conditions
Chronic Obstructive Pulmonary Disease Register Prevalence, April 2009 - March 2010, (QOF)
0.0%
0.5%
1.0%
1.5%
2.0%
Prev
alen
ce
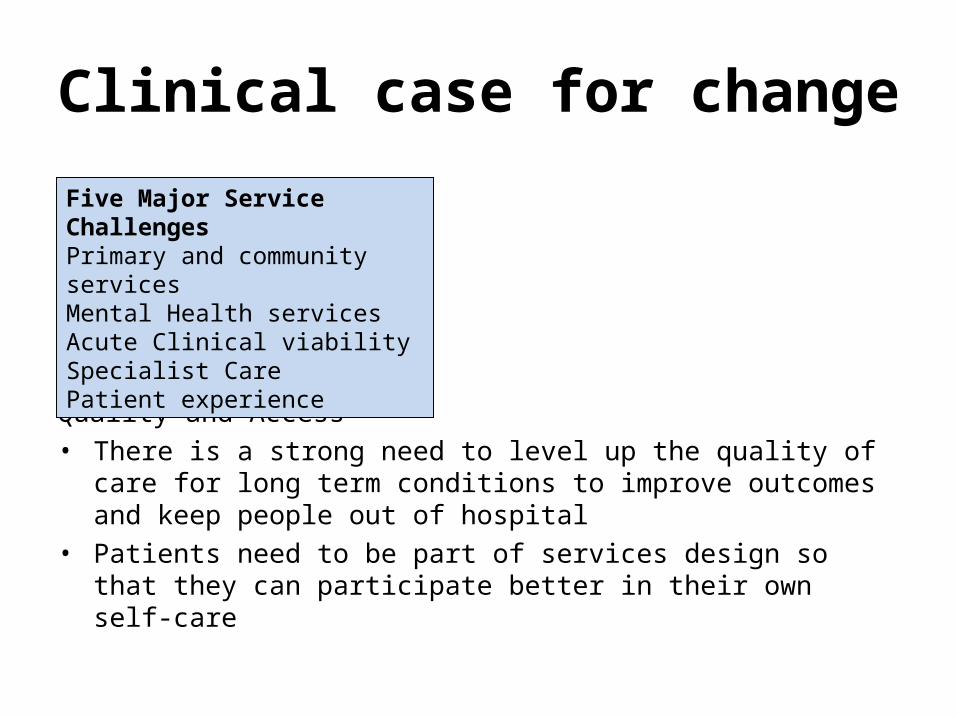
Clinical case for change
Quality and Access • There is a strong need to level up the quality of care for long term
conditions to improve outcomes and keep people out of hospital • Patients need to be part of services design so that they can
participate better in their own self-care
Five Major Service ChallengesPrimary and community services Mental Health services Acute Clinical viabilitySpecialist Care Patient experience

Clinical case for changeThe percentage of patients w ith hypertension in whom the last blood pressure
(measured in the previous 9 months) is 150/90 or less (BP5)April 2009 - March 2010 (QOF)
70%
72%
74%
76%
78%
80%
82%
BP
5 u
nd
erly
ing
ach
ieve
men
t
Evidence of different quality issues in primary care• 64% of Lewisham patients found it easy to get through by phone compared
with 70% from Lambeth
• 75% of Bexley patients could see a GP within 48 hours similar to 76% in Lambeth

Mental Health • All PCTs have identified aspects of mental health service delivery
that need redesign
• SLAM and Oxleas NHS FT are major providers but the range of
providers needs to increase Standardised Mental Health Admissions per 1,000 population,
2008/09
0
0.5
1
1.5
2
2.5
3
LA
MB
ET
H
SO
UT
HW
AR
K
LE
WIS
HA
M
BE
XL
EY
BR
OM
LE
Y
GR
EE
NW
ICH
LO
ND
ON
EN
GL
AN
DSta
nd
ard
ise
d R
ate
pe
r 1
,00
0

Clinical case for change Examples of pathway re-design and acute hospitals
• Enhanced recovery programme from bowel cancer is aiming to discharge patients after 5-6 days rather than the usual 11
• Many more patients with diabetes are being moved to have their care totally provide by their GP services who know the health and social issues affecting the patients and an opportunity to provide a more holistic approach to the patient.
• All PCTs are developing programmes around of End of Life Care so that more patients with life limiting conditions can have more choices about where to die including in their own home
• Three hospitals are opening birthing units co-located with their Obstetrics and Gynaecology to give more choices about place of care

Clinical case for change
• Kings College Hospital – There are many patients that could be better seen in primary
care with reduction in demand on outpatients clinics and in demand on A&E depts
• Guys and St Thomas Hospital– The hospital continues to increase the numbers of investigative
or operative procedures that are conducted as day cases rather than in-patients
• Lewisham Healthcare (UHL)– Hospital is reviewing the time patients stay in hospital as many
seem to stay longer than is clinically necessary
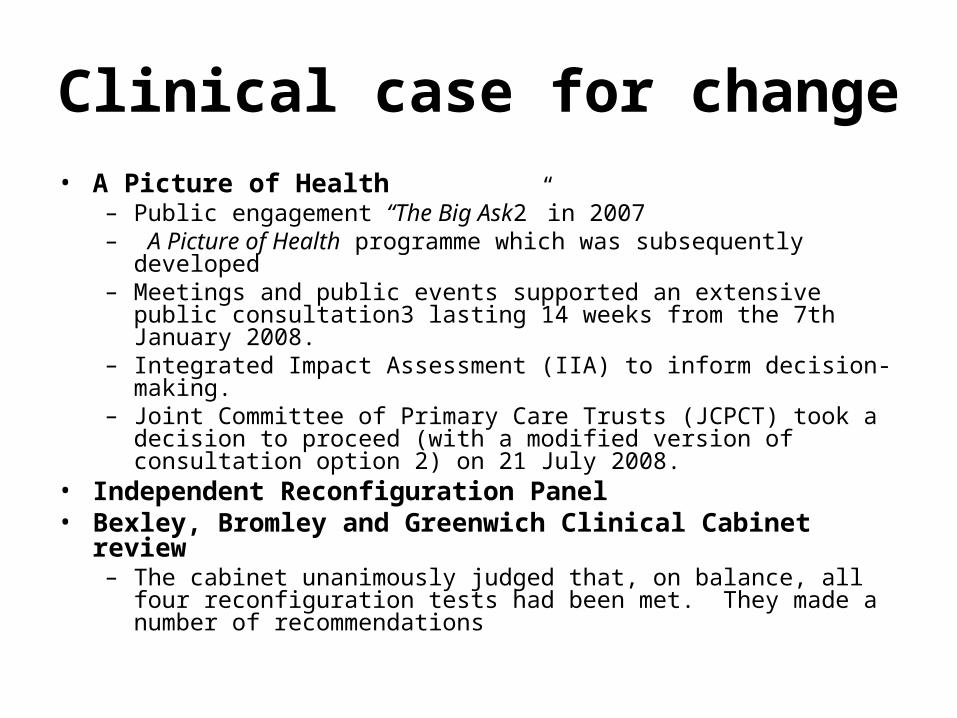
Clinical case for change• A Picture of Health
– Public engagement “The Big Ask2” in 2007– A Picture of Health programme which was subsequently developed– Meetings and public events supported an extensive public consultation3
lasting 14 weeks from the 7th January 2008. – Integrated Impact Assessment (IIA) to inform decision-making. – Joint Committee of Primary Care Trusts (JCPCT) took a decision to
proceed (with a modified version of consultation option 2) on 21 July 2008.
• Independent Reconfiguration Panel • Bexley, Bromley and Greenwich Clinical Cabinet review
– The cabinet unanimously judged that, on balance, all four reconfiguration tests had been met. They made a number of recommendations

Redesign and specialist services
– KHP is considering how to get the best outcomes for patients from bone marrow transplant through concentrating all of the care on to one site
– The cancer network has coordinated the move to centres for concentrating care for a number of cancers on fewer sites such as Gynaecological cancers, head and neck cancers and urological cancers
– Emergency admission rates for lung cancer are higher than expected for Bexley, Greenwich, Lambeth and Southwark – needs better coordination of services to prevent

Clinical case for changeBexley
The majority of services integrated with Oxleas,
with some services potentially transferring to South
London Healthcare NHS Trust
Bromley
Community Services
The PCT has reviewed and supported an
application to create a social enterprise company,
Bromley Healthcare, which links community
services with GPs, and will provide a stable
platform for the development of a business focus to
the delivery of local community based services.
This is currently under consideration by NHSL.
Greenwich
As part of the planned integration of Greenwich
Community Health Services (GCHS) with Oxleas
NHS Foundation Trust in April 2011, a three year
Transformation Strategy is being prepared jointly
using the Quality, Innovation, Productivity and
Prevention (QIPP) framework as its guide and will
be submitted as part of the NHS London Stage 2
Assessment.
Lambeth
In partnership with Southwark provider services are
integrating with GSTT as part of KHP.
Lewisham
Lewisham Community Health Services
[LCHS] integrated with University Hospital
Lewisham [UHL] on 1st August 2010 to become
known as Lewisham Healthcare NHS Trust [LHC].
LCHS at that time were a division within UHL. LHC
are now redesigning their divisions to ensure that
the community division is fully integrated across all
the hospital divisions and this process will be
completed by January 2011.
Southwark
In partnership with Lambeth integration with GSTT
as part of KHP
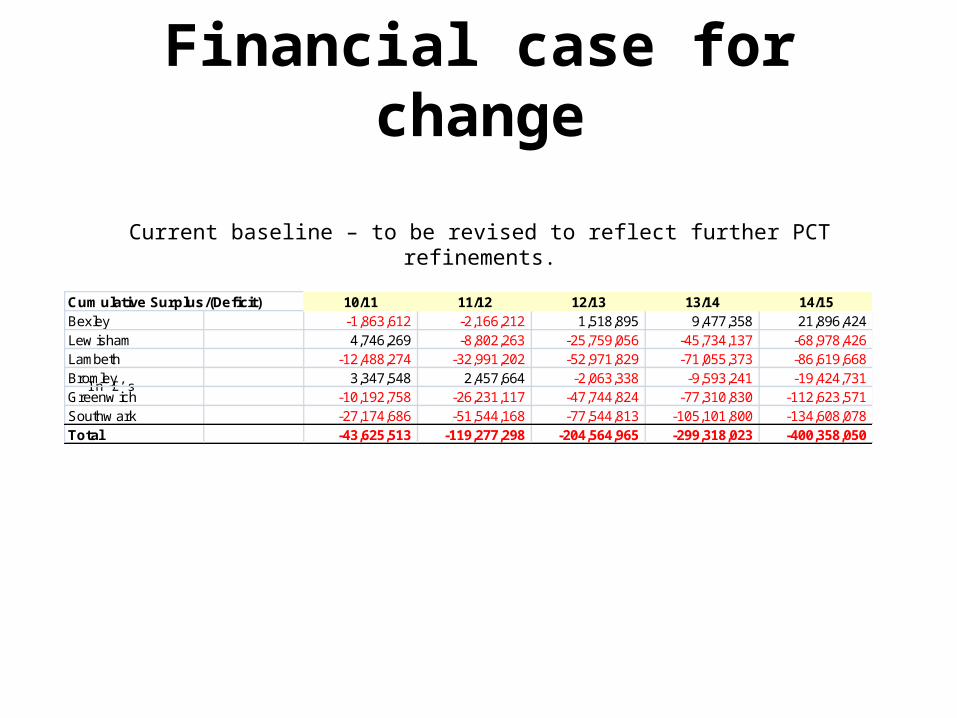
Financial case for change
Current baseline – to be revised to reflect further PCT refinements.
In £’s
Cumulative Surplus/(Deficit) 10/11 11/12 12/13 13/14 14/15Bexley -1,863,612 -2,166,212 1,518,895 9,477,358 21,896,424Lew isham 4,746,269 -8,802,263 -25,759,056 -45,734,137 -68,978,426 Lambeth -12,488,274 -32,991,202 -52,971,829 -71,055,373 -86,619,668 Bromley 3,347,548 2,457,664 -2,063,338 -9,593,241 -19,424,731 Greenw ich -10,192,758 -26,231,117 -47,744,824 -77,310,830 -112,623,571 Southw ark -27,174,686 -51,544,168 -77,544,813 -105,101,800 -134,608,078 Total -43,625,513 -119,277,298 -204,564,965 -299,318,023 -400,358,050
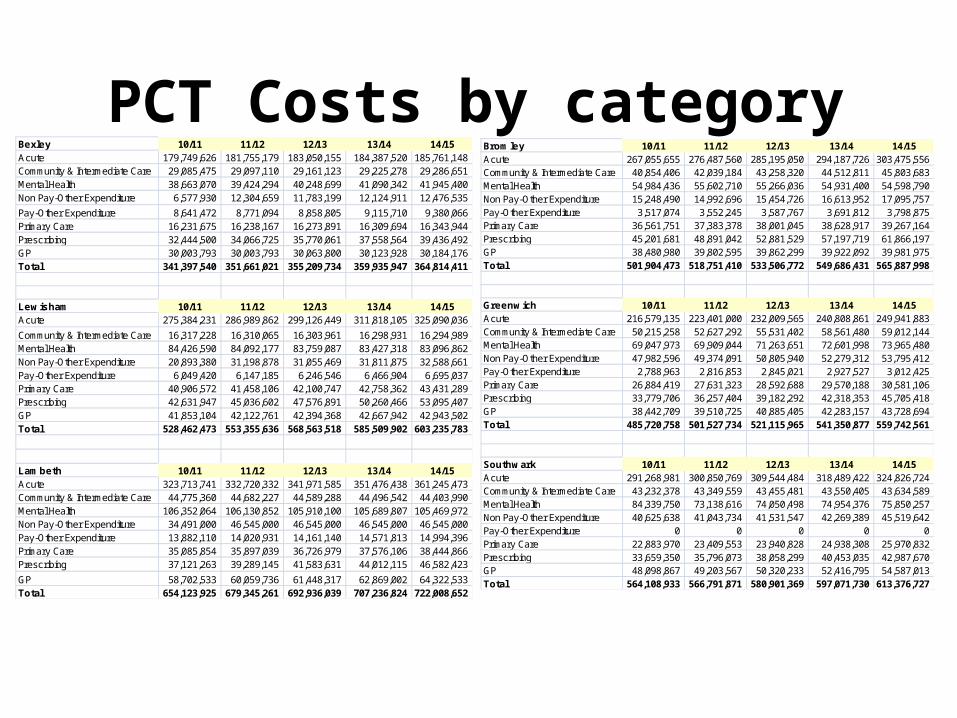
PCT Costs by categoryBexley 10/11 11/12 12/13 13/14 14/15Acute 179,749,626 181,755,179 183,050,155 184,387,520 185,761,148Community & Intermediate Care 29,085,475 29,097,110 29,161,123 29,225,278 29,286,651Mental Health 38,663,070 39,424,294 40,248,699 41,090,342 41,945,400Non Pay-Other Expenditure 6,577,930 12,304,659 11,783,199 12,124,911 12,476,535
Pay-Other Expenditure 8,641,472 8,771,094 8,858,805 9,115,710 9,380,066Primary Care 16,231,675 16,238,167 16,273,891 16,309,694 16,343,944Prescribing 32,444,500 34,066,725 35,770,061 37,558,564 39,436,492GP 30,003,793 30,003,793 30,063,800 30,123,928 30,184,176Total 341,397,540 351,661,021 355,209,734 359,935,947 364,814,411
Lewisham 10/11 11/12 12/13 13/14 14/15Acute 275,384,231 286,989,862 299,126,449 311,818,105 325,090,036
Community & Intermediate Care 16,317,228 16,310,065 16,303,961 16,298,931 16,294,989Mental Health 84,426,590 84,092,177 83,759,087 83,427,318 83,096,862Non Pay-Other Expenditure 20,893,380 31,198,878 31,055,469 31,811,875 32,588,661Pay-Other Expenditure 6,049,420 6,147,185 6,246,546 6,466,904 6,695,037Primary Care 40,906,572 41,458,106 42,100,747 42,758,362 43,431,289Prescribing 42,631,947 45,036,602 47,576,891 50,260,466 53,095,407GP 41,853,104 42,122,761 42,394,368 42,667,942 42,943,502Total 528,462,473 553,355,636 568,563,518 585,509,902 603,235,783
Lambeth 10/11 11/12 12/13 13/14 14/15Acute 323,713,741 332,720,332 341,971,585 351,476,438 361,245,473Community & Intermediate Care 44,775,360 44,682,227 44,589,288 44,496,542 44,403,990Mental Health 106,352,064 106,130,852 105,910,100 105,689,807 105,469,972Non Pay-Other Expenditure 34,491,000 46,545,000 46,545,000 46,545,000 46,545,000Pay-Other Expenditure 13,882,110 14,020,931 14,161,140 14,571,813 14,994,396Primary Care 35,085,854 35,897,039 36,726,979 37,576,106 38,444,866Prescribing 37,121,263 39,289,145 41,583,631 44,012,115 46,582,423
GP 58,702,533 60,059,736 61,448,317 62,869,002 64,322,533Total 654,123,925 679,345,261 692,936,039 707,236,824 722,008,652
Bromley 10/11 11/12 12/13 13/14 14/15Acute 267,055,655 276,487,560 285,195,050 294,187,726 303,475,556Community & Intermediate Care 40,854,406 42,039,184 43,258,320 44,512,811 45,803,683Mental Health 54,984,436 55,602,710 55,266,036 54,931,400 54,598,790Non Pay-Other Expenditure 15,248,490 14,992,696 15,454,726 16,613,952 17,095,757Pay-Other Expenditure 3,517,074 3,552,245 3,587,767 3,691,812 3,798,875Primary Care 36,561,751 37,383,378 38,001,045 38,628,917 39,267,164Prescribing 45,201,681 48,891,042 52,881,529 57,197,719 61,866,197GP 38,480,980 39,802,595 39,862,299 39,922,092 39,981,975Total 501,904,473 518,751,410 533,506,772 549,686,431 565,887,998
Greenwich 10/11 11/12 12/13 13/14 14/15Acute 216,579,135 223,401,000 232,009,565 240,808,861 249,941,883Community & Intermediate Care 50,215,258 52,627,292 55,531,402 58,561,480 59,012,144Mental Health 69,047,973 69,909,044 71,263,651 72,601,998 73,965,480Non Pay-Other Expenditure 47,982,596 49,374,091 50,805,940 52,279,312 53,795,412Pay-Other Expenditure 2,788,963 2,816,853 2,845,021 2,927,527 3,012,425Primary Care 26,884,419 27,631,323 28,592,688 29,570,188 30,581,106Prescribing 33,779,706 36,257,404 39,182,292 42,318,353 45,705,418GP 38,442,709 39,510,725 40,885,405 42,283,157 43,728,694Total 485,720,758 501,527,734 521,115,965 541,350,877 559,742,561
Southwark 10/11 11/12 12/13 13/14 14/15Acute 291,268,981 300,850,769 309,544,484 318,489,422 324,826,724Community & Intermediate Care 43,232,378 43,349,559 43,455,481 43,550,405 43,634,589Mental Health 84,339,750 73,138,616 74,050,498 74,954,376 75,850,257Non Pay-Other Expenditure 40,625,638 41,043,734 41,531,547 42,269,389 45,519,642Pay-Other Expenditure 0 0 0 0 0Primary Care 22,883,970 23,409,553 23,940,828 24,938,308 25,970,832Prescribing 33,659,350 35,796,073 38,058,299 40,453,035 42,987,670GP 48,098,867 49,203,567 50,320,233 52,416,795 54,587,013Total 564,108,933 566,791,871 580,901,369 597,071,730 613,376,727

Growth and tariff assumptions
Organisation Prescri
bing Ta
riff gro
wth
Demogr
aphic g
rowth
Non-d
emogr
aphic A
cute g
rowth
Total A
cute G
rowth (
Dem+
Non D
em)
Primary
Care G
rowth T
otal (D
em+N
on Dem
)
Non A
cute G
rowth c
are To
tal (De
m + No
n Dem
)
Prescri
bing Ta
riff gro
wth
Demogr
aphic g
rowth
Non-d
emogr
aphic A
cute g
rowth
Total A
cute G
rowth (
Dem+
Non D
em)
Primary
Care G
rowth T
otal (D
em+N
on Dem
)
Non A
cute G
rowth c
are To
tal (De
m + No
n Dem
)
Prescri
bing Ta
riff gro
wth
Demogr
aphic g
rowth
Non-d
emogr
aphic A
cute g
rowth
Total A
cute G
rowth (
Dem+
Non D
em)
Primary
Care G
rowth T
otal (D
em+N
on Dem
)
Non A
cute G
rowth c
are To
tal (De
m + No
n Dem
)
Prescri
bing Ta
riff gro
wth
Demogr
aphic g
rowth
Non-d
emogr
aphic A
cute g
rowth
Total A
cute G
rowth (
Dem+
Non D
em)
Primary
Care G
rowth T
otal (D
em+N
on Dem
)
Non A
cute G
rowth c
are To
tal (De
m + No
n Dem
)
Prescri
bing Ta
riff gro
wth
Demogr
aphic g
rowth
Non-d
emogr
aphic A
cute g
rowth
Total A
cute G
rowth (
Dem+
Non D
em)
Primary
Care G
rowth T
otal (D
em+N
on Dem
)
Non A
cute G
rowth c
are To
tal (De
m + No
n Dem
)
Bexley 4.50% -0.01% 0.91% 0.90% 0.06% 2.00% 5.00% 0.04% 2.67% 2.71% 0.04% 2.02% 5.00% 0.22% 2.49% 2.71% 0.22% 2.09% 5.00% 0.22% 2.49% 2.71% 0.22% 2.09% 5.00% 0.21% 2.50% 2.71% 0.22% 2.09%Bromley 2.00% 0.15% 3.50% 3.65% 0.15% 0.25% 8.00% 0.15% 4.00% 4.15% 0.15% 0.25% 8.00% 0.15% 4.00% 4.15% 0.15% 0.25% 8.00% 0.15% 4.00% 4.15% 0.15% 0.25% 8.00% 0.15% 4.00% 4.15% 0.15% 0.25%Greenwich 6.70% 1.30% 0.00% 1.30% 1.30% 1.90% 6.00% 1.26% 3.00% 4.26% 1.30% 1.90% 6.00% 1.95% 3.00% 4.95% 2.00% 2.80% 6.00% 1.90% 3.00% 4.90% 1.90% 2.70% 6.00% 1.90% 3.00% 4.90% 1.90% 2.70%Lambeth 5.00% 0.66% 3.14% 3.80% 0.00% 0.90% 5.00% 0.65% 3.15% 3.80% 0.00% 0.90% 5.00% 0.58% 3.22% 3.80% 0.00% 3.60% 5.00% 0.54% 3.26% 3.80% 0.00% 0.90% 5.00% 0.54% 3.26% 3.80% 0.00% 0.90%Lewisham 5.00% 0.00% 5.60% 5.60% 96.00% 0.60% 5.00% 0.61% 5.60% 6.21% 0.60% 0.60% 5.00% 0.61% 5.60% 6.21% 0.60% 0.60% 5.00% 0.61% 5.60% 6.21% 0.60% 0.60% 5.00% 0.61% 5.60% 6.21% 0.60% 0.60%Southwark 5.00% 3.10% 1.00% 4.10% 1.42% 2.60% 5.00% 3.30% 1.00% 4.30% 1.28% 2.60% 5.00% 2.90% 1.00% 3.90% 1.26% 2.20% 5.00% 2.90% 1.00% 3.90% 1.23% 2.20% 5.00% 2.00% 1.00% 3.00% 1.21% 2.20%SEL 4.70% 0.87% 2.36% 3.89% 0.70% 1.38% 5.45% 1.36% 2.82% 4.18% 0.70% 1.38% 5.33% 1.44% 2.79% 4.23% 0.80% 1.92% 5.35% 1.43% 2.79% 4.22% 0.80% 1.46% 5.35% 1.43% 2.79% 4.22% 0.80% 1.46%
Local2010/11 2011/12
Local2014/152012/13
Local2013/14
Local

QIPP initiative analysis: summary by PCT by year – shown by new initiatives in each year vs. the cumulative
impact of the initiative in each year (to reduce the cumulative gap)
New Savings Initiatives 10/11 11/12 12/13 13/14 14/15Bexley 3,372,662 10,468,494 0 0 0Lew isham 3,753,743 14,656,305 7,017,430 3,556,480 2,938,294Lambeth 18,247,274 7,430,152 8,108,374 3,451,693 2,484,805Bromley 3,537,634 5,034,924 4,760,213 3,119,151 4,456,949Greenw ich 14,773,703 8,062,770 2,580,616 8,932,712 1,355,000Southw ark 28,469,686 15,473,186 9,439,008 3,586,903 3,125,645Total 72,154,702 61,125,832 31,905,641 22,646,939 14,360,694
Total Savings Initiatives 10/11 11/12 12/13 13/14 14/15Bexley 3,372,662 13,841,156 13,841,156 13,841,156 13,841,156
Lew isham 3,753,743 18,396,833 25,414,264 29,470,744 32,409,038Lambeth 18,247,274 28,329,426 29,296,680 31,457,373 30,497,215Bromley 3,537,634 8,572,559 13,411,038 16,603,522 21,060,471Greenw ich 14,773,703 22,836,473 25,417,089 34,349,801 35,704,801Southw ark 28,469,686 26,625,883 31,397,422 31,207,588 33,295,233Total 72,154,702 118,602,331 138,777,649 156,930,184 166,807,914