Embed Size (px)
DESCRIPTION
NHS Nottingham City. Performance Report February 2011. Introduction The performance management report provides members with highly visual information relating to key performance indicators, demonstrating performance to date and highlighting areas of concern. - PowerPoint PPT Presentation
Citation preview

1
NHS Nottingham City
Performance Report
February 2011
2
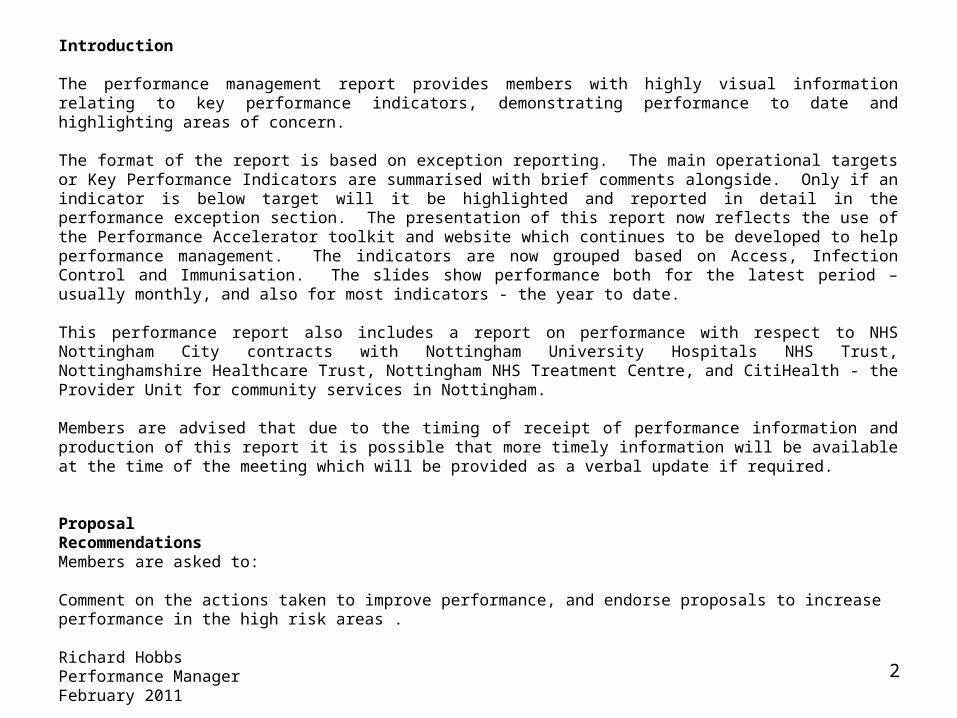
Introduction
The performance management report provides members with highly visual information relating to key performance indicators, demonstrating performance to date and highlighting areas of concern.
The format of the report is based on exception reporting. The main operational targets or Key Performance Indicators are summarised with brief comments alongside. Only if an indicator is below target will it be highlighted and reported in detail in the performance exception section. The presentation of this report now reflects the use of the Performance Accelerator toolkit and website which continues to be developed to help performance management. The indicators are now grouped based on Access, Infection Control and Immunisation. The slides show performance both for the latest period – usually monthly, and also for most indicators - the year to date.
This performance report also includes a report on performance with respect to NHS Nottingham City contracts with Nottingham University Hospitals NHS Trust, Nottinghamshire Healthcare Trust, Nottingham NHS Treatment Centre, and CitiHealth - the Provider Unit for community services in Nottingham.
Members are advised that due to the timing of receipt of performance information and production of this report it is possible that more timely information will be available at the time of the meeting which will be provided as a verbal update if required.
ProposalRecommendationsMembers are asked to:
Comment on the actions taken to improve performance, and endorse proposals to increase performance in the high risk areas .
Richard HobbsPerformance ManagerFebruary 2011
3
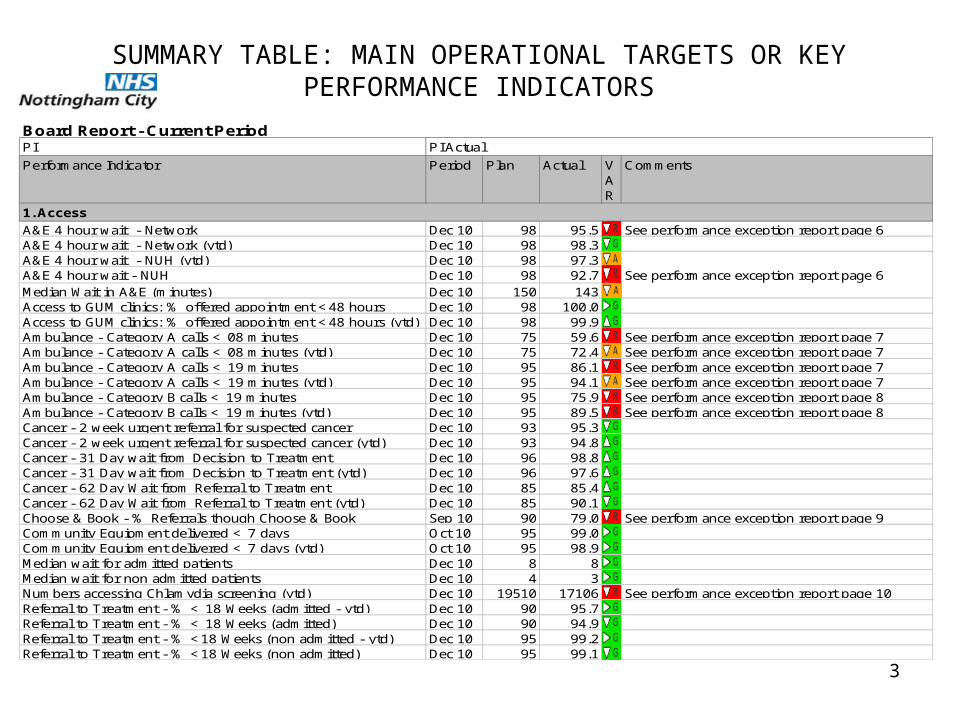
SUMMARY TABLE: MAIN OPERATIONAL TARGETS OR KEY PERFORMANCE INDICATORS
Period Plan Actual VAR
Dec 10 98 95.5Dec 10 98 98.3Dec 10 98 97.3Dec 10 98 92.7Dec 10 150 143Dec 10 98 100.0Dec 10 98 99.9Dec 10 75 59.6Dec 10 75 72.4Dec 10 95 86.1Dec 10 95 94.1Dec 10 95 75.9Dec 10 95 89.5Dec 10 93 95.3Dec 10 93 94.8Dec 10 96 98.8Dec 10 96 97.6Dec 10 85 85.4Dec 10 85 90.1Sep 10 90 79.0Oct 10 95 99.0Oct 10 95 98.9Dec 10 8 8Dec 10 4 3Dec 10 19510 17106Dec 10 90 95.7Dec 10 90 94.9Dec 10 95 99.2Dec 10 95 99.1
Board Report - Current PeriodPI PI Actual
A&E 4 hour wait - Network (ytd)A&E 4 hour wait - NUH (ytd)
Performance Indicator Comments
1. Access
A&E 4 hour wait - Network See performance exception report page 6
See performance exception report page 6A&E 4 hour wait - NUH
Access to GUM clinics: % offered appointment <48 hoursAccess to GUM clinics: % offered appointment <48 hours (ytd)Ambulance - Category A calls < 08 minutes See performance exception report page 7Ambulance - Category A calls < 08 minutes (ytd) See performance exception report page 7Ambulance - Category A calls < 19 minutes See performance exception report page 7Ambulance - Category A calls < 19 minutes (ytd) See performance exception report page 7Ambulance - Category B calls < 19 minutes See performance exception report page 8Ambulance - Category B calls < 19 minutes (ytd) See performance exception report page 8Cancer - 2 week urgent referral for suspected cancerCancer - 2 week urgent referral for suspected cancer (ytd)Cancer - 31 Day wait from Decision to TreatmentCancer - 31 Day wait from Decision to Treatment (ytd)
See performance exception report page 9Community Equipment delivered < 7 days
Cancer - 62 Day Wait from Referral to TreatmentCancer - 62 Day Wait from Referral to Treatment (ytd)
Median wait for non admitted patients
Median Wait in A&E (minutes)
Numbers accessing Chlamydia screening (ytd) See performance exception report page 10
Community Equipment delivered < 7 days (ytd)Median wait for admitted patients
Choose & Book - % Referrals though Choose & Book
Referral to Treatment - % < 18 Weeks (admitted - ytd)Referral to Treatment - % < 18 Weeks (admitted)Referral to Treatment - % <18 Weeks (non admitted - ytd)Referral to Treatment - % <18 Weeks (non admitted)
4
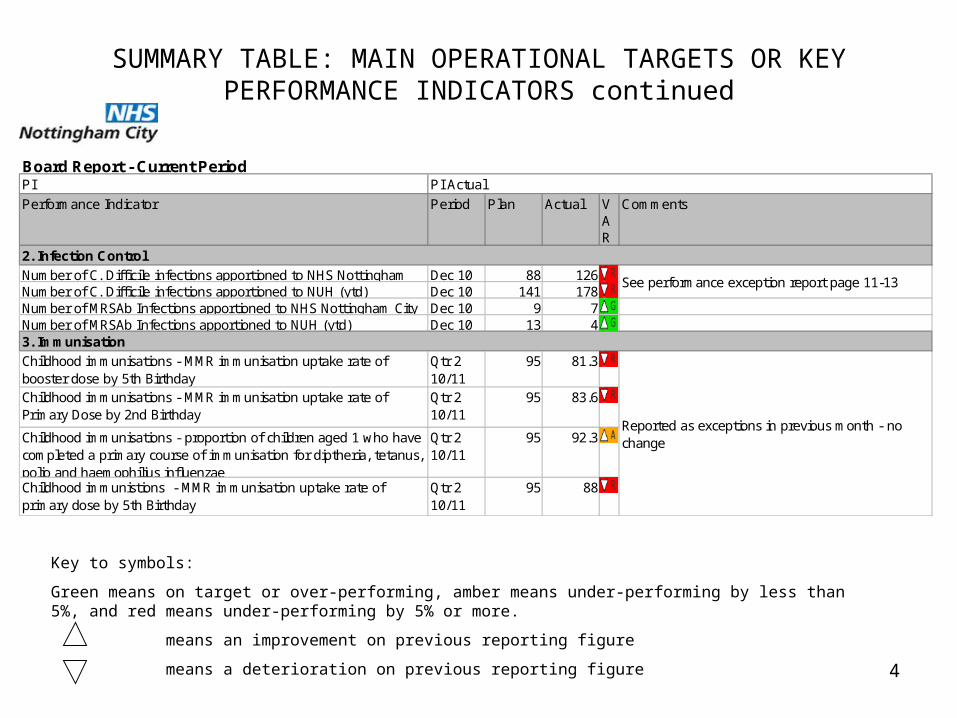
SUMMARY TABLE: MAIN OPERATIONAL TARGETS OR KEY PERFORMANCE INDICATORS continued
Key to symbols:
Green means on target or over-performing, amber means under-performing by less than 5%, and red means under-performing by 5% or more.
means an improvement on previous reporting figure
means a deterioration on previous reporting figure
Period Plan Actual VAR
Dec 10 88 126Dec 10 141 178Dec 10 9 7Dec 10 13 4
Qtr 2 10/11
95 81.3
Qtr 2 10/11
95 83.6
Qtr 2 10/11
95 92.3
Qtr 2 10/11
95 88
Board Report - Current PeriodPI PI Actual
Performance Indicator Comments
2. Infection Control
Number of C. Difficile infections apportioned to NHS Nottingham Number of C. Difficile infections apportioned to NUH (ytd)
See performance exception report page 11-13
Number of MRSAb Infections apportioned to NHS Nottingham City Number of MRSAb Infections apportioned to NUH (ytd)
Childhood immunisations - proportion of children aged 1 who have completed a primary course of immunisation for diptheria, tetanus, polio and haemophilius influenzaeChildhood immunistions - MMR immunisation uptake rate of primary dose by 5th Birthday
Reported as exceptions in previous month - no change
3. Immunisation
Childhood immunisations - MMR immunisation uptake rate of booster dose by 5th BirthdayChildhood immunisations - MMR immunisation uptake rate of Primary Dose by 2nd Birthday
Performance Exceptions
5
6
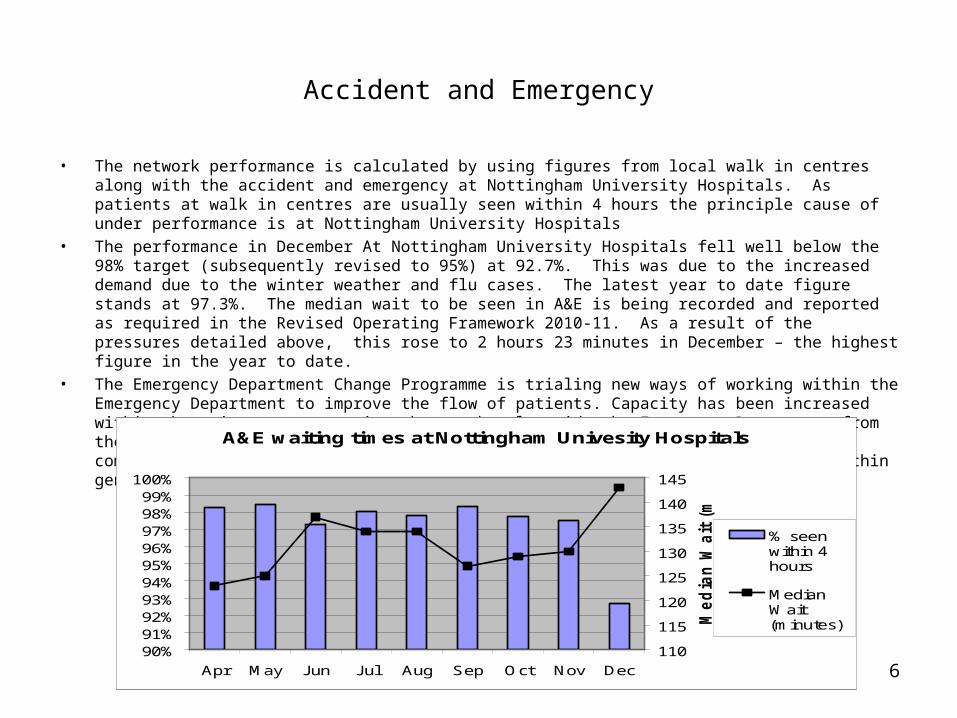
Accident and Emergency
• The network performance is calculated by using figures from local walk in centres along with the accident and emergency at Nottingham University Hospitals. As patients at walk in centres are usually seen within 4 hours the principle cause of under performance is at Nottingham University Hospitals
• The performance in December At Nottingham University Hospitals fell well below the 98% target (subsequently revised to 95%) at 92.7%. This was due to the increased demand due to the winter weather and flu cases. The latest year to date figure stands at 97.3%. The median wait to be seen in A&E is being recorded and reported as required in the Revised Operating Framework 2010-11. As a result of the pressures detailed above, this rose to 2 hours 23 minutes in December – the highest figure in the year to date.
• The Emergency Department Change Programme is trialing new ways of working within the Emergency Department to improve the flow of patients. Capacity has been increased within the primary care service that works alongside the Emergency Department from the beginning of September and NHS Nottingham City is starting to work with GP commissioning clusters on improving access to same day appointments / advice within general practice.
A&E waiting times at Nottingham Univesity Hospitals
90%91%92%93%94%95%96%97%98%99%
100%
Apr May Jun Jul Aug Sep Oct Nov Dec
110
115
120
125
130
135
140
145
Med
ian
Wait
(m
ins)
% seenwithin 4hours
MedianWait(minutes)
7
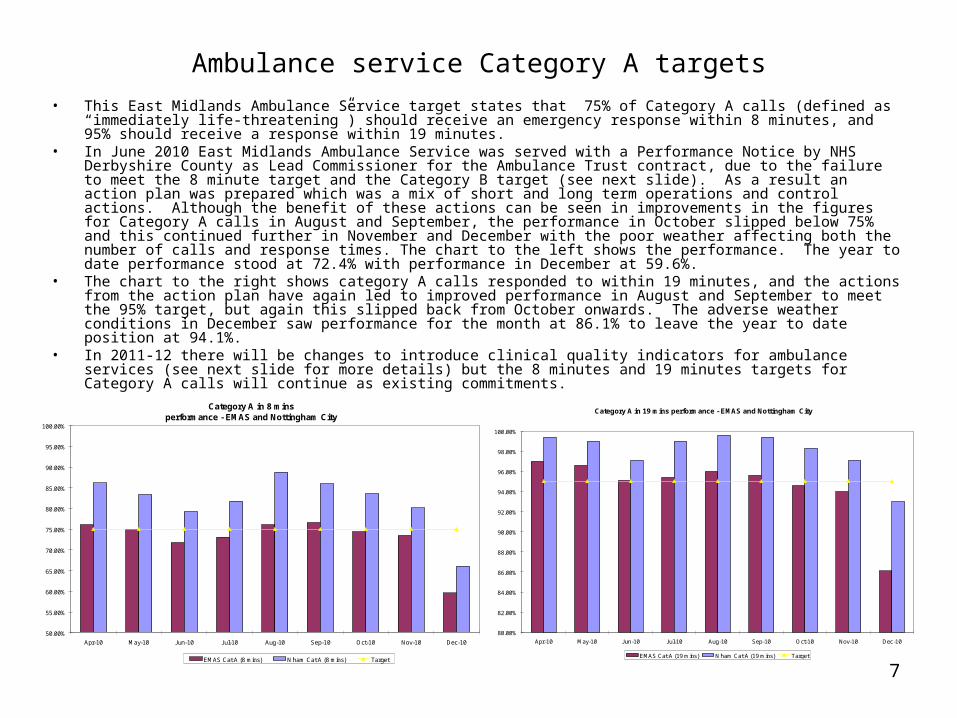
Ambulance service Category A targets
• This East Midlands Ambulance Service target states that 75% of Category A calls (defined as “immediately life-threatening”) should receive an emergency response within 8 minutes, and 95% should receive a response within 19 minutes.
• In June 2010 East Midlands Ambulance Service was served with a Performance Notice by NHS Derbyshire County as Lead Commissioner for the Ambulance Trust contract, due to the failure to meet the 8 minute target and the Category B target (see next slide). As a result an action plan was prepared which was a mix of short and long term operations and control actions. Although the benefit of these actions can be seen in improvements in the figures for Category A calls in August and September, the performance in October slipped below 75% and this continued further in November and December with the poor weather affecting both the number of calls and response times. The chart to the left shows the performance. The year to date performance stood at 72.4% with performance in December at 59.6%.
• The chart to the right shows category A calls responded to within 19 minutes, and the actions from the action plan have again led to improved performance in August and September to meet the 95% target, but again this slipped back from October onwards. The adverse weather conditions in December saw performance for the month at 86.1% to leave the year to date position at 94.1%.
• In 2011-12 there will be changes to introduce clinical quality indicators for ambulance services (see next slide for more details) but the 8 minutes and 19 minutes targets for Category A calls will continue as existing commitments.
Category A in 8 mins performance - EMAS and Nottingham City
50.00%
55.00%
60.00%
65.00%
70.00%
75.00%
80.00%
85.00%
90.00%
95.00%
100.00%
Apr-10 May-10 Jun-10 Jul-10 Aug-10 Sep-10 Oct-10 Nov-10 Dec-10
EMAS Cat A (8 mins) N'ham Cat A (8 mins) Target
Category A in 19 mins performance - EMAS and Nottingham City
80.00%
82.00%
84.00%
86.00%
88.00%
90.00%
92.00%
94.00%
96.00%
98.00%
100.00%
Apr-10 May-10 Jun-10 Jul-10 Aug-10 Sep-10 Oct-10 Nov-10 Dec-10
EMAS Cat A (19 mins) N'ham Cat A (19 mins) Target
8
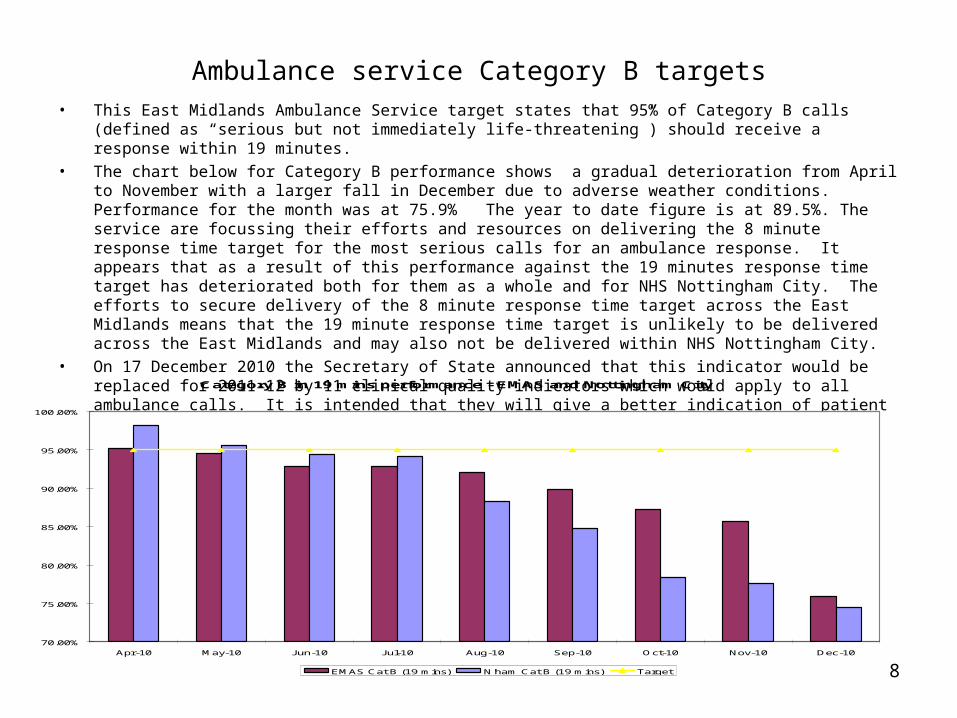
Ambulance service Category B targets• This East Midlands Ambulance Service target states that 95% of Category B calls (defined as “serious but not
immediately life-threatening”) should receive a response within 19 minutes.• The chart below for Category B performance shows a gradual deterioration from April to November with a larger
fall in December due to adverse weather conditions. Performance for the month was at 75.9% The year to date figure is at 89.5%. The service are focussing their efforts and resources on delivering the 8 minute response time target for the most serious calls for an ambulance response. It appears that as a result of this performance against the 19 minutes response time target has deteriorated both for them as a whole and for NHS Nottingham City. The efforts to secure delivery of the 8 minute response time target across the East Midlands means that the 19 minute response time target is unlikely to be delivered across the East Midlands and may also not be delivered within NHS Nottingham City.
• On 17 December 2010 the Secretary of State announced that this indicator would be replaced for 2011-12 by 11 clinical quality indicators which would apply to all ambulance calls. It is intended that they will give a better indication of patient care and experience. Timeliness will still be an important factor but will be supplemented with additional outcome and service measures.
Category B in 19 mins performance - EMAS and Nottingham City
70.00%
75.00%
80.00%
85.00%
90.00%
95.00%
100.00%
Apr-10 May-10 Jun-10 Jul-10 Aug-10 Sep-10 Oct-10 Nov-10 Dec-10
EMAS Cat B (19 mins) N'ham Cat B (19 mins) Target
9
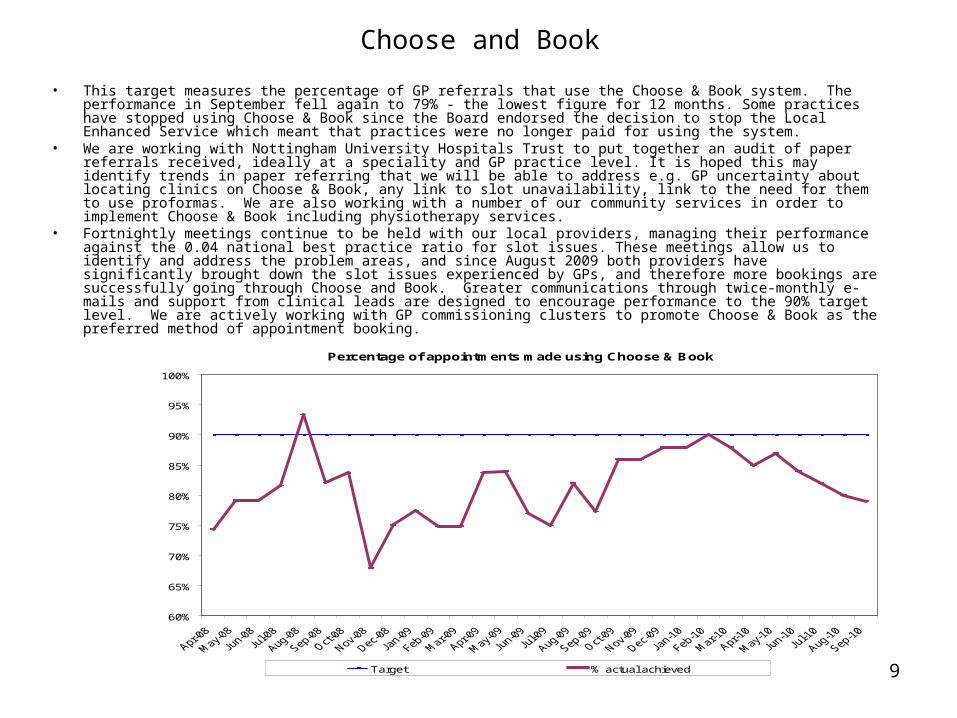
Choose and Book
• This target measures the percentage of GP referrals that use the Choose & Book system. The performance in September fell again to 79% - the lowest figure for 12 months. Some practices have stopped using Choose & Book since the Board endorsed the decision to stop the Local Enhanced Service which meant that practices were no longer paid for using the system.
• We are working with Nottingham University Hospitals Trust to put together an audit of paper referrals received, ideally at a speciality and GP practice level. It is hoped this may identify trends in paper referring that we will be able to address e.g. GP uncertainty about locating clinics on Choose & Book, any link to slot unavailability, link to the need for them to use proformas. We are also working with a number of our community services in order to implement Choose & Book including physiotherapy services.
• Fortnightly meetings continue to be held with our local providers, managing their performance against the 0.04 national best practice ratio for slot issues. These meetings allow us to identify and address the problem areas, and since August 2009 both providers have significantly brought down the slot issues experienced by GPs, and therefore more bookings are successfully going through Choose and Book. Greater communications through twice-monthly e-mails and support from clinical leads are designed to encourage performance to the 90% target level. We are actively working with GP commissioning clusters to promote Choose & Book as the preferred method of appointment booking.
Percentage of appointments made using Choose & Book
60%
65%
70%
75%
80%
85%
90%
95%
100%
Target % actual achieved
10
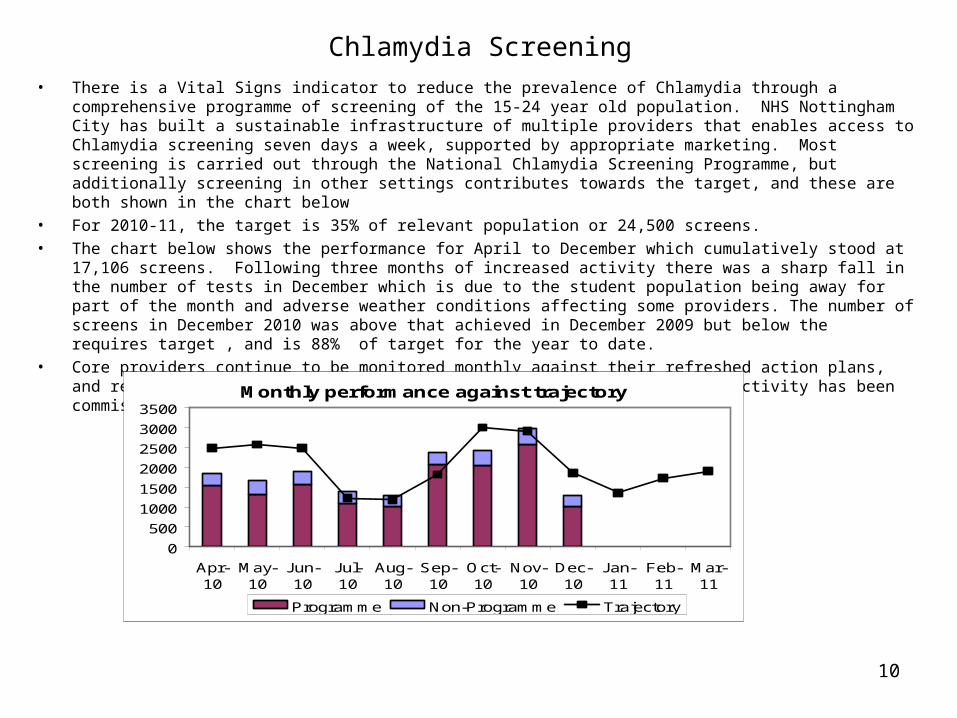
Chlamydia Screening• There is a Vital Signs indicator to reduce the prevalence of Chlamydia through a comprehensive programme of
screening of the 15-24 year old population. NHS Nottingham City has built a sustainable infrastructure of multiple providers that enables access to Chlamydia screening seven days a week, supported by appropriate marketing. Most screening is carried out through the National Chlamydia Screening Programme, but additionally screening in other settings contributes towards the target, and these are both shown in the chart below
• For 2010-11, the target is 35% of relevant population or 24,500 screens.• The chart below shows the performance for April to December which cumulatively stood at 17,106 screens. Following
three months of increased activity there was a sharp fall in the number of tests in December which is due to the student population being away for part of the month and adverse weather conditions affecting some providers. The number of screens in December 2010 was above that achieved in December 2009 but below the requires target , and is 88% of target for the year to date.
• Core providers continue to be monitored monthly against their refreshed action plans, and refreshed trajectories are being performance managed. Additional activity has been commissioned from the independent provider.
Monthly performance against trajectory
0
500
1000
1500
2000
2500
3000
3500
Apr-10
May-10
Jun-10
Jul-10
Aug-10
Sep-10
Oct-10
Nov-10
Dec-10
Jan-11
Feb-11
Mar-11
Programme Non-Programme Trajectory
11
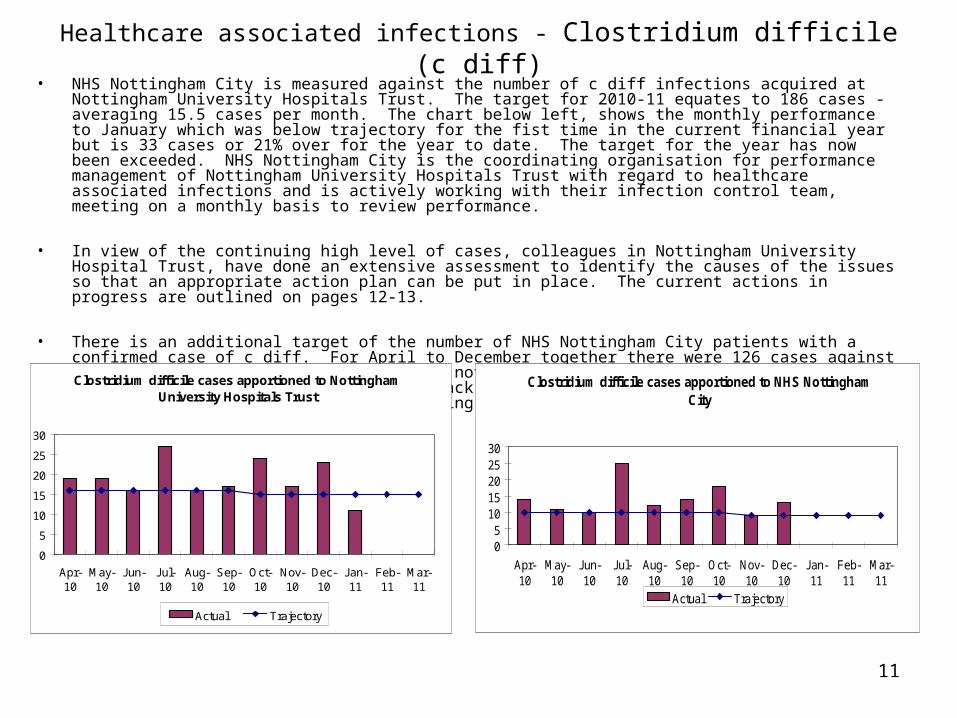
Healthcare associated infections - Clostridium difficile (c diff)• NHS Nottingham City is measured against the number of c diff infections acquired at Nottingham University
Hospitals Trust. The target for 2010-11 equates to 186 cases - averaging 15.5 cases per month. The chart below left, shows the monthly performance to January which was below trajectory for the fist time in the current financial year but is 33 cases or 21% over for the year to date. The target for the year has now been exceeded. NHS Nottingham City is the coordinating organisation for performance management of Nottingham University Hospitals Trust with regard to healthcare associated infections and is actively working with their infection control team, meeting on a monthly basis to review performance.
• In view of the continuing high level of cases, colleagues in Nottingham University Hospital Trust, have done an extensive assessment to identify the causes of the issues so that an appropriate action plan can be put in place. The current actions in progress are outlined on pages 12-13.
• There is an additional target of the number of NHS Nottingham City patients with a confirmed case of c diff. For April to December together there were 126 cases against a trajectory of 88 –January’s figure is not yet available (chart below right). The number of these cases will generally track the numbers at the trust, and the same measures will be responsible for improving both targets.
Clostridium difficile cases apportioned to Nottingham University Hospitals Trust
0
5
10
15
20
25
30
Apr-10
May-10
Jun-10
Jul-10
Aug-10
Sep-10
Oct-10
Nov-10
Dec-10
Jan-11
Feb-11
Mar-11
Actual Trajectory
Clostridium difficile cases apportioned to NHS Nottingham City
05
1015202530
Apr-10
May-10
Jun-10
Jul-10
Aug-10
Sep-10
Oct-10
Nov-10
Dec-10
Jan-11
Feb-11
Mar-11
Actual Trajectory
12
Clostridium difficile continuedThe challenge to reduce Clostridium difficile infections within Nottingham continues. The many different ribotype strains currently identified is suggestive of a change in the Clostridium difficile epidemiology. There are very few identifications of the previous epidemic ribotypes (001,106 and 027) implying that there is very little direct cross-infection with Clostridium difficile occurring to account for the numbers of infections at this time. Environmental sampling within Nottingham University Hospitals NHS Trust has failed to identify any significant contamination.
The actions being taken to address the higher numbers of cases have been reported extensively in the last few months, and many of these are on-going, with Nottingham University Hospitals Trust continue to update their Clostridium difficile action plan.
A health economy meeting was held with the Health Protection Agency on 21 December 2010 to support gaining a greater understanding of the suggested change in the epidemiology of the disease. The outcome of this review will direct health economy and organisational response. Conclusions from data presented before include:
– Despite the numbers of cases, the current c diff rate per 1,000 bed-days has been maintained.– The number of actual cases, based on the amount of patients and samples tested, is only slightly higher
than expected.– There has been a significant reduction in c diff associated deaths since July 2007 when 8 cases were
reported. There was only one such death in 2010.– There are only two cases of c diff associated complications reported to date in 2010-11.– There are no increase in c diff outbreaks reported – five in 2009-10 and only one in 2010-11 so far.– The increased positivity rate in the 45-64 age range correlates to the larger number of samples from that
age group.– The different number of ribotype strains is more indicative of sporadic infections rather than outbreaks,
possibly due to patients being admitted to hospital already colonised with c diff in their gut.
13
Clostridium difficile (c diff) continued
A number of actions were agreed from the meeting including:– A comparison of local data with that from University Hospitals of Leicester, NHS Leicester City and NHS
Leicestershire County & Rutland.– Discuss proposed c diff epidemiological research with Dr Jonathan Van Tam – Professor of Health
Protection.– Analyse the age demographics of samples submitted for c diff testing and the wards requesting tests– Examine the possibility of mapping the social demographics of c diff positive patients.
Provider-specific Performance
14
15
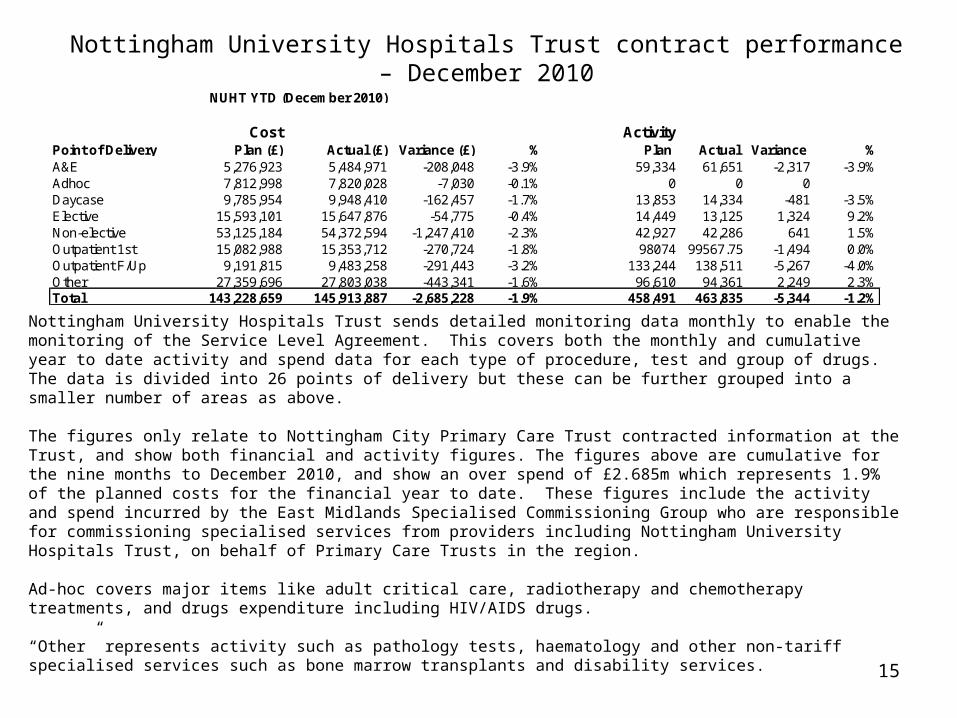
Nottingham University Hospitals Trust contract performance – December 2010
Nottingham University Hospitals Trust sends detailed monitoring data monthly to enable the monitoring of the Service Level Agreement. This covers both the monthly and cumulative year to date activity and spend data for each type of procedure, test and group of drugs. The data is divided into 26 points of delivery but these can be further grouped into a smaller number of areas as above.
The figures only relate to Nottingham City Primary Care Trust contracted information at the Trust, and show both financial and activity figures. The figures above are cumulative for the nine months to December 2010, and show an over spend of £2.685m which represents 1.9% of the planned costs for the financial year to date. These figures include the activity and spend incurred by the East Midlands Specialised Commissioning Group who are responsible for commissioning specialised services from providers including Nottingham University Hospitals Trust, on behalf of Primary Care Trusts in the region. Ad-hoc covers major items like adult critical care, radiotherapy and chemotherapy treatments, and drugs expenditure including HIV/AIDS drugs.
“Other” represents activity such as pathology tests, haematology and other non-tariff specialised services such as bone marrow transplants and disability services.
NUHT YTD (December 2010)
Cost ActivityPoint of Delivery Plan (£) Actual (£) Variance (£) % Plan Actual Variance %A&E 5,276,923 5,484,971 -208,048 -3.9% 59,334 61,651 -2,317 -3.9%Adhoc 7,812,998 7,820,028 -7,030 -0.1% 0 0 0Daycase 9,785,954 9,948,410 -162,457 -1.7% 13,853 14,334 -481 -3.5%Elective 15,593,101 15,647,876 -54,775 -0.4% 14,449 13,125 1,324 9.2%Non-elective 53,125,184 54,372,594 -1,247,410 -2.3% 42,927 42,286 641 1.5%Outpatient 1st 15,082,988 15,353,712 -270,724 -1.8% 98074 99567.75 -1,494 0.0%Outpatient F/Up 9,191,815 9,483,258 -291,443 -3.2% 133,244 138,511 -5,267 -4.0%Other 27,359,696 27,803,038 -443,341 -1.6% 96,610 94,361 2,249 2.3%Total 143,228,659 145,913,887 -2,685,228 -1.9% 458,491 463,835 -5,344 -1.2%
16
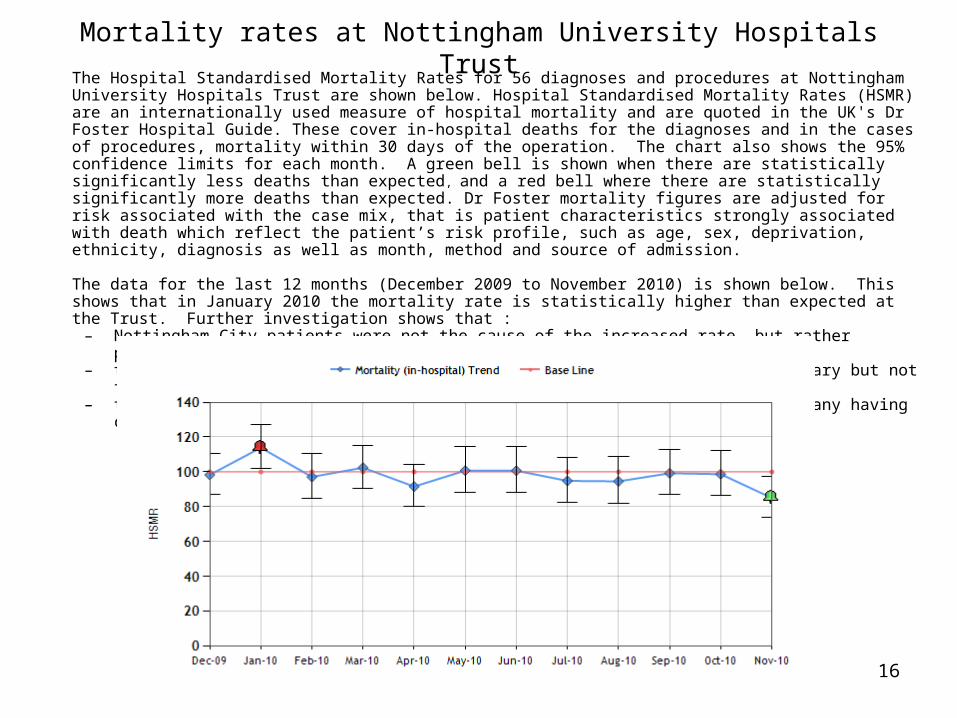
Mortality rates at Nottingham University Hospitals TrustThe Hospital Standardised Mortality Rates for 56 diagnoses and procedures at Nottingham University Hospitals Trust are shown below. Hospital Standardised Mortality Rates (HSMR) are an internationally used measure of hospital mortality and are quoted in the UK's Dr Foster Hospital Guide. These cover in-hospital deaths for the diagnoses and in the cases of procedures, mortality within 30 days of the operation. The chart also shows the 95% confidence limits for each month. A green bell is shown when there are statistically significantly less deaths than expected , and a red bell where there are statistically significantly more deaths than expected. Dr Foster mortality figures are adjusted for risk associated with the case mix, that is patient characteristics strongly associated with death which reflect the patient’s risk profile, such as age, sex, deprivation, ethnicity, diagnosis as well as month, method and source of admission.
The data for the last 12 months (December 2009 to November 2010) is shown below. This shows that in January 2010 the mortality rate is statistically higher than expected at the Trust. Further investigation shows that :
– Nottingham City patients were not the cause of the increased rate, but rather patients from other primary care trusts at the hospital,
– the diagnosis group for pneumonia had a higher HSMR than expected in January but not for 2009-10 as a whole,– the January cohort of patients were generally over 80 years of age with many having co-morbidities.
17
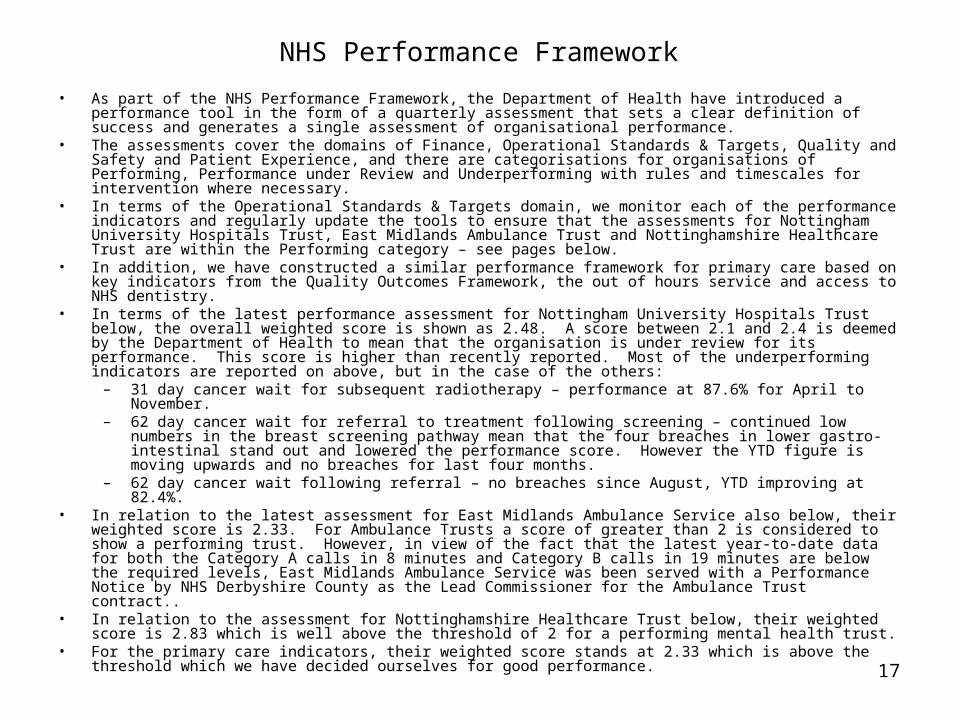
NHS Performance Framework
• As part of the NHS Performance Framework, the Department of Health have introduced a performance tool in the form of a quarterly assessment that sets a clear definition of success and generates a single assessment of organisational performance.
• The assessments cover the domains of Finance, Operational Standards & Targets, Quality and Safety and Patient Experience, and there are categorisations for organisations of Performing, Performance under Review and Underperforming with rules and timescales for intervention where necessary.
• In terms of the Operational Standards & Targets domain, we monitor each of the performance indicators and regularly update the tools to ensure that the assessments for Nottingham University Hospitals Trust, East Midlands Ambulance Trust and Nottinghamshire Healthcare Trust are within the Performing category – see pages below.
• In addition, we have constructed a similar performance framework for primary care based on key indicators from the Quality Outcomes Framework, the out of hours service and access to NHS dentistry.
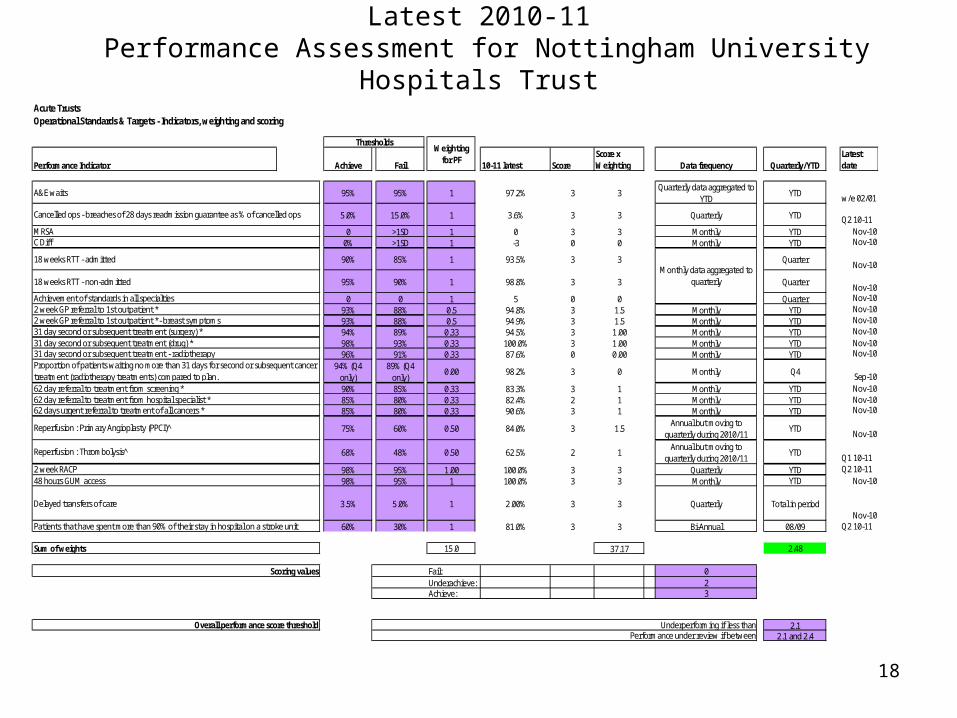
• In terms of the latest performance assessment for Nottingham University Hospitals Trust below, the overall weighted score is shown as 2.48. A score between 2.1 and 2.4 is deemed by the Department of Health to mean that the organisation is under review for its performance. This score is higher than recently reported. Most of the underperforming indicators are reported on above, but in the case of the others:
– 31 day cancer wait for subsequent radiotherapy – performance at 87.6% for April to November.– 62 day cancer wait for referral to treatment following screening – continued low numbers in the breast
screening pathway mean that the four breaches in lower gastro-intestinal stand out and lowered the performance score. However the YTD figure is moving upwards and no breaches for last four months.
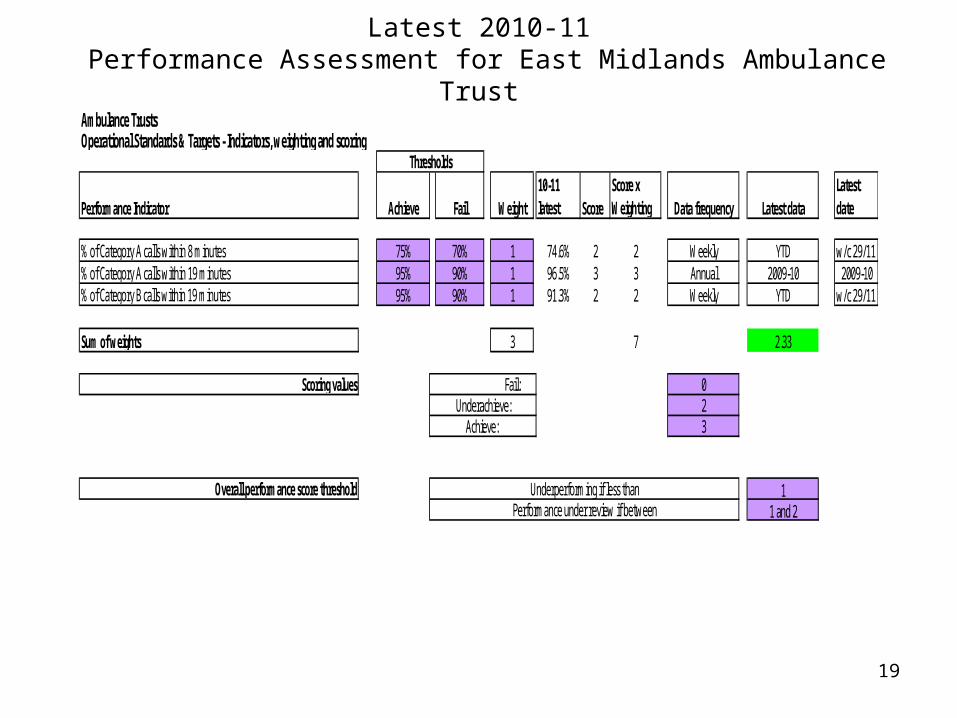
– 62 day cancer wait following referral – no breaches since August, YTD improving at 82.4%.• In relation to the latest assessment for East Midlands Ambulance Service also below, their weighted score is
2.33. For Ambulance Trusts a score of greater than 2 is considered to show a performing trust. However, in view of the fact that the latest year-to-date data for both the Category A calls in 8 minutes and Category B calls in 19 minutes are below the required levels, East Midlands Ambulance Service was been served with a Performance Notice by NHS Derbyshire County as the Lead Commissioner for the Ambulance Trust contract..
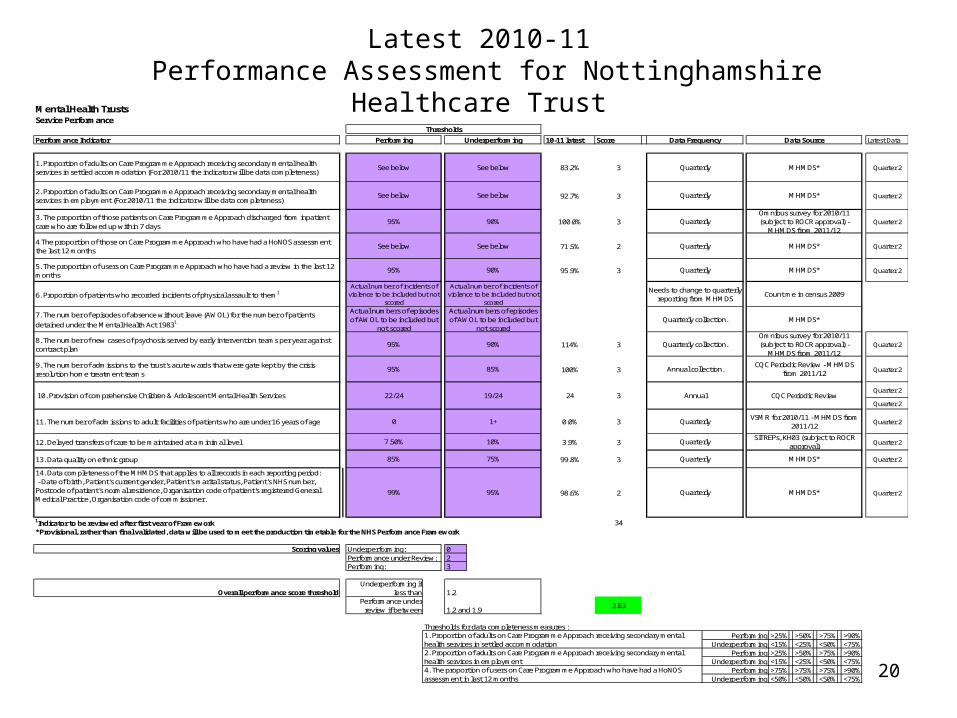
• In relation to the assessment for Nottinghamshire Healthcare Trust below, their weighted score is 2.83 which is well above the threshold of 2 for a performing mental health trust.
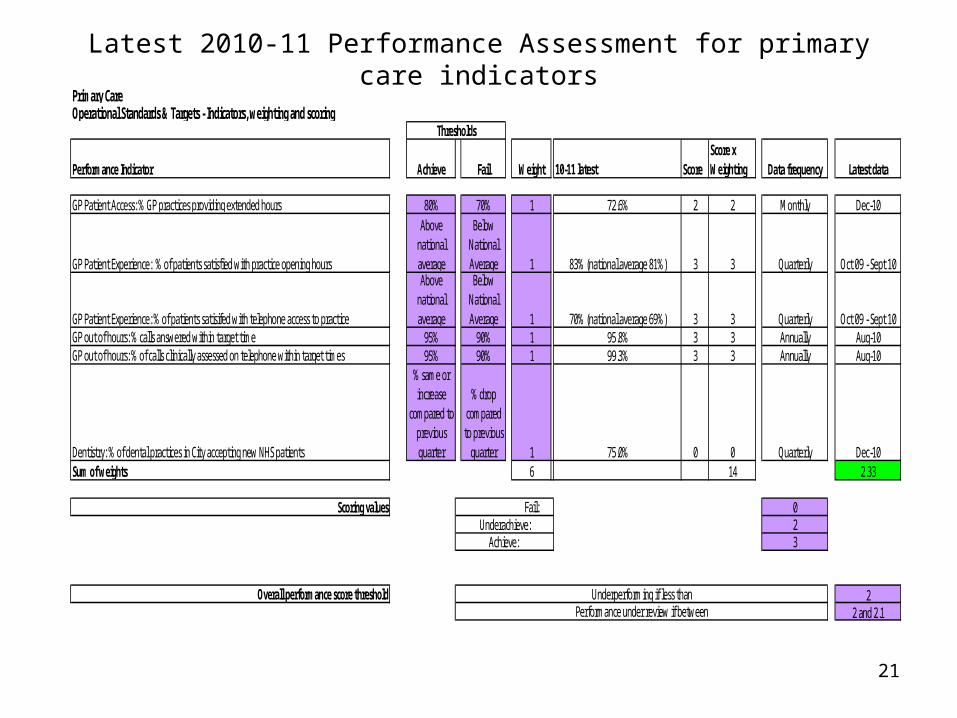
• For the primary care indicators, their weighted score stands at 2.33 which is above the threshold which we have decided ourselves for good performance.
18
Latest 2010-11 Performance Assessment for Nottingham University Hospitals Trust
Acute TrustsOperational Standards & Targets - Indicators, weighting and scoring
Performance Indicator Achieve Fail 10-11 latest ScoreScore x Weighting Data frequency Quarterly/YTD
Latest date
95% 95% 1 97.2% 3 3Quarterly data aggregated to
YTDYTD w/e 02/01
5.0% 15.0% 1 3.6% 3 3 Quarterly YTD Q2 10-110 >1SD 1 0 3 3 Monthly YTD Nov-10
0% >1SD 1 -3 0 0 Monthly YTD Nov-10
90% 85% 1 93.5% 3 3 Quarter Nov-10
95% 90% 1 98.8% 3 3 QuarterNov-10
0 0 1 5 0 0 Quarter Nov-1093% 88% 0.5 94.8% 3 1.5 Monthly YTD Nov-1093% 88% 0.5 94.9% 3 1.5 Monthly YTD Nov-1094% 89% 0.33 94.5% 3 1.00 Monthly YTD Nov-1098% 93% 0.33 100.0% 3 1.00 Monthly YTD Nov-1096% 91% 0.33 87.6% 0 0.00 Monthly YTD Nov-10
94% (Q4 only)
89% (Q4 only)
0.00 98.2% 3 0 Monthly Q4 Sep-1090% 85% 0.33 83.3% 3 1 Monthly YTD Nov-1085% 80% 0.33 82.4% 2 1 Monthly YTD Nov-1085% 80% 0.33 90.6% 3 1 Monthly YTD Nov-10
75% 60% 0.50 84.0% 3 1.5Annual but moving to
quarterly during 2010/11YTD Nov-10
68% 48% 0.50 62.5% 2 1Annual but moving to
quarterly during 2010/11YTD Q1 10-11
98% 95% 1.00 100.0% 3 3 Quarterly YTD Q2 10-1198% 95% 1 100.0% 3 3 Monthly YTD Nov-10
3.5% 5.0% 1 2.00% 3 3 Quarterly Total in periodNov-10
60% 30% 1 81.0% 3 3 Bi-Annual 08/09 Q2 10-11
15.0 37.17 2.48
Fail: 0Underachieve: 2Achieve: 3
2.12.1 and 2.4
Weighting for PF
2 week GP referral to 1st outpatient *
A&E waits
Cancelled ops - breaches of 28 days readmission guarantee as % of cancelled ops
Sum of weights
MRSA
2 week RACP
Thresholds
31 day second or subsequent treatment (drug) *
Proportion of patients waiting no more than 31 days for second or subsequent cancer treatment (radiotherapy treatments) compared to plan.62 day referral to treatment from screening *
Patients that have spent more than 90% of their stay in hospital on a stroke unit
Reperfusion : Thrombolysis^
31 day second or subsequent treatment (surgery) *
Scoring values
62 day referral to treatment from hospital specialist *62 days urgent referral to treatment of all cancers *
Reperfusion : Primary Angioplasty (PPCI)^
48 hours GUM access
Delayed transfers of care
Performance under review if between
C Diff
18 weeks RTT - admitted
18 weeks RTT - non-admitted
Achievement of standards in all specialties
Overall performance score threshold
Monthly data aggregated to quarterly
2 week GP referral to 1st outpatient *- breast symptoms
31 day second or subsequent treatment - radiotherapy
Underperforming if less than
19
Latest 2010-11 Performance Assessment for East Midlands Ambulance Trust
Ambulance TrustsOperational Standards & Targets - Indicators, weighting and scoring
Performance Indicator Achieve Fail Weight10-11 latest Score
Score x Weighting Data frequency Latest data
Latest date
% of Category A calls within 8 minutes 75% 70% 1 74.6% 2 2 Weekly YTD w/c 29/11% of Category A calls within 19 minutes 95% 90% 1 96.5% 3 3 Annual 2009-10 2009-10% of Category B calls within 19 minutes 95% 90% 1 91.3% 2 2 Weekly YTD w/c 29/11
Sum of weights 3 7 2.33
Scoring values Fail: 023
Overall performance score threshold 11 and 2
Thresholds
Underperforming if less thanPerformance under review if between
Underachieve:Achieve:
20
Latest 2010-11 Performance Assessment for Nottinghamshire Healthcare Trust
Mental Health TrustsService Performance
Performance Indicator 10-11 latest Score Latest Data
1. Proportion of adults on Care Programme Approach receiving secondary mental health services in settled accommodation (For 2010/11 the indicator will be data completeness)
83.2% 3 Quarter 2
2. Proportion of adults on Care Programme Approach receiving secondary mental health services in employment (For 2010/11 the indicator will be data completeness)
92.7% 3 Quarter 2
3. The proportion of those patients on Care Programme Approach discharged from inpatient care who are followed up within 7 days
100.0% 3 Quarter 2
4 The proportion of those on Care Programme Approach who have had a HoNOS assessment the last 12 months
71.5% 2 Quarter 2
5. The proportion of users on Care Programme Approach who have had a review in the last 12 months
95.9% 3 Quarter 2
6. Proportion of patients who recorded incidents of physical assault to them1
7. The number of episodes of absence without leave (AWOL) for the number of patients detained under the Mental Health Act 19831
8. The number of new cases of psychosis served by early intervention teams per year against contract plan
114% 3 Quarter 2
9. The number of admissions to the trust's acute wards that were gate kept by the crisis resolution home treatment teams
100% 3 Quarter 2
Quarter 2
Quarter 2
11. The number of admissions to adult facilities of patients who are under 16 years of age 0.0% 3 Quarter 2
12. Delayed transfers of care to be maintained at a minimal level 3.9% 3 Quarter 2
13. Data quality on ethnic group 99.8% 3 Quarter 2
14. Data completeness of the MHMDS that applies to all records in each reporting period: - Date of birth, Patient's current gender, Patient's marital status, Patient's NHS number, Postcode of patient's normal residence, Organisation code of patient's registered General Medical Practice, Organisation code of commissioner.
98.6% 2 Quarter 2
1Indicator to be reviewed after first year of Framework 34*Provisional, rather than final validated, data will be used to meet the production timetable for the NHS Performance Framework
Scoring values 02
Performing: 3
Overall performance score thresholdUnderperforming if
less thanPerformance under
review if between 2.83
Thresholds for data completeness measures :>25% >50% >75% >90%<15% <25% <50% <75%>25% >50% >75% >90%<15% <25% <50% <75%>75% >75% >75% >90%<50% <50% <50% <75%
1.2
1.2 and 1.9
Underperforming:Performance under Review:
VSMR for 2010/11 - MHMDS from 2011/12
SITREPs, KH03 (subject to ROCR approval)
MHMDS*
MHMDS*
Quarterly
Quarterly
Quarterly
7.50%
85%
99% 95%
75%
10%
10. Provision of comprehensive Children & Adolescent Mental Health Services
Thresholds
Data Frequency
Quarterly
Quarterly
Quarterly
Quarterly
Quarterly
Quarterly
Needs to change to quarterly reporting from MHMDS
Quarterly collection.
Omnibus survey for 2010/11 (subject to ROCR approval) -
MHMDS from 2011/12
CQC Periodic Review - MHMDS from 2011/12
CQC Periodic Review
Quarterly collection.
Annual collection.
Annual
MHMDS*
Count me in census 2009
MHMDS*
Data Source
MHMDS*
MHMDS*
Omnibus survey for 2010/11 (subject to ROCR approval) -
MHMDS from 2011/12
MHMDS*
Underperforming
See below
See below
90%
See below
90%
Actual number of incidents of violence to be included but not
scored Actual numbers of episodes of AWOL to be included but
not scored
1+
PerformingUnderperforming
PerformingUnderperforming
PerformingUnderperforming
1. Proportion of adults on Care Programme Approach receiving secondary mental health services in settled accommodation2. Proportion of adults on Care Programme Approach receiving secondary mental health services in employment4. The proportion of users on Care Programme Approach who have had a HoNOS assessment in last 12 months
Performing
See below
See below
95%
See below
95%
Actual number of incidents of violence to be included but not
scored Actual numbers of episodes of AWOL to be included but
not scored
95%
95%
22/24
0
24 3
90%
85%
19/24
21
Latest 2010-11 Performance Assessment for primary care indicatorsPrimary CareOperational Standards & Targets - Indicators, weighting and scoring
Performance Indicator Achieve Fail Weight 10-11 latest ScoreScore x Weighting Data frequency Latest data
GP Patient Access: % GP practices providing extended hours 80% 70% 1 72.6% 2 2 Monthly Dec-10
GP Patient Experience: % of patients satisfied with practice opening hours
Above national average
Below National Average 1 83% (national average 81%) 3 3 Quarterly Oct 09 - Sept 10
GP Patient Experience: % of patients satisifed with telephone access to practice
Above national average
Below National Average 1 70% (national average 69%) 3 3 Quarterly Oct 09 - Sept 10
GP out of hours: % calls answered within target time 95% 90% 1 95.8% 3 3 Annually Aug-10GP out of hours: % of calls clinically assessed on telephone within target times 95% 90% 1 99.3% 3 3 Annually Aug-10
Dentistry: % of dental practices in City accepting new NHS patients
% same or increase
compared to previous quarter
% drop compared
to previous quarter 1 75.0% 0 0 Quarterly Dec-10
Sum of weights 6 14 2.33
Scoring values Fail: 023
Overall performance score threshold 22 and 2.1
Thresholds
Underperforming if less thanPerformance under review if between
Underachieve:Achieve:
22
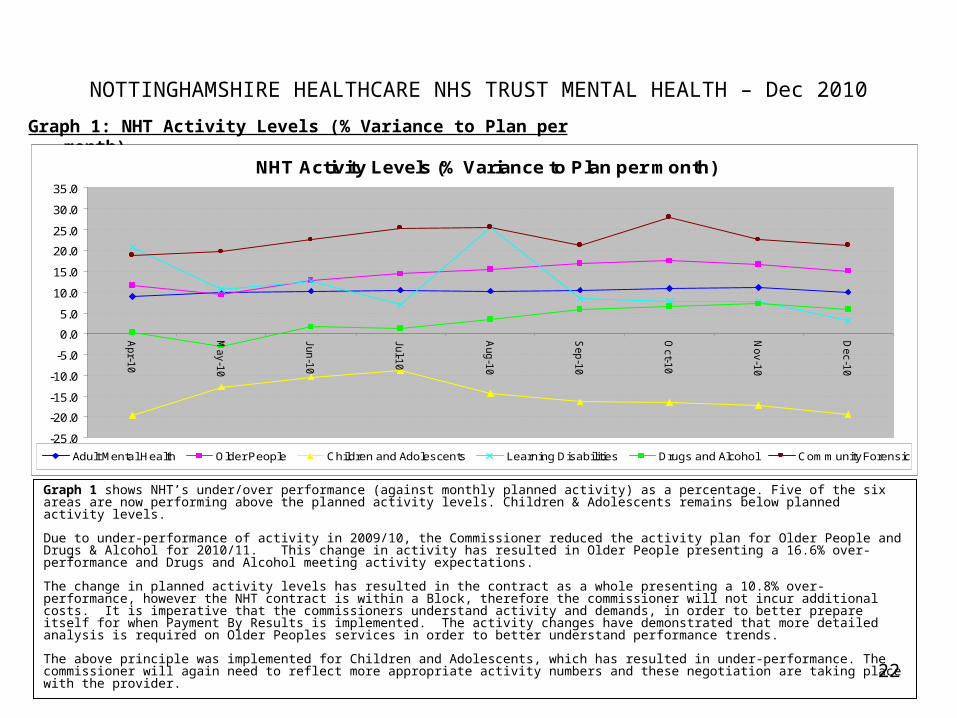
NOTTINGHAMSHIRE HEALTHCARE NHS TRUST MENTAL HEALTH – Dec 2010
Graph 1 shows NHT’s under/over performance (against monthly planned activity) as a percentage. Five of the six areas are now performing above the planned activity levels. Children & Adolescents remains below planned activity levels.
Due to under-performance of activity in 2009/10, the Commissioner reduced the activity plan for Older People and Drugs & Alcohol for 2010/11. This change in activity has resulted in Older People presenting a 16.6% over-performance and Drugs and Alcohol meeting activity expectations.
The change in planned activity levels has resulted in the contract as a whole presenting a 10.8% over-performance, however the NHT contract is within a Block, therefore the commissioner will not incur additional costs. It is imperative that the commissioners understand activity and demands, in order to better prepare itself for when Payment By Results is implemented. The activity changes have demonstrated that more detailed analysis is required on Older Peoples services in order to better understand performance trends.
The above principle was implemented for Children and Adolescents, which has resulted in under-performance. The commissioner will again need to reflect more appropriate activity numbers and these negotiation are taking place with the provider.
Graph 1: NHT Activity Levels (% Variance to Plan per month)
NHT Activity Levels (% Variance to Plan per month)
-25.0
-20.0
-15.0
-10.0
-5.0
0.0
5.0
10.0
15.0
20.0
25.0
30.0
35.0
Apr-1
0
May-1
0
Jun-1
0
Jul-1
0
Aug-1
0
Sep-1
0
Oct-1
0
Nov-1
0
Dec-1
0
Adult Mental Health Older People Children and Adolescents Learning Disabilities Drugs and Alcohol Community Forensic
23
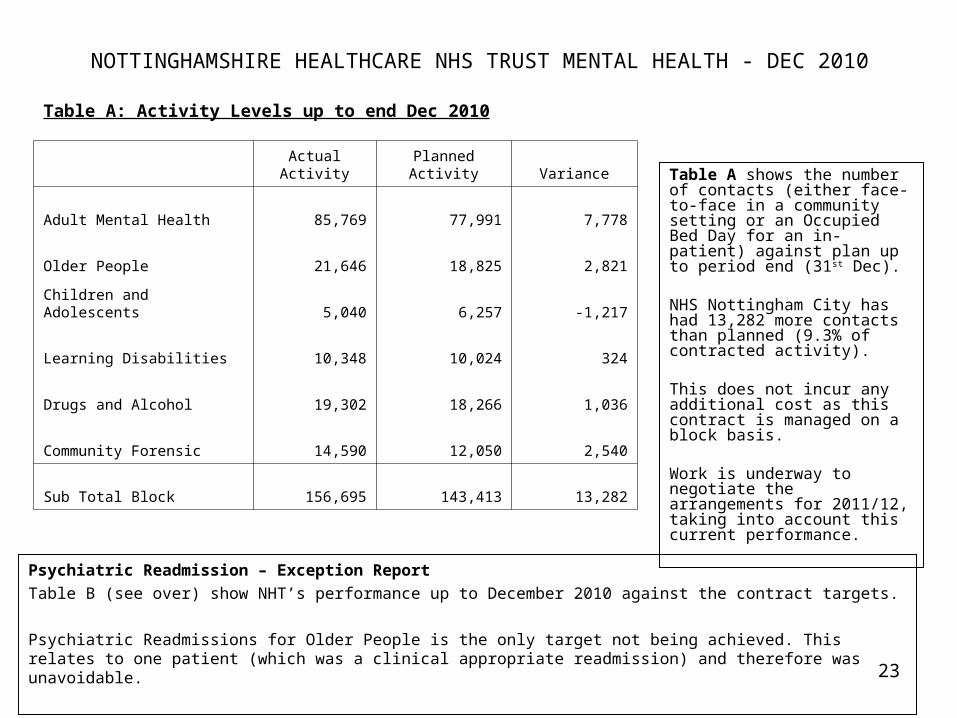
NOTTINGHAMSHIRE HEALTHCARE NHS TRUST MENTAL HEALTH - DEC 2010
Table A: Activity Levels up to end Dec 2010
Table A shows the number of contacts (either face-to-face in a community setting or an Occupied Bed Day for an in-patient) against plan up to period end (31st Dec).
NHS Nottingham City has had 13,282 more contacts than planned (9.3% of contracted activity).
This does not incur any additional cost as this contract is managed on a block basis.
Work is underway to negotiate the arrangements for 2011/12, taking into account this current performance.
Psychiatric Readmission – Exception Report
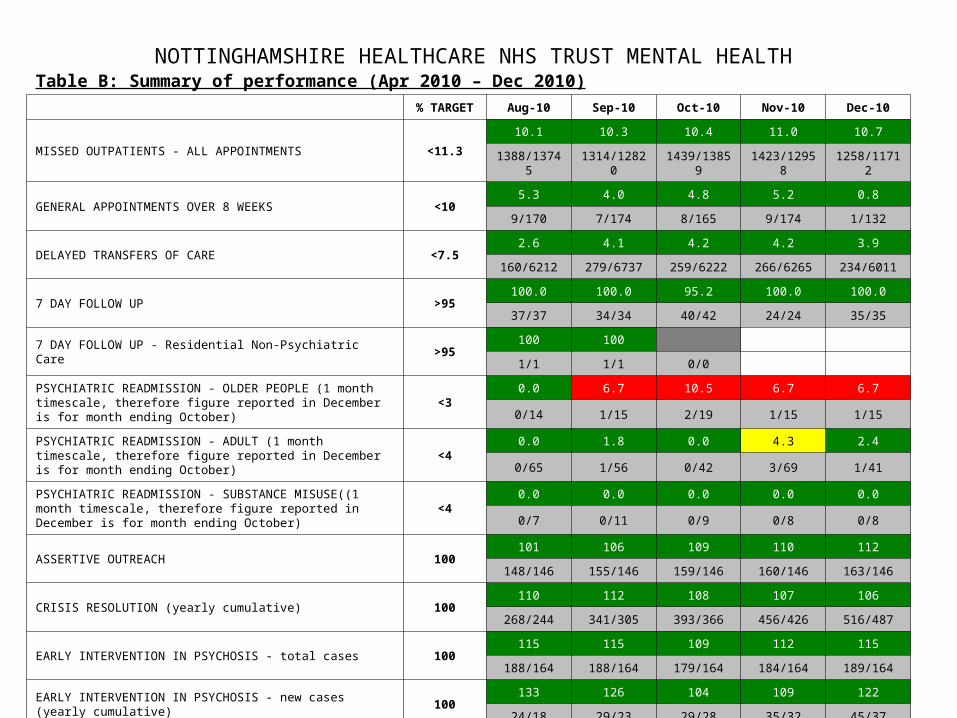
Table B (see over) show NHT’s performance up to December 2010 against the contract targets.
Psychiatric Readmissions for Older People is the only target not being achieved. This relates to one patient (which was a clinical appropriate readmission) and therefore was unavoidable.
Actual Activity Planned Activity Variance
Adult Mental Health 85,769 77,991 7,778
Older People 21,646 18,825 2,821
Children and Adolescents 5,040 6,257 -1,217
Learning Disabilities 10,348 10,024 324
Drugs and Alcohol 19,302 18,266 1,036
Community Forensic 14,590 12,050 2,540
Sub Total Block 156,695 143,413 13,282
24
NOTTINGHAMSHIRE HEALTHCARE NHS TRUST MENTAL HEALTH Table B: Summary of performance (Apr 2010 – Dec 2010)
% TARGET Aug-10 Sep-10 Oct-10 Nov-10 Dec-10
MISSED OUTPATIENTS - ALL APPOINTMENTS <11.310.1 10.3 10.4 11.0 10.7
1388/13745 1314/12820 1439/13859 1423/12958 1258/11712
GENERAL APPOINTMENTS OVER 8 WEEKS <105.3 4.0 4.8 5.2 0.8
9/170 7/174 8/165 9/174 1/132
DELAYED TRANSFERS OF CARE <7.52.6 4.1 4.2 4.2 3.9
160/6212 279/6737 259/6222 266/6265 234/6011
7 DAY FOLLOW UP >95100.0 100.0 95.2 100.0 100.0
37/37 34/34 40/42 24/24 35/35
7 DAY FOLLOW UP - Residential Non-Psychiatric Care >95100 100
1/1 1/1 0/0
PSYCHIATRIC READMISSION - OLDER PEOPLE (1 month timescale, therefore figure reported in December is for month ending October)
<30.0 6.7 10.5 6.7 6.7
0/14 1/15 2/19 1/15 1/15
PSYCHIATRIC READMISSION - ADULT (1 month timescale, therefore figure reported in December is for month ending October)
<40.0 1.8 0.0 4.3 2.4
0/65 1/56 0/42 3/69 1/41
PSYCHIATRIC READMISSION - SUBSTANCE MISUSE((1 month timescale, therefore figure reported in December is for month ending October)
<40.0 0.0 0.0 0.0 0.0
0/7 0/11 0/9 0/8 0/8
ASSERTIVE OUTREACH 100101 106 109 110 112
148/146 155/146 159/146 160/146 163/146
CRISIS RESOLUTION (yearly cumulative) 100110 112 108 107 106
268/244 341/305 393/366 456/426 516/487
EARLY INTERVENTION IN PSYCHOSIS - total cases 100115 115 109 112 115
188/164 188/164 179/164 184/164 189/164
EARLY INTERVENTION IN PSYCHOSIS - new cases (yearly cumulative)
100133 126 104 109 122
24/18 29/23 29/28 35/32 45/37
2525
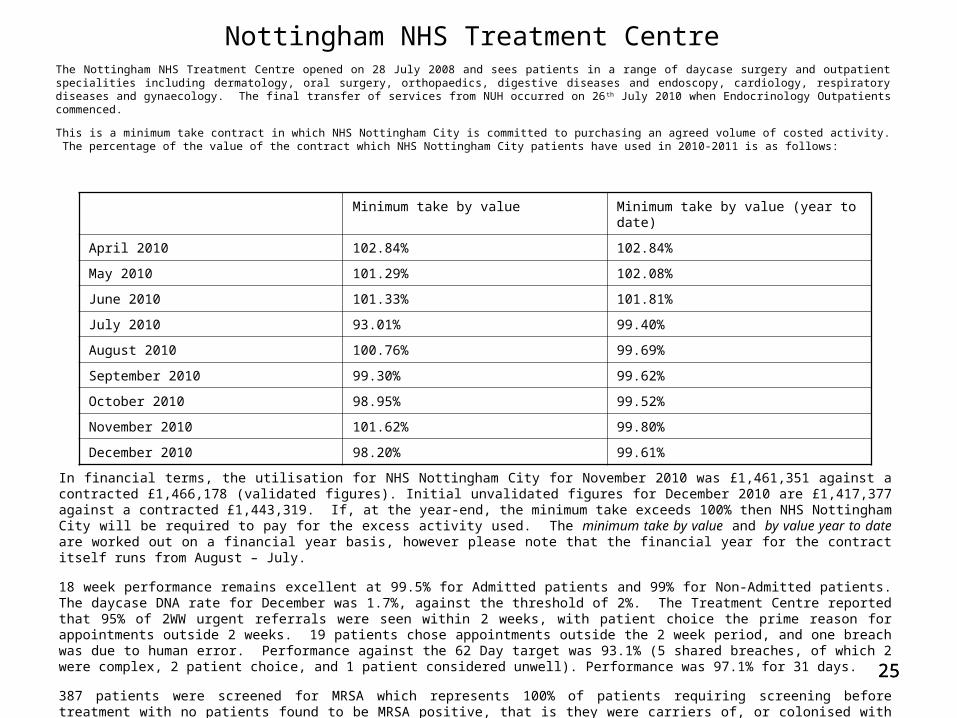
Nottingham NHS Treatment Centre The Nottingham NHS Treatment Centre opened on 28 July 2008 and sees patients in a range of daycase surgery and outpatient specialities including dermatology, oral surgery, orthopaedics, digestive diseases and endoscopy, cardiology, respiratory diseases and gynaecology. The final transfer of services from NUH occurred on 26 th July 2010 when Endocrinology Outpatients commenced.
This is a minimum take contract in which NHS Nottingham City is committed to purchasing an agreed volume of costed activity. The percentage of the value of the contract which NHS Nottingham City patients have used in 2010-2011 is as follows:
In financial terms, the utilisation for NHS Nottingham City for November 2010 was £1,461,351 against a contracted £1,466,178 (validated figures). Initial unvalidated figures for December 2010 are £1,417,377 against a contracted £1,443,319. If, at the year-end, the minimum take exceeds 100% then NHS Nottingham City will be required to pay for the excess activity used. The minimum take by value and by value year to date are worked out on a financial year basis, however please note that the financial year for the contract itself runs from August – July.
18 week performance remains excellent at 99.5% for Admitted patients and 99% for Non-Admitted patients. The daycase DNA rate for December was 1.7%, against the threshold of 2%. The Treatment Centre reported that 95% of 2WW urgent referrals were seen within 2 weeks, with patient choice the prime reason for appointments outside 2 weeks. 19 patients chose appointments outside the 2 week period, and one breach was due to human error. Performance against the 62 Day target was 93.1% (5 shared breaches, of which 2 were complex, 2 patient choice, and 1 patient considered unwell). Performance was 97.1% for 31 days.
387 patients were screened for MRSA which represents 100% of patients requiring screening before treatment with no patients found to be MRSA positive, that is they were carriers of, or colonised with MRSA. There were no patient complaints and 6 patient concerns reported in December. Patient satisfaction overall was at 99% (non-admitted) and 100% (admitted) against the 80% target.
Minimum take by value Minimum take by value (year to date)
April 2010 102.84% 102.84%
May 2010 101.29% 102.08%
June 2010 101.33% 101.81%
July 2010 93.01% 99.40%
August 2010 100.76% 99.69%
September 2010 99.30% 99.62%
October 2010 98.95% 99.52%
November 2010 101.62% 99.80%
December 2010 98.20% 99.61%
26
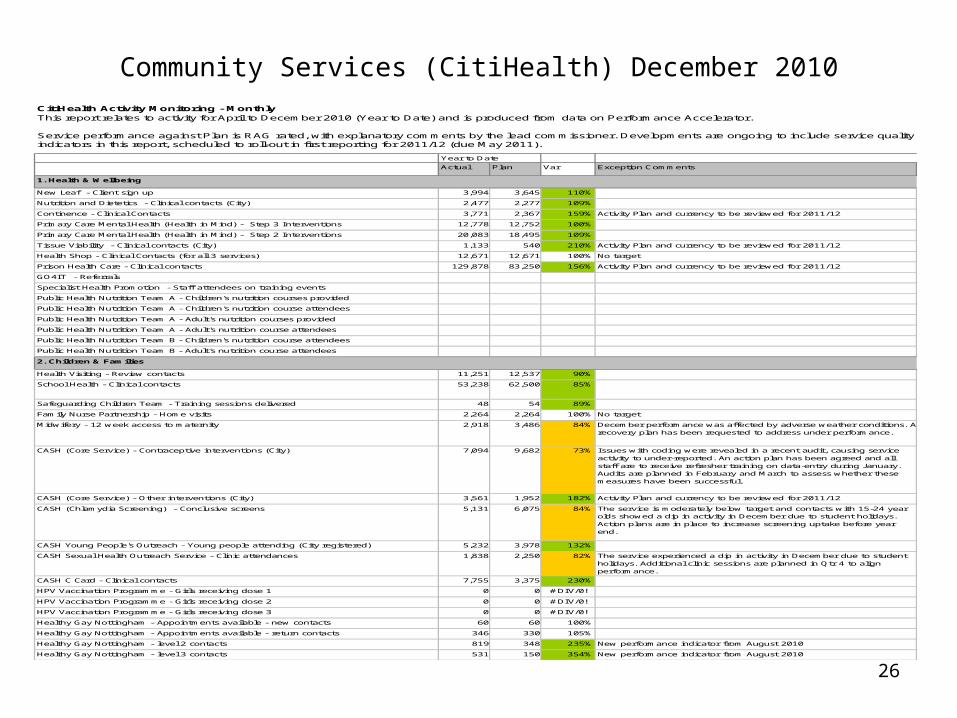
Community Services (CitiHealth) December 2010
Actual Plan Var Exception Comments
New Leaf - Client sign up 3,994 3,645 110%
Nutrition and Dietetics - Clinical contacts (City) 2,477 2,277 109%
Continence - Clinical Contacts 3,771 2,367 159% Activity Plan and currency to be reviewed for 2011/12
Primary Care Mental Health (Health in Mind) - Step 3 Interventions 12,778 12,752 100%
Primary Care Mental Health (Health in Mind) - Step 2 Interventions 20,083 18,495 109%
Tissue Viability - Clinical contacts (City) 1,133 540 210% Activity Plan and currency to be reviewed for 2011/12
Health Shop - Clinical Contacts (for all 3 services) 12,671 12,671 100% No target
Prison Health Care - Clinical contacts 129,878 83,250 156% Activity Plan and currency to be reviewed for 2011/12
GO4IT - Referrals
Specialist Health Promotion - Staff attendees on training events
Public Health Nutrition Team A - Children's nutrition courses provided
Public Health Nutrition Team A - Children's nutrition course attendees
Public Health Nutrition Team A - Adult's nutrition courses provided
Public Health Nutrition Team A - Adult's nutrition course attendees
Public Health Nutrition Team B - Children's nutrition course attendees
Public Health Nutrition Team B - Adult's nutrition course attendees
Health Visiting - Review contacts 11,251 12,537 90%
School Health - Clinical contacts 53,238 62,500 85%
Safeguarding Children Team - Training sessions delivered 48 54 89%
Family Nurse Partnership - Home visits 2,264 2,264 100% No target
Midwifery - 12 week access to maternity 2,918 3,486 84% December performance was affected by adverse weather conditions. A recovery plan has been requested to address under performance.
CASH (Core Service) - Contraceptive interventions (City) 7,094 9,682 73% Issues with coding were revealed in a recent audit, causing service activity to under-reported. An action plan has been agreed and all staff are to receive refresher training on data-entry during January. Audits are planned in February and March to assess whether these measures have been successful.
CASH (Core Service) - Other interventions (City) 3,561 1,952 182% Activity Plan and currency to be reviewed for 2011/12
CASH (Chlamydia Screening) - Conclusive screens 5,131 6,075 84% The service is moderately below target and contacts with 15-24 year olds showed a dip in activity in December due to student holidays. Action plans are in place to increase screening uptake before year end.
CASH Young People's Outreach - Young people attending (City registered) 5,232 3,978 132%
CASH Sexual Health Outreach Service - Clinic attendances 1,838 2,250 82% The service experienced a dip in activity in December due to student holidays. Additional clinic sessions are planned in Qtr 4 to align performance.
CASH C Card - Clinical contacts 7,755 3,375 230%
HPV Vaccination Programme - Girls receiving dose 1 0 0 #DIV/0!
HPV Vaccination Programme - Girls receiving dose 2 0 0 #DIV/0!
HPV Vaccination Programme - Girls receiving dose 3 0 0 #DIV/0!
Healthy Gay Nottingham - Appointments available - new contacts 60 60 100%
Healthy Gay Nottingham - Appointments available - return contacts 346 330 105%
Healthy Gay Nottingham - level 2 contacts 819 348 235% New performance indicator from August 2010
Healthy Gay Nottingham - level 3 contacts 531 150 354% New performance indicator from August 2010
CitiHealth Activity Monitoring - MonthlyThis report relates to activity for April to December 2010 (Year to Date) and is produced from data on Performance Accelerator.
Service performance against Plan is RAG rated, with explanatory comments by the lead commissioner. Developments are ongoing to include service quality indicators in this report, scheduled to roll-out in first reporting for 2011/12 (due May 2011).
Year to Date
1. Health & Wellbeing
2. Children & Families
27
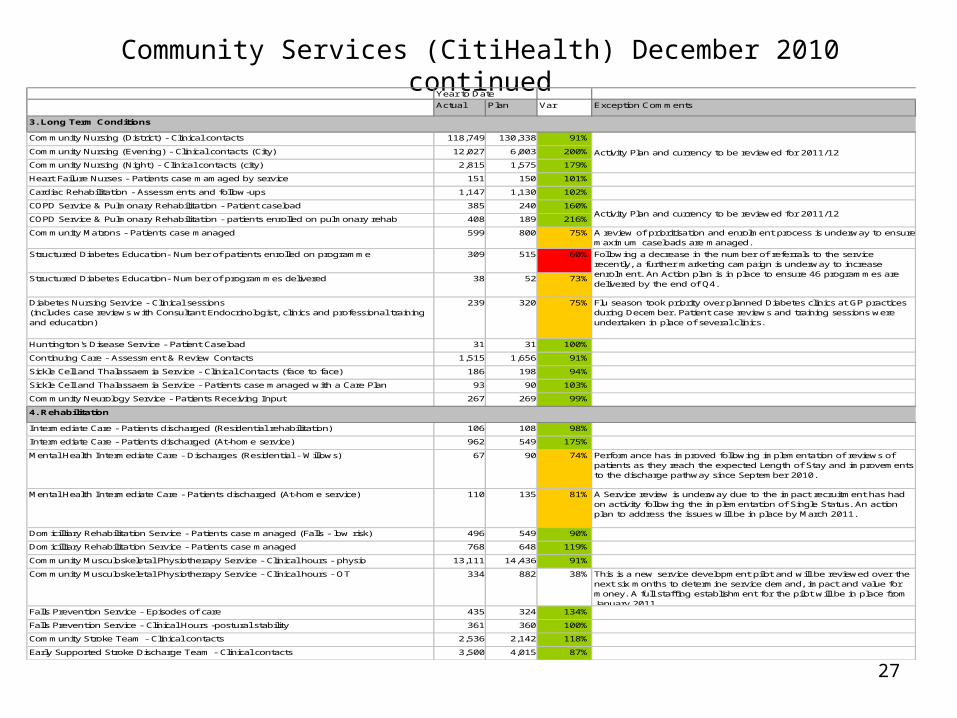
Community Services (CitiHealth) December 2010 continuedActual Plan Var Exception Comments
Community Nursing (District) - Clinical contacts 118,749 130,338 91%
Community Nursing (Evening) - Clinical contacts (City) 12,027 6,003 200%
Community Nursing (Night) - Clinical contacts (city) 2,815 1,575 179%
Heart Failure Nurses - Patients case mamaged by service 151 150 101%
Cardiac Rehabilitation - Assessments and follow-ups 1,147 1,130 102%
COPD Service & Pulmonary Rehabilitation - Patient caseload 385 240 160%
COPD Service & Pulmonary Rehabilitation - patients enrolled on pulmonary rehab programme
408 189 216%
Community Matrons - Patients case managed 599 800 75% A review of prioritisation and enrolment process is underway to ensure maximum caseloads are managed.
Structured Diabetes Education- Number of patients enrolled on programme 309 515 60%
Structured Diabetes Education- Number of programmes delivered 38 52 73%
Diabetes Nursing Service - Clinical sessions (includes case reviews with Consultant Endocrinologist, clinics and professional training and education)
239 320 75% Flu season took priority over planned Diabetes clinics at GP practices during December. Patient case reviews and training sessions were undertaken in place of several clinics.
Huntington's Disease Service - Patient Caseload 31 31 100%
Continuing Care - Assessment & Review Contacts 1,515 1,656 91%
Sickle Cell and Thalassaemia Service - Clinical Contacts (face to face) 186 198 94%
Sickle Cell and Thalassaemia Service - Patients case managed with a Care Plan 93 90 103%
Community Neurology Service - Patients Receiving Input 267 269 99%
Intermediate Care - Patients discharged (Residential rehabilitation) 106 108 98%
Intermediate Care - Patients discharged (At-home service) 962 549 175%
Mental Health Intermediate Care - Discharges (Residential - Willows) 67 90 74% Performance has improved following implementation of reviews of patients as they reach the expected Length of Stay and improvements to the discharge pathway since September 2010.
Mental Health Intermediate Care - Patients discharged (At-home service) 110 135 81% A Service review is underway due to the impact recruitment has had on activity following the implementation of Single Status. An action plan to address the issues will be in place by March 2011.
Domicilliary Rehabilitation Service - Patients case managed (Falls - low risk) 496 549 90%
Domicilliary Rehabilitation Service - Patients case managed 768 648 119%
Community Musculoskeletal Physiotherapy Service - Clinical hours - physio 13,111 14,436 91%
Community Musculoskeletal Physiotherapy Service - Clinical hours - OT 334 882 38% This is a new service development pilot and will be reviewed over the next six months to determine service demand, impact and value for money. A full staffing establishment for the pilot will be in place from January 2011.
Falls Prevention Service - Episodes of care 435 324 134%
Falls Prevention Service - Clinical Hours -postural stability 361 360 100%
Community Stroke Team - Clinical contacts 2,536 2,142 118%
Early Supported Stroke Discharge Team - Clinical contacts 3,500 4,015 87%
Year to Date
3. Long Term Conditions
4. Rehabilitation
Activity Plan and currency to be reviewed for 2011/12
Activity Plan and currency to be reviewed for 2011/12
Following a decrease in the number of referrals to the service recently, a further marketing campaign is underway to increase enrolment. An Action plan is in place to ensure 46 programmes are delivered by the end of Q4.
28
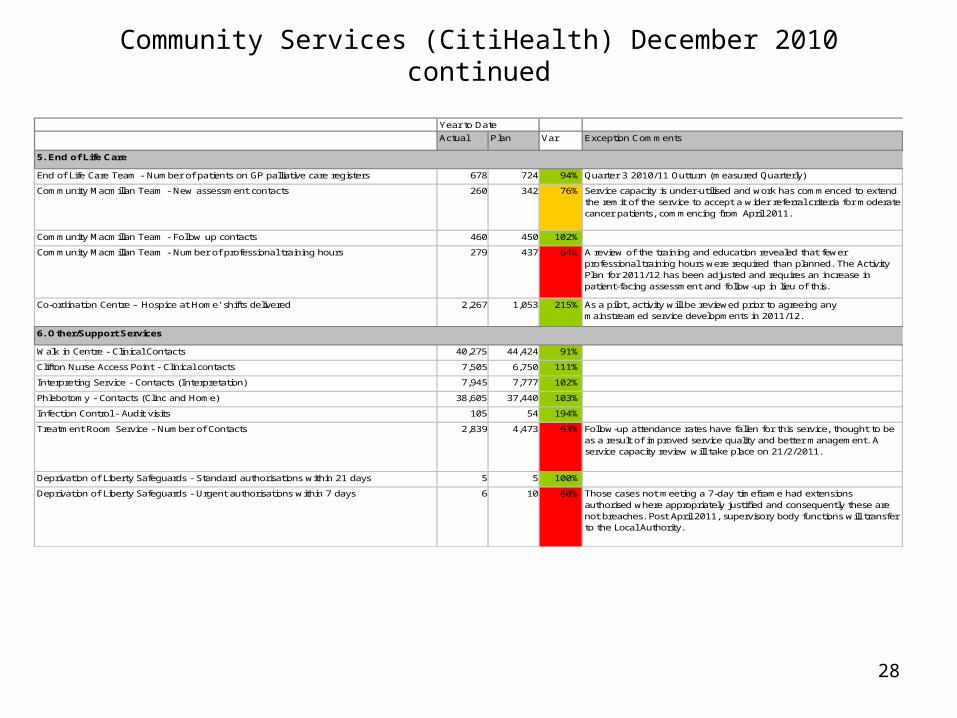
Community Services (CitiHealth) December 2010 continued
Actual Plan Var Exception Comments
End of Life Care Team - Number of patients on GP palliative care registers 678 724 94% Quarter 3 2010/11 Outturn (measured Quarterly)
Community Macmillan Team - New assessment contacts 260 342 76% Service capacity is under-utilised and work has commenced to extend the remit of the service to accept a wider referral criteria for moderate cancer patients, commencing from April 2011.
Community Macmillan Team - Follow up contacts 460 450 102%
Community Macmillan Team - Number of professional training hours 279 437 64% A review of the training and education revealed that fewer professional training hours were required than planned. The Activity Plan for 2011/12 has been adjusted and requires an increase in patient-facing assessment and follow-up in lieu of this.
Co-ordination Centre - 'Hospice at Home' shifts delivered 2,267 1,053 215% As a pilot, activity will be reviewed prior to agreeing any mainstreamed service developments in 2011/12.
Walk in Centre - Clinical Contacts 40,275 44,424 91%
Clifton Nurse Access Point - Clinical contacts 7,505 6,750 111%
Interpreting Service - Contacts (Interpretation) 7,945 7,777 102%
Phlebotomy - Contacts (Clinc and Home) 38,605 37,440 103%
Infection Control - Audit visits 105 54 194%
Treatment Room Service - Number of Contacts 2,839 4,473 63% Follow-up attendance rates have fallen for this service, thought to be as a result of improved service quality and better management. A service capacity review will take place on 21/2/2011.
Deprivation of Liberty Safeguards - Standard authorisations within 21 days 5 5 100%
Deprivation of Liberty Safeguards - Urgent authorisations within 7 days 6 10 60% Those cases not meeting a 7-day timeframe had extensions authorised where appropriately justified and consequently these are not breaches. Post April 2011, supervisory body functions will transfer to the Local Authority.
6. Other/Support Services
5. End of Life Care
Year to Date