Embed Size (px)
Citation preview

Government Expenditures and Revenues
The Role of Government
Taxes – Types and Recent Issues
More Fiscal Policy
Budgets and Fiscal Policy
National Debt

Involves taxes - decrease = more demand
- increase = less demand
Fiscal and Monetary policyBut First…Fiscal policy
Involves spending
- leads to multiplier effect
- target specific areas

Involves interest rates - lower = more demand for money
- increase = less demand for money
Monetary policy
Involves money supply
- more leads to lower interest rates
- like German hyperinflation
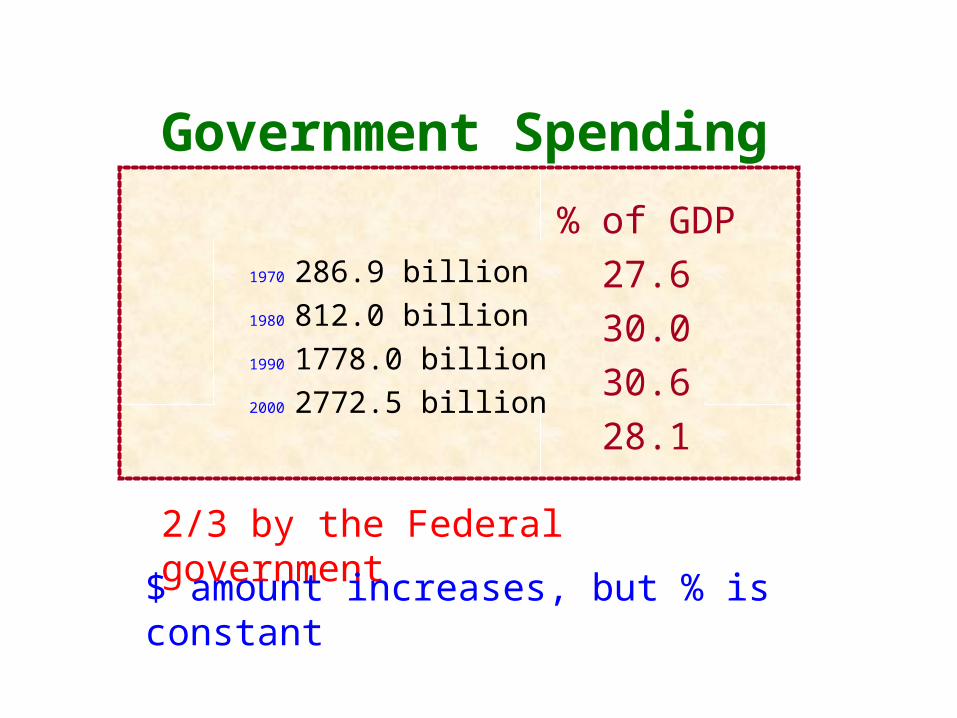
1970 286.9 billion
1980 812.0 billion
1990 1778.0 billion
2000 2772.5 billion
Government Spending
% of GDP
27.6
30.0
30.6
28.1
2/3 by the Federal government
$ amount increases, but % is constant
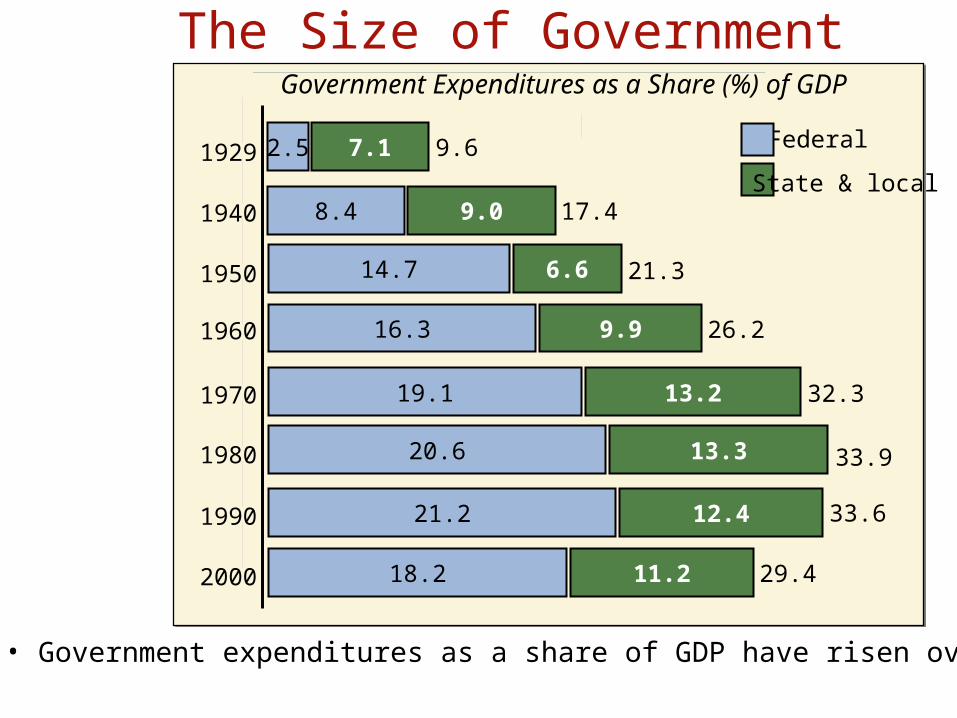
1929
1940
1950
1970
1980
1990
2000
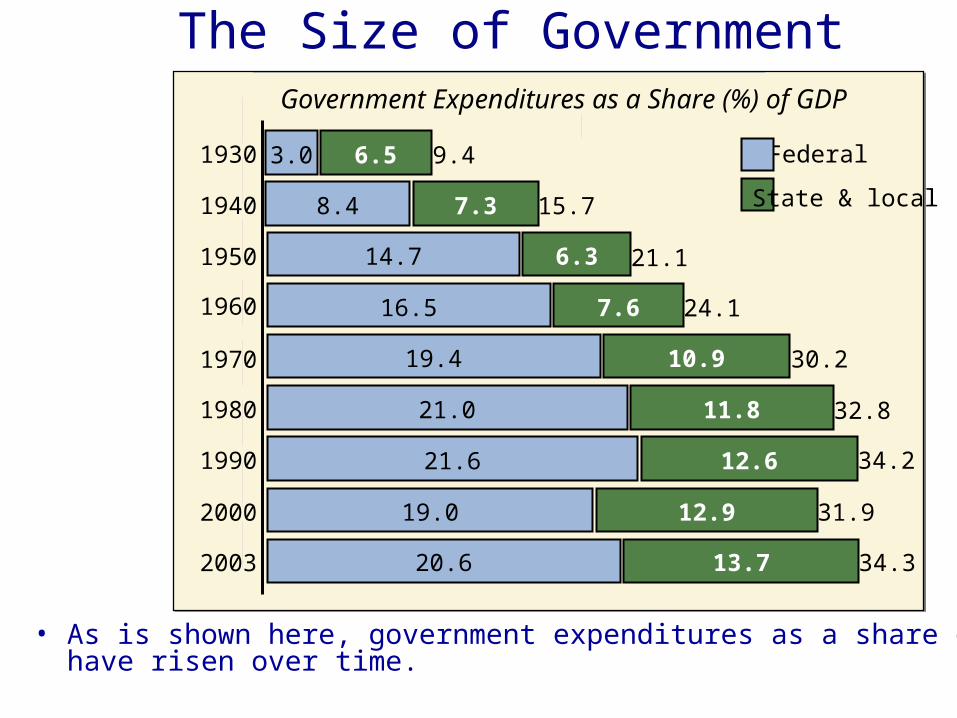
Federal
• Government expenditures as a share of GDP have risen over time.
The Size of Government
State & local
2.5 7.1 9.6
8.4 17.49.0
1960 26.216.3 9.9
32.319.1 13.2
33.920.6 13.3
33.621.2 12.4
29.418.2 11.2
21.314.7 6.6
Government Expenditures as a Share (%) of GDP
Federal
• As is shown here, government expenditures as a share of GDP have risen over time.
The Size of Government
State & local
Government Expenditures as a Share (%) of GDP
1930
1940
1950
1970
1980
1990
2000
3.0 6.5 9.4
8.4 15.77.3
1960 24.116.5 7.6
30.219.4 10.9
32.821.0 11.8
34.221.6 12.6
31.919.0 12.9
21.114.7 6.3
2003 34.320.6 13.7
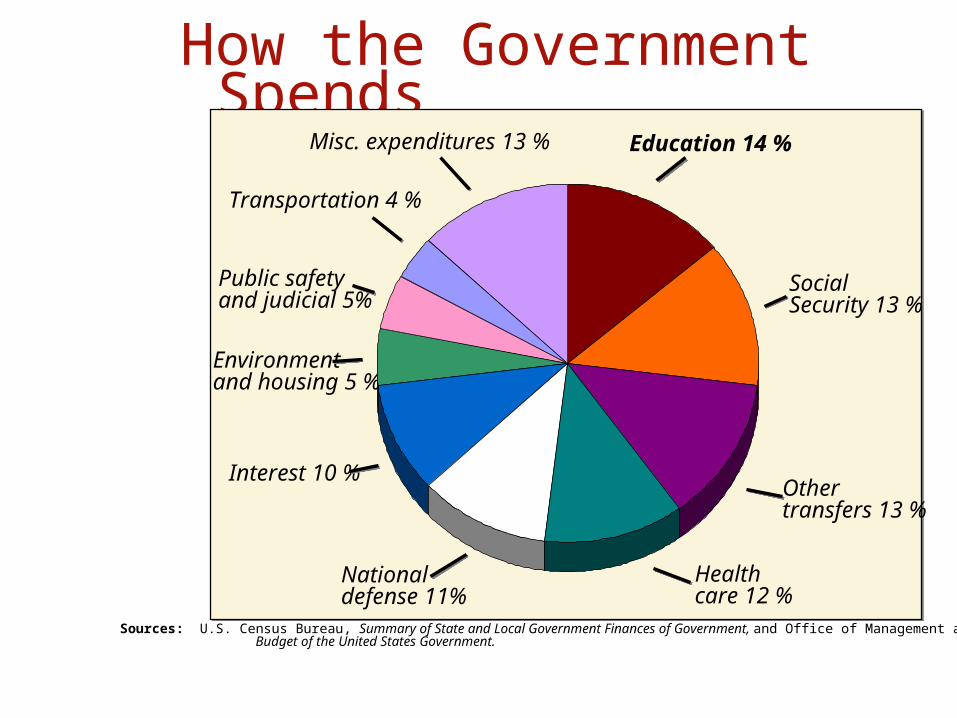
How the Government Spends
Education 14 % Misc. expenditures 13 %
Transportation 4 %
Public safetyand judicial 5%
Environmentand housing 5 %
Interest 10 %
Nationaldefense 11%
SocialSecurity 13 %
Othertransfers 13 %
Healthcare 12 %
Sources: U.S. Census Bureau, Summary of State and Local Government Finances of Government, and Office of Management and Budget, Budget of the United States Government.

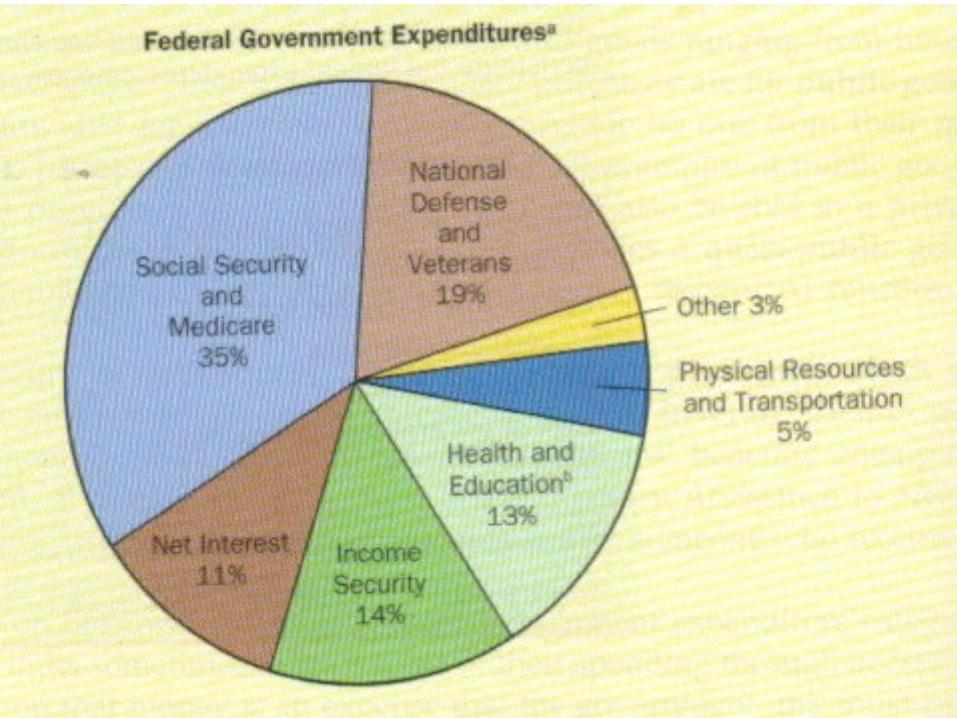
How the Federal Government Spends
Sources: Economic Report of the President, 2004, and Statistical Abstract of the United States, 2003.
• A breakdown of the government expenditures at the federal level in 2003 are listed above.
18.8%
7.1%Transportation
Other
22%
Income Security
Medicare and health
Defense
Net Interest
Social Security
3.1%
11.8%
21.7%
15.5%

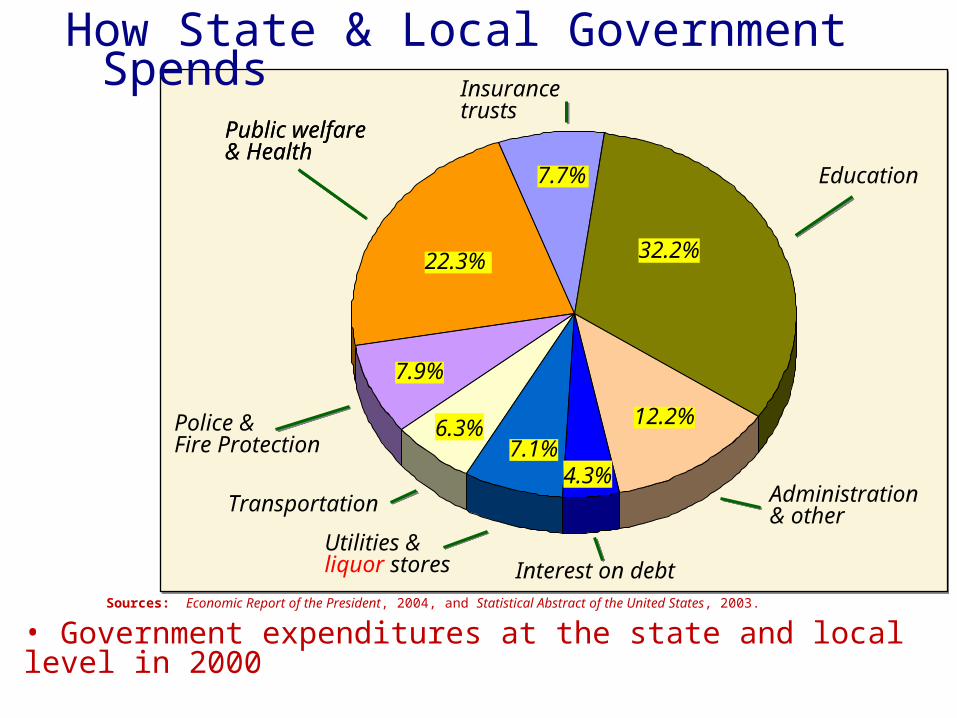
How State & Local Government Spends
• Government expenditures at the state and local level in 2000
Sources: Economic Report of the President, 2004, and Statistical Abstract of the United States, 2003.
Insurance trusts
Public welfare & Health
Police &Fire Protection
Transportation
Utilities &liquor stores
Education
Administration & other
Interest on debt
22.3%
Public welfare & Health
7.7%
32.2%
12.2%
4.3%7.1%
6.3%
7.9%

1. Purchases 27%
Government Spending
a. Public Goods
- people can’t be excluded from using
- can be consumed jointly
- lighthouses, national defense
b. Quasi-Public Goods
- not produced in enough quantity
- police protection, parks, fire departments

• Examples of public goods: • national defense
• radio and television broadcast signals
• clean air.

1. Which of the following are public goods? (using the definition of a public good.)
a. An anti-missile system surrounding Washington.
b. A fire department.
c. Tennis courts.
d. Shenandoah National Park.
e. Elementary schools
a. An anti-missile system surrounding Washington.

2. Transfer payments 43%
- Social Security -Unemployment -Veterans benefits
3. Money to State and Local 13% Governments
4. Interest payments on 14% borrowed money (bonds)
5. Government enterprises 3%

Sources of Government Revenuesat the federal, state, and local level, are listed below.
Misc. revenue 12 %
Individualincometaxes 14 %
Corporate incometaxes 12 %
Propertytaxes 8 %
Salestaxes 11 %
Usercharges 14 %
Payrolltaxes 14 %
Sources: U.S. Census Bureau, Summary of State and Local Government Finances of Government, and Office of Management and Budget, Budget of the United States Government.
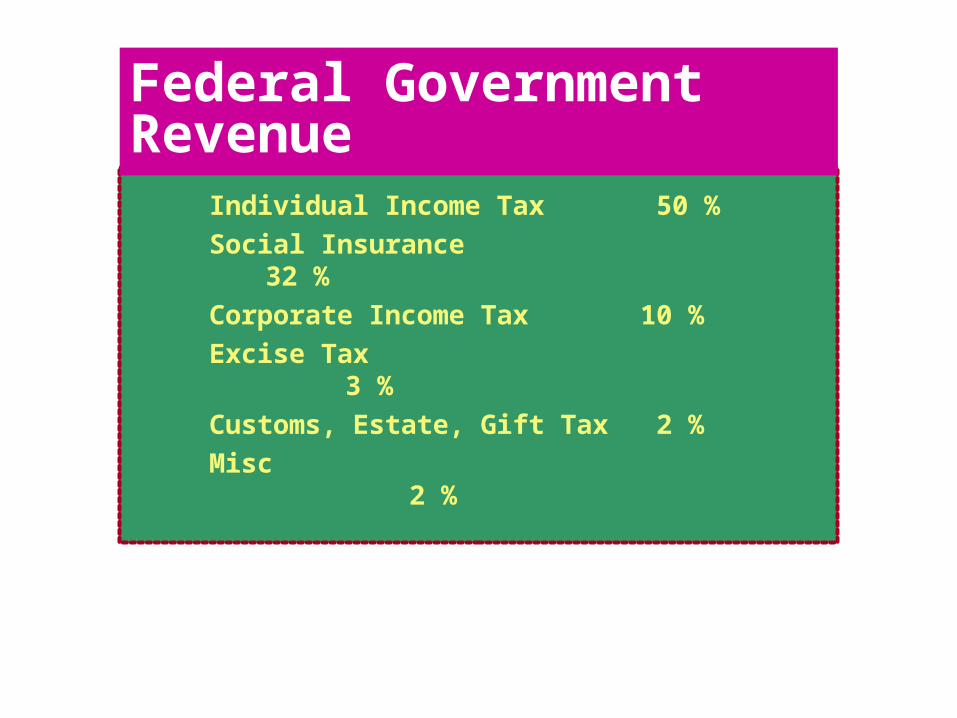
Individual Income Tax 50 %
Social Insurance 32 %
Corporate Income Tax 10 %
Excise Tax 3 %
Customs, Estate, Gift Tax 2 %
Misc 2 %
Federal Government Revenue

1997 1994
Federal taxes: State & local taxes:
How Government Taxes:
Taxes vary by stateCorporate
income 12%
Excise taxes 4%
Customs duties 1%
Corporate income 2%
Other 4%
Other 3%
Property 15%
Payroll 12%
Personal income
10%
User charges a
24%
Sales and excise
17%From federal
government 16%
Payroll 34%
Personal income
46%
FL. MI, NH, DE (?) – no Income Tax
NH motto: Live free or die...
but they have a tax on parachute jumps
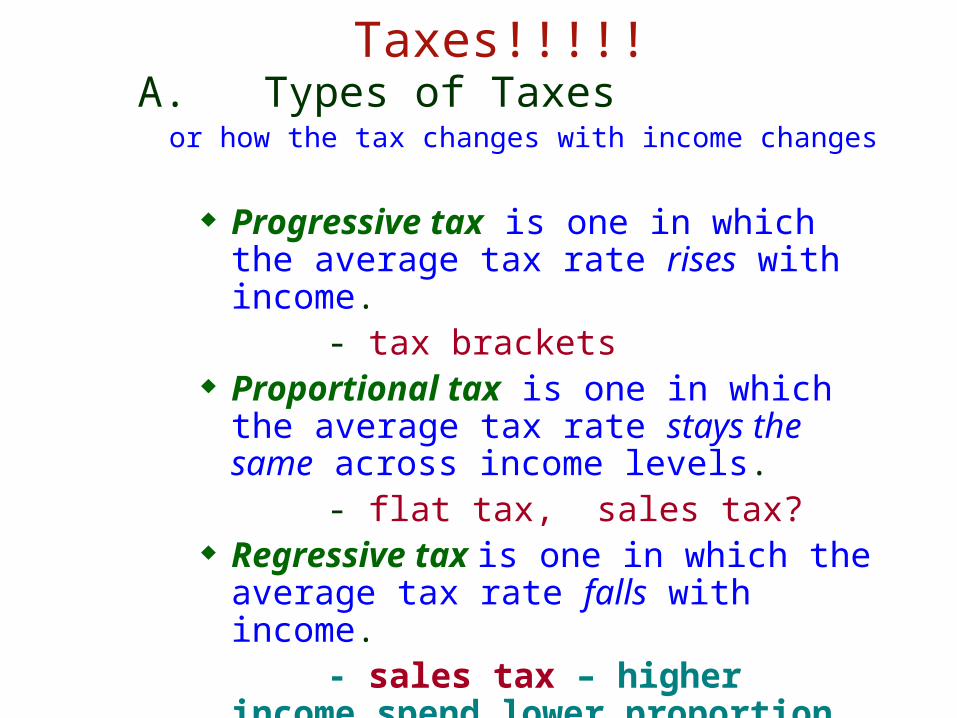
A. Types of Taxes or how the tax changes with income changes
Progressive tax is one in which the average tax rate rises with income.
- tax brackets Proportional tax is one in which the average
tax rate stays the same across income levels. - flat tax, sales tax? Regressive tax is one in which the average tax
rate falls with income. - sales tax – higher income
spend lower proportion on taxable goods
Taxes!!!!!

A sales tax of 7 % on medicine A state income tax with 3 tax brackets A property tax of $2.85 per $100 of
assessed property value A tax of $8 on room occupancy in all city
hotels A tax of 3 % on all wages earned in the city A sales tax of 5% on utilities A federal tax of $2 per pack of cigarettes.

1 side: keep taxes to provide more armed forces, police patrols,…
B. Tax Reform
1 side: reduce taxes, encourage business investments
1. Arguments
1981: Economic Recovery Act – adjusted income for inflation
1986: Tax Reform Act- lowered max tax from 50% to 39.1
2. 1980s Tax Reforms
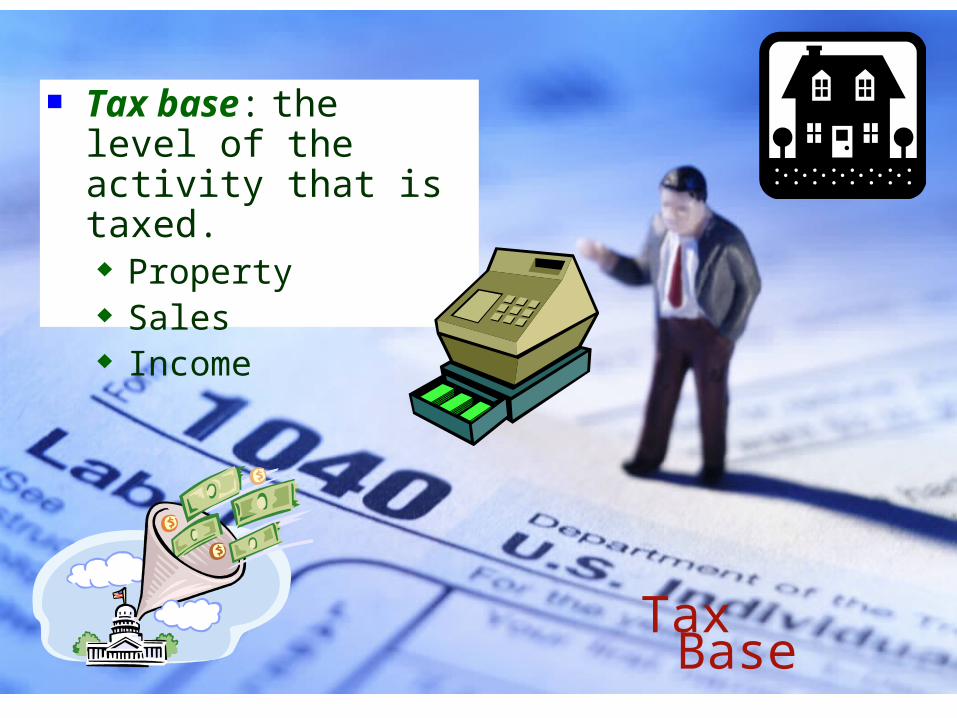
Tax base: the level of the activity that is taxed. Property Sales Income
Tax Base

Tax rate:the rate (%) at which an activity is taxed.
Tax Rate
declining/eroding tax base:people are moving from urban to rural or suburbs.
abatement:tax incentives to lure businesses (lower rates).
Tax rate/base issues:

Speed things up: - increase government purchases
- increase transfers
- decrease taxes
To review…Fiscal policy
Slow things down
- decrease government purchases
- decrease transfers
- increase taxes

Discretionary: adjustments in spending levels or tax rates
- actions by President or Congress
Types ofFiscal policy
Automatic
- rates are set
- increased consumer spending increases revenues
- decreased consumer spending reduces revenues
Automatically

Types of budgets: 1. Balanced: Expenditures = Revenues
2. Surplus: Expenditures < Revenues
3. Deficit: Expenditures > Revenues
Spending Plan – formal or informal
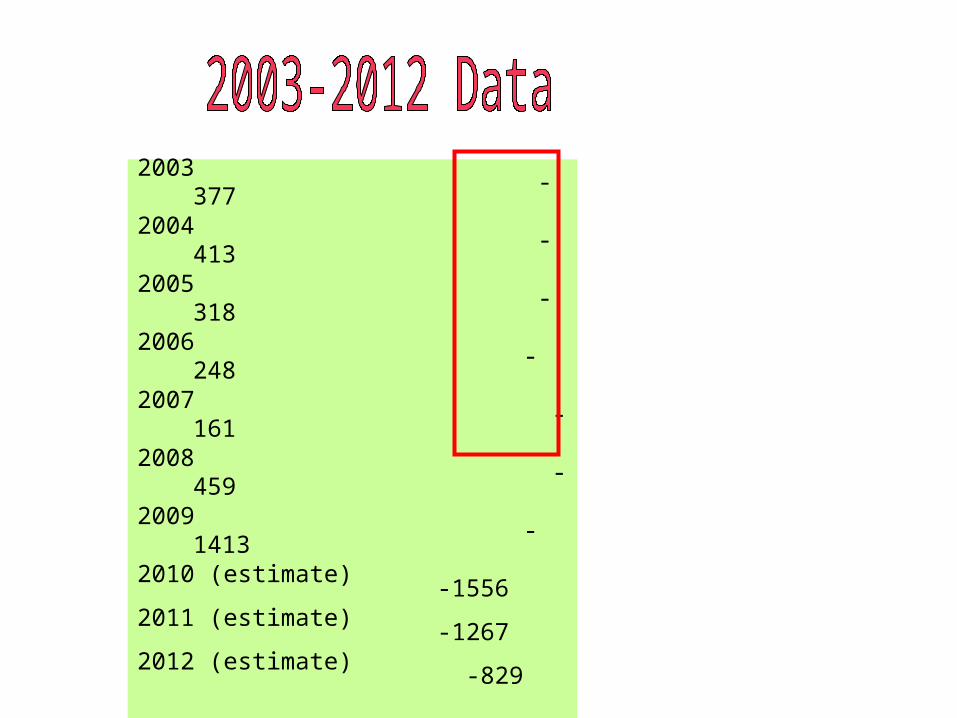
2003 -3772004 -4132005 -3182006 -2482007 -1612008 -4592009 -14132010 (estimate) -15562011 (estimate) -12672012 (estimate) -829

Gramm-Rudman-Hollins Act (1986?)- show plan for balanced spending, but…
Concern over the Deficits
Budget Enforcement Act (1990)- to increase spending, cut something else
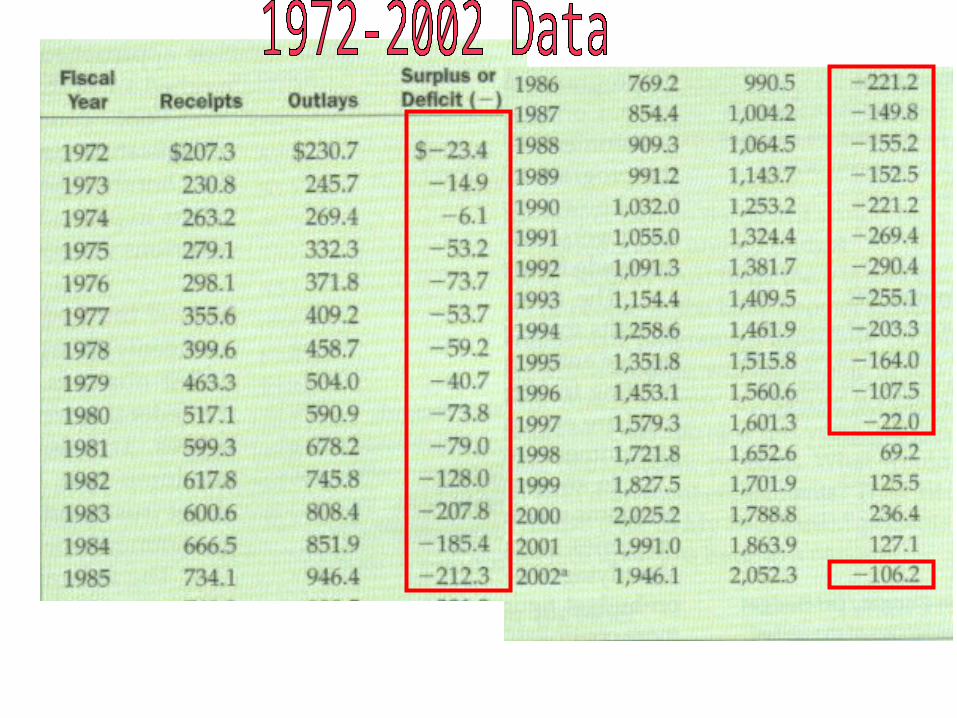
Deficits total $5.629 trillion in 2000

Borrow at lowest interest rate US Treasury securities:
(type depends on length) 1. US Treasury Bill: 1 year or less
2. US Treasury Note: 1 to 10 years
3. US Treasury Bond: over 10 years
Sum of all surpluses and deficitsFinancing the Debt
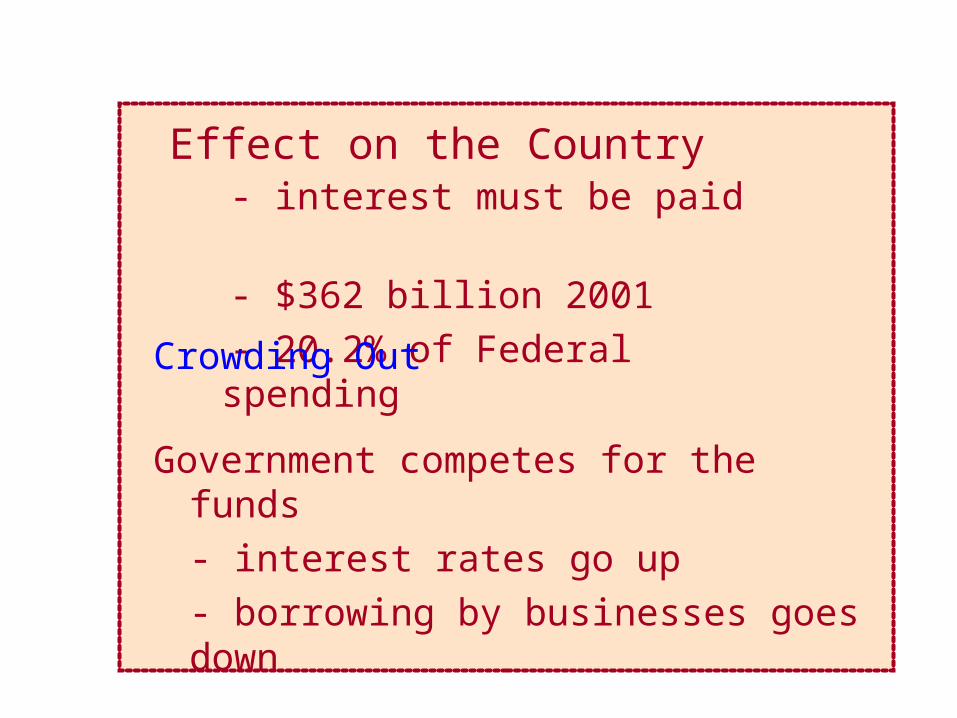
Effect on the Country - interest must be paid - $362 billion 2001 - 20.2% of Federal spending
Crowding Out
Government competes for the funds- interest rates go up- borrowing by businesses goes down

Chapter 6 Questions
1. Which of the following statements about public goods is FALSE? a. A person must pay to use a public good.
b. A lighthouse is an example of a public good c. No one can be excluded from using a public good. d. Public goods are provided for all members of society.
2. The primary source of revenue for the federal government is: a. excise taxes.
b. corporate income taxes. c. individual income taxes d. tax receipts from state and local governments.
3. The federal personal income tax is generally regarded as a: a. flat tax. b. regressive tax.
c. progressive tax d. proportional tax.
• If the economy were experiencing a high rate of unemployment, an appropriate corrective measure by the federal government would be to reduce: a. transfer payments.
b. personal income taxes c. purchases of military equipment. d. the number and amount of bribes Congressmen can accept.
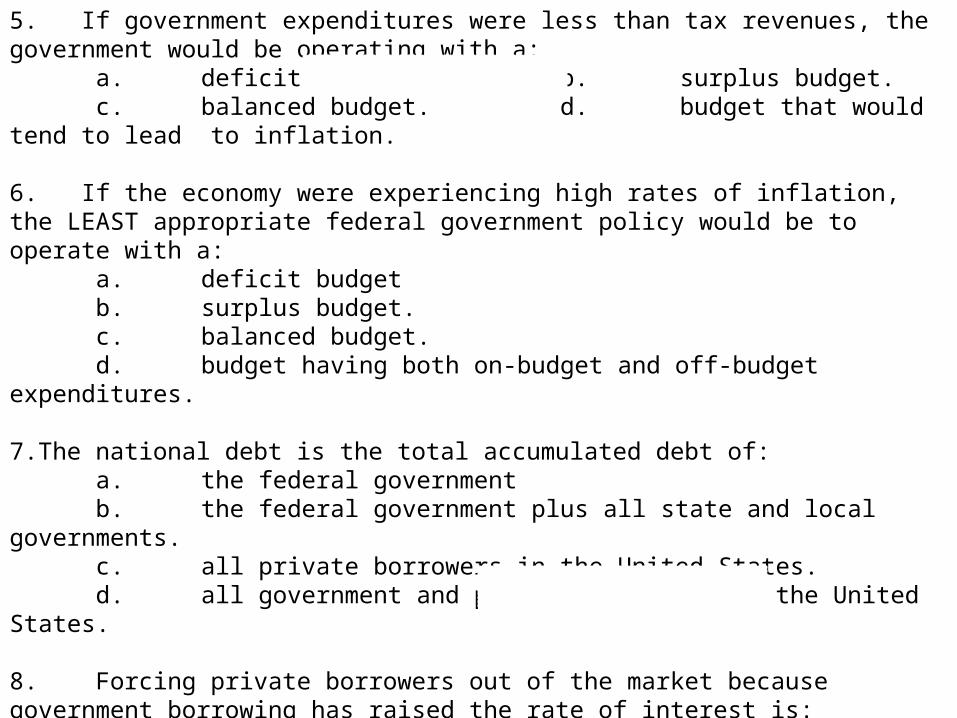
5. If government expenditures were less than tax revenues, the government would be operating with a: a. deficit budget b. surplus budget. c. balanced budget. d. budget that would tend to lead to inflation.
6. If the economy were experiencing high rates of inflation, the LEAST appropriate federal government policy would be to operate with a: a. deficit budget b. surplus budget. c. balanced budget. d. budget having both on-budget and off-budget expenditures.
7.The national debt is the total accumulated debt of: a. the federal government b. the federal government plus all state and local governments. c. all private borrowers in the United States. d. all government and private borrowers in the United States.
8. Forcing private borrowers out of the market because government borrowing has raised the rate of interest is: a. crowding out b. interest rate shock. c. the demand shift effect. d. government foreclosure.