Embed Size (px)
Citation preview
NGFA – PFI Feed and Pet
Food Joint Conference
A Pork Producers View of the
Industry
September 26, 2013
Howard Hill, DVM, PHD
President Elect – National Pork
Producers Council
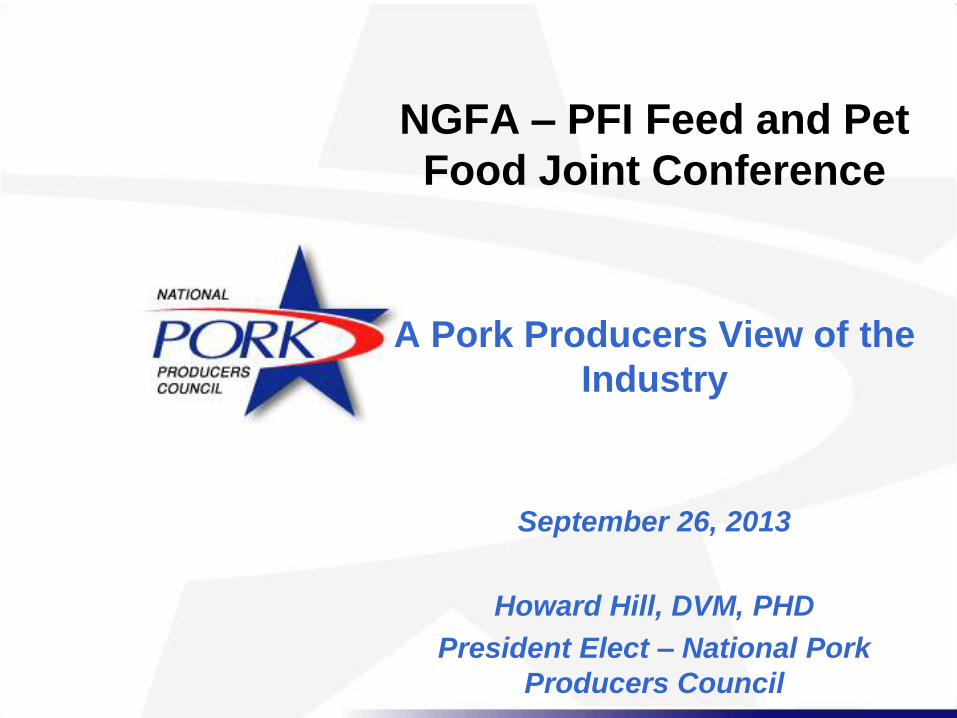
• Macro-economic trends in the pork industry
• PED - where did it come from, impact on supply
• Feed safety – what do pork producers expect from their nutritional suppliers?
• Third party certification – are they needed, are they expected?
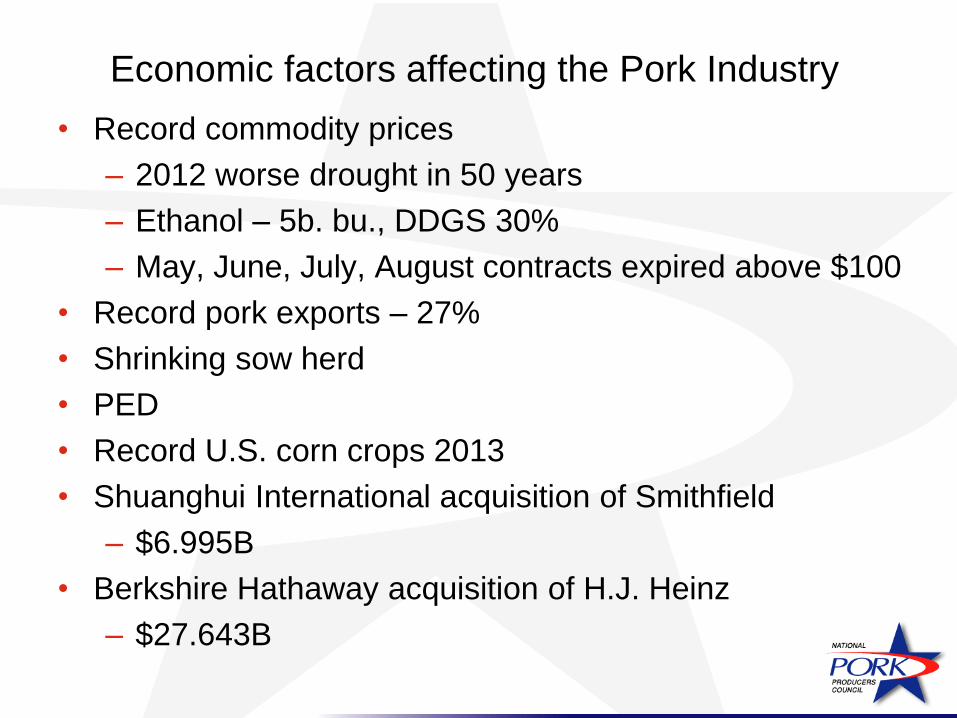
Economic factors affecting the Pork Industry
• Record commodity prices
– 2012 worse drought in 50 years
– Ethanol – 5b. bu., DDGS 30%
– May, June, July, August contracts expired above $100
• Record pork exports – 27%
• Shrinking sow herd
• PED
• Record U.S. corn crops 2013
• Shuanghui International acquisition of Smithfield
– $6.995B
• Berkshire Hathaway acquisition of H.J. Heinz
– $27.643B
+2983
4000
5000
6000
7000
8000
9000
10000
11000
12000
13000
14000
15000
84 85 86 87 88 89 90 91 92 93 94 95 96 97 98 99 00 01 02 03 04 05 06 07 08 09 10 11 12 13
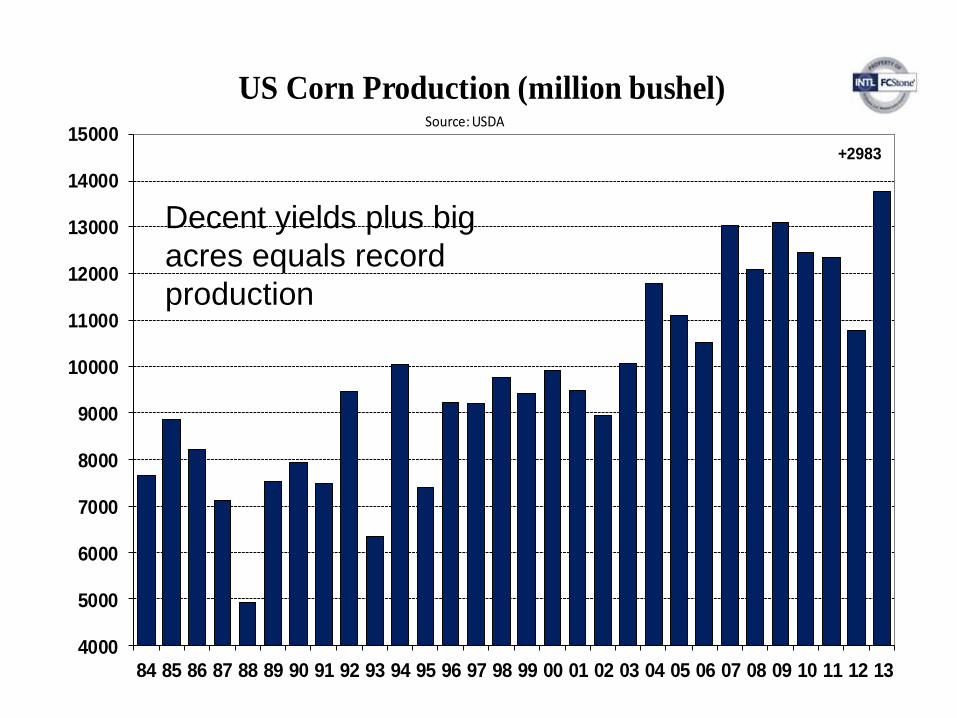
US Corn Production (million bushel)Source: USDA
Decent yields plus big
acres equals record
production
-135
0
20
40
60
80
100
120
140
160
180
84 85 86 87 88 89 90 91 92 93 94 95 96 97 98 99 00 01 02 03 04 05 06 07 08 09 10 11 12 13
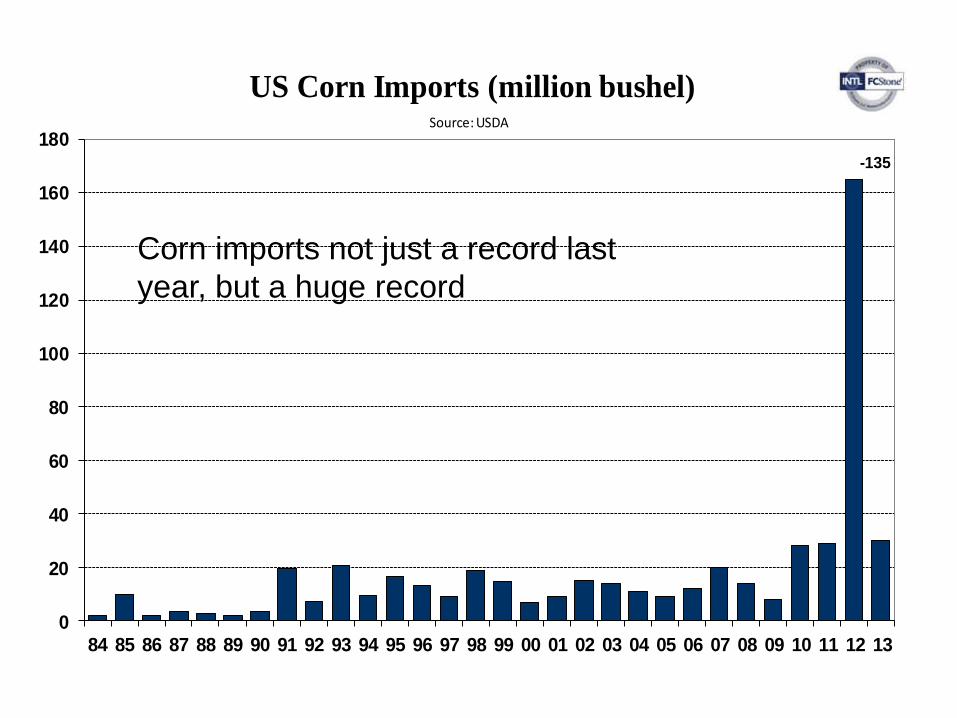
US Corn Imports (million bushel)Source: USDA
Corn imports not just a record last
year, but a huge record
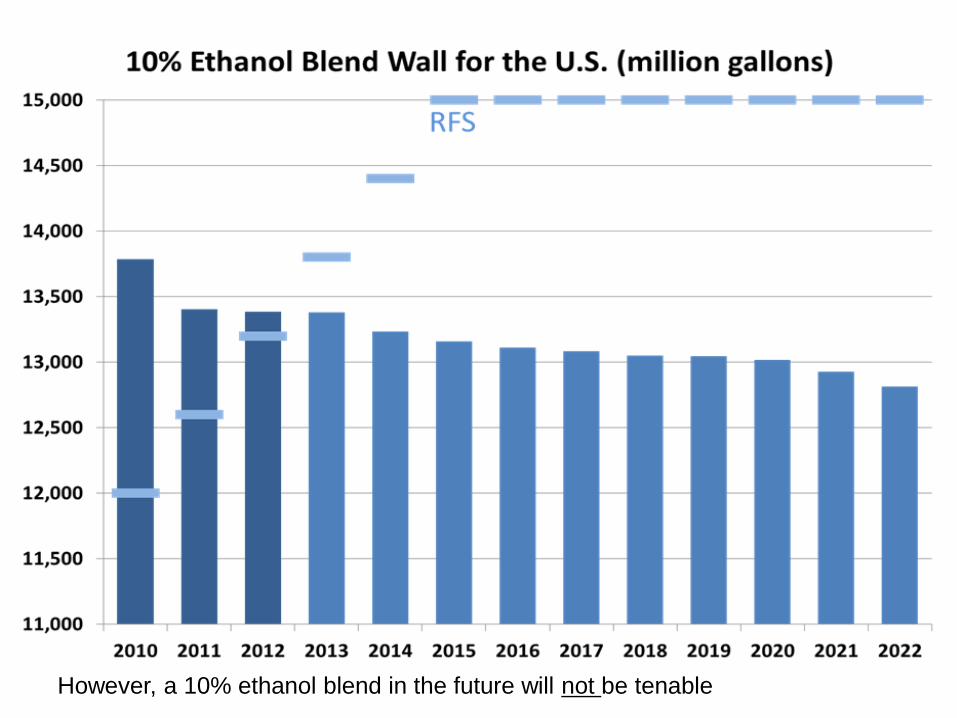
However, a 10% ethanol blend in the future will not be tenable
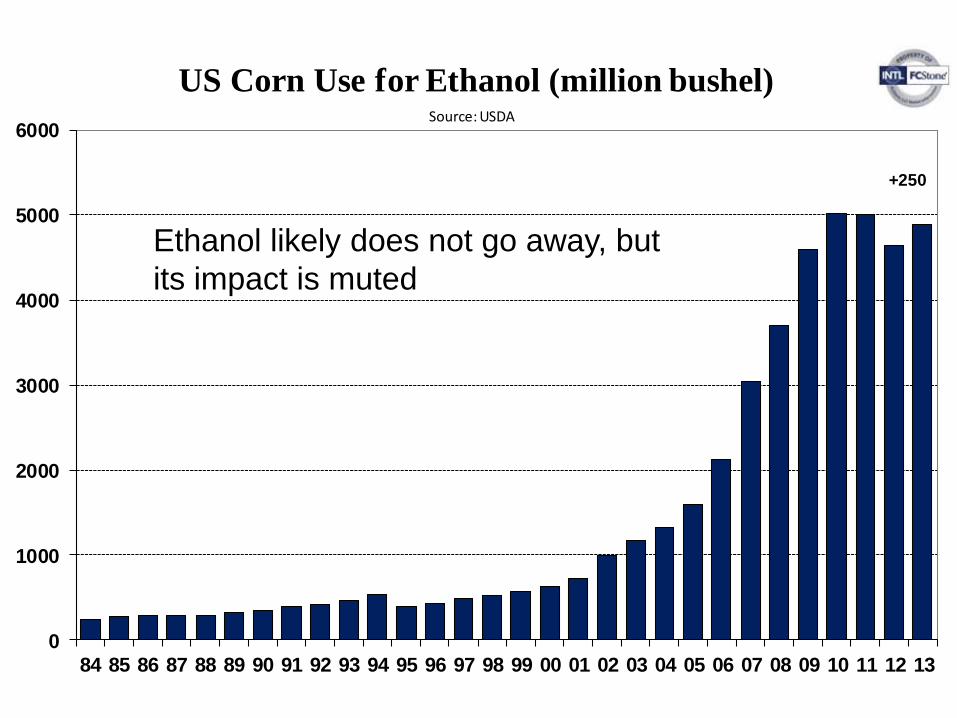
+250
0
1000
2000
3000
4000
5000
6000
84 85 86 87 88 89 90 91 92 93 94 95 96 97 98 99 00 01 02 03 04 05 06 07 08 09 10 11 12 13
US Corn Use for Ethanol (million bushel)Source: USDA
Ethanol likely does not go away, but
its impact is muted
What if China
responds in corn or
pork as they did with
soybean imports in
the mid 90’s?
0.00
2.00
4.00
6.00
8.00
10.00
12.00
14.00
16.00
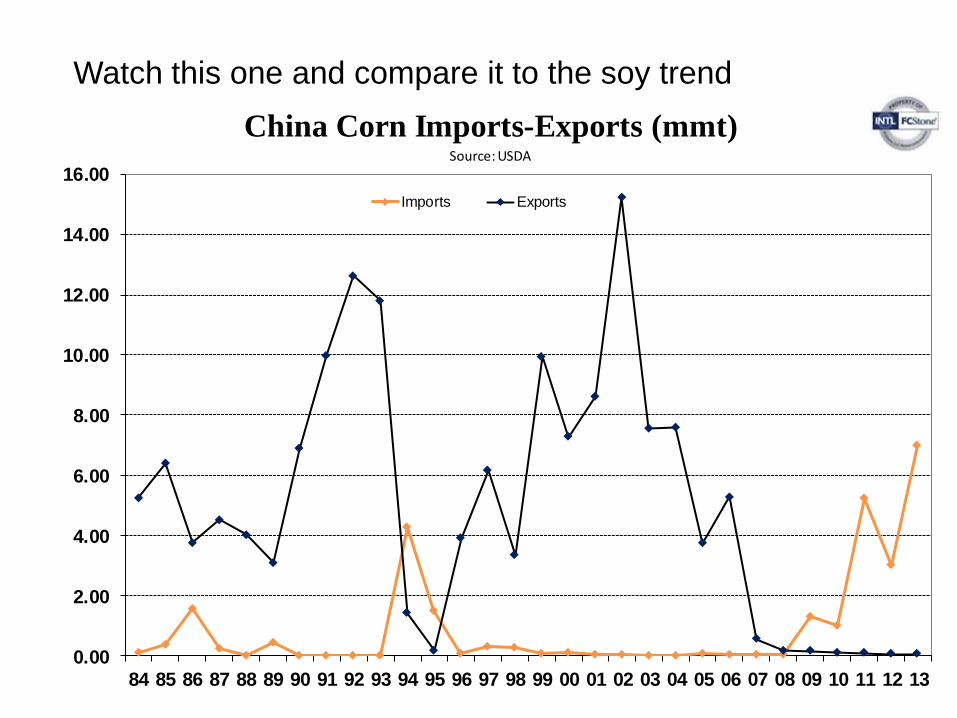
84 85 86 87 88 89 90 91 92 93 94 95 96 97 98 99 00 01 02 03 04 05 06 07 08 09 10 11 12 13
China Corn Imports-Exports (mmt)
Imports Exports
Source: USDA
Watch this one and compare it to the soy trend
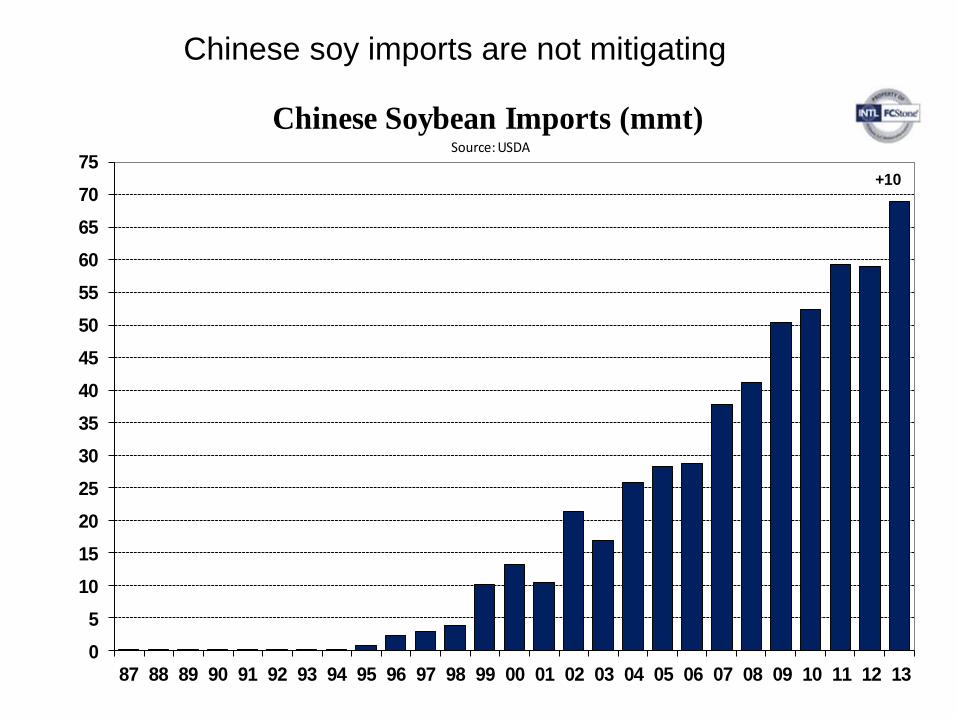
+10
0
5
10
15
20
25
30
35
40
45
50
55
60
65
70
75
87 88 89 90 91 92 93 94 95 96 97 98 99 00 01 02 03 04 05 06 07 08 09 10 11 12 13
Chinese Soybean Imports (mmt)Source: USDA
Chinese soy imports are not mitigating
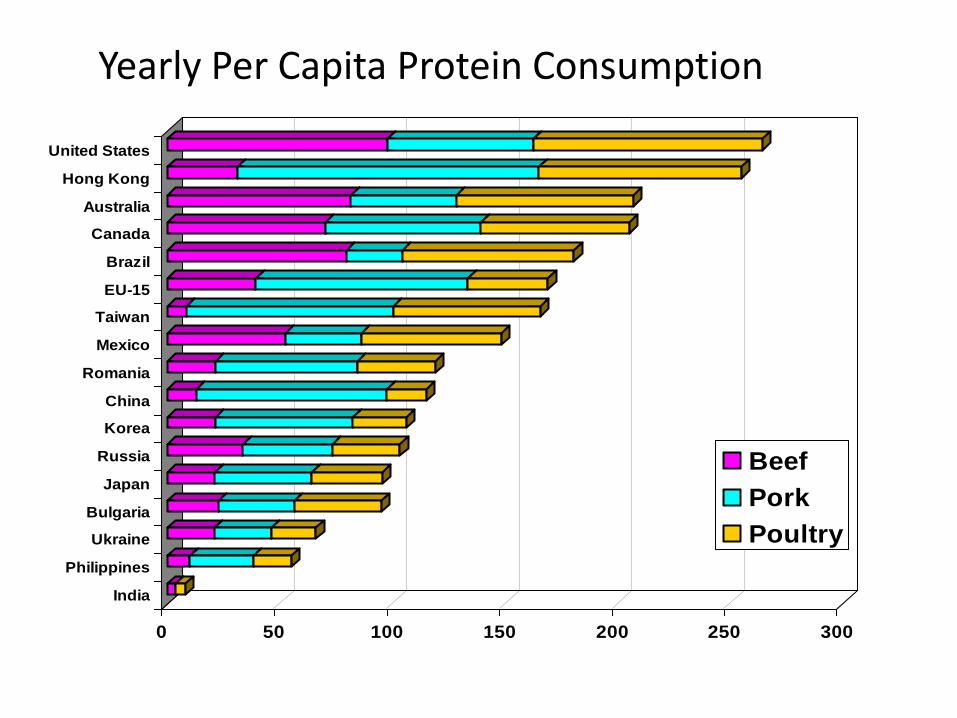
Yearly Per Capita Protein Consumption
0 50 100 150 200 250 300
United States
Hong Kong
Australia
Canada
Brazil
EU-15
Taiwan
Mexico
Romania
China
Korea
Russia
Japan
Bulgaria
Ukraine
Philippines
India
Beef
Pork
Poultry
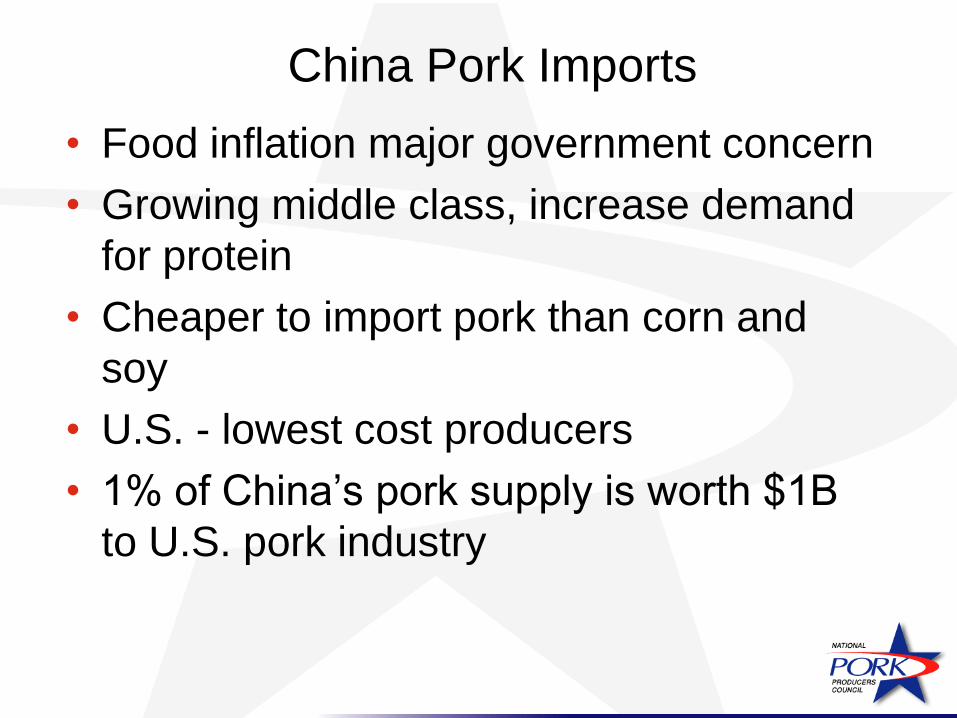
China Pork Imports
• Food inflation major government concern
• Growing middle class, increase demand
for protein
• Cheaper to import pork than corn and
soy
• U.S. - lowest cost producers
• 1% of China’s pork supply is worth $1B
to U.S. pork industry
From information, knowledge
Paragon Economics, Inc.
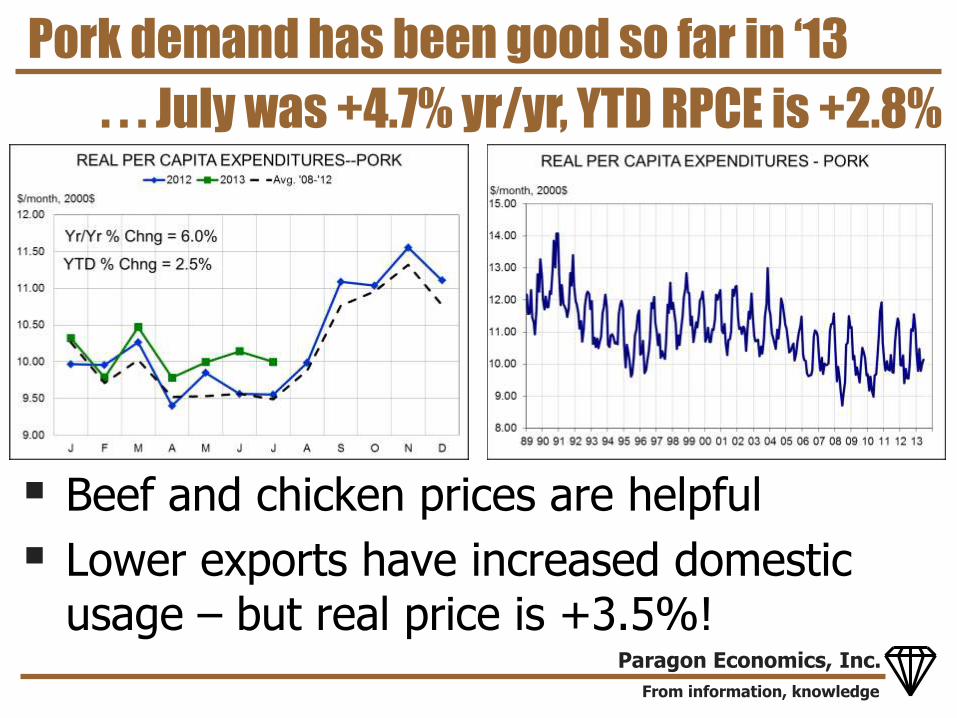
Pork demand has been good so far in ‘13
Beef and chicken prices are helpful
Lower exports have increased domestic usage – but real price is +3.5%!
. . . July was +4.7% yr/yr, YTD RPCE is +2.8%
From information, knowledge
Paragon Economics, Inc.
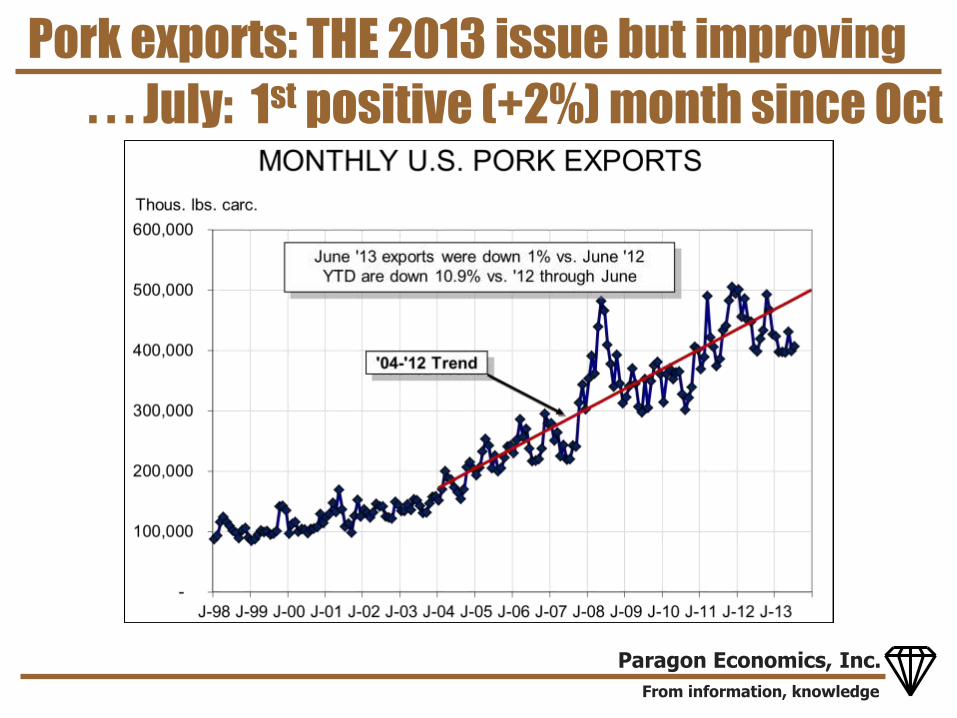
Pork exports: THE 2013 issue but improving
. . . July: 1st positive (+2%) month since Oct
From information, knowledge
Paragon Economics, Inc.
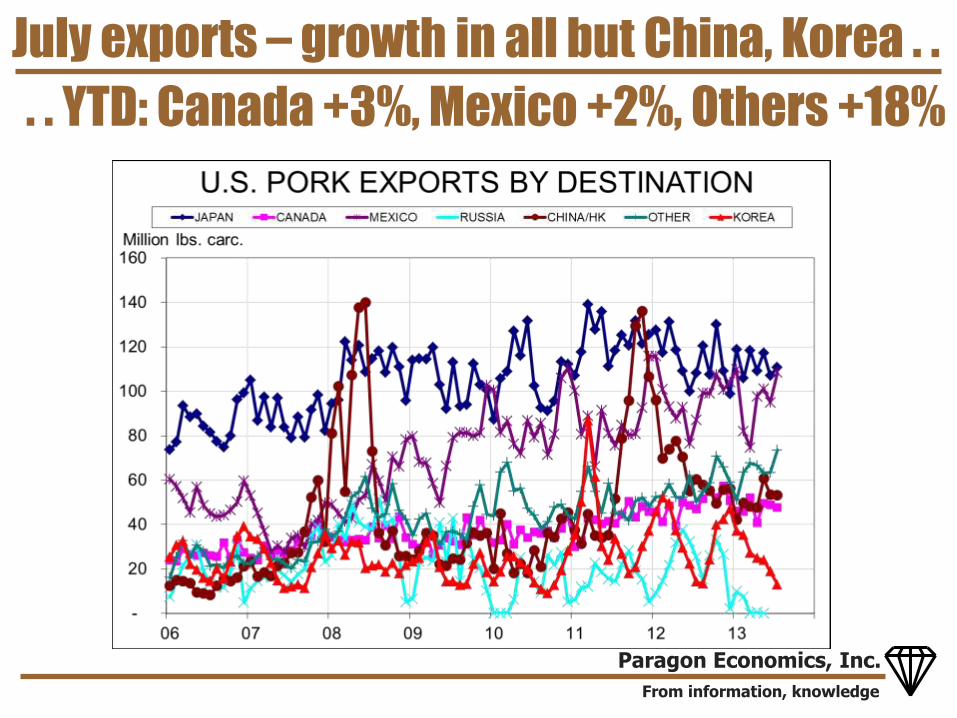
July exports – growth in all but China, Korea . .
. . YTD: Canada +3%, Mexico +2%, Others +18%
0
150,000
300,000
450,000
600,000
750,000
900,000
1,050,000
1,200,000
1,350,000
1,500,000
1,650,000
1,800,000
1,950,000
2,100,000
2,250,000
Met
ric
To
ns
Year
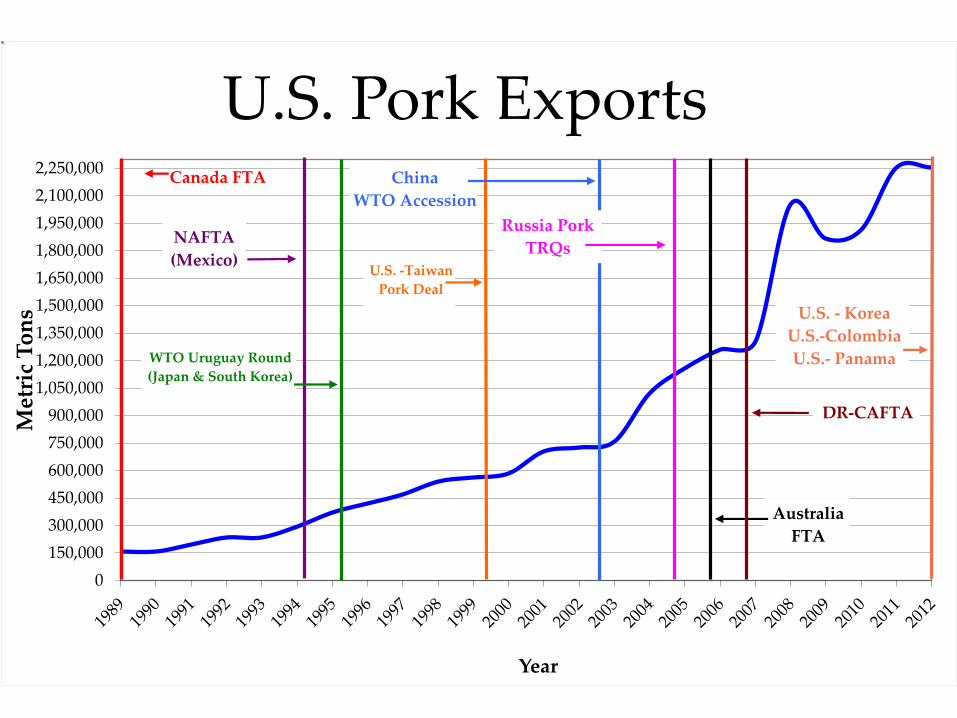
U.S. Pork ExportsCanada FTA
NAFTA
(Mexico)
WTO Uruguay Round
(Japan & South Korea)
U.S. -Taiwan
Pork Deal
China
WTO Accession
Russia Pork
TRQs
Australia
FTA
DR-CAFTA
U.S. - Korea
U.S.-Colombia
U.S.- Panama
0
100,000
200,000
300,000
400,000
500,000
600,000
700,000
Met
ric
To
ns
Year
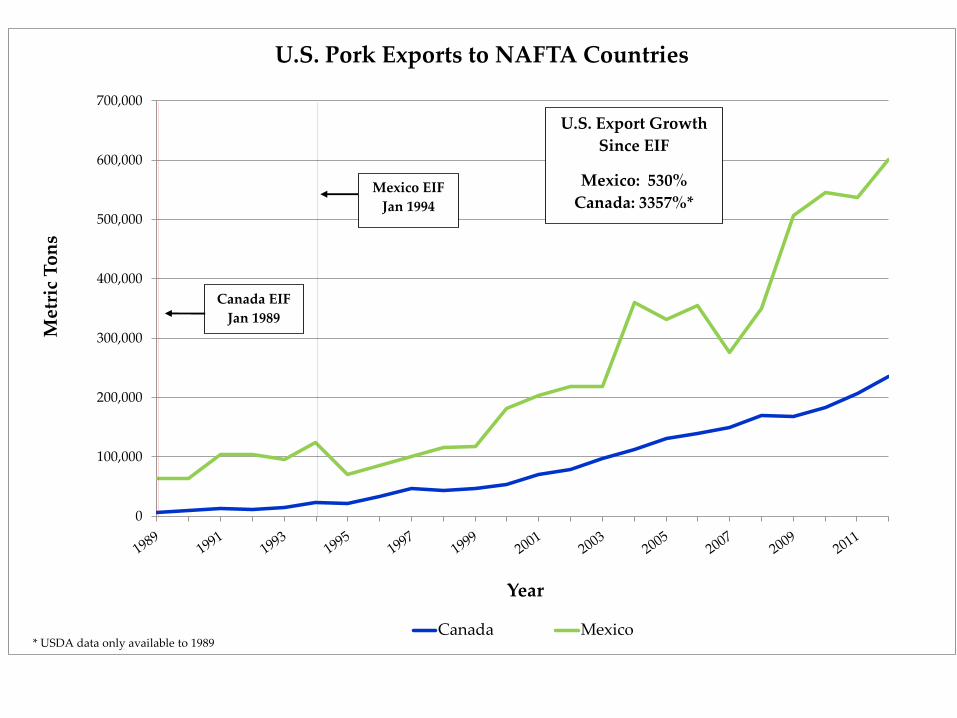
U.S. Pork Exports to NAFTA Countries
Canada Mexico
Mexico EIF
Jan 1994
U.S. Export Growth
Since EIF
Mexico: 530%
Canada: 3357%*
Canada EIF
Jan 1989
* USDA data only available to 1989
0
10,000
20,000
30,000
40,000
50,000
60,000
70,000
80,000
Met
ric
To
ns
Year
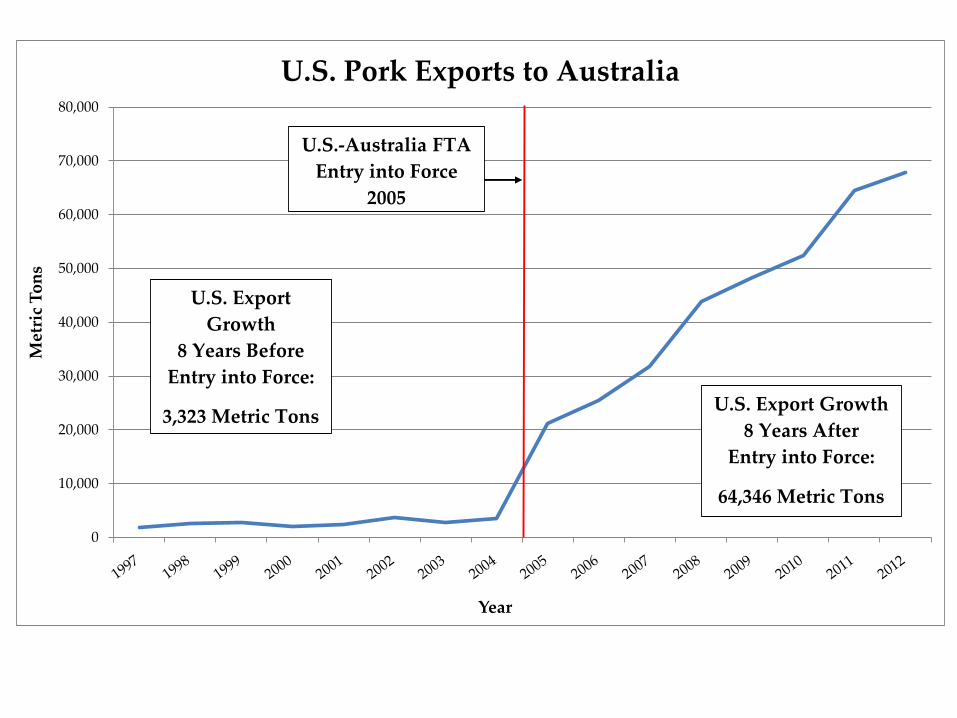
U.S. Pork Exports to Australia
U.S.-Australia FTA
Entry into Force
2005
U.S. Export
Growth
8 Years Before
Entry into Force:
3,323 Metric TonsU.S. Export Growth
8 Years After
Entry into Force:
64,346 Metric Tons
0
2,000
4,000
6,000
8,000
10,000
12,000
14,000
16,000
18,000
Met
ric
To
ns
Year
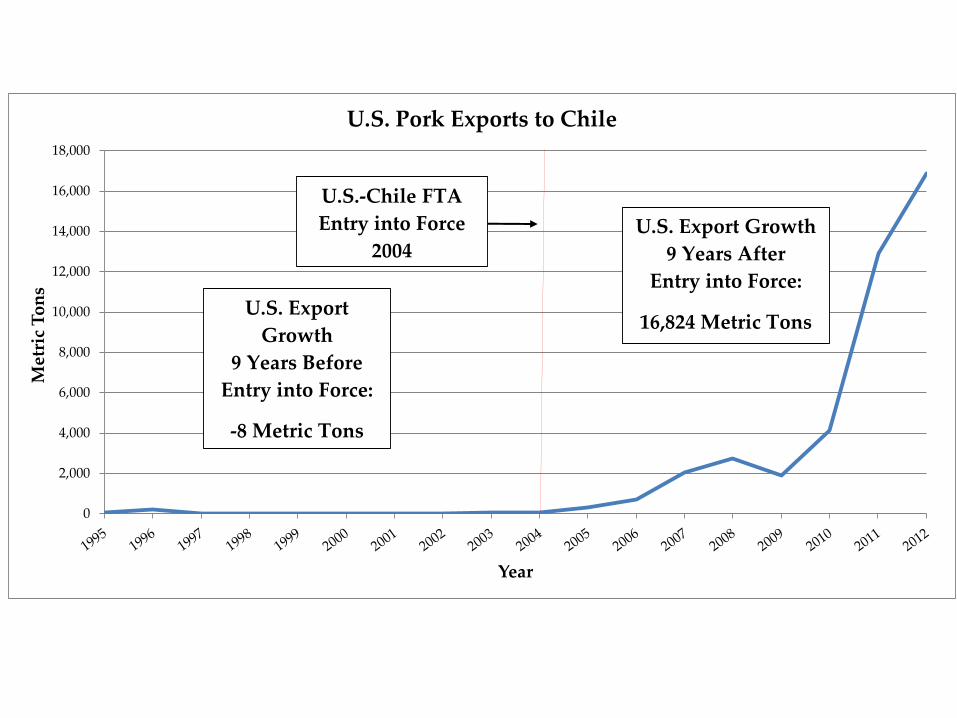
U.S. Pork Exports to Chile
U.S. Export
Growth
9 Years Before
Entry into Force:
-8 Metric Tons
U.S. Export Growth
9 Years After
Entry into Force:
16,824 Metric Tons
U.S.-Chile FTA
Entry into Force
2004
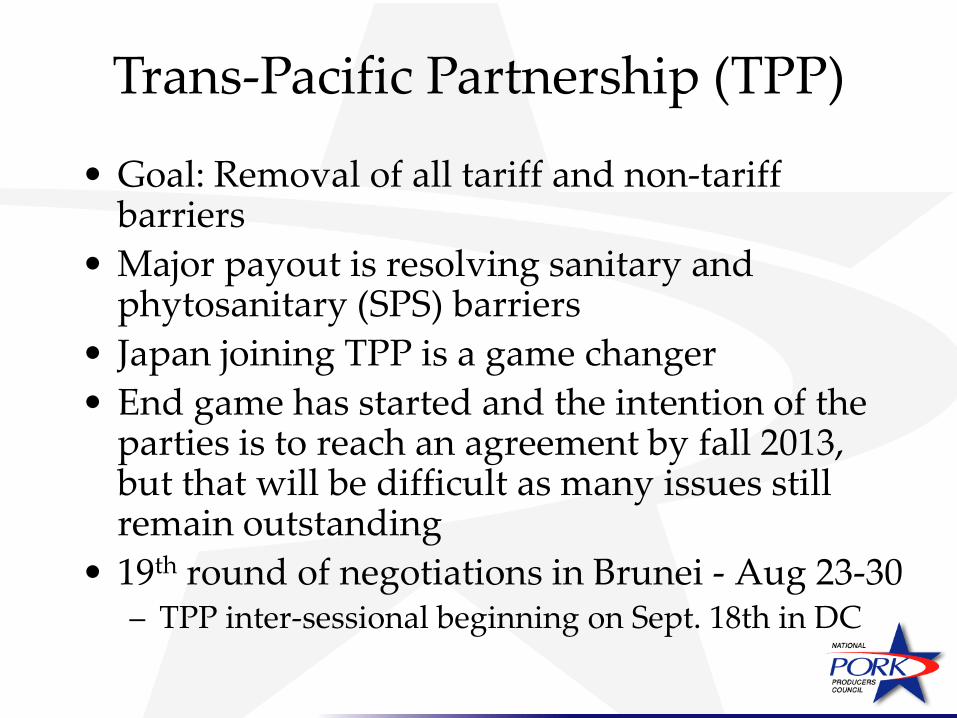
• Goal: Removal of all tariff and non-tariff barriers
• Major payout is resolving sanitary and phytosanitary (SPS) barriers
• Japan joining TPP is a game changer
• End game has started and the intention of the parties is to reach an agreement by fall 2013, but that will be difficult as many issues still remain outstanding
• 19th round of negotiations in Brunei - Aug 23-30 – TPP inter-sessional beginning on Sept. 18th in DC
Trans-Pacific Partnership (TPP)
Transatlantic Trade & Investment Partnership (TTIP)
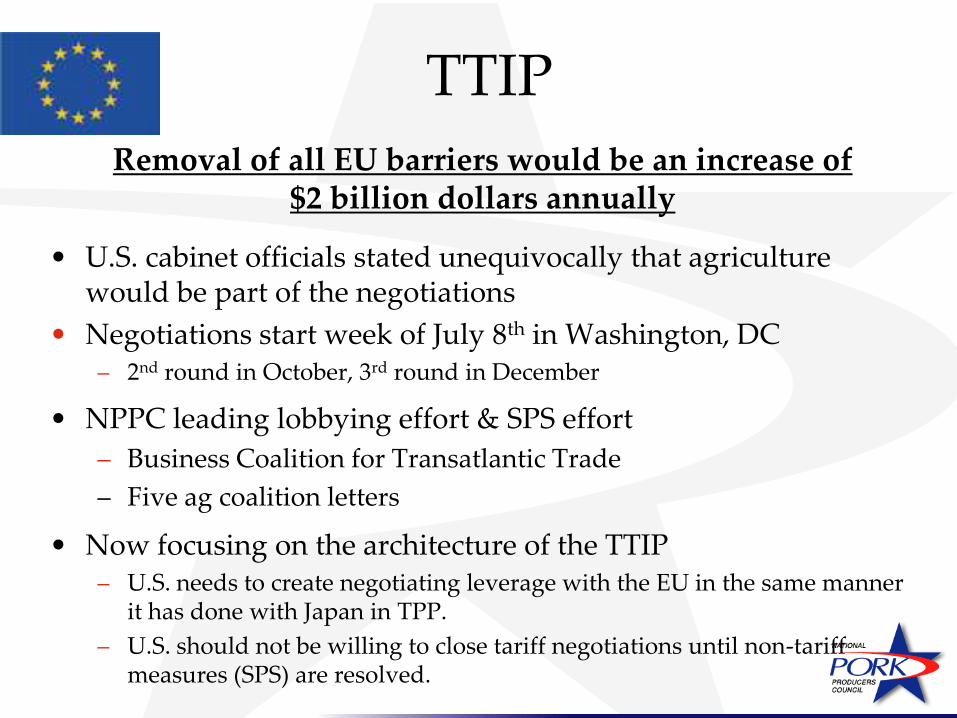
TTIP
Removal of all EU barriers would be an increase of $2 billion dollars annually
• U.S. cabinet officials stated unequivocally that agriculture would be part of the negotiations
• Negotiations start week of July 8th in Washington, DC – 2nd round in October, 3rd round in December
• NPPC leading lobbying effort & SPS effort
– Business Coalition for Transatlantic Trade
– Five ag coalition letters
• Now focusing on the architecture of the TTIP – U.S. needs to create negotiating leverage with the EU in the same manner
it has done with Japan in TPP.
– U.S. should not be willing to close tariff negotiations until non-tariff measures (SPS) are resolved.
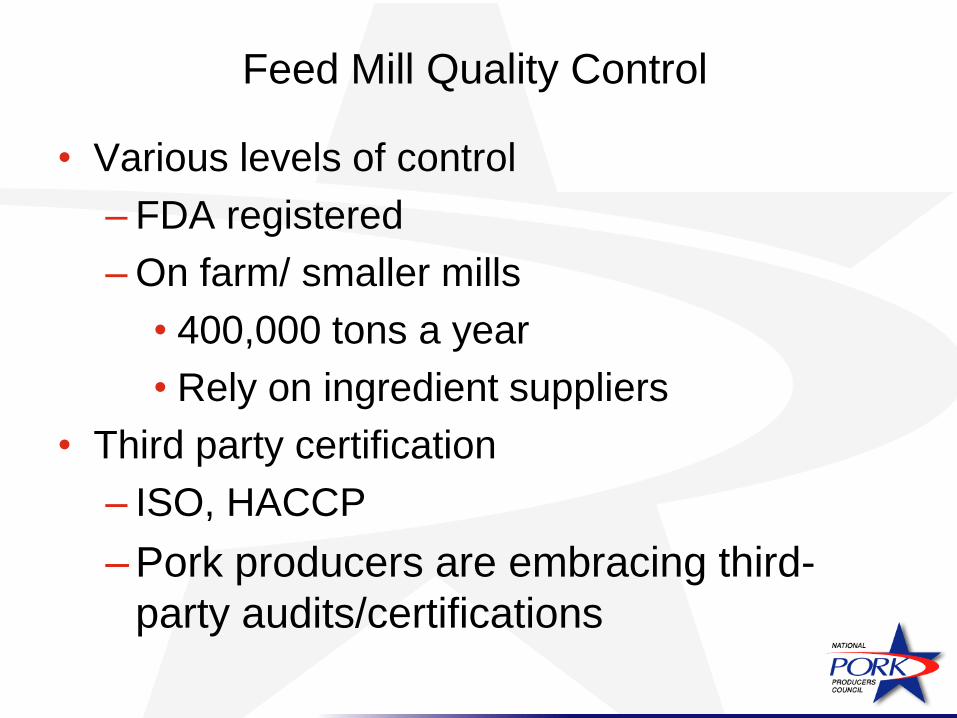
Feed Mill Quality Control
• Various levels of control
– FDA registered
– On farm/ smaller mills
• 400,000 tons a year
• Rely on ingredient suppliers
• Third party certification
– ISO, HACCP
– Pork producers are embracing third-
party audits/certifications
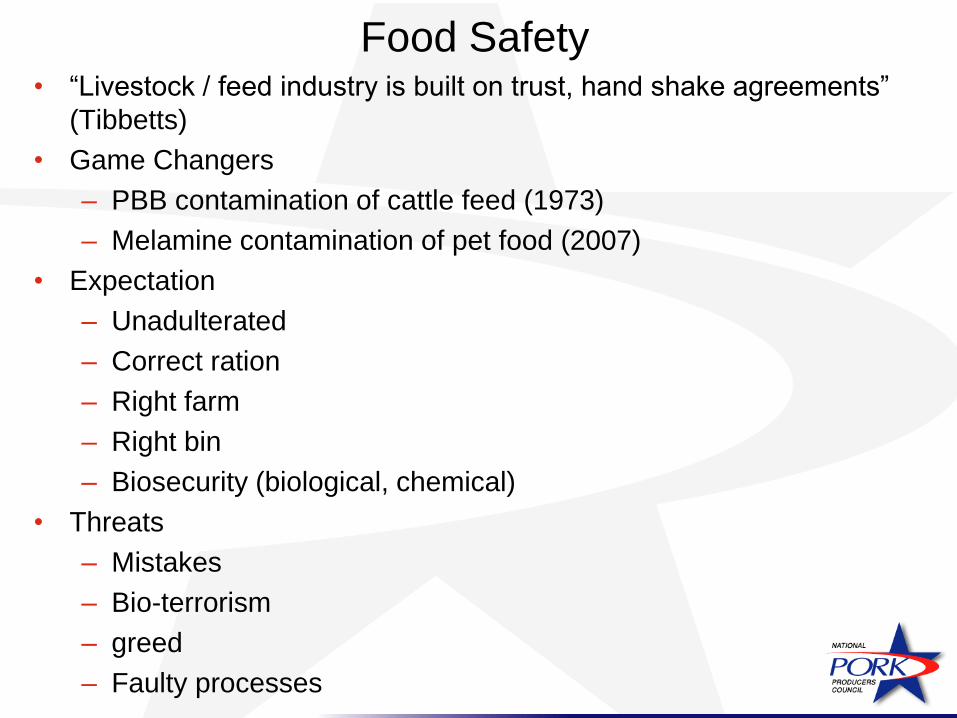
Food Safety • “Livestock / feed industry is built on trust, hand shake agreements”
(Tibbetts)
• Game Changers
– PBB contamination of cattle feed (1973)
– Melamine contamination of pet food (2007)
• Expectation
– Unadulterated
– Correct ration
– Right farm
– Right bin
– Biosecurity (biological, chemical)
• Threats
– Mistakes
– Bio-terrorism
– greed
– Faulty processes
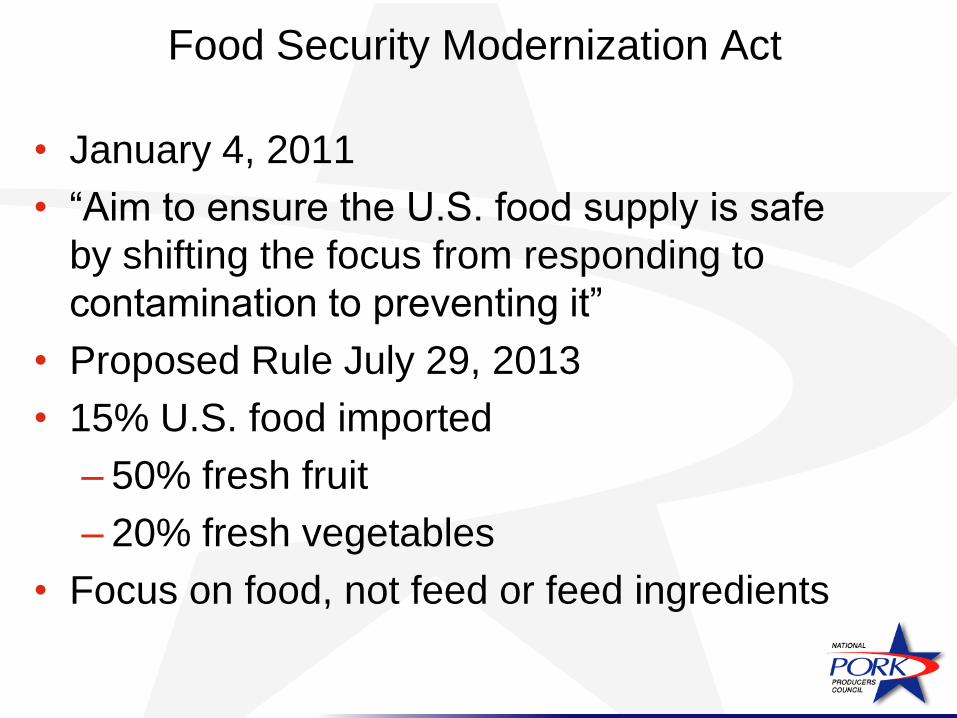
Food Security Modernization Act
• January 4, 2011
• “Aim to ensure the U.S. food supply is safe
by shifting the focus from responding to
contamination to preventing it”
• Proposed Rule July 29, 2013
• 15% U.S. food imported
– 50% fresh fruit
– 20% fresh vegetables
• Focus on food, not feed or feed ingredients

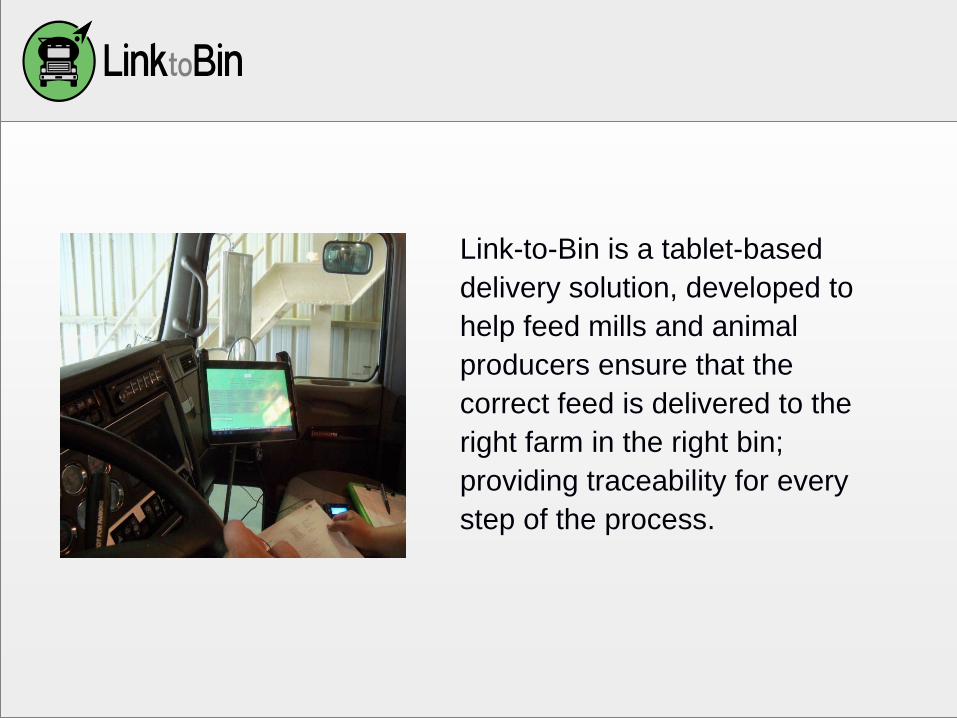
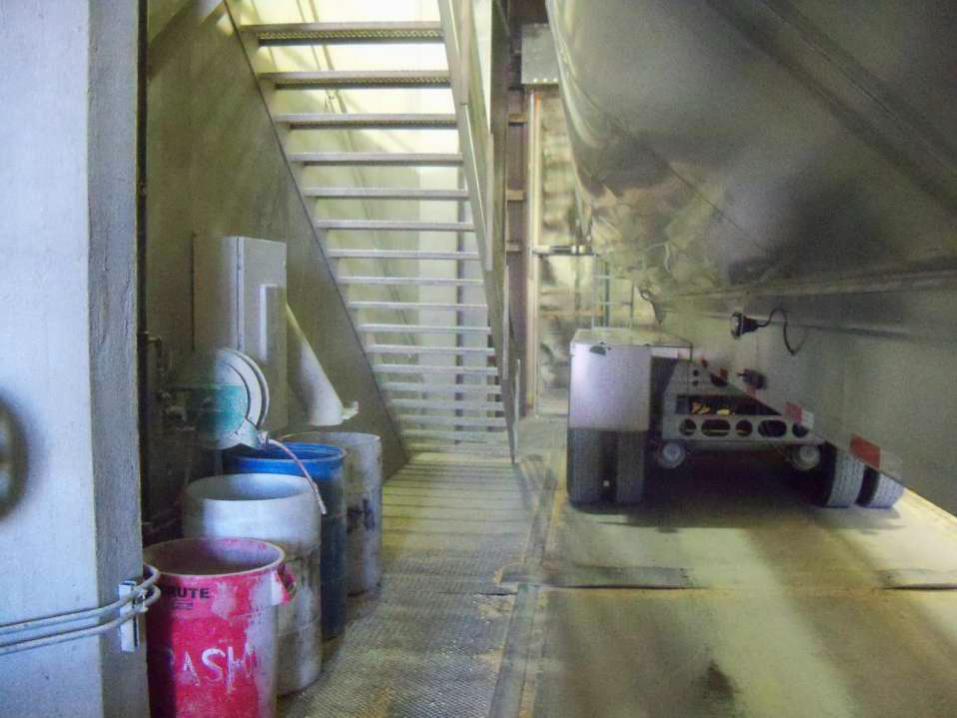
Link-to-Bin is a tablet-based
delivery solution, developed to
help feed mills and animal
producers ensure that the
correct feed is delivered to the
right farm in the right bin;
providing traceability for every
step of the process.
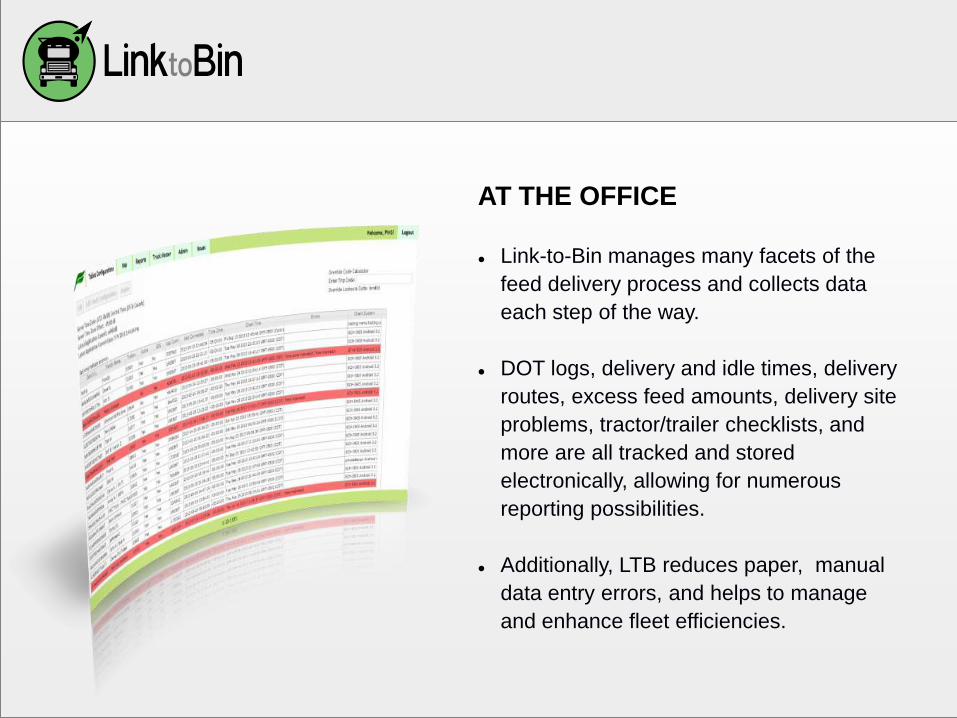
AT THE OFFICE
Link-to-Bin manages many facets of the
feed delivery process and collects data
each step of the way.
DOT logs, delivery and idle times, delivery
routes, excess feed amounts, delivery site
problems, tractor/trailer checklists, and
more are all tracked and stored
electronically, allowing for numerous
reporting possibilities.
Additionally, LTB reduces paper, manual
data entry errors, and helps to manage
and enhance fleet efficiencies.

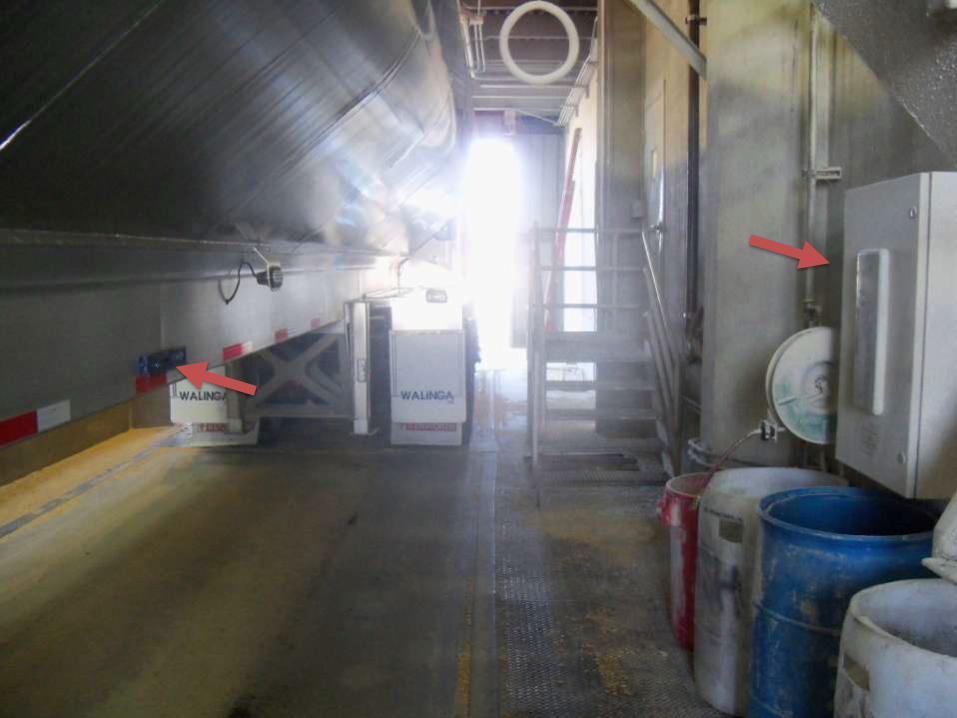
IN THE FIELD
By streamlining processes and enabling
real-time communication, Link-to-Bin
gives the customer the assurance that
they receive what they ordered, where
and when they want it.
With a tablet-based application and
proprietary hardware, Link-to-Bin collects
data each step of the way.
Linked to the Bin

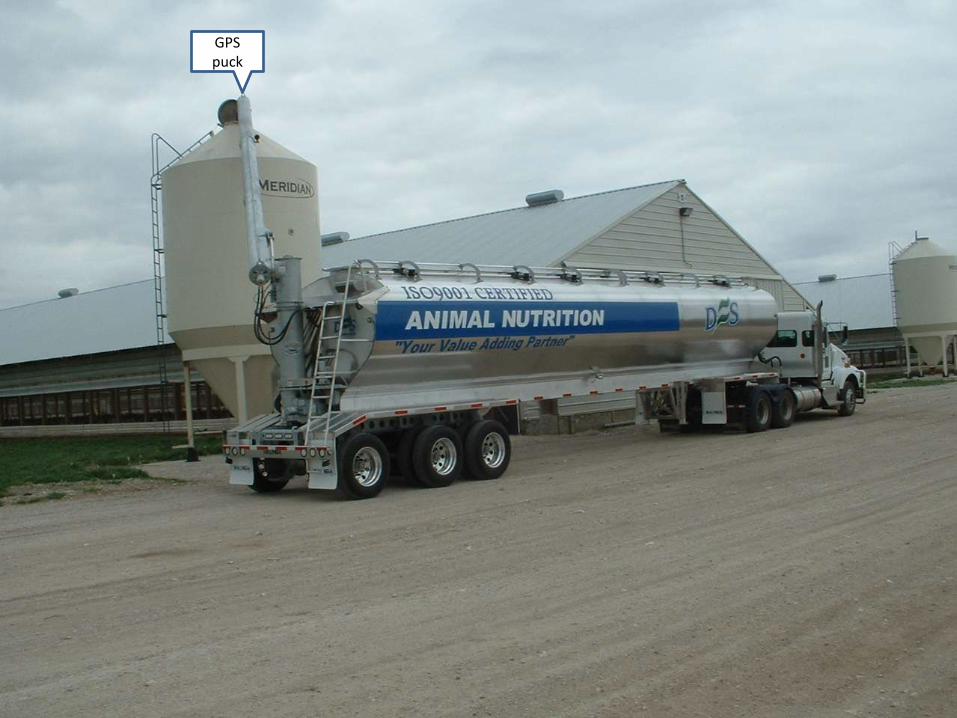
GPS puck
Veterinary Diagnostic Laboratory Iowa State University
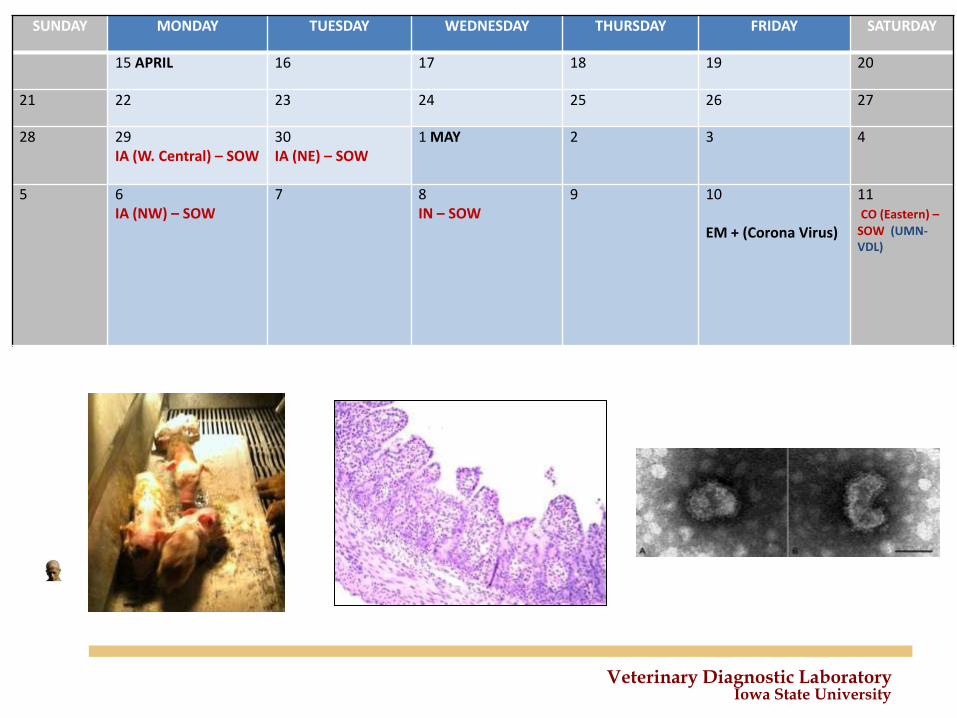
SUNDAY MONDAY TUESDAY WEDNESDAY THURSDAY FRIDAY SATURDAY
15 APRIL 16 17 18 19 20
21 22 23 24 25 26 27
28 29 IA (W. Central) – SOW
30 IA (NE) – SOW
1 MAY 2 3 4
5 6 IA (NW) – SOW
7 8 IN – SOW
9 10 EM + (Corona Virus)
11 CO (Eastern) –
SOW (UMN-VDL)
Veterinary Diagnostic Laboratory Iowa State University
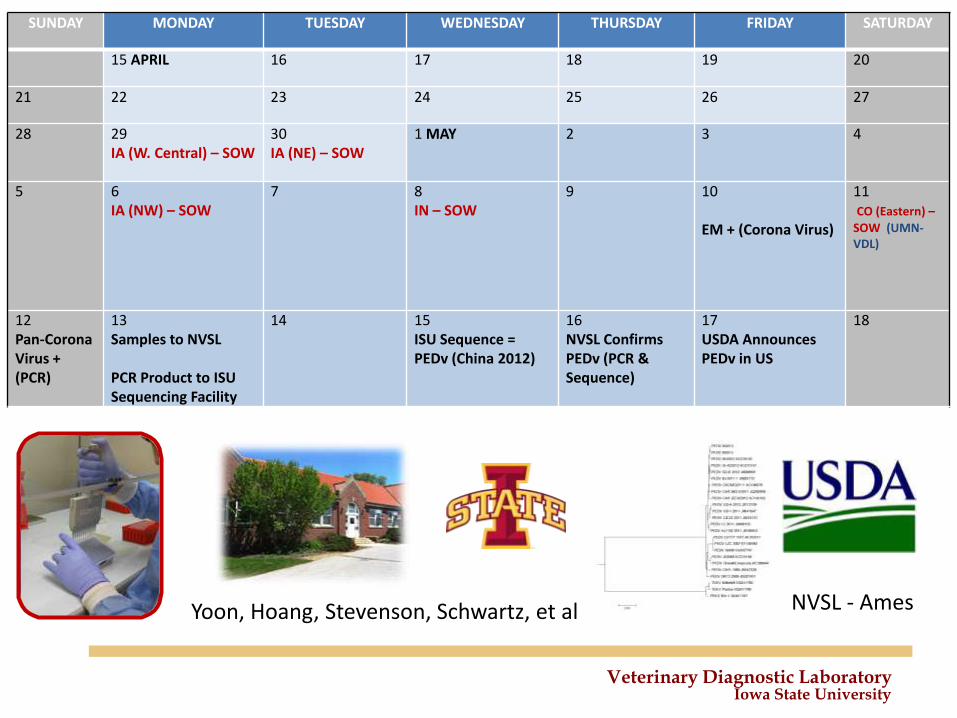
SUNDAY MONDAY TUESDAY WEDNESDAY THURSDAY FRIDAY SATURDAY
15 APRIL 16 17 18 19 20
21 22 23 24 25 26 27
28 29 IA (W. Central) – SOW
30 IA (NE) – SOW
1 MAY 2 3 4
5 6 IA (NW) – SOW
7 8 IN – SOW
9 10 EM + (Corona Virus)
11 CO (Eastern) –
SOW (UMN-VDL)
12 Pan-Corona Virus + (PCR)
13 Samples to NVSL PCR Product to ISU Sequencing Facility
14 15 ISU Sequence = PEDv (China 2012)
16 NVSL Confirms PEDv (PCR & Sequence)
17 USDA Announces PEDv in US
18
Yoon, Hoang, Stevenson, Schwartz, et al NVSL - Ames
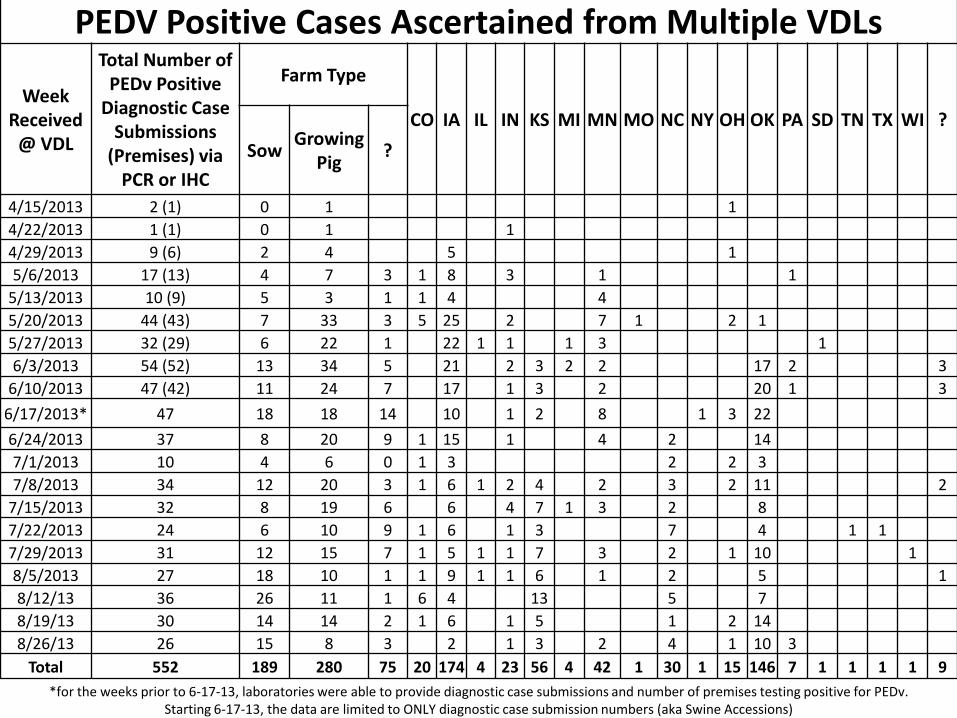
Veterinary Diagnostic Laboratory Iowa State University *for the weeks prior to 6-17-13, laboratories were able to provide diagnostic case submissions and number of premises testing positive for PEDv.
Starting 6-17-13, the data are limited to ONLY diagnostic case submission numbers (aka Swine Accessions)
PEDV Positive Cases Ascertained from Multiple VDLs
Week Received
@ VDL
Total Number of PEDv Positive
Diagnostic Case Submissions
(Premises) via PCR or IHC
Farm Type
CO IA IL IN KS MI MN MO NC NY OH OK PA SD TN TX WI ?
Sow Growing
Pig ?
4/15/2013 2 (1) 0 1 1
4/22/2013 1 (1) 0 1 1
4/29/2013 9 (6) 2 4 5 1
5/6/2013 17 (13) 4 7 3 1 8 3 1 1
5/13/2013 10 (9) 5 3 1 1 4 4
5/20/2013 44 (43) 7 33 3 5 25 2 7 1 2 1
5/27/2013 32 (29) 6 22 1 22 1 1 1 3 1
6/3/2013 54 (52) 13 34 5 21 2 3 2 2 17 2 3
6/10/2013 47 (42) 11 24 7 17 1 3 2 20 1 3
6/17/2013* 47 18 18 14 10 1 2 8 1 3 22
6/24/2013 37 8 20 9 1 15 1 4 2 14
7/1/2013 10 4 6 0 1 3 2 2 3
7/8/2013 34 12 20 3 1 6 1 2 4 2 3 2 11 2
7/15/2013 32 8 19 6 6 4 7 1 3 2 8
7/22/2013 24 6 10 9 1 6 1 3 7 4 1 1
7/29/2013 31 12 15 7 1 5 1 1 7 3 2 1 10 1
8/5/2013 27 18 10 1 1 9 1 1 6 1 2 5 1
8/12/13 36 26 11 1 6 4 13 5 7
8/19/13 30 14 14 2 1 6 1 5 1 2 14
8/26/13 26 15 8 3 2 1 3 2 4 1 10 3
Total 552 189 280 75 20 174 4 23 56 4 42 1 30 1 15 146 7 1 1 1 1 9
Veterinary Diagnostic Laboratory Iowa State University
0
10
20
30
40
50
60
# P
EDv
Po
siti
ve C
ase
s
Date by Week
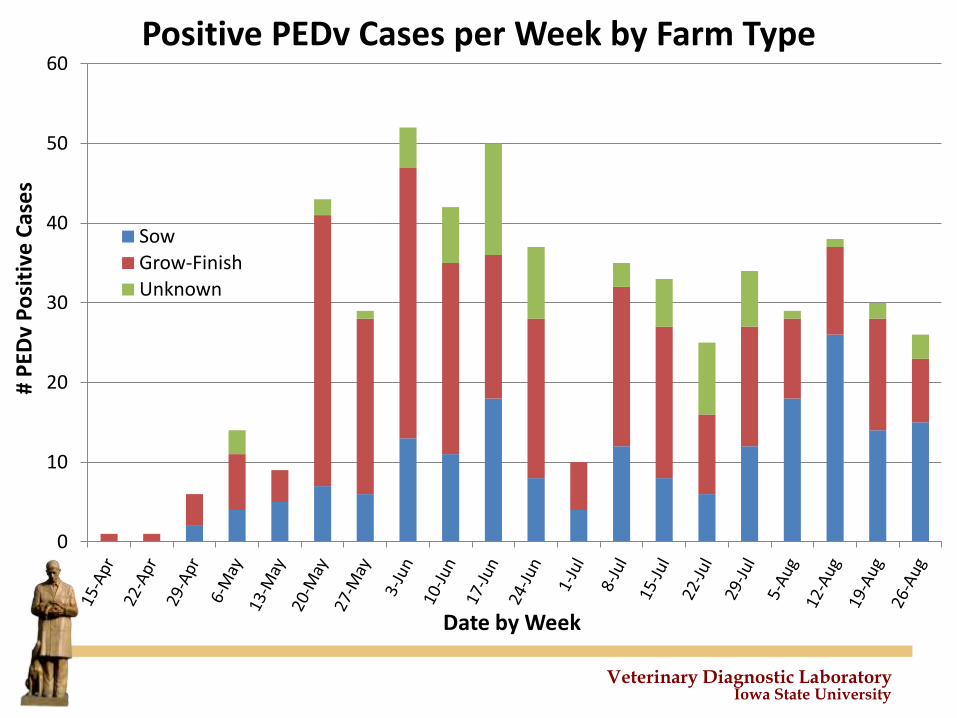
Positive PEDv Cases per Week by Farm Type
Sow Grow-Finish Unknown
Veterinary Diagnostic Laboratory Iowa State University
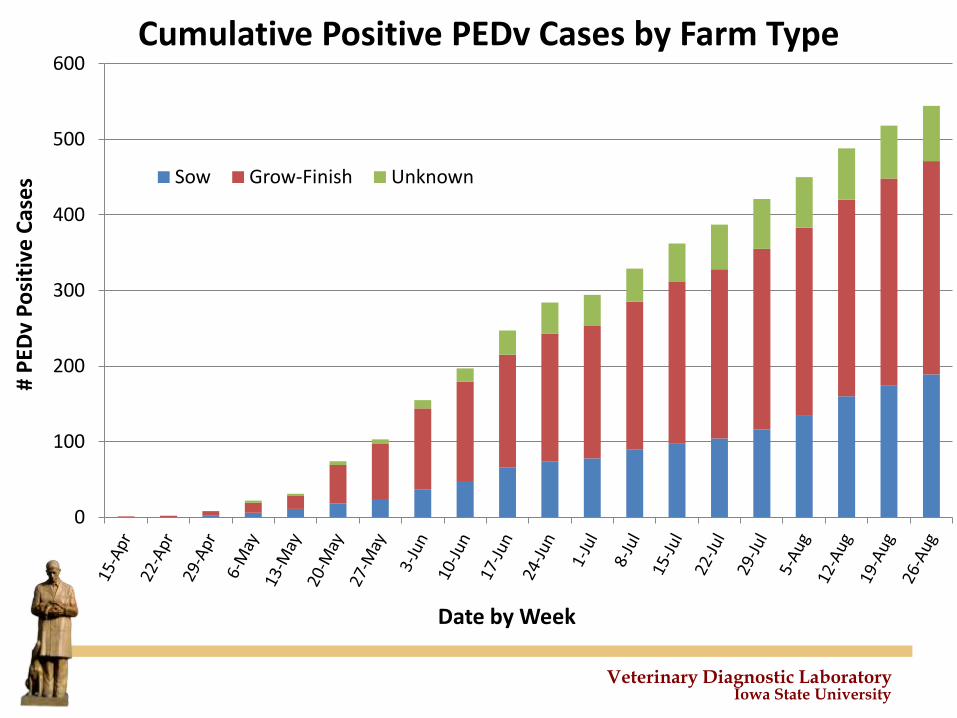
0
100
200
300
400
500
600
# P
EDv
Po
siti
ve C
ase
s
Date by Week
Cumulative Positive PEDv Cases by Farm Type
Sow Grow-Finish Unknown
Questions?
Howard Hill, DVM, PHD
President Elect – National Pork Producers Council

![MYB89 Transcription Factor Represses Seed Oil ... · MYB89 Transcription Factor Represses Seed Oil Accumulation1[OPEN] Dong Li2, Changyu Jin2, Shaowei Duan2, Yana Zhu, Shuanghui Qi,](https://img.pdfslide.us/doc/110x75/5f3c52986f430b30851577d2/myb89-transcription-factor-represses-seed-oil-myb89-transcription-factor-represses.jpg)
![4. 5. 6. JOINT] JOINT T P JOINT T P JOINT C 18 H JOINT C T ... ken-syoumei.pdf4. 5. 6. JOINT] JOINT T P JOINT T P JOINT C 18 H JOINT C T. P JOINT JOINT a C (2) JOINT x (3) JOINT x](https://img.pdfslide.us/doc/110x75/611edb438155026709151f58/4-5-6-joint-joint-t-p-joint-t-p-joint-c-18-h-joint-c-t-ken-4-5-6-joint.jpg)