Embed Size (px)
Citation preview
NGA Policy Academy forNGA Policy Academy for State Officials Improving State Officials Improving
Oral Health Care for ChildrenOral Health Care for Children
WORKFORCE ISSUESWORKFORCE ISSUES
Richard W. Valachovic, D.M.D., M.P.H.Executive Director
American Dental Education Association
May 7, 2001
©ADEA 2001
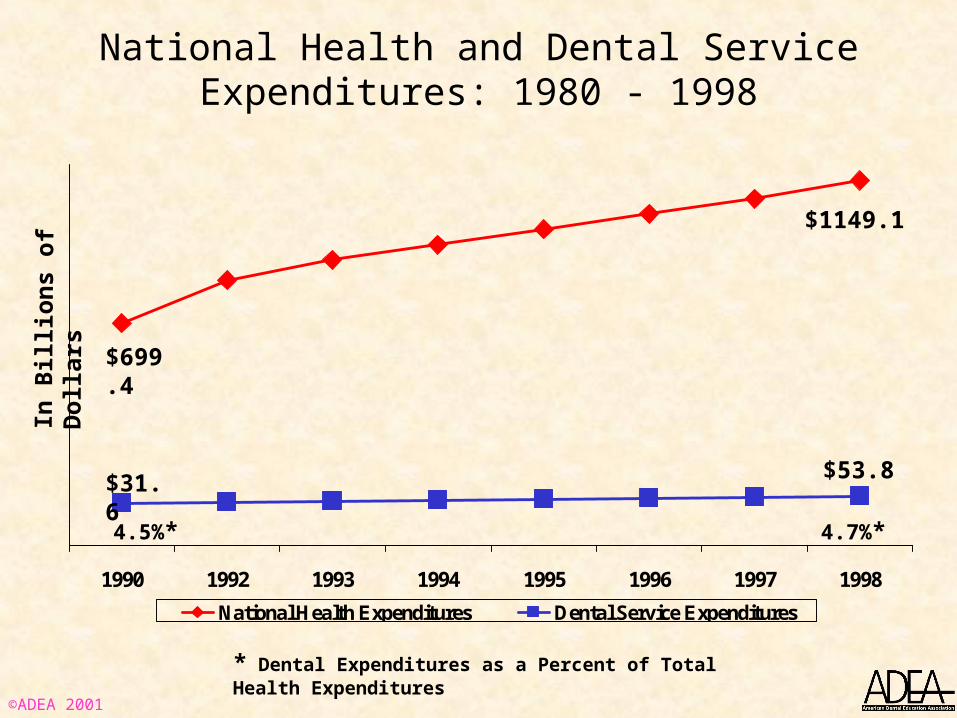
National Health and Dental Service Expenditures: 1980 - 1998
1990 1992 1993 1994 1995 1996 1997 1998
National Health Expenditures Dental Service Expenditures
$1149.1
$31.6 $53.8
4.5%* 4.7%*
$699.4
* Dental Expenditures as a Percent of Total Health Expenditures
In B
illi
ons
of D
olla
rs
©ADEA 2001
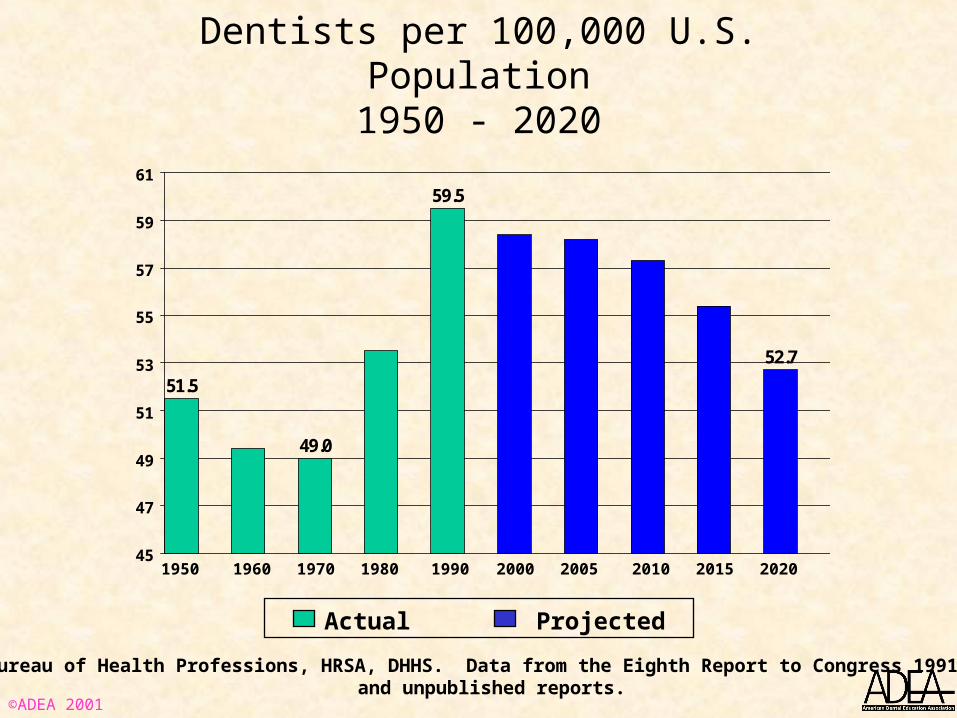
Dentists per 100,000 U.S. Population1950 - 2020
51.5
52.7
59.5
49.0
45
47
49
51
53
55
57
59
61
Actual Projected
Source: Bureau of Health Professions, HRSA, DHHS. Data from the Eighth Report to Congress 1991 and unpublished reports.
1950 1960 1970 1980 1990 2000 2005 2010 2015 2020
©ADEA 2001
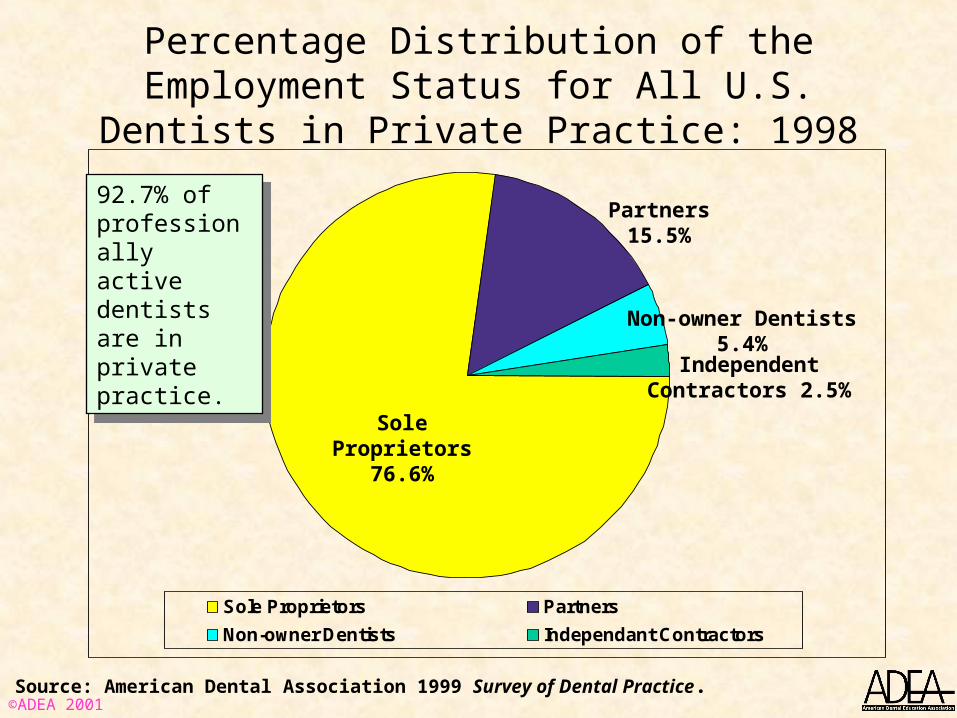
Percentage Distribution of the Employment Status for All U.S. Dentists in Private Practice: 1998
Sole Proprietors Partners
Non-owner Dentists Independant Contractors
Sole Proprietors
76.6%
Partners 15.5%
Non-owner Dentists 5.4%
Independent Contractors 2.5%
Source: American Dental Association 1999 Survey of Dental Practice.
92.7% of professionally active dentists are in private practice.
92.7% of professionally active dentists are in private practice.
©ADEA 2001
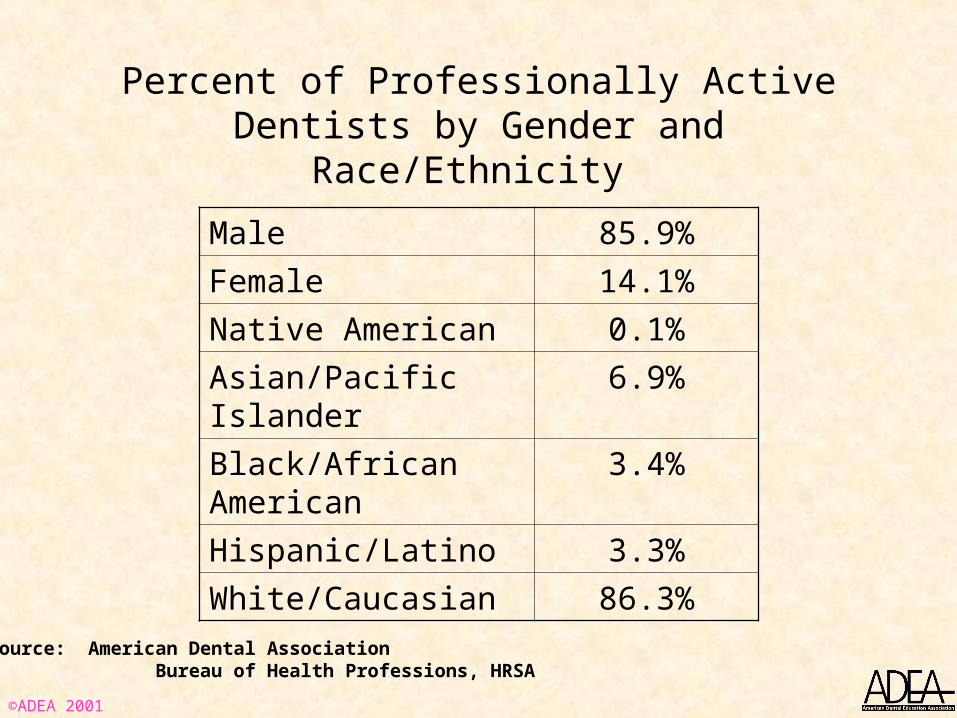
Percent of Professionally Active Dentists by Gender and Race/Ethnicity
Male 85.9%
Female 14.1%
Native American 0.1%
Asian/Pacific Islander 6.9%
Black/African American 3.4%
Hispanic/Latino 3.3%
White/Caucasian 86.3%
Source: American Dental Association Bureau of Health Professions, HRSA
©ADEA 2001
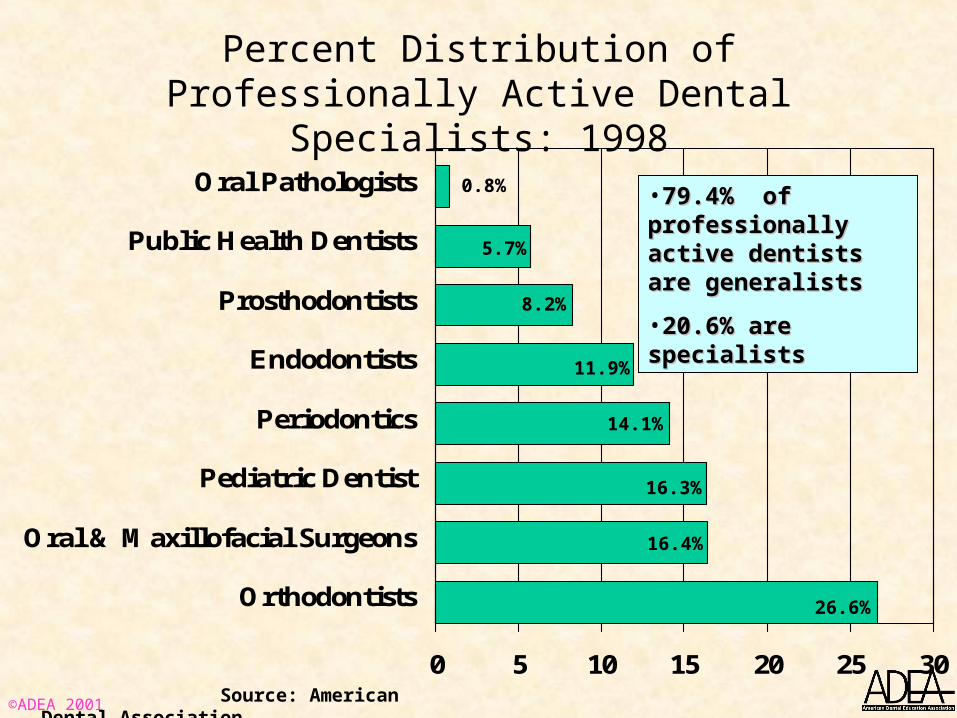
Percent Distribution of Professionally Active Dental Specialists: 1998
0 5 10 15 20 25 30
Orthodontists
Oral & Maxillofacial Surgeons
Pediatric Dentist
Periodontics
Endodontists
Prosthodontists
Public Health Dentists
Oral Pathologists•79.4% of professionally 79.4% of professionally active dentists are active dentists are generalists generalists
•20.6% are specialists20.6% are specialists
Source: American Dental Association
0.8%
5.7%
8.2%
11.9%
14.1%
16.3%
16.4%
26.6%
©ADEA 2001
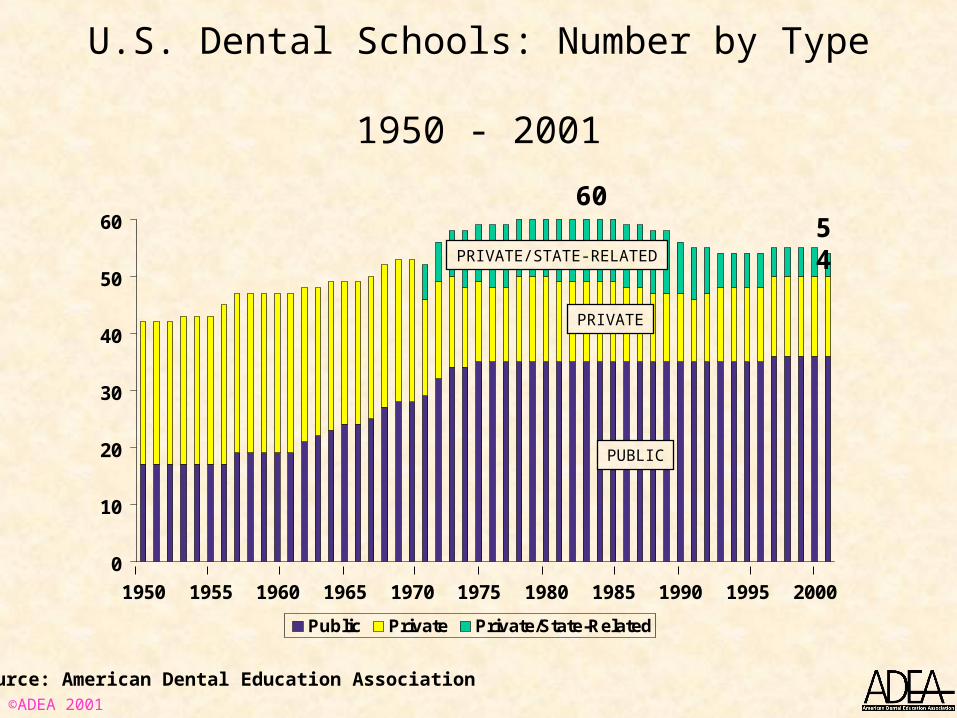
U.S. Dental Schools: Number by Type 1950 - 2001
0
10
20
30
40
50
60
1950 1955 1960 1965 1970 1975 1980 1985 1990 1995 2000
Public Private Private/State-Related
6054
PUBLIC
PRIVATE
PRIVATE/STATE-RELATED
Source: American Dental Education Association©ADEA 2001
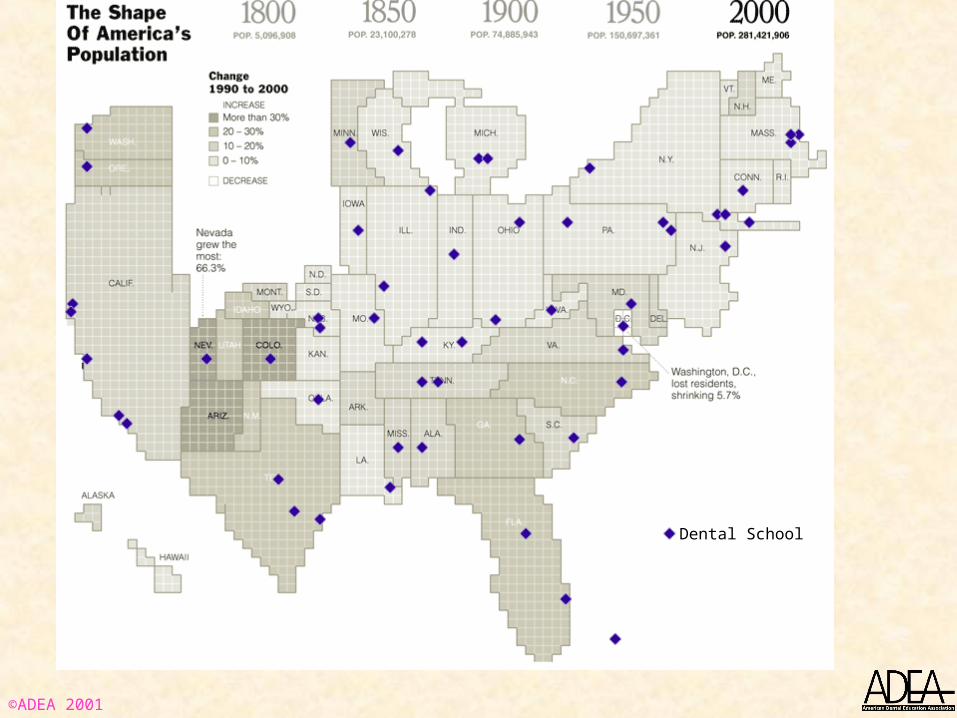
Dental School
©ADEA 2001
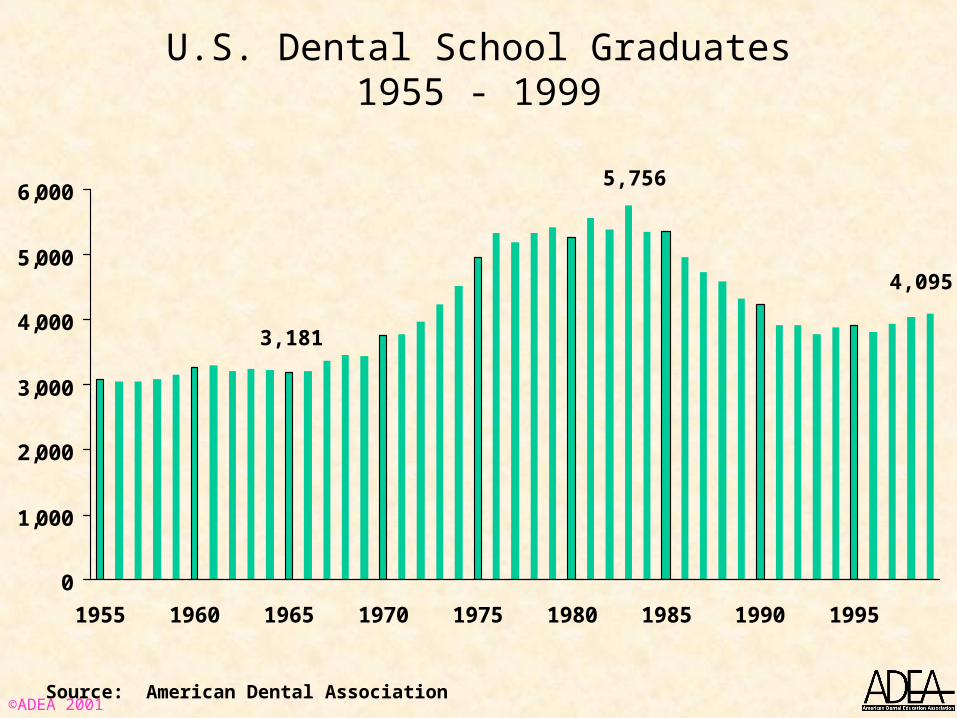
U.S. Dental School Graduates1955 - 1999
0
1,000
2,000
3,000
4,000
5,000
6,000
1955 1960 1965 1970 1975 1980 1985 1990 1995
Source: American Dental Association
5,756
4,095
3,181
©ADEA 2001
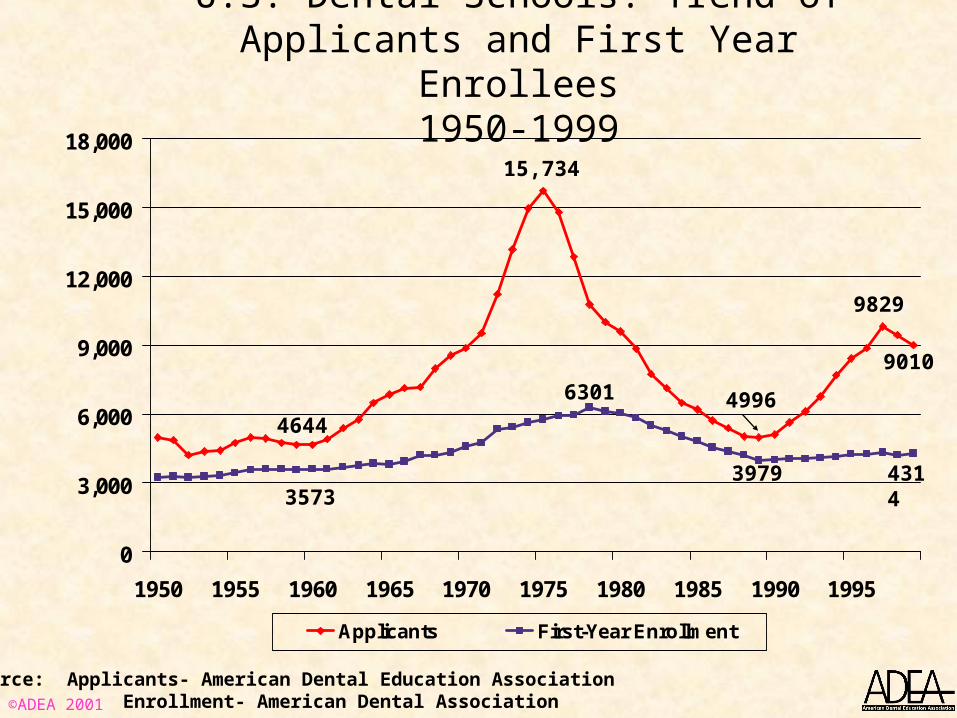
U.S. Dental Schools: Trend of Applicants and First Year Enrollees
1950-1999
0
3,000
6,000
9,000
12,000
15,000
18,000
1950 1955 1960 1965 1970 1975 1980 1985 1990 1995
Applicants First-Year Enrollment
15,734
6301 4996
9829
Source: Applicants- American Dental Education Association Enrollment- American Dental Association
9010
43143979
4644
3573
©ADEA 2001
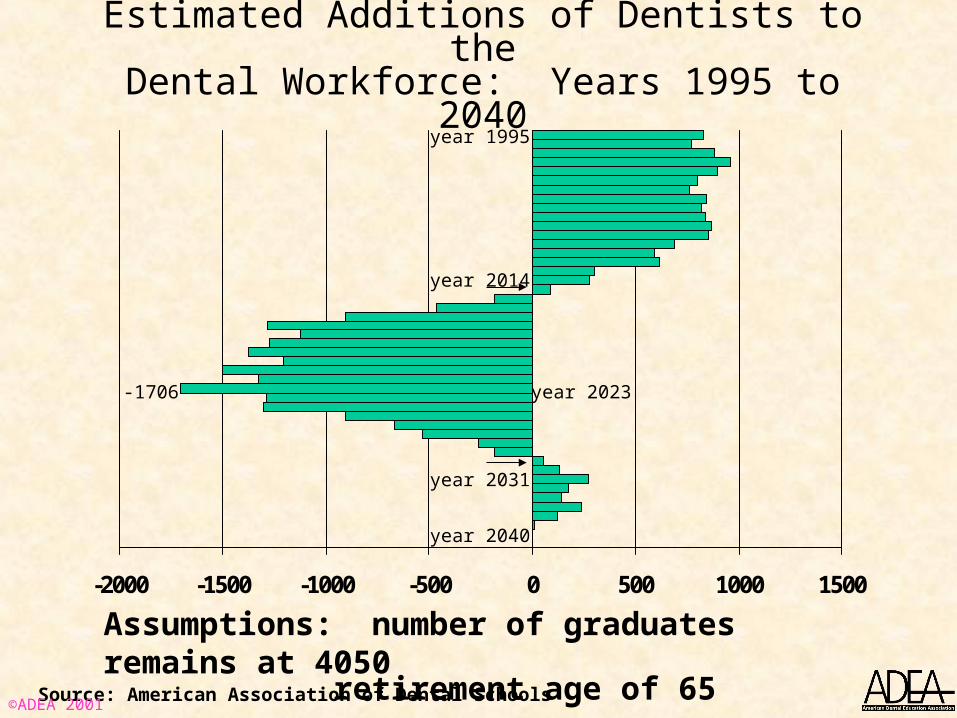
Estimated Additions of Dentists to theDental Workforce: Years 1995 to 2040
-2000 -1500 -1000 -500 0 500 1000 1500
Assumptions: number of graduates remains at 4050 retirement age of 65
year 2014
year 2023-1706
year 1995
year 2040
year 2031
Source: American Association of Dental Schools©ADEA 2001
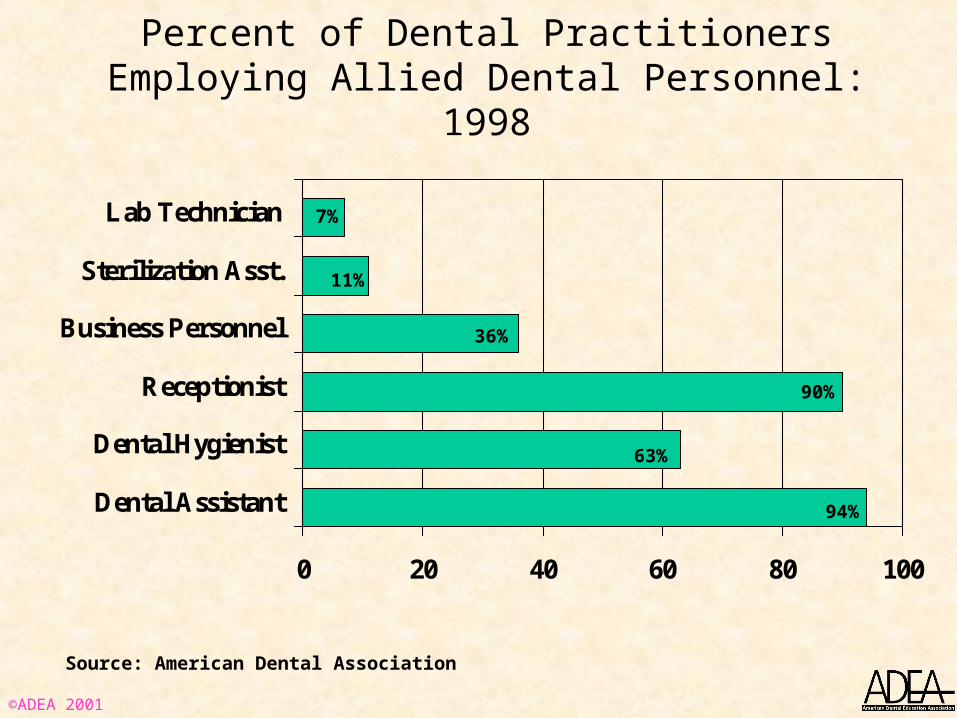
Percent of Dental Practitioners Employing Allied Dental Personnel: 1998
0 20 40 60 80 100
Dental Assistant
Dental Hygienist
Receptionist
Business Personnel
Sterilization Asst.
Lab Technician
Source: American Dental Association
7%
11%
36%
90%
63%
94%
©ADEA 2001
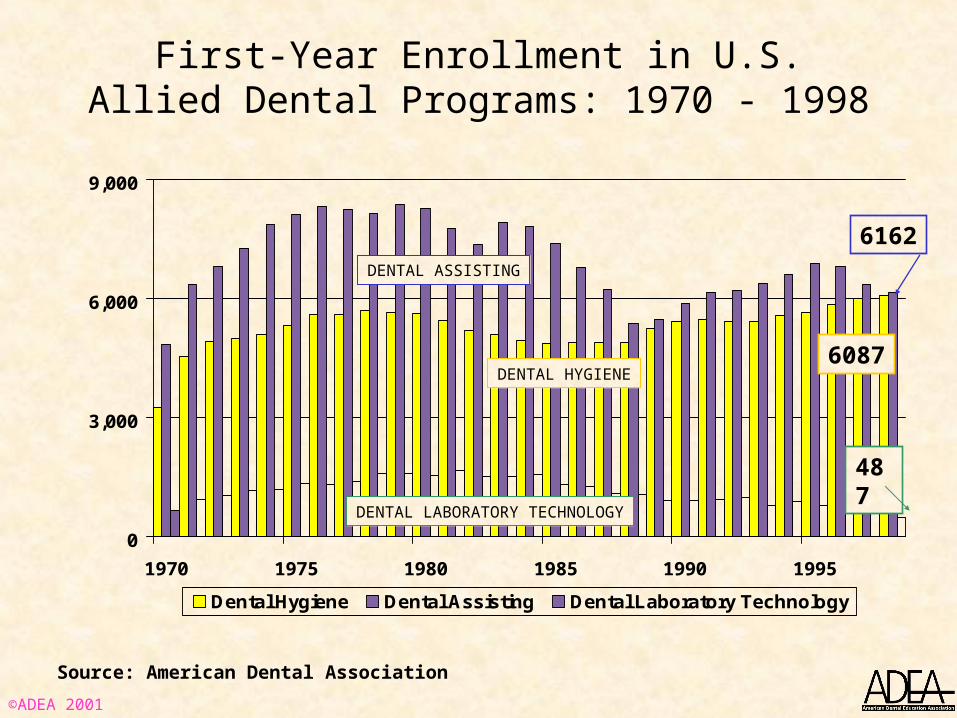
First-Year Enrollment in U.S. Allied Dental Programs: 1970 - 1998
0
3,000
6,000
9,000
1970 1975 1980 1985 1990 1995
Dental Hygiene Dental Assisting Dental Laboratory Technology
Source: American Dental Association
DENTAL ASSISTING
DENTAL HYGIENE
DENTAL LABORATORY TECHNOLOGY
6162
6087
487
©ADEA 2001
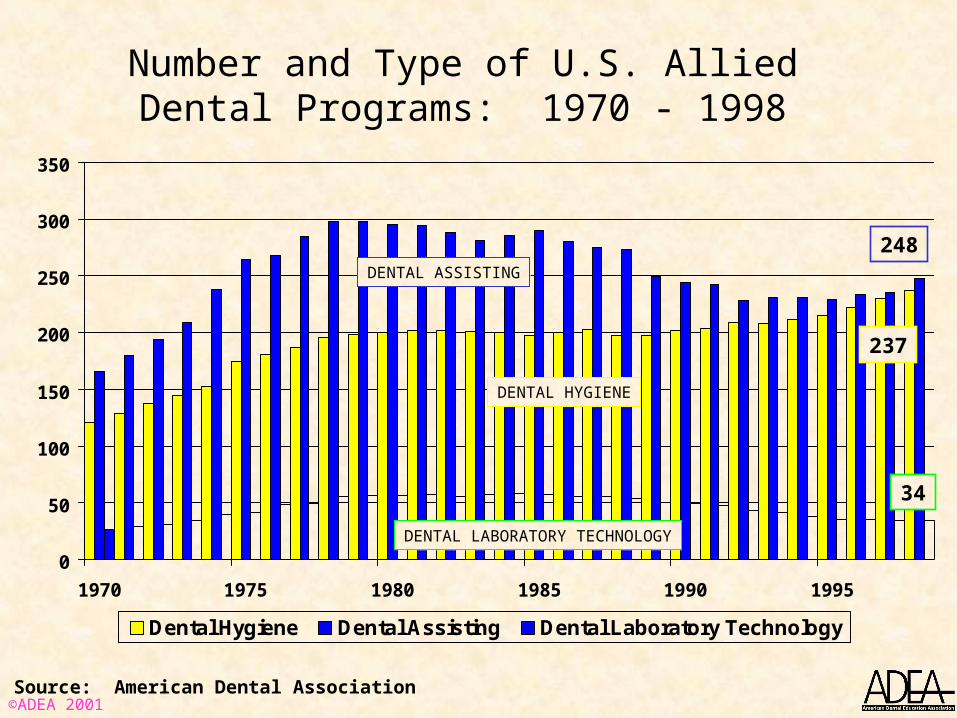
Number and Type of U.S. Allied Dental Programs: 1970 - 1998
0
50
100
150
200
250
300
350
1970 1975 1980 1985 1990 1995
Dental Hygiene Dental Assisting Dental Laboratory Technology
Source: American Dental Association
248
237
34
DENTAL ASSISTING
DENTAL HYGIENE
DENTAL LABORATORY TECHNOLOGY
©ADEA 2001
0
1,000
2,000
3,000
4,000
5,000
6,000
7,000
First-Year Enrollment Women's Enrollment
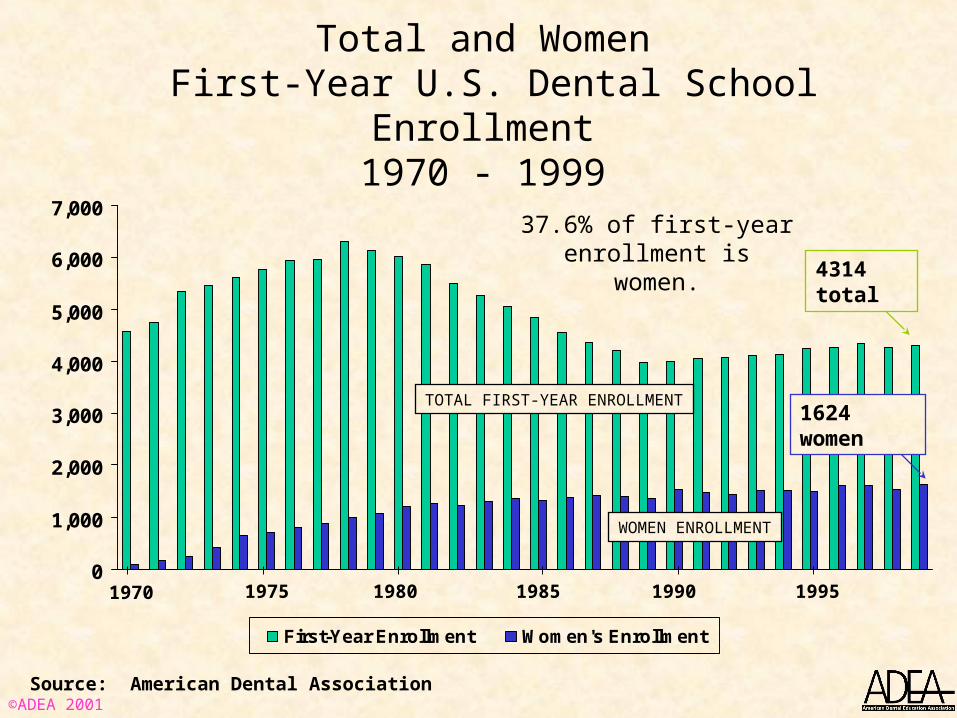
Total and Women First-Year U.S. Dental School Enrollment
1970 - 1999
1624 women
4314 total
Source: American Dental Association
TOTAL FIRST-YEAR ENROLLMENT
WOMEN ENROLLMENT
37.6% of first-year enrollment is women.
1970 1975 1980 1985 1990 1995
©ADEA 2001
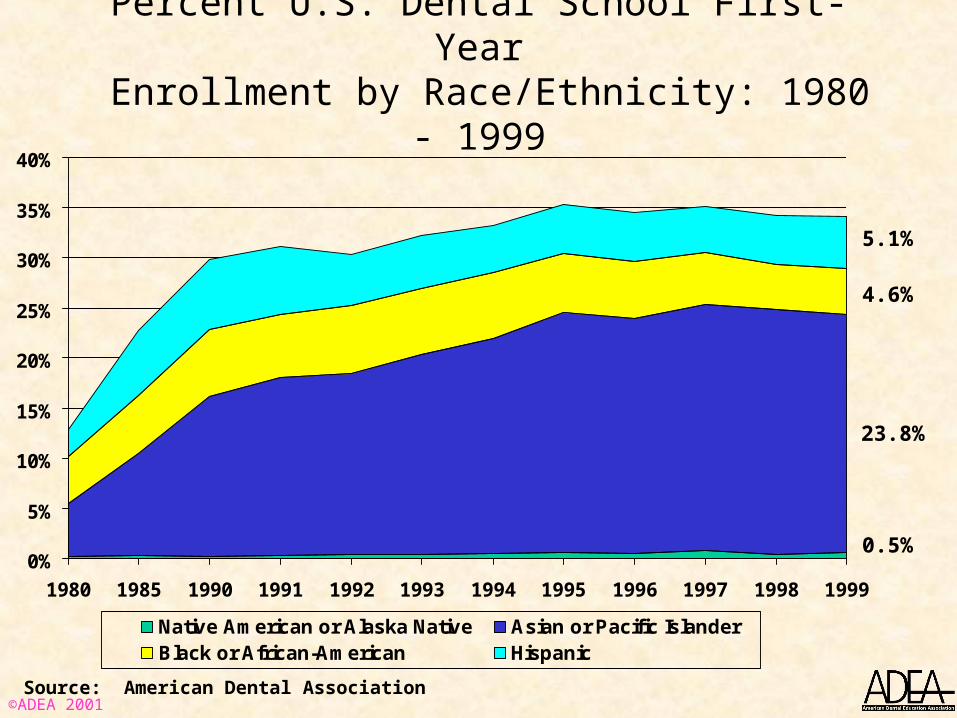
Percent U.S. Dental School First-Year Enrollment by Race/Ethnicity: 1980 - 1999
0%
5%
10%
15%
20%
25%
30%
35%
40%
1980 1985 1990 1991 1992 1993 1994 1995 1996 1997 1998 1999
Native American or Alaska Native Asian or Pacific IslanderBlack or African-American Hispanic
23.8%
0.5%
4.6%
5.1%
Source: American Dental Association©ADEA 2001
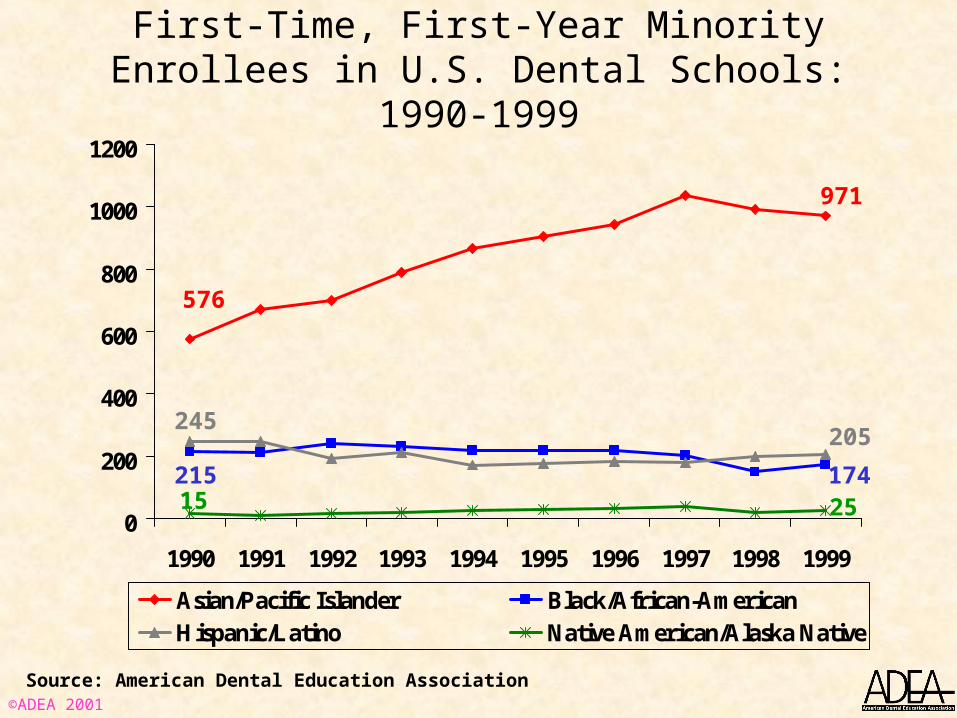
First-Time, First-Year Minority Enrollees in U.S. Dental Schools: 1990-1999
0
200
400
600
800
1000
1200
1990 1991 1992 1993 1994 1995 1996 1997 1998 1999
Asian/Pacific Islander Black/African-AmericanHispanic/Latino Native American/Alaska Native
971
576
205245
17421515 25
Source: American Dental Education Association©ADEA 2001
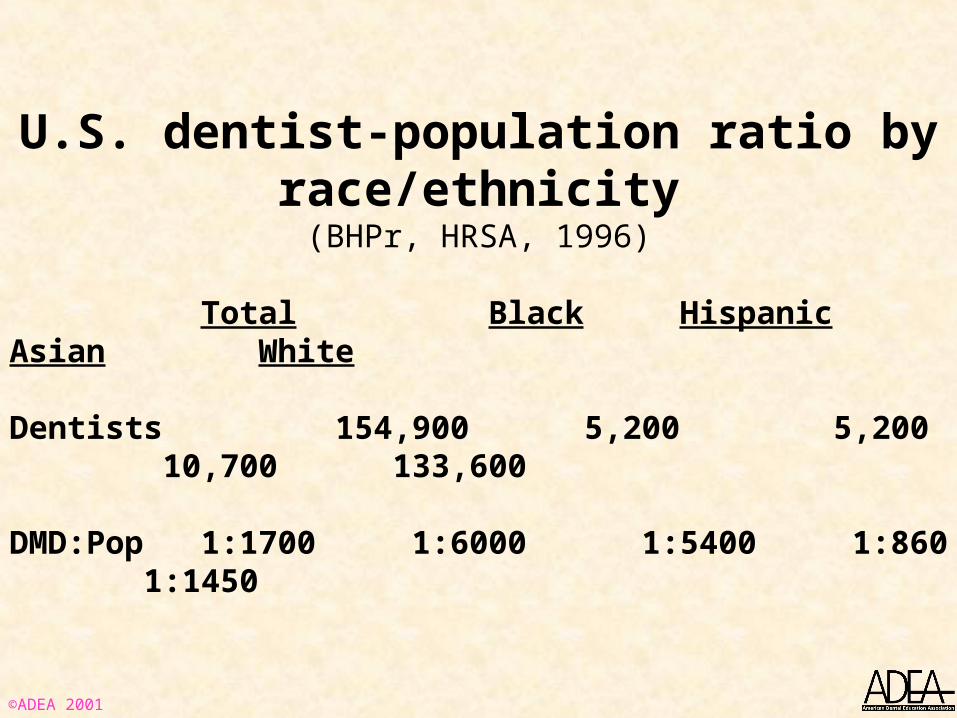
U.S. dentist-population ratio by race/ethnicity(BHPr, HRSA, 1996)
Total Black Hispanic Asian White Dentists 154,900 5,200 5,200 10,700 133,600
DMD:Pop 1:1700 1:6000 1:5400 1:860 1:1450
©ADEA 2001
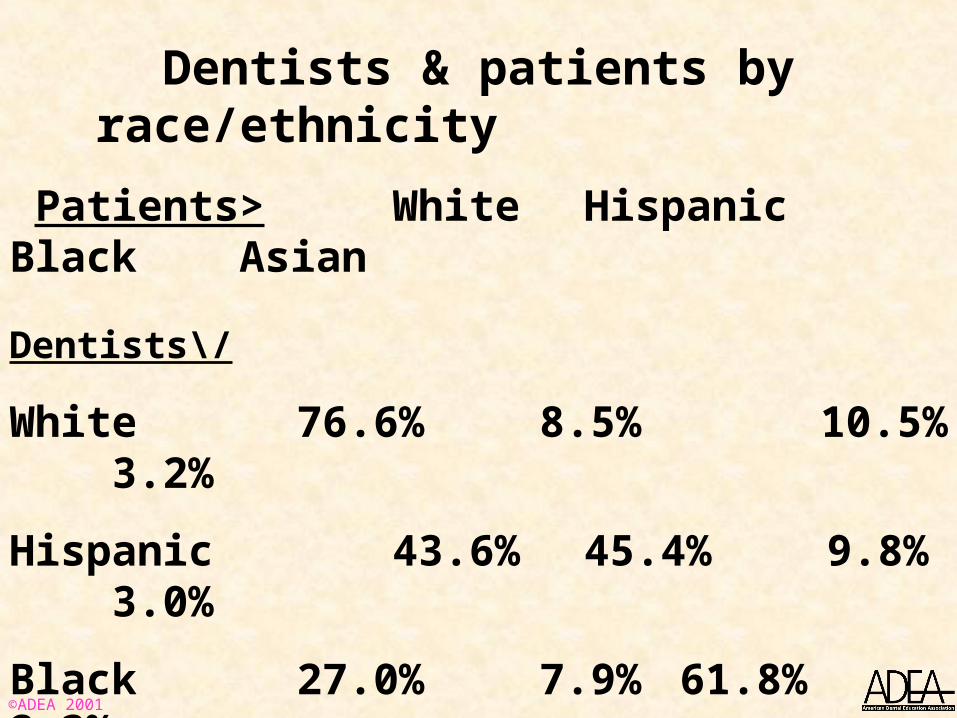
Dentists & patients by race/ethnicity
Patients> White Hispanic Black Asian
Dentists\/
White 76.6% 8.5% 10.5% 3.2%
Hispanic 43.6% 45.4% 9.8% 3.0%
Black 27.0% 7.9% 61.8% 2.3%
Asian 47.5% 14.5% 11.5% 25.1%(ADA, 2000)
©ADEA 2001
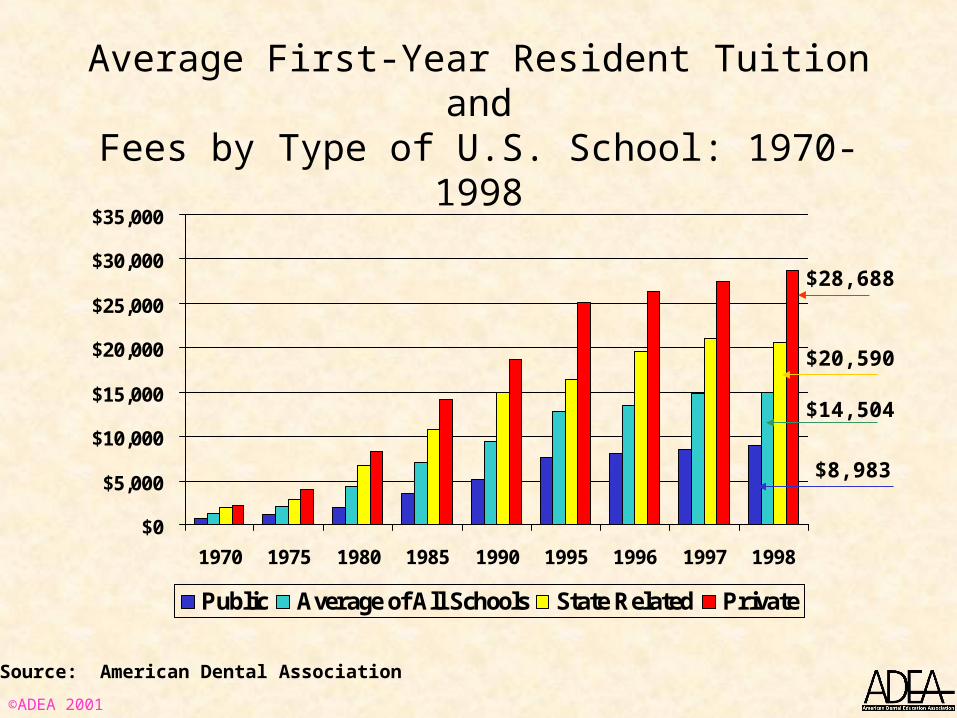
Average First-Year Resident Tuition andFees by Type of U.S. School: 1970-1998
$0
$5,000
$10,000
$15,000
$20,000
$25,000
$30,000
$35,000
1970 1975 1980 1985 1990 1995 1996 1997 1998
Public Average of All Schools State Related Private
Source: American Dental Association
$28,688
$20,590
$14,504
$8,983
©ADEA 2001
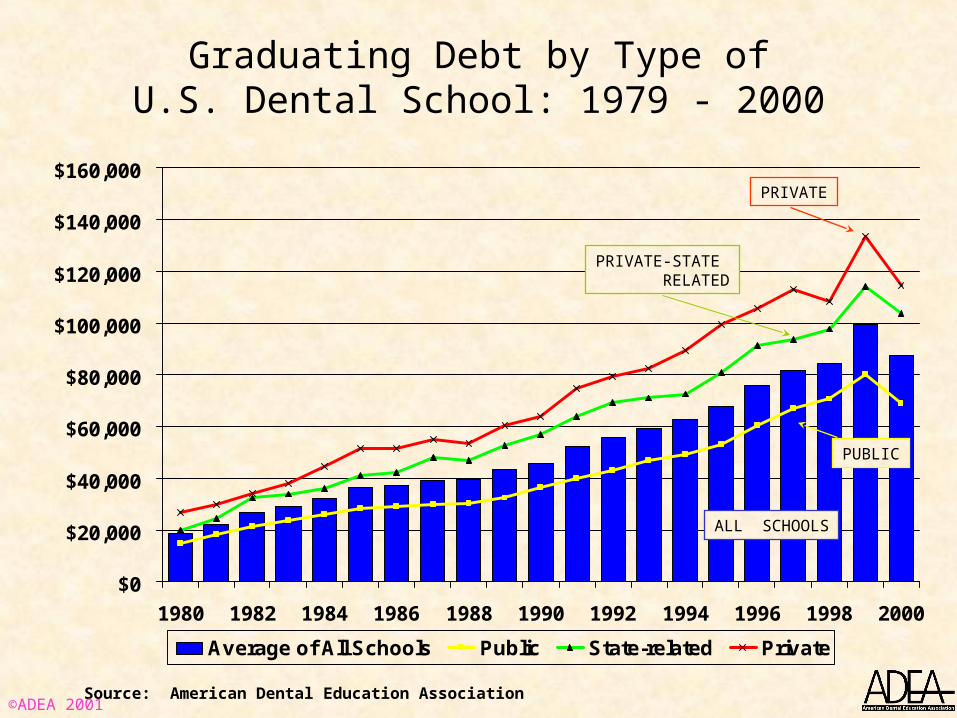
Graduating Debt by Type ofU.S. Dental School: 1979 - 2000
$0
$20,000
$40,000
$60,000
$80,000
$100,000
$120,000
$140,000
$160,000
1980 1982 1984 1986 1988 1990 1992 1994 1996 1998 2000
Average of All Schools Public State-related Private
Source: American Dental Education Association
PRIVATE
PRIVATE-STATE RELATED
PUBLIC
ALL SCHOOLS
©ADEA 2001
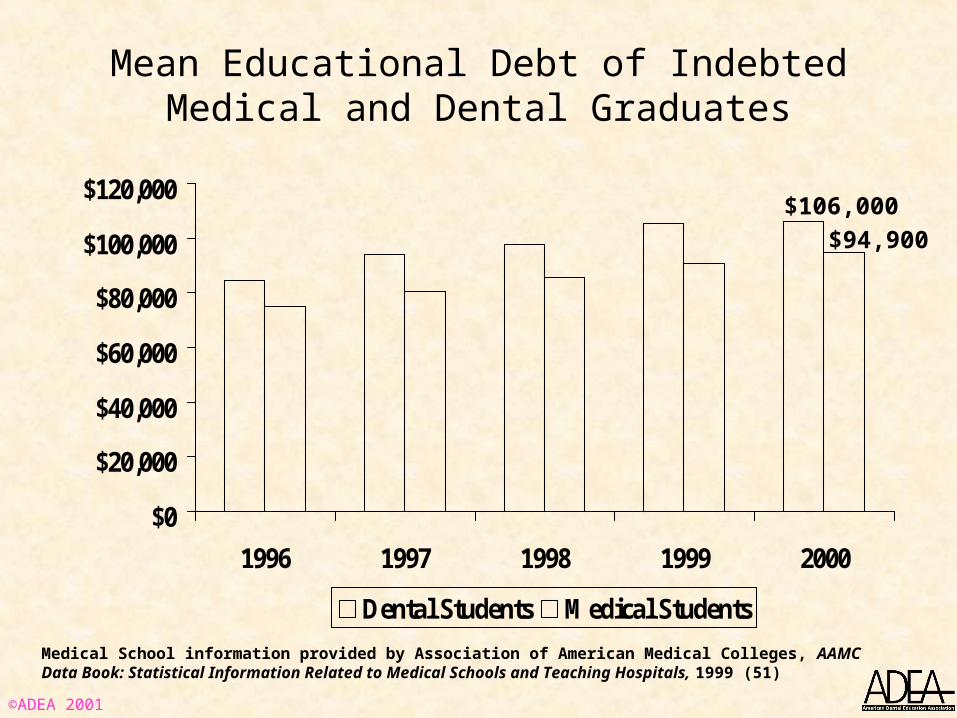
Mean Educational Debt of Indebted Medical and Dental Graduates
$0
$20,000
$40,000
$60,000
$80,000
$100,000
$120,000
1996 1997 1998 1999 2000
Dental Students Medical Students
$106,000
$94,900
Medical School information provided by Association of American Medical Colleges, AAMC Data Book: Statistical Information Related to Medical Schools and Teaching Hospitals, 1999 (51)
©ADEA 2001
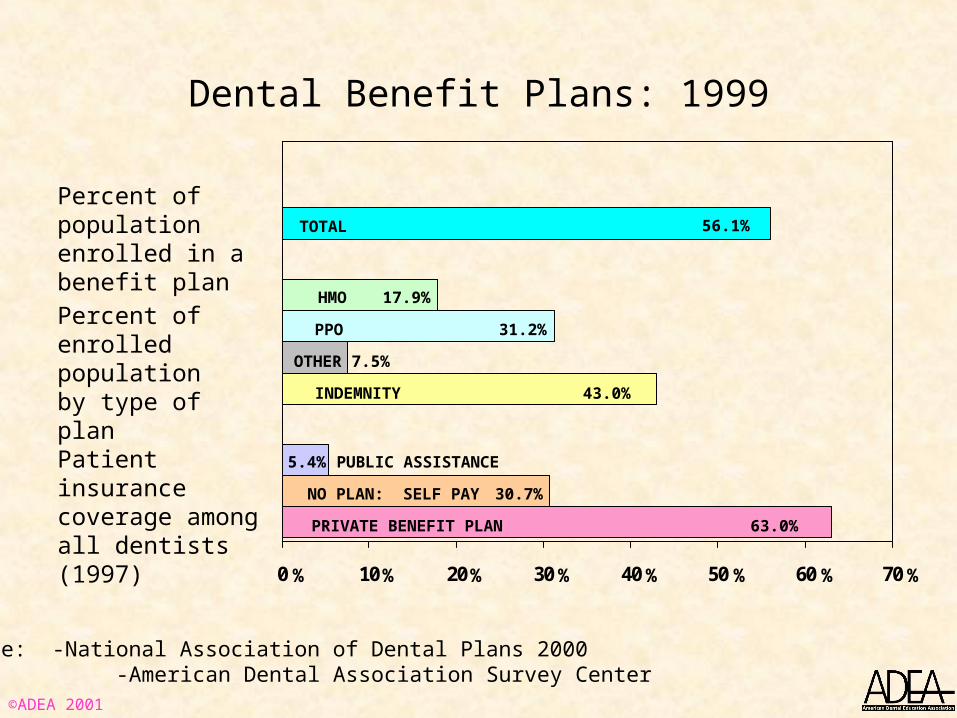
Dental Benefit Plans: 1999
0 10 20 30 40 50 60 70
Percent of population enrolled in a benefit plan
56.1%
Percent ofenrolled populationby type of plan
17.9%HMO
PPO 31.2%
OTHER 7.5%
INDEMNITY 43.0%
% % % % % % % %
Patient insurancecoverage amongall dentists (1997) PRIVATE BENEFIT PLAN 63.0%
NO PLAN: SELF PAY 30.7%
PUBLIC ASSISTANCE 5.4%
Source: -National Association of Dental Plans 2000 -American Dental Association Survey Center
TOTAL
©ADEA 2001
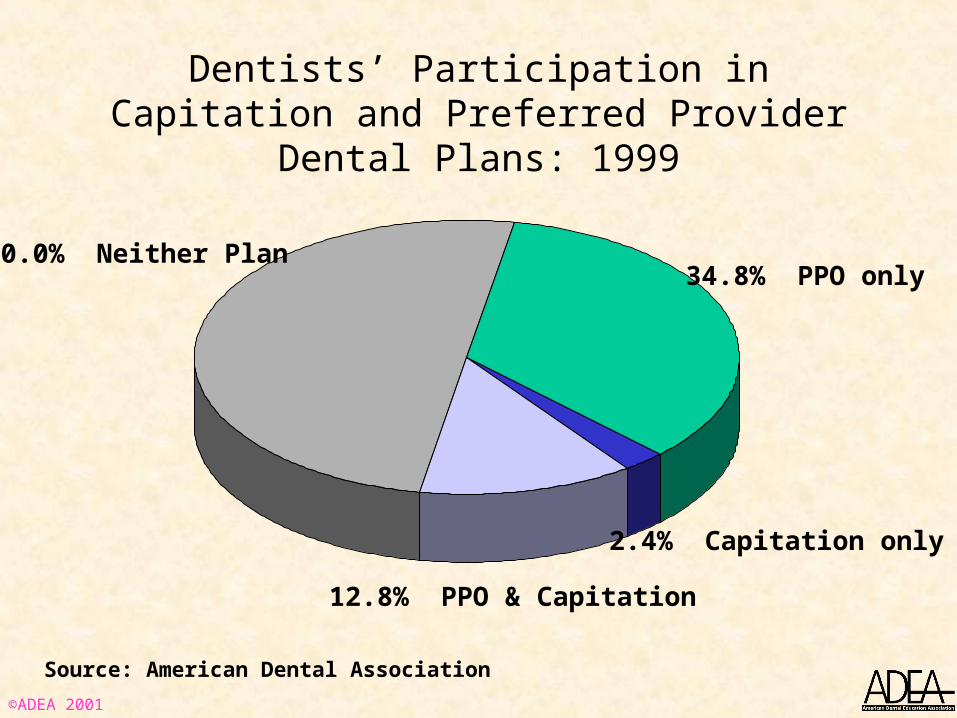
Dentists’ Participation in Capitation and Preferred Provider Dental Plans: 1999
34.8% PPO only
2.4% Capitation only
12.8% PPO & Capitation
50.0% Neither Plan
Source: American Dental Association
©ADEA 2001
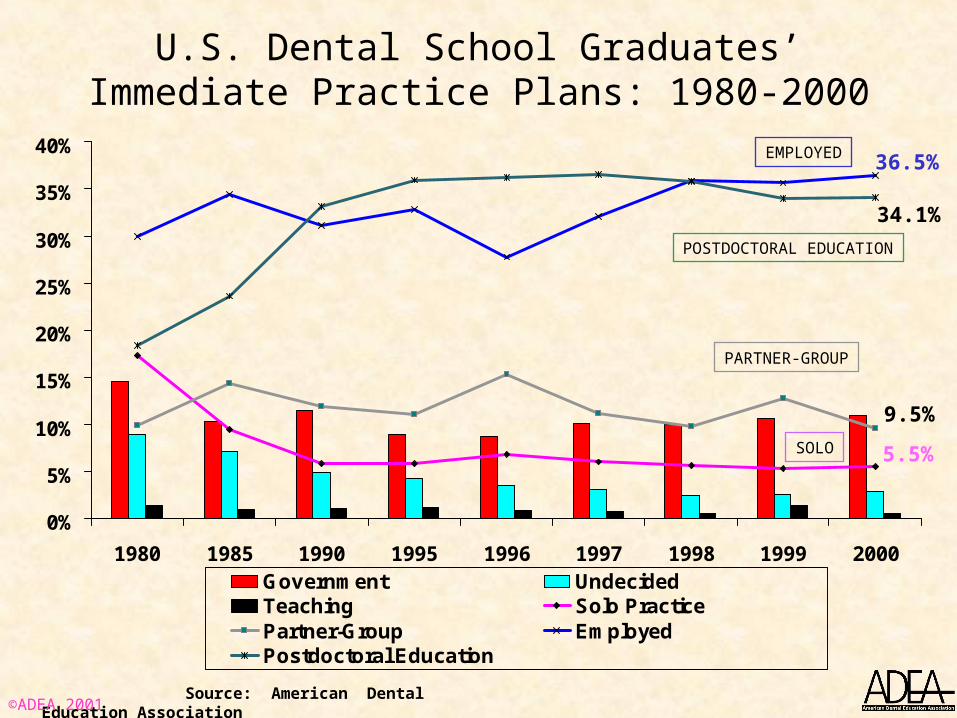
U.S. Dental School Graduates’Immediate Practice Plans: 1980-2000
0%
5%
10%
15%
20%
25%
30%
35%
40%
1980 1985 1990 1995 1996 1997 1998 1999 2000
Government UndecidedTeaching Solo Practice Partner-Group EmployedPostdoctoral Education
Source: American Dental Education Association
POSTDOCTORAL EDUCATION
EMPLOYED
PARTNER-GROUP
SOLO
36.5%
9.5%
5.5%
34.1%
©ADEA 2001
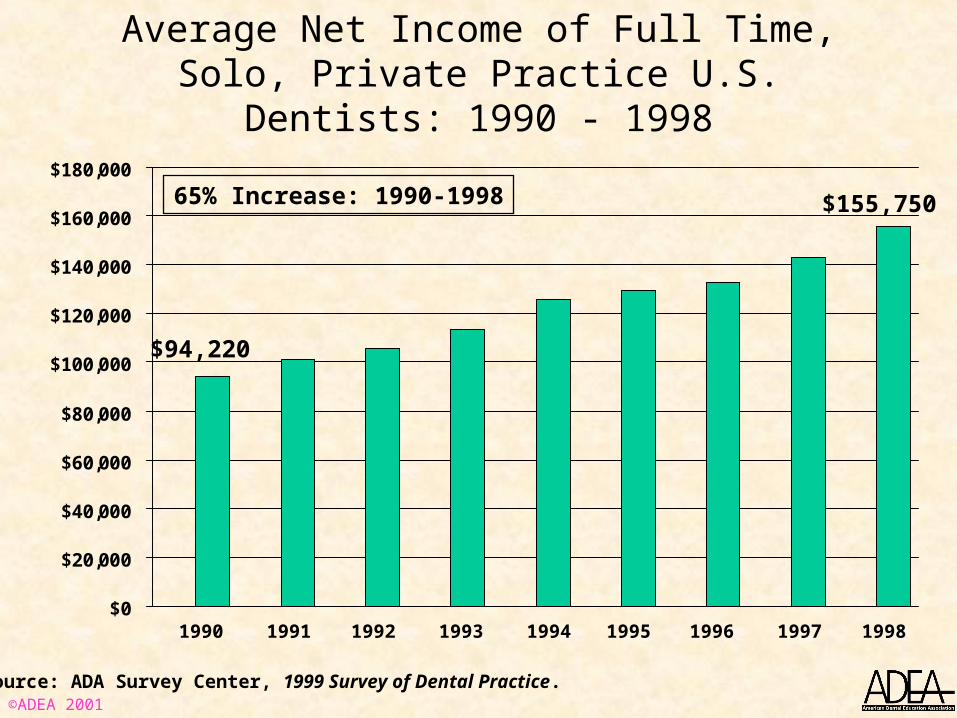
Average Net Income of Full Time, Solo, Private Practice U.S. Dentists: 1990 - 1998
$0
$20,000
$40,000
$60,000
$80,000
$100,000
$120,000
$140,000
$160,000
$180,000
Source: ADA Survey Center, 1999 Survey of Dental Practice.
65% Increase: 1990-1998
1990 1991 1992 1993 1994 1995 1996 1997 1998
$155,750
$94,220
©ADEA 2001
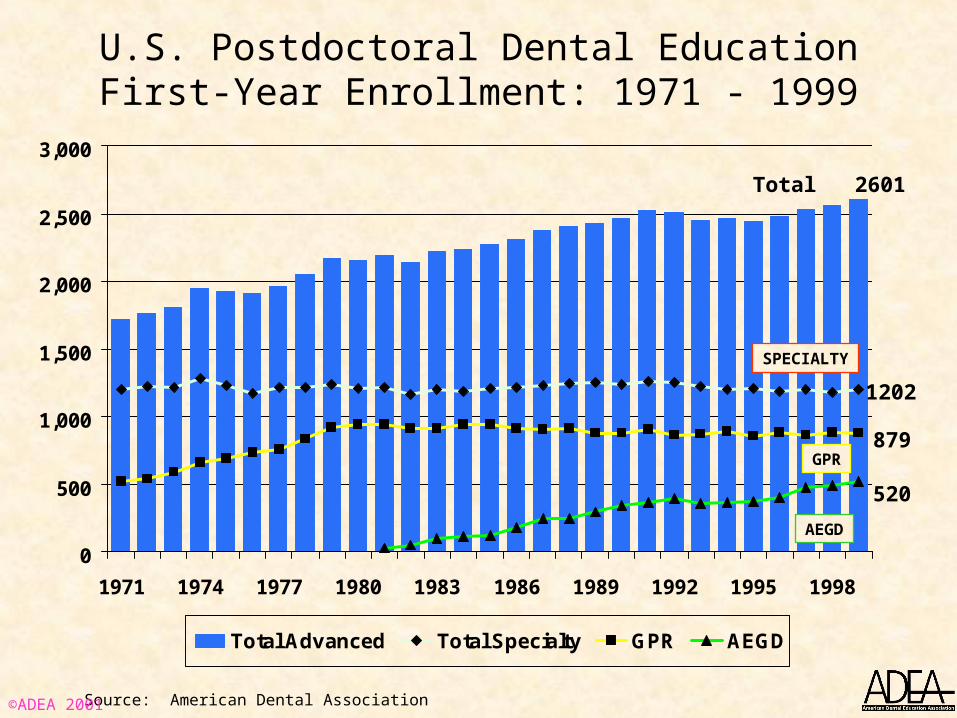
U.S. Postdoctoral Dental EducationFirst-Year Enrollment: 1971 - 1999
0
500
1,000
1,500
2,000
2,500
3,000
1971 1974 1977 1980 1983 1986 1989 1992 1995 1998
Total Advanced Total Specialty GPR AEGD
GPR
Source: American Dental Association
SPECIALTY
AEGD
Total 2601
1202
879
520
©ADEA 2001
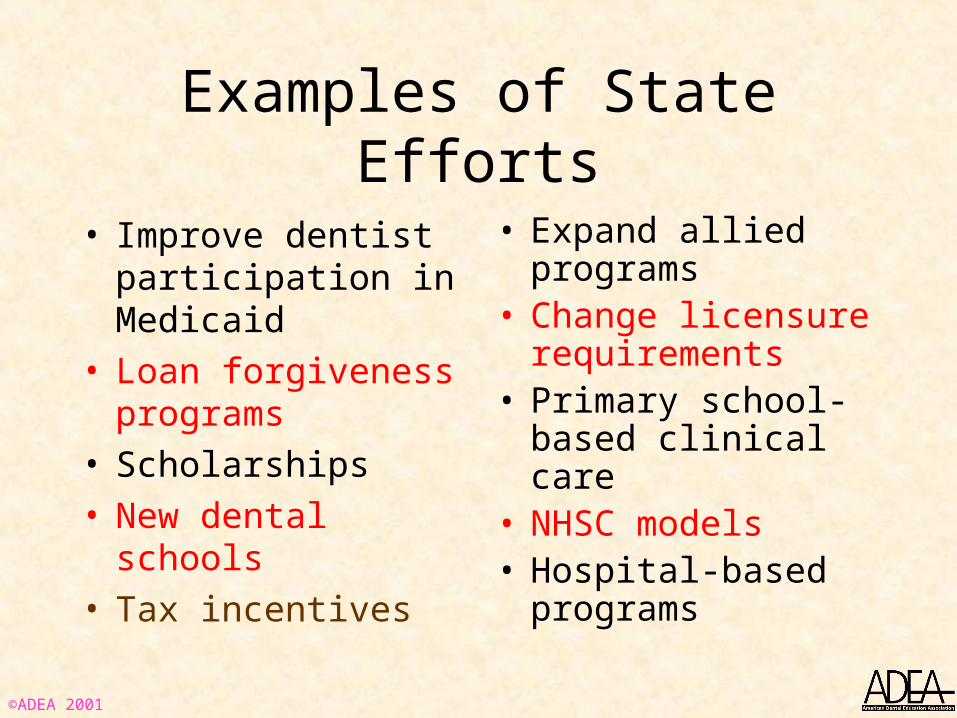
Examples of State Efforts
• Improve dentist participation in Medicaid
• Loan forgiveness programs
• Scholarships• New dental schools• Tax incentives
• Expand allied programs
• Change licensure requirements
• Primary school-based clinical care
• NHSC models• Hospital-based
programs
©ADEA 2001