Embed Size (px)
Citation preview
Nga N. Ho-Dac, Stephen J. Carson, & William L. Moore
The Effects of Positive and NegativeOnline Customer Reviews: Do BrandStrength and Category Maturity
Matter?Research has shown brand equity to moderate the relationship between online customer reviews (OCRs) andsales in both the emerging Blu-ray and mature DVD player categories. Positive (negative) OCRs increase(decrease) the sales of models of weak brands (i.e., brands without significant positive brand equity). In contrast,OCRs have no significant impact on the sales of the models of strong brands, although these models do receive asignificant sales boost from their greater brand equity. Higher sales lead to a larger number of positive OCRs, andincreased positive OCRs aid a brand’s transition from weak to strong. This creates a positive feedback loopbetween sales and positive OCRs for models of weak brands that not only helps their sales but also increasesoverall brand equity, benefiting all models of the brand. In contrast to the view that brands matter less in thepresence of OCRs, we find that OCRs matter less in the presence of strong brands. Positive OCRs functiondifferently than marketing communications in that their effect is greater for weak brands.
Keywords: online customer reviews, user-generated content, brand equity, category maturity, word of mouth
Nga N. Ho-Dac is Assistant Professor of Marketing, School of Business,Dalton State College (e-mail: [email protected]). Stephen J. Carsonis Associate Professor and David Eccles Faculty Fellow (e-mail: steve.carson@ business.utah.edu), and William L. Moore is the David EcclesProfessor of Marketing (e-mail: [email protected]), DavidEccles School of Business, University of Utah. The authors thank themembers of the reviewing team for their valuable suggestions. Address allcorrespondence to the first author. Ajay Kohli served as area editor for thisarticle.
© 2013, American Marketing AssociationISSN: 0022-2429 (print), 1547-7185 (electronic)
Journal of MarketingVol. 77 (November 2013), 37 –5337
Easy access to online customer reviews (OCRs) has ledsome observers to posit that brand names, as assurancesof product quality and performance, will lose much of
their importance in the interactive marketing environment(see, e.g., Chen 2001). This line of reasoning suggests thatcustomers will bypass marketer-influenced signals such asbrands and instead rely directly on unfiltered word ofmouth from other consumers. Because the information con-tained in OCRs does not originate with the company, it isgenerally considered highly credible and influential (Bickartand Schindler 2001). Therefore, it is possible that this long-tail perspective will hold and consumers will use OCRs tofind desired products irrespective of their brand name.However, the marketing literature offers evidence on theimportance of brand equity that suggests it is improbablethat brands will lose their value just because consumershave access to OCRs.
In this research, we investigate the effects of brandequity and OCRs on sales response in an online sellingenvironment. Of particular interest is how brand equitymoderates the relationship between OCRs and sales—thatis, whether OCRs have a greater effect on the models of
strong versus weak brands.1 This issue is not as straightfor-ward as it might seem, because different literature streamssuggest different relationships. Brand equity and marketingcommunications research has found evidence that strongbrands have greater advertising elasticities, show bettermarketing communications effectiveness, and are more pro-tected from negative information (see, e.g., Ahluwalia,Burnkrant, and Unnava 2000; Belch 1981; Dawar and Pil-lutla 2000; Hoeffler and Keller 2003; Petty and Krosnick1995; Srivastava and Shocker 1991). If consumers respondto OCRs as they do to advertising, strong brands shouldbenefit more from positive OCRs and be hurt less by nega-tive OCRs.
However, OCRs differ from marketer-sponsored commu-nications in that they are more credible (Cheong and Morrison2008; Hung and Li 2007). Credibility suggests an active formof processing in which consumers evaluate the reliability ofthe source and its independence from the interests of themarketer. Viewed through the lens of signaling theory, thekey issue is how the OCR-provided signal compares withthat of the brand. The brand signaling literature (Erdem andSwait 1998; Montgomery and Wernerfelt 1992) has suggestedthat both positive and negative OCRs affect weak brandsmore; positive OCRs provide a degree of credibility thatweak brands cannot engender through company-sponsoredcommunications, and negative reviews are evaluated with-out the compensating signal a strong brand provides.
We also investigate how the effects of OCRs on strongand weak brands change across emerging and mature prod-
1We use the term “strong brand” to refer to brands with signifi-cant positive brand equity.
uct categories. On the one hand, mature categories featurelarge cumulative numbers of OCRs that reduce uncertaintyand increase the credibility of the information they contain.Therefore, it is possible that strong brands are less resistantto the influence of OCRs in mature categories. On the otherhand, as categories mature, consumers learn more about theperformance of brands within the category. Because brandsstore such information, the category-specific equity of suc-cessful brands tends to be stronger in mature categories,adding to the resilience of strong brands relative to OCRs.To examine this issue, we estimate models in both theemerging Blu-ray and mature DVD player categories. Withthe exception of maturity (at the time of data collection),these categories are similar in terms of the mix of strongand weak brands, the number of models, price, and so on.
The emerging research on online word of mouth(eWOM) has not provided any direct evidence about howbrand equity moderates the effect of OCRs or how this rela-tionship changes over time. Much of the literature has usedcategories such as books, music, video games, and movies,in which many products do not have preexisting brandequity (e.g., Chen, Wu, and Yoon 2004; Chevalier and May-zlin 2006; Dellarocas, Zhang, and Awad 2007; Karniouch-ina 2011; Li and Hitt 2008; Liu 2006). These studies alsoprovide similar recommendations for all products in a cate-gory without discrimination.
Zhu and Zhang (2010) provide an exception to thispractice in their examination of the interaction of OCRs andpopularity on the sales of individual video games. They usetwo definitions of popularity. First, due to the typical pre-cipitous sales decline over time, a game is defined as popu-lar if it has been on the market for less than four months.Second, a popular game is one with higher sales than themean of all games in a given month. Under both definitions,the authors find that less popular games benefit more fromOCRs than do popular games.
In contrast, we examine the interaction between OCRsand brand equity, which we operationalize as the impact onsales of models of a brand that cannot be explained by otherfactors such as advertising, price, OCRs, competition, mer-chants, or model-specific effects. Brand equity differs fun-damentally from the popularity of an individual model inthat it is defined at the level of the product line. Thisenables us to consider the impact of OCRs not just on a spe-cific model but on all models in the product line, becausereviews for one model spill over to the brand itself. In addi-tion, whereas other variables (e.g., price, promotions) caninfluence popularity in the short run, brand equity is definedafter accounting for such factors and is therefore relativelyrobust. This makes it somewhat easier for managers togauge with foresight when planning, particularly early inthe product life cycle.
Importantly, we expect our focus on brand equity togenerate novel substantive implications for managers oper-ating in contexts in which preexisting brand equity is rele-vant—for example, when managing product line extensionswithin a category, brand extensions from closely relatedproduct categories, or model updates. According to the per-spective we develop in this research, OCRs can affect evennewly introduced models and models with high current or
38 / Journal of Marketing, November 2013
expected sales as long as consumers require reassurancebecause of a weak existing brand. In contrast, models ofstrong brands are affected less, even if they are poor indi-vidual sellers.
The results of our study indicate that brand equity mod-erates the relationship between OCRs and sales in bothemerging and mature categories. Positive (negative) OCRsincrease (decrease) the sales of models of weak brands butdo not have a significant effect on the sales of models ofstrong brands. However, these models do receive a signifi-cant sales boost from being part of a strong brand. This isimportant because positive OCRs for all models or for justthe leading model help build the equity of weak brands.Combined with the finding that more sales lead to a largernumber of positive (but not negative) OCRs, this creates apositive feedback loop between sales and positive OCRs formodels of weak brands. Thus, positive OCRs help modelsof weak brands penetrate the market while simultaneouslyincreasing the equity of the brand. This loop does not existfor the models of already strong brands, because they donot benefit to the same degree from positive reviews.
More broadly, in contrast to the view that brands matterless in the presence of OCRs, we find that OCRs actuallymatter less for strong brands. Online customer reviewsincrease the sales of models of weak brands and help weakbrands become strong, but they do not affect brands to thesame degree after they become strong. The sales boost thatmodels receive from their association with a strong brandfurther indicates that brand equity is extremely important,even when the effect of model-level OCRs is controlled. Inaddition, the findings show that positive OCRs function dif-ferently than marketing communications in that their effectis greater for weak brands than for strong brands. Finally,we find weaker effects of negative reviews than positivereviews for both the focal and competing models andobserve that the number of both positive and negativeOCRs first increases and then decreases over time.
As we anticipated, our results lead to a very different setof managerial implications from Zhu and Zhang (2010).Whereas their results suggest that OCRs are more beneficialfor unpopular niche games and for games whose sales havefallen significantly from their peak, ours suggest a clear rolefor OCRs early in the product life cycle for all models ofweak brands. Managers of weak brands should focus ongenerating positive OCRs for both their direct effect on salesof the model and their indirect effect on building brandequity. These paths give weak brands a way to competeother than through traditional marketing communications.
In contrast to weak brands, additional positive OCRs donot further benefit the models of strong brands. Therefore,managers of these brands should not necessarily follow thesame strategy used for weaker brands or even do so to thesame degree. Instead, strong brands should pursue actionsto build brand equity more directly (e.g., through advertis-ing) rather than focus too narrowly on OCRs. Zhu andZhang’s (2010) results are more appropriate for movies,video games, books, and so on, for which there is not astrong preexisting brand component and sales often peak atthe introduction and decline from there. In contrast, our
results are more appropriate for products in a branded prod-uct line that have more traditional sales trajectories.
The remainder of the article is organized as follows. Inthe next section, we explore arguments in the brand signal-ing literature to hypothesize interactions between brandstrength and OCRs in predicting sales response. We thendescribe the data and the empirical model. This is followedby our results and a discussion of implications for theoryand practice.
HypothesesAccording to the brand signaling literature, uncertaintyabout product quality and performance creates risk (Erdem,Swait, and Valenzuela 2006). To cope with this risk, cus-tomers rely on signals to indicate product quality and per-formance when purchasing (Shimp and Bearden 1982). Pre-vious research has shown that marketing-mix elements suchas price (Stiglitz 1989; Tellis and Wernerfelt 1987), adver-tising (Kirmani 1990; Nelson 1974), and warranty (Bould-ing and Kirmani 1993) serve as credible signals. Scholarshave also found brands to be especially strong and effectivesignals of product quality (Erdem and Swait 1998; Rao, Qu,and Ruekert 1999).
When confronted with reviews written by other users, itis likely that consumers will find such reviews en masse tobe a highly credible source of information on product qual-ity and performance. Although some believe OCRs to bemore credible than marketing communications (Cheong andMorrison 2008; Hung and Li 2007), it is not clear whetherOCRs are more or less credible than brand equity becausereviews are written by individual people with incompleteinformation and varying motivations. What is known is thatstronger brands provide more credible signals than weakerbrands because they are more susceptible to the loss ofestablished brand equity (Erdem and Swait 1998) andfuture sales and profit (Wernerfelt 1988). Thus, the OCRsignal tends to overshadow the limited brand signal forweak brands, whereas for strong brands, both signals pro-vide a degree of credible information. As a result, positiveOCRs should have a larger effect on weak brands, whichlack a credible brand signal, than strong brands, whichalready provide substantial assurance. Positive OCRs createa degree of credibility that weaker brands cannot create ontheir own.
In addition, signals such as brand equity are importantin decision making under uncertainty—that is, in theabsence of concrete evidence about product quality (Mont-gomery and Wernerfelt 1992). Whereas positive reviews formodels of strong brands largely reinforce consumer beliefsabout these models and do little to reduce uncertainty, posi-tive reviews for models of weak brands not only help thesemodels directly but also reduce the level of uncertaintyabout them. This tends to decrease the overall level ofuncertainty facing consumers in the category, reducing theeffect of strong brands and further benefiting weakerbrands.
Finally, marketing communications may be more effec-tive for stronger brands because the brand lends a degree ofcredibility to the advertisement. As we have noted, extend-
The Effects of Positive and Negative Online Customer Reviews / 39
ing this view to OCRs would suggest that positive OCRsare more effective for strong brands. However, the credibil-ity lent by a strong brand is less necessary for OCR effec-tiveness because the reviews themselves have inherentcredibility. Therefore, the advantage associated with strongbrands with respect to marketing communications isunlikely to hold in the context of OCRs. Jointly, these argu-ments suggest that positive OCRs should benefit weakbrands more than strong brands.
H1: Positive OCRs have a stronger positive effect on the prod-ucts of weak brands than those of strong brands.
Negative OCRs should also affect weak brands morethan strong brands. The brand equity and marketing com-munications literature streams have found that strongbrands are more protected from negative information(Ahluwalia, Burnkrant, and Unnava 2000; Dawar and Pil-lutla 2000; Petty and Krosnick 1995; Srivastava andShocker 1991). Similarly, from a signaling perspective,strong brands possess a highly credible offsetting signal tohelp overcome and buffer negative reviews. Weak brands,in contrast, lack a compensating signal; thus, negativeinformation affects them to a greater extent.
In the case of negative reviews, the branding/communi-cations perspectives lead to the same prediction as that ofthe signaling perspective. This is because both negativeOCRs and more general types of negative informationcome from sources independent of the brand. Consequently,both tend to be credible (provided that they do not comefrom obviously nefarious sources) and require a strongbrand to counter their effect.
H2: Negative OCRs have a stronger negative effect on theproducts of weak brands than those of strong brands.
We chose two similar product categories that differ interms of maturity to examine these relationships across lifecycle stages. As a product category matures and the numberof cumulative OCRs increases, there will typically be a cor-responding reduction in uncertainty in the category as wellas an increase in the credibility of the information containedin the reviews. Whereas people may attribute a singlereview to the idiosyncratic experiences or motivations ofthe reviewer, large numbers of consistent reviews will bemore reliable. In addition, consumers become more knowl-edgeable posters and consumers of reviews over time. Thus,the credibility and impact of the information contained inOCRs tends to increase as they accumulate, and brandsthemselves become less influential as uncertainty in thecategory decreases. Therefore, it is possible that strongbrands will not be as resistant to the influence of OCRs inmore mature categories.
However, as categories mature, consumers gain addi-tional knowledge about the performance and quality of thebrands within the category. This brand equity is in large partcategory specific because most brands are stronger in somecategories than others. For example, Apple is stronger insmartphones than personal computers, and Dodge is strongerin trucks than cars. In an emerging category such as Blu-rayplayers, initial brand equity will be based on higher-levelcategories (e.g., consumer electronics) or related product
categories (e.g., DVD players) and will be somewhat uncer-tain. Over time, it will become more concrete and basedmore on the focal category. Because brands serve as reposi-tories of product information, the category-specific equityassociated with successful brands should become strongeras consumers learn more about the performance of thebrand in the category. Thus, the relative advantage of strongbrands will tend to increase over time, balancing out anypotential increase in the credibility of OCRs. This leads usto hypothesize that strong brands will maintain their resis-tance to the influence of (both positive and negative) OCRsin maturity and that OCRs will affect strong brands no moreat maturity than earlier in the life cycle. Therefore, we gen-eralize H1 and H2 across categories.
H3: The moderating effects of brand equity generalize acrossboth the emerging and mature product categories.
Data, Models, and EstimationDataWe selected the Blu-ray player category because it wasemerging at the time of data collection and seemed to havea variety of strong and weak brands, including thoseextended from closely related product categories. Weselected DVD players as a closely matched mature categorywith similar numbers of models and brands. We collecteddata from Amazon.com (Amazon hereinafter), with theexception of advertising data, which we purchased from theNielsen Company for the same time period. Data collectionbegan shortly after Amazon began selling Blu-ray players.
We collected sales rank, OCRs, price, and other data forall models in the Blu-ray player category weekly for 47weeks, from November 1, 2008, to September 21, 2009.This sample consists of 2,324 observations in an unbal-anced panel structure of 78 individual models and 47 peri-ods. We observed a total of 3,341 OCRs; 791 were postedin or before the first week and an average of 55.4 wereposted in each of the following weeks. Although there wasconsiderable fluctuation, the number of additional OCRsdecreased by an average of .73 per week. The productselection differed from week to week because some modelswere introduced or discontinued during the data collectionperiod. We excluded used, refurbished, and bundled mod-els. Of the observations in the sample, 27.19% were modelsoffered by Amazon; the rest were listed on Amazon but soldby other merchants.
We collected data from the DVD player category fromNovember 1, 2008, to June 6, 2009. This sample consists of1,080 observations in an unbalanced panel structure of 51models and 32 weeks. We observed a total of 1,664 OCRs;971 posts were made in or before the first week, and anaverage of 22.4 were added in each of the following weeks.However, 11 models were added (or returned) to Amazonduring the second week, and they accounted for 324 of the328 reviews that week. After the first two weeks, an aver-age of 13.5 OCRs were posted each week, and there was nosignificant time trend.
40 / Journal of Marketing, November 2013
In both categories, price data include the list price plusshipping and handling costs. If more than one merchantsold a single model, we used the lowest price charged for anew model. Following the practice of Amazon, and notingthat a three-star rating is below the mean of our data (3.88for Blu-ray players and 3.62 for DVD players), we classi-fied three-star reviews as negative. Therefore, customerreview measures include the number of positive reviews(four or five stars) and the number of negative reviews(one, two, or three stars). We check the robustness of thisclassification subsequently.
Even though sales data are not accessible, Amazon dis-plays (current) sales ranks for both categories. Therefore,we use the inverse sales rank for each model as an indicatorof sales response. Previous research has found that formany product categories, the relationship between salesrank and sales can be described by a Pareto distribution(i.e., the 80/20 rule), which means that the relationshipbetween ln(sales) and ln(sales rank) is approximately linear;that is, ln(sales) ª a + b ¥ ln(sales rank). Scholars havefound this linear relationship to hold for products such asbooks, software, yogurt, women’s clothing, and electronicproducts (see, e.g., Brynjolfsson, Hu, and Simester 2011;Brynjolfsson, Hu, and Smith 2003; Ghose and Sundararajan2006; Goolsbee and Chevalier 2002; Prasso 2011; Rosen-thal 2005). Although we did not run a purchasing experi-ment to verify this assumption in the two categories, theconcentration of products by brand (Twice.com 2009) andthe concentration of OCRs in the data suggest that it is rea-sonable to assume a linear relationship.
Assuming that the Pareto relationship holds approxi-mately, the only differences between a linear model usingln(sales) and one using ln(sales rank) are that the estimatedcoefficients and their standard errors are scaled by a con-stant and the estimated intercept is shifted by another con-stant. Neither of these differences changes the signs or sig-nificance of our coefficients. We use the negative of ln(salesrank) or ln(1/sales rank) in subsequent equations to makethe signs of the coefficients easier to interpret (i.e., positivecoefficients indicate a greater sales response).2
The Nielsen Company provided weekly advertisingexpenditures for brands in the Blu-ray and DVD playercategories from October 1, 2008, to October 3, 2009. Paidadvertisements were placed in newspapers and magazinesand on television, radio, and the Internet. Samsung andToshiba incurred more than 70% of the total $10 million inadvertising spending. LG was the only other company tospend more than $500,000. Table 1 presents the descriptivestatistics.
2The use of ordinal scales with more than four values (e.g., five-point Likert scales) as interval data in regressions does not seem toaffect Type I and Type II errors dramatically and is the norm incontemporary social science. The numbers of ordinal values are 72and 46 in the Blu-ray and DVD data, respectively. Estimatingordinal regressions with 71 and 45 logit (or probit) functions isimpractical. Many articles in major journals have set a precedentby analyzing Amazon rank data using regression techniques (e.g.,Archak, Ghose, and Ipeirotis 2001; Brynjolfsson, Hu, and Smith2003; Chevalier and Goolsbee 2003; Chevalier and Mayzlin 2006;Ghose and Sundararajan 2006; Sun 2012).
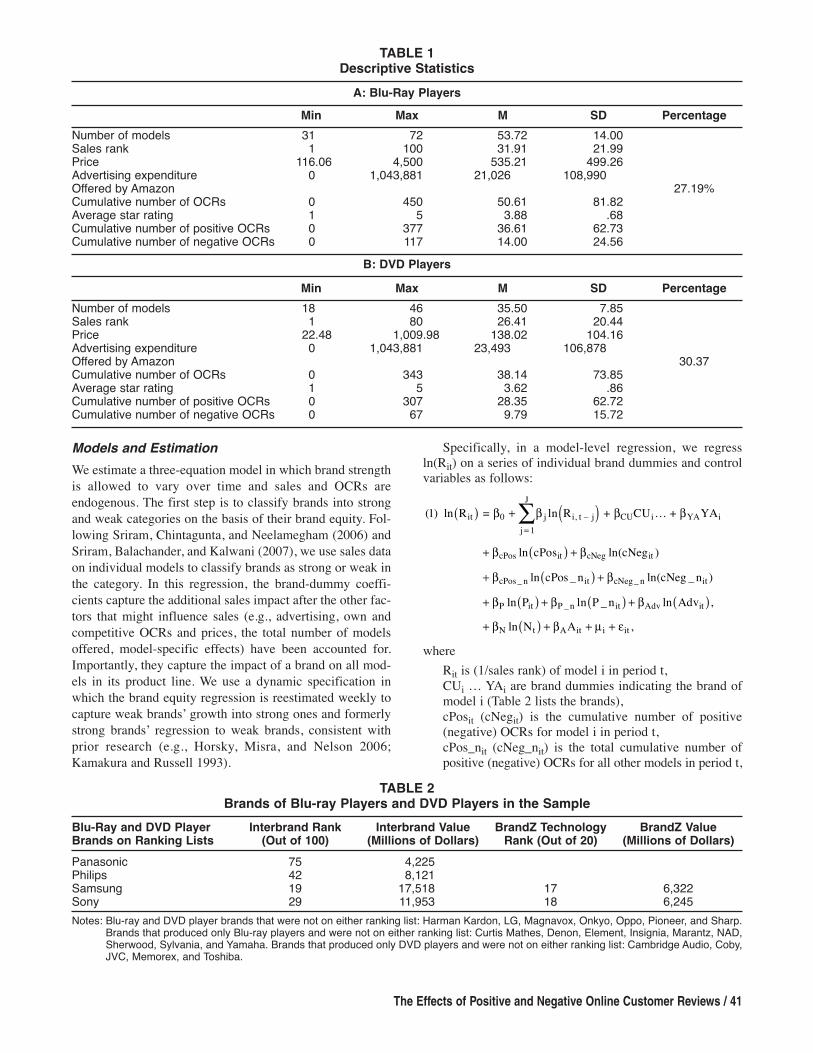
Models and EstimationWe estimate a three-equation model in which brand strengthis allowed to vary over time and sales and OCRs areendogenous. The first step is to classify brands into strongand weak categories on the basis of their brand equity. Fol-lowing Sriram, Chintagunta, and Neelamegham (2006) andSriram, Balachander, and Kalwani (2007), we use sales dataon individual models to classify brands as strong or weak inthe category. In this regression, the brand-dummy coeffi-cients capture the additional sales impact after the other fac-tors that might influence sales (e.g., advertising, own andcompetitive OCRs and prices, the total number of modelsoffered, model-specific effects) have been accounted for.Importantly, they capture the impact of a brand on all mod-els in its product line. We use a dynamic specification inwhich the brand equity regression is reestimated weekly tocapture weak brands’ growth into strong ones and formerlystrong brands’ regression to weak brands, consistent withprior research (e.g., Horsky, Misra, and Nelson 2006;Kamakura and Russell 1993).
The Effects of Positive and Negative Online Customer Reviews / 41
Specifically, in a model-level regression, we regressln(Rit) on a series of individual brand dummies and controlvariables as follows:
whereRit is (1/sales rank) of model i in period t,CUi … YAi are brand dummies indicating the brand ofmodel i (Table 2 lists the brands),cPosit (cNegit) is the cumulative number of positive(negative) OCRs for model i in period t,cPos_nit (cNeg_nit) is the total cumulative number ofpositive (negative) OCRs for all other models in period t,
(1) ln R = ln R + CU … + YA
(1) ln R ln cPos ln(cNeg )(1) ln R ln cPos _ n ln(cNeg _ n )(1) ln R ln P ln P _ n ln Adv ,(1) ln R ln N A ,
it 0 jj 1
Ji, t – j CU i YA i
it cPos it cNeg it
it cPos _ n it cNeg _ n it
it P it P _ n it Adv it
it N t A it i it
∑ ( )( )
( ) ( )
( ) ( )
( ) ( ) ( ) ( )( ) ( )
β + β β β
+ β + β
+ β + β
+ β + β + β
+ β + β + µ + ε
=
TABLE 1Descriptive StatisticsA: Blu-Ray Players
Min Max M SD PercentageNumber of models 31 72 53.72 14.00Sales rank 1 100 31.91 21.99Price 116.06 4,500 535.21 499.26Advertising expenditure 0 1,043,881 21,026 108,990Offered by Amazon 27.19%Cumulative number of OCRs 0 450 50.61 81.82Average star rating 1 5 3.88 .68Cumulative number of positive OCRs 0 377 36.61 62.73Cumulative number of negative OCRs 0 117 14.00 24.56
B: DVD PlayersMin Max M SD Percentage
Number of models 18 46 35.50 7.85Sales rank 1 80 26.41 20.44Price 22.48 1,009.98 138.02 104.16Advertising expenditure 0 1,043,881 23,493 106,878Offered by Amazon 30.37Cumulative number of OCRs 0 343 38.14 73.85Average star rating 1 5 3.62 .86Cumulative number of positive OCRs 0 307 28.35 62.72Cumulative number of negative OCRs 0 67 9.79 15.72
TABLE 2Brands of Blu-ray Players and DVD Players in the Sample
Blu-Ray and DVD Player Interbrand Rank Interbrand Value BrandZ Technology BrandZ Value Brands on Ranking Lists (Out of 100) (Millions of Dollars) Rank (Out of 20) (Millions of Dollars)Panasonic 75 4,225Philips 42 8,121Samsung 19 17,518 17 6,322Sony 29 11,953 18 6,245Notes: Blu-ray and DVD player brands that were not on either ranking list: Harman Kardon, LG, Magnavox, Onkyo, Oppo, Pioneer, and Sharp.
Brands that produced only Blu-ray players and were not on either ranking list: Curtis Mathes, Denon, Element, Insignia, Marantz, NAD,Sherwood, Sylvania, and Yamaha. Brands that produced only DVD players and were not on either ranking list: Cambridge Audio, Coby,JVC, Memorex, and Toshiba.
Pit (P_nit) is the price of model i (the average price of allother models) in period t,Advit is the advertising expenditure on the brand associ-ated with model i in period t,Nt is the total number of models offered by Amazon inperiod t,Ait is a dummy indicating whether model i was offeredby Amazon (Ait = 1) or by another merchant (Ait = 0) attime t,i is the time-invariant, model-specific effect that cap-tures differences such as quality and features (e.g.,Internet and Wi-Fi capability) across the models of abrand, andit is an idiosyncratic error.
It is possible that unobserved product characteristics (e.g.,product quality) influence both sales and OCRs, so ln(cPosit)and ln(cNegit) may be correlated with the model-specificeffect i. In addition, a shock in sales rank for a model maylead to a change in the cumulative number of OCRs, soln(cPosit) and ln(cNegit) may be correlated with it.
These two possible endogeneity problems prevent the useof random-effects estimation of Equation 1, which requiresthe assumption that all explanatory variables are strictlyexogenous with respect to the individual effects (Mundlak1978). Moreover, fixed-effects estimation removes all time-invariant effects, making it impossible to estimate the brandequities. Therefore, we follow an approach suggested byHausman and Taylor (1981): we use time-demeaned (i.e.,mean-centered within model) values of ln(cPosi,t – 1) andln(cNegi,t – 1) as instruments to ln(cPosit) and ln(cNegit) toestimate Equation 1 with a random-effects estimation method.The time-demeaned values of ln(cPosi, t – 1) and ln(cNegi,t – 1)are valid instruments because they are orthogonal to both themodel-specific effect i and the idiosyncratic error it whilebeing correlated with the associated endogenous variables.
After we have determined the strong brands, we use thefollowing model-level equation to estimate the main andinter action effects of OCRs and brand equity on model salesrank:
where, in addition to the previously defined variables, Bit isa strong-brand dummy (Bit = 1 if the brand of model i issignificantly positive at period t, which we estimate fromEquation 1 using the data in the first t – 1 periods, and Bit =0 otherwise).
As in Equation 1, ln(cPosit) and ln(cNegit) may be cor-related with both i and it, so we cannot use random-effects methods. However, unlike Equation 1, we are notinterested in time-invariant variables in Equation 2, so we
∑ ( )( ) ( )
( ) ( ) ( )
( ) ( ) ( )
( ) ( ) ( ) ( )
( ) ( ) ( )
β + β + β
+ β + β + β ×
+ β × + β
+ β + β + β
+ β + β + β + µ + ε
=
(2) ln R = ln R ln cPos
(2) ln R ln cNeg B B ln cPos(2) ln R B ln cNeg ln cPos _ n(2) ln R ln cNeg _ n ln Adv ln P(2) ln R ln P _ n ln N A ,
it 0 jj 1
Ji, t – j cPos it
it cNeg it B it BcPos it it
it BcNeg it it cPos _ n it
it cNeg _ n it Adv it P it
it P _ n it N t A it i it
42 / Journal of Marketing, November 2013
can use an estimation method suggested by Arellano andBond (1991) that enables us to use more instruments. Thefirst step is to first-difference the model to eliminate all ofthe model-specific effects, i. Thus, Equation 2 becomes
Then, we use lags of ln(cPosit), ln(cNegit), Bit ¥ ln(cPosit),and Bit ¥ ln(cNegit) up to t – 2 and lags of ln(Ri,t – j) up to t –j – 1 as instruments for their first-differences, ln(cPosit),ln(cNegit), [Bit ¥ ln(cPosit)], [Bit ¥ ln(cNegit)], andln(Ri,t – j), respectively, to perform a generalized methodof moments estimation of Equation 2¢. These lags are validinstruments because they are uncorrelated with it whilethey are correlated with the first-differences of the endoge-nous variables.
This method yields a consistent estimation of Equation 2.Because the coefficients are the same in Equations 2 and 2¢,the first-differencing can be ignored when interpreting thecoefficients. Although both first-differencing and a fixed-effects transformation can eliminate the model-specificeffects i, we use first-differencing because it involves onlydata in periods t and t – 1; thus, we can use all data fromperiod 1 up to period t – 2 as instruments. A fixed-effectstransformation uses the data from all time periods, so it ren-ders all lags useless as instruments (for mathematicaldetails, see Nickell 1981; Roodman 2006). Specifically, afixed-effect transformation of ln(Rit) (i.e., mean-centeringwithin each model) involves the value of ln(Rit) in all peri-ods (in the model mean calculation), which makes the errorterm correlated with all the lags of ln(cPosit) and ln(cNegit).
Because research has found that an increase in sales willlead to the posting of more OCRs (Duan, Gu, and Whinston2008a, b), we use Equations 3 and 4 to examine the effectsof sales rank on the number of positive and negative OCRsas follows:
where, in addition to the previously defined variables,
(2 ) ln R = ln R ln cPos
(2 ) ln R ln cNeg B
(2 ) ln R B ln cPos(2 ) ln R B ln cNeg ln cPos_n(2 ) ln R ln cNeg _ n ln Adv(2 ) ln R ln P ln P_ n ln N(2 ) ln R A .
it jj 1
Ji, t – j cPos it
it cNeg it B it
it BcPos it it
it BcNeg it it cPos _ n it
it cNeg _ n it Adv it
it P it P _ n it N t
it A it it
∑ ( )
[ ][ ] ( )
( )
( ) ( )
( ) ( )
( ) ( )
( ) ( )
( ) ( ) ( )
( ) ( ) ( )( )
′ ∆ β ∆ + β ∆
′ ∆ + β ∆ + β ∆
′ ∆ + β ∆ ×
′ ∆ + β ∆ × + β ∆
′ ∆ + β ∆ + β ∆
′ ∆ + β ∆ + β ∆ + β ∆
′ ∆ + β ∆ + ∆ε
=
(3) ln Pos = ln(Pos ) ln R B
ln d ln d , and
lit 0 l
1
Li, t – l R it B it
d it d2 it2
i it
∑
[ ]
( ) ( )
( ) ( )
α + α + α + α
+ α + α + η + ν
=
∑ ( )
[ ]
( ) ( )
( ) ( )
γ + γ + γ
+ γ + γ + γ + π + ξ
=
(4) ln Neg = ln Neg ln R
B ln d ln d ,
it 0 mm 1
Mi, t – m R it
B it d it d2 it2
i it
Posit (Negit) is the number of positive (negative) OCRsgenerated for model i in period t,dit is the listed duration of model i on Amazon untilperiod t,i and i are time-invariant model-specific effects, and it and it are idiosyncratic errors.As previously, it is possible that unobserved product
characteristics influence both sales and OCRs, so ln(Rit) maybe correlated with the model-specific effects i and i. Inaddition, a shock in the number of positive or negative OCRsmay lead to a change in sales rank, so ln(Rit) may be corre-lated with it and it. Therefore, we use the same method usedto estimate Equation 2 to estimate Equations 3 and 4. Thedifferences are that we use lags of ln(Rit) up to t – 2 and lagsof ln(Posi,t – l) and ln(Negi,t – m) up to t – l – 1 and t – m – 1 asinstruments for their first-differences, ln(Rit), ln(Posi,t – l),and ln(Negi,t – m). We estimate all equations separately inthe Blu-ray and DVD player categories in the subsections tofollow.
ResultsBrand Classification and DynamicsIn both categories, we first estimated Equation 1 with Sam-sung as the base (i.e., reference) brand. (In 2009, Samsungwas listed in Interbrand’s [2009] “Best Global Brands” listand BrandZ’s [2009] top-ranking technology brand list; seeTable 2.) To reestimate Equation 1, we then set the brandsthat had significant negative intercepts as the base/referencebrands. We coded brands with significant positive interceptsin the reestimated model as strong brands. We used the first14 weeks as a calibration period. Recognizing that brandstrength is dynamic, we updated these brand classificationsweekly on the basis of t – 1 weeks of data (e.g., we use datafrom week 1 to week 14 to estimate brand strength in week15).
In the Blu-ray category, Sony and Samsung were classi-fied as strong brands for the entire period. Panasonic andLG were initially classified as weak brands, but each grewits brand equity within the category over time. Panasonicbecame a strong brand in week 15 and LG did so in week26. Oppo did not enter the market until week 38, but itbecame a strong brand in week 40. None of the strongbrands reverted to being a weak brand over time.
In the more established context of the DVD category,LG, Oppo, Panasonic, Philips, Pioneer, Samsung, andToshiba were strong brands from the beginning of our datawindow. Sony was not a strong brand initially; however,after launching several new models in weeks 22 and 23, itachieved strong brand status in week 28. None of the strongbrands reverted to being a weak brand over time.The Effect of OCRs on Brand EquitySeveral brands made the transition from weak to strong, sowe examined the impact that cumulative OCRs had on thistransition. Because only one brand made the transition inthe DVD player category, we restrict our attention to theBlu-ray category.
The Effects of Positive and Negative Online Customer Reviews / 43
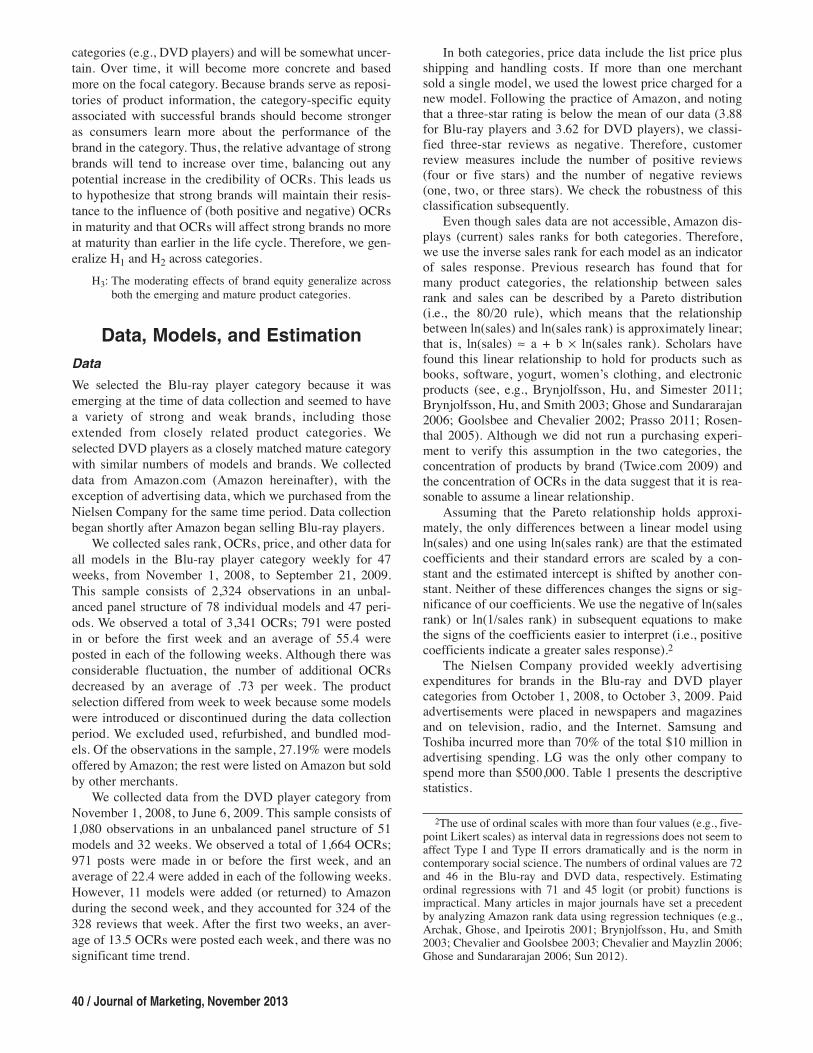
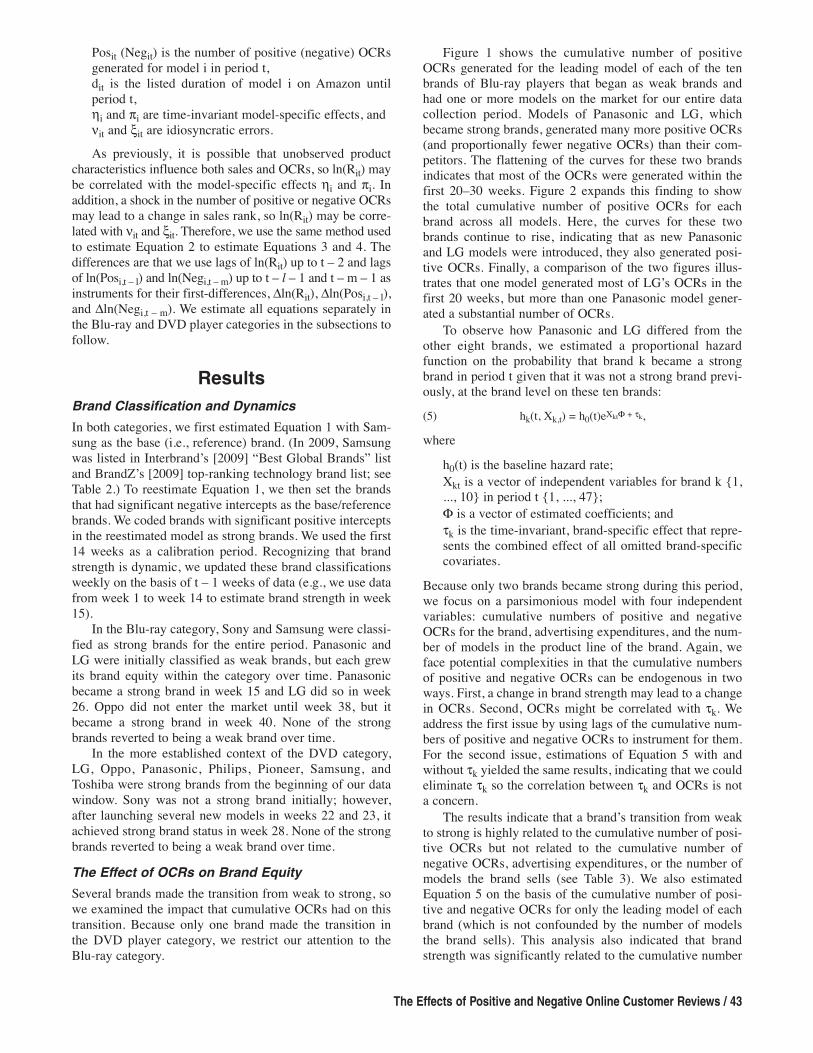
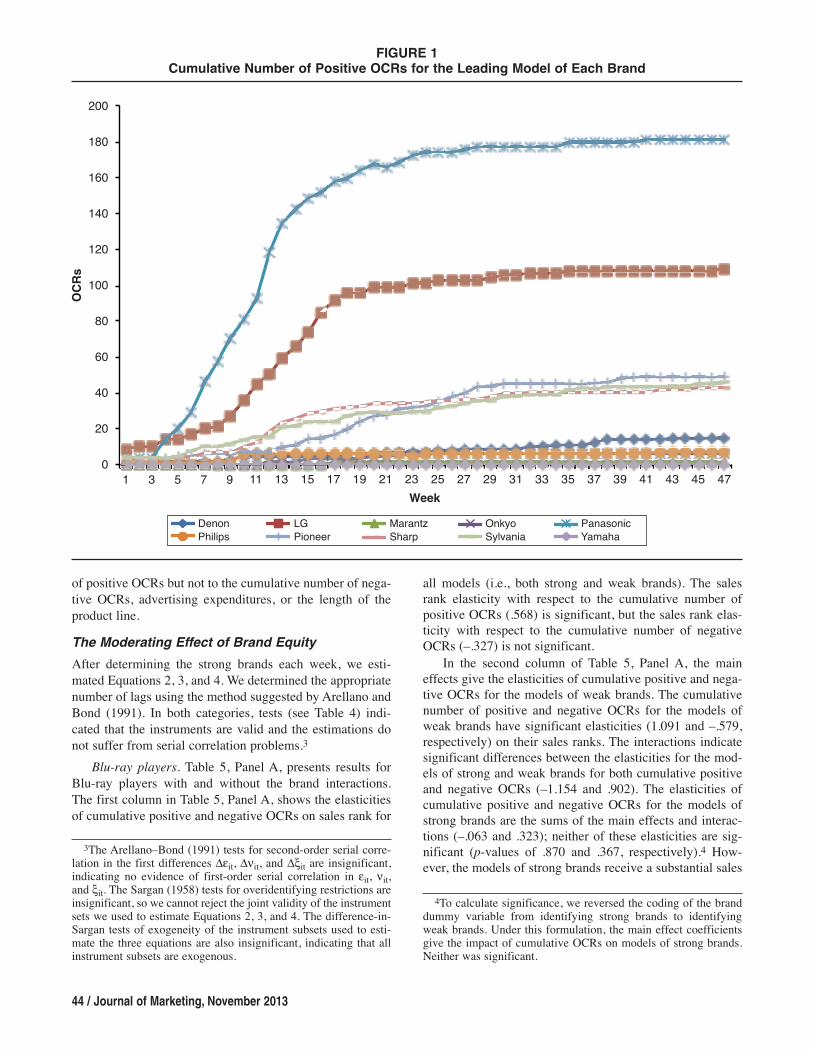
Figure 1 shows the cumulative number of positiveOCRs generated for the leading model of each of the tenbrands of Blu-ray players that began as weak brands andhad one or more models on the market for our entire datacollection period. Models of Panasonic and LG, whichbecame strong brands, generated many more positive OCRs(and proportionally fewer negative OCRs) than their com-petitors. The flattening of the curves for these two brandsindicates that most of the OCRs were generated within thefirst 20–30 weeks. Figure 2 expands this finding to showthe total cumulative number of positive OCRs for eachbrand across all models. Here, the curves for these twobrands continue to rise, indicating that as new Panasonicand LG models were introduced, they also generated posi-tive OCRs. Finally, a comparison of the two figures illus-trates that one model generated most of LG’s OCRs in thefirst 20 weeks, but more than one Panasonic model gener-ated a substantial number of OCRs.
To observe how Panasonic and LG differed from theother eight brands, we estimated a proportional hazardfunction on the probability that brand k became a strongbrand in period t given that it was not a strong brand previ-ously, at the brand level on these ten brands:(5) hk(t, Xk,t) = h0(t)eXktF + tk,where
h0(t) is the baseline hazard rate;Xkt is a vector of independent variables for brand k {1,..., 10} in period t {1, ..., 47};F is a vector of estimated coefficients; andtk is the time-invariant, brand-specific effect that repre-sents the combined effect of all omitted brand-specificcovariates.
Because only two brands became strong during this period,we focus on a parsimonious model with four independentvariables: cumulative numbers of positive and negativeOCRs for the brand, advertising expenditures, and the num-ber of models in the product line of the brand. Again, weface potential complexities in that the cumulative numbersof positive and negative OCRs can be endogenous in twoways. First, a change in brand strength may lead to a changein OCRs. Second, OCRs might be correlated with tk. Weaddress the first issue by using lags of the cumulative num-bers of positive and negative OCRs to instrument for them.For the second issue, estimations of Equation 5 with andwithout tk yielded the same results, indicating that we couldeliminate tk so the correlation between tk and OCRs is nota concern.
The results indicate that a brand’s transition from weakto strong is highly related to the cumulative number of posi-tive OCRs but not related to the cumulative number ofnegative OCRs, advertising expenditures, or the number ofmodels the brand sells (see Table 3). We also estimatedEquation 5 on the basis of the cumulative number of posi-tive and negative OCRs for only the leading model of eachbrand (which is not confounded by the number of modelsthe brand sells). This analysis also indicated that brandstrength was significantly related to the cumulative number
of positive OCRs but not to the cumulative number of nega-tive OCRs, advertising expenditures, or the length of theproduct line.The Moderating Effect of Brand EquityAfter determining the strong brands each week, we esti-mated Equations 2, 3, and 4. We determined the appropriatenumber of lags using the method suggested by Arellano andBond (1991). In both categories, tests (see Table 4) indi-cated that the instruments are valid and the estimations donot suffer from serial correlation problems.3
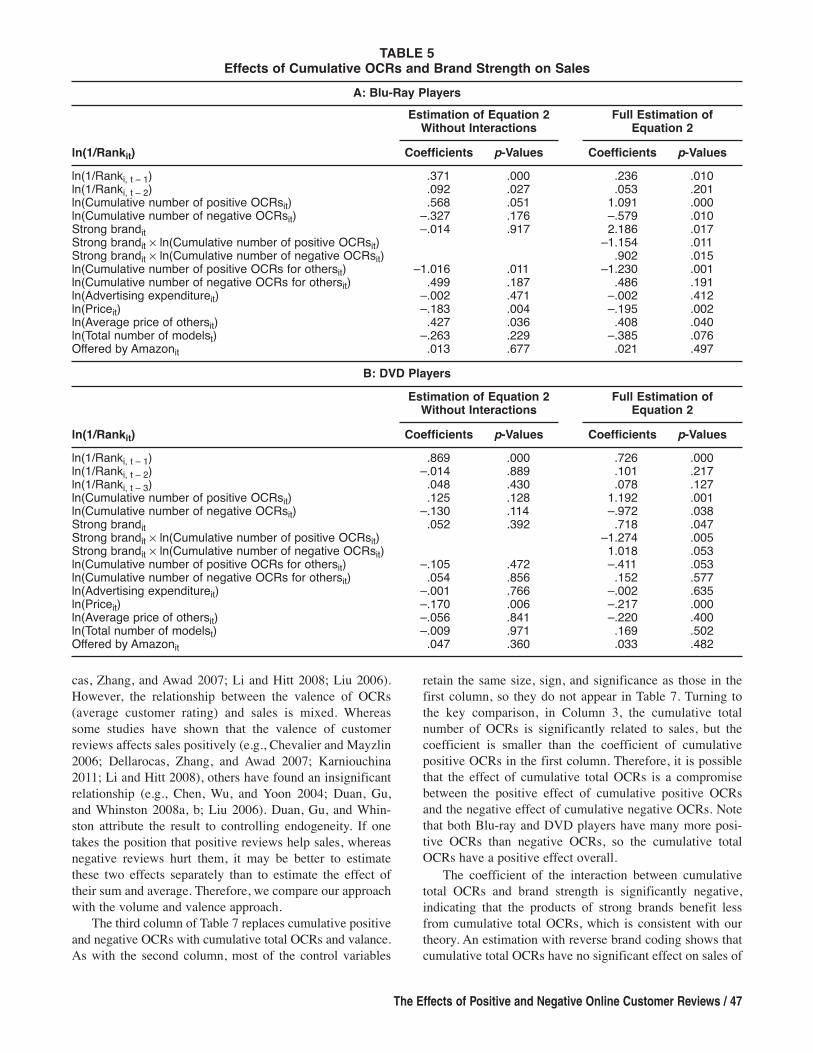
Blu-ray players. Table 5, Panel A, presents results forBlu-ray players with and without the brand interactions.The first column in Table 5, Panel A, shows the elasticitiesof cumulative positive and negative OCRs on sales rank for
44 / Journal of Marketing, November 2013
all models (i.e., both strong and weak brands). The salesrank elasticity with respect to the cumulative number ofpositive OCRs (.568) is significant, but the sales rank elas-ticity with respect to the cumulative number of negativeOCRs (–.327) is not significant.
In the second column of Table 5, Panel A, the maineffects give the elasticities of cumulative positive and nega-tive OCRs for the models of weak brands. The cumulativenumber of positive and negative OCRs for the models ofweak brands have significant elasticities (1.091 and –.579,respectively) on their sales ranks. The interactions indicatesignificant differences between the elasticities for the mod-els of strong and weak brands for both cumulative positiveand negative OCRs (–1.154 and .902). The elasticities ofcumulative positive and negative OCRs for the models ofstrong brands are the sums of the main effects and interac-tions (–.063 and .323); neither of these elasticities are sig-nificant (p-values of .870 and .367, respectively).4 How-ever, the models of strong brands receive a substantial sales
FIGURE 1Cumulative Number of Positive OCRs for the Leading Model of Each Brand' '
' ' ' ' ' ' ' ' ' ' ' '
%
%
%
%
%
%
%
%
%
%
' '' ' ' ' ' ' ' ' ' ' ' '
%
%
%
%
' '' ' ' ' ' ' ' ' ' ' ' '
%
%
%
%
' '' ' ' ' ' ' ' ' ' ' ' '
%
%
%
%
' '' ' ' ' ' ' ' ' ' ' ' '
%
%
%
%
' '' ' ' ' ' ' ' ' ' ' ' '
%
%
%
%
' '' ' ' ' ' ' ' ' ' ' ' '
%
%
%
%
' '' ' ' ' ' ' ' ' ' ' ' '
%
%
%
%
' '' ' ' ' ' ' ' ' ' ' ' '
%
%
%
%
' '' ' ' ' ' ' ' ' ' ' ' '
%
%
%
%
%
%
%
' '' ' ' ' ' ' ' ' ' ' ' '
%
%
%
%
' '' ' ' ' ' ' ' ' ' ' ' '
%
%
%
%
' '' ' ' ' ' ' ' ' ' ' ' '
%
%
%
%
' '' ' ' ' ' ' ' ' ' ' ' '
%
%
%
%
' '' ' ' ' ' ' ' ' ' ' ' '
%
%
%
%
%
%
%
1 3 5 7 9
200
180
160
140
120
100
80
60
40
20
0
Week
OCRs
Denon LG Marantz Onkyo PanasonicPhilips Pioneer Sharp Sylvania Yamaha
' '' ' ' ' ' ' ' ' ' ' ' '
%
%
%
%
%
%
%
%
%
%
' '' ' ' ' ' ' ' ' ' ' ' '
%
%
%
%
' '' ' ' ' ' ' ' ' ' ' ' '
%
%
%
%
' '' ' ' ' ' ' ' ' ' ' ' '
%
%
%
%
' '' ' ' ' ' ' ' ' ' ' ' '
%
%
%
%
' '' ' ' ' ' ' ' ' ' ' ' '
%
%
%
%
' '' ' ' ' ' ' ' ' ' ' ' '
%
%
%
%
' '' ' ' ' ' ' ' ' ' ' ' '
%
%
%
%
' '' ' ' ' ' ' ' ' ' ' ' '
%
%
%
%
' '' ' ' ' ' ' ' ' ' ' ' '
%
%
%
%
%
%
%
' '' ' ' ' ' ' ' ' ' ' ' '
%
%
%
%
' '' ' ' ' ' ' ' ' ' ' ' '
%
%
%
%
' '' ' ' ' ' ' ' ' ' ' ' '
%
%
%
%
' '' ' ' ' ' ' ' ' ' ' ' '
%
%
%
%
' '' ' ' ' ' ' ' ' ' ' ' '
%
%
%
%
%
%
%
' '' ' ' ' ' ' ' ' ' ' ' '
%
%
%
%
%
%
%
%
%
%
' '' ' ' ' ' ' ' ' ' ' ' '
%
%
%
%
' '' ' ' ' ' ' ' ' ' ' ' '
%
%
%
%
' '' ' ' ' ' ' ' ' ' ' ' '
%
%
%
%
' '' ' ' ' ' ' ' ' ' ' ' '
%
%
%
%
' '' ' ' ' ' ' ' ' ' ' ' '
%
%
%
%
' '' ' ' ' ' ' ' ' ' ' ' '
%
%
%
%
' '' ' ' ' ' ' ' ' ' ' ' '
%
%
%
%
' '' ' ' ' ' ' ' ' ' ' ' '
%
%
%
%
' '' ' ' ' ' ' ' ' ' ' ' '
%
%
%
%
%
%
%
' '' ' ' ' ' ' ' ' ' ' ' '
%
%
%
%
' '' ' ' ' ' ' ' ' ' ' ' '
%
%
%
%
' '' ' ' ' ' ' ' ' ' ' ' '
%
%
%
%
' '' ' ' ' ' ' ' ' ' ' ' '
%
%
%
%
' '' ' ' ' ' ' ' ' ' ' ' '
%
%
%
%
%
%
%
' '' ' ' ' ' ' ' ' ' ' ' '
%
%
%
%
%
%
%
%
%
%
' '' ' ' ' ' ' ' ' ' ' ' '
%
%
%
%
' '' ' ' ' ' ' ' ' ' ' ' '
%
%
%
%
' '' ' ' ' ' ' ' ' ' ' ' '
%
%
%
%
' '' ' ' ' ' ' ' ' ' ' ' '
%
%
%
%
' '' ' ' ' ' ' ' ' ' ' ' '
%
%
%
%
' '' ' ' ' ' ' ' ' ' ' ' '
%
%
%
%
' '' ' ' ' ' ' ' ' ' ' ' '
%
%
%
%
' '' ' ' ' ' ' ' ' ' ' ' '
%
%
%
%
' '' ' ' ' ' ' ' ' ' ' ' '
%
%
%
%
%
%
%
' '' ' ' ' ' ' ' ' ' ' ' '
%
%
%
%
' '' ' ' ' ' ' ' ' ' ' ' '
%
%
%
%
' '' ' ' ' ' ' ' ' ' ' ' '
%
%
%
%
' '' ' ' ' ' ' ' ' ' ' ' '
%
%
%
%
' '' ' ' ' ' ' ' ' ' ' ' '
%
%
%
%
%
%
%
' '' ' ' ' ' ' ' ' ' ' ' '
%
%
%
%
%
%
%
%
%
%
' '' ' ' ' ' ' ' ' ' ' ' '
%
%
%
%
' '' ' ' ' ' ' ' ' ' ' ' '
%
%
%
%
' '' ' ' ' ' ' ' ' ' ' ' '
%
%
%
%
' '' ' ' ' ' ' ' ' ' ' ' '
%
%
%
%
' '' ' ' ' ' ' ' ' ' ' ' '
%
%
%
%
' '' ' ' ' ' ' ' ' ' ' ' '
%
%
%
%
' '' ' ' ' ' ' ' ' ' ' ' '
%
%
%
%
' '' ' ' ' ' ' ' ' ' ' ' '
%
%
%
%
' '' ' ' ' ' ' ' ' ' ' ' '
%
%
%
%
%
%
%
' '' ' ' ' ' ' ' ' ' ' ' '
%
%
%
%
' '' ' ' ' ' ' ' ' ' ' ' '
%
%
%
%
' '' ' ' ' ' ' ' ' ' ' ' '
%
%
%
%
' '' ' ' ' ' ' ' ' ' ' ' '
%
%
%
%
' '' ' ' ' ' ' ' ' ' ' ' '
%
%
%
%
%
%
%
' '' ' ' ' ' ' ' ' ' ' ' '
%
%
%
%
%
%
%
%
%
%
' '' ' ' ' ' ' ' ' ' ' ' '
%
%
%
%
' '' ' ' ' ' ' ' ' ' ' ' '
%
%
%
%
' '' ' ' ' ' ' ' ' ' ' ' '
%
%
%
%
' '' ' ' ' ' ' ' ' ' ' ' '
%
%
%
%
' '' ' ' ' ' ' ' ' ' ' ' '
%
%
%
%
' '' ' ' ' ' ' ' ' ' ' ' '
%
%
%
%
' '' ' ' ' ' ' ' ' ' ' ' '
%
%
%
%
' '' ' ' ' ' ' ' ' ' ' ' '
%
%
%
%
' '' ' ' ' ' ' ' ' ' ' ' '
%
%
%
%
%
%
%
' '' ' ' ' ' ' ' ' ' ' ' '
%
%
%
%
' '' ' ' ' ' ' ' ' ' ' ' '
%
%
%
%
' '' ' ' ' ' ' ' ' ' ' ' '
%
%
%
%
' '' ' ' ' ' ' ' ' ' ' ' '
%
%
%
%
' '' ' ' ' ' ' ' ' ' ' ' '
%
%
%
%
%
%
%
' '' ' ' ' ' ' ' ' ' ' ' '
%
%
%
%
%
%
%
%
%
%
' '' ' ' ' ' ' ' ' ' ' ' '
%
%
%
%
' '' ' ' ' ' ' ' ' ' ' ' '
%
%
%
%
' '' ' ' ' ' ' ' ' ' ' ' '
%
%
%
%
' '' ' ' ' ' ' ' ' ' ' ' '
%
%
%
%
' '' ' ' ' ' ' ' ' ' ' ' '
%
%
%
%
' '' ' ' ' ' ' ' ' ' ' ' '
%
%
%
%
' '' ' ' ' ' ' ' ' ' ' ' '
%
%
%
%
' '' ' ' ' ' ' ' ' ' ' ' '
%
%
%
%
' '' ' ' ' ' ' ' ' ' ' ' '
%
%
%
%
%
%
%
' '' ' ' ' ' ' ' ' ' ' ' '
%
%
%
%
' '' ' ' ' ' ' ' ' ' ' ' '
%
%
%
%
' '' ' ' ' ' ' ' ' ' ' ' '
%
%
%
%
' '' ' ' ' ' ' ' ' ' ' ' '
%
%
%
%
' '' ' ' ' ' ' ' ' ' ' ' '
%
%
%
%
%
%
%
' '' ' ' ' ' ' ' ' ' ' ' '
%
%
%
%
%
%
%
%
%
%
' '' ' ' ' ' ' ' ' ' ' ' '
%
%
%
%
' '' ' ' ' ' ' ' ' ' ' ' '
%
%
%
%
' '' ' ' ' ' ' ' ' ' ' ' '
%
%
%
%
' '' ' ' ' ' ' ' ' ' ' ' '
%
%
%
%
' '' ' ' ' ' ' ' ' ' ' ' '
%
%
%
%
' '' ' ' ' ' ' ' ' ' ' ' '
%
%
%
%
' '' ' ' ' ' ' ' ' ' ' ' '
%
%
%
%
' '' ' ' ' ' ' ' ' ' ' ' '
%
%
%
%
' '' ' ' ' ' ' ' ' ' ' ' '
%
%
%
%
%
%
%
' '' ' ' ' ' ' ' ' ' ' ' '
%
%
%
%
' '' ' ' ' ' ' ' ' ' ' ' '
%
%
%
%
' '' ' ' ' ' ' ' ' ' ' ' '
%
%
%
%
' '' ' ' ' ' ' ' ' ' ' ' '
%
%
%
%
' '' ' ' ' ' ' ' ' ' ' ' '
%
%
%
%
%
%
%
' '' ' ' ' ' ' ' ' ' ' ' '
%
%
%
%
%
%
%
%
%
%
' '' ' ' ' ' ' ' ' ' ' ' '
%
%
%
%
' '' ' ' ' ' ' ' ' ' ' ' '
%
%
%
%
' '' ' ' ' ' ' ' ' ' ' ' '
%
%
%
%
' '' ' ' ' ' ' ' ' ' ' ' '
%
%
%
%
' '' ' ' ' ' ' ' ' ' ' ' '
%
%
%
%
' '' ' ' ' ' ' ' ' ' ' ' '
%
%
%
%
' '' ' ' ' ' ' ' ' ' ' ' '
%
%
%
%
' '' ' ' ' ' ' ' ' ' ' ' '
%
%
%
%
' '' ' ' ' ' ' ' ' ' ' ' '
%
%
%
%
%
%
%
' '' ' ' ' ' ' ' ' ' ' ' '
%
%
%
%
' '' ' ' ' ' ' ' ' ' ' ' '
%
%
%
%
' '' ' ' ' ' ' ' ' ' ' ' '
%
%
%
%
' '' ' ' ' ' ' ' ' ' ' ' '
%
%
%
%
' '' ' ' ' ' ' ' ' ' ' ' '
%
%
%
%
%
%
%
' '' ' ' ' ' ' ' ' ' ' ' '
%
%
%
%
%
%
%
%
%
%
' '' ' ' ' ' ' ' ' ' ' ' '
%
%
%
%
' '' ' ' ' ' ' ' ' ' ' ' '
%
%
%
%
' '' ' ' ' ' ' ' ' ' ' ' '
%
%
%
%
' '' ' ' ' ' ' ' ' ' ' ' '
%
%
%
%
' '' ' ' ' ' ' ' ' ' ' ' '
%
%
%
%
' '' ' ' ' ' ' ' ' ' ' ' '
%
%
%
%
' '' ' ' ' ' ' ' ' ' ' ' '
%
%
%
%
' '' ' ' ' ' ' ' ' ' ' ' '
%
%
%
%
' '' ' ' ' ' ' ' ' ' ' ' '
%
%
%
%
%
%
%
' '' ' ' ' ' ' ' ' ' ' ' '
%
%
%
%
' '' ' ' ' ' ' ' ' ' ' ' '
%
%
%
%
' '' ' ' ' ' ' ' ' ' ' ' '
%
%
%
%
' '' ' ' ' ' ' ' ' ' ' ' '
%
%
%
%
' '' ' ' ' ' ' ' ' ' ' ' '
%
%
%
%
%
%
%
' '' ' ' ' ' ' ' ' ' ' ' '
%
%
%
%
%
%
%
%
%
%
' '' ' ' ' ' ' ' ' ' ' ' '
%
%
%
%
' '' ' ' ' ' ' ' ' ' ' ' '
%
%
%
%
' '' ' ' ' ' ' ' ' ' ' ' '
%
%
%
%
' '' ' ' ' ' ' ' ' ' ' ' '
%
%
%
%
' '' ' ' ' ' ' ' ' ' ' ' '
%
%
%
%
' '' ' ' ' ' ' ' ' ' ' ' '
%
%
%
%
' '' ' ' ' ' ' ' ' ' ' ' '
%
%
%
%
' '' ' ' ' ' ' ' ' ' ' ' '
%
%
%
%
' '' ' ' ' ' ' ' ' ' ' ' '
%
%
%
%
%
%
%
' '' ' ' ' ' ' ' ' ' ' ' '
%
%
%
%
' '' ' ' ' ' ' ' ' ' ' ' '
%
%
%
%
' '' ' ' ' ' ' ' ' ' ' ' '
%
%
%
%
' '' ' ' ' ' ' ' ' ' ' ' '
%
%
%
%
' '' ' ' ' ' ' ' ' ' ' ' '
%
%
%
%
%
%
%
11 13 15 17 19 21 23 25 27 29 31 33 35 37 39 41 43 45 47
3The Arellano–Bond (1991) tests for second-order serial corre-lation in the first differences it, it, and it are insignificant,indicating no evidence of first-order serial correlation in it, it,and it. The Sargan (1958) tests for overidentifying restrictions areinsignificant, so we cannot reject the joint validity of the instrumentsets we used to estimate Equations 2, 3, and 4. The difference-in-Sargan tests of exogeneity of the instrument subsets used to esti-mate the three equations are also insignificant, indicating that allinstrument subsets are exogenous.
4To calculate significance, we reversed the coding of the branddummy variable from identifying strong brands to identifyingweak brands. Under this formulation, the main effect coefficientsgive the impact of cumulative OCRs on models of strong brands.Neither was significant.
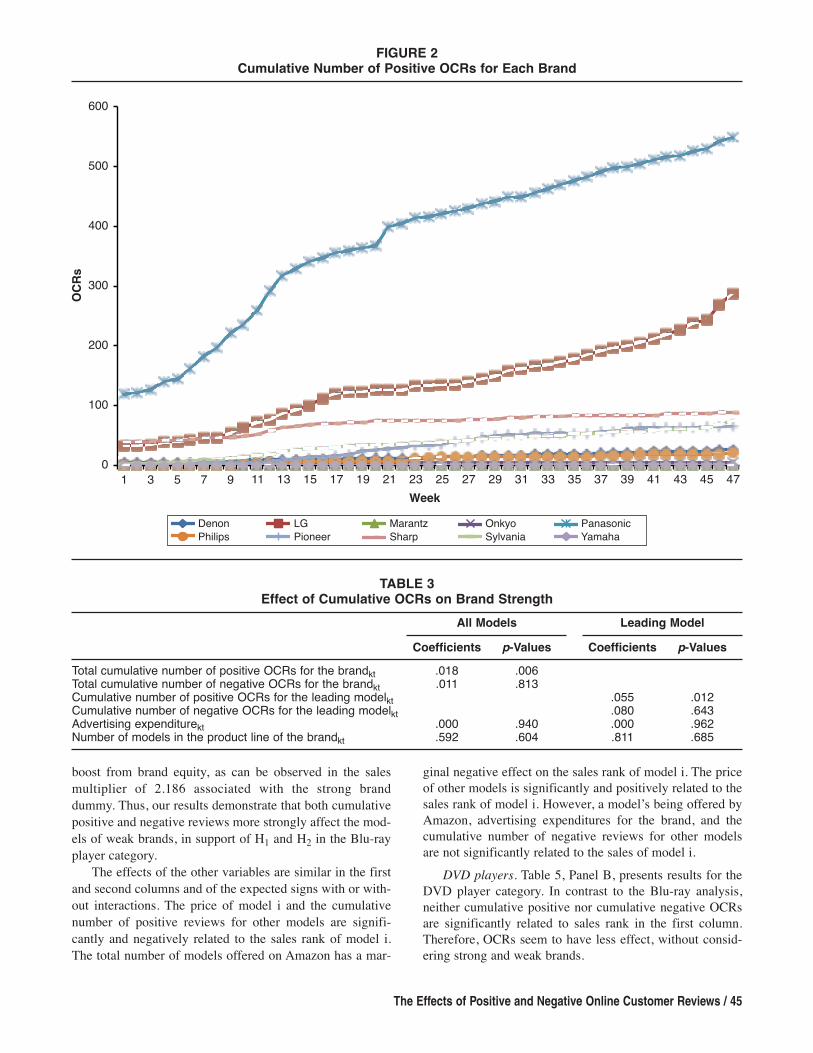
boost from brand equity, as can be observed in the salesmultiplier of 2.186 associated with the strong branddummy. Thus, our results demonstrate that both cumulativepositive and negative reviews more strongly affect the mod-els of weak brands, in support of H1 and H2 in the Blu-rayplayer category.
The effects of the other variables are similar in the firstand second columns and of the expected signs with or with-out interactions. The price of model i and the cumulativenumber of positive reviews for other models are signifi-cantly and negatively related to the sales rank of model i.The total number of models offered on Amazon has a mar-
The Effects of Positive and Negative Online Customer Reviews / 45
ginal negative effect on the sales rank of model i. The priceof other models is significantly and positively related to thesales rank of model i. However, a model’s being offered byAmazon, advertising expenditures for the brand, and thecumulative number of negative reviews for other modelsare not significantly related to the sales of model i.
DVD players. Table 5, Panel B, presents results for theDVD player category. In contrast to the Blu-ray analysis,neither cumulative positive nor cumulative negative OCRsare significantly related to sales rank in the first column.Therefore, OCRs seem to have less effect, without consid-ering strong and weak brands.
FIGURE 2Cumulative Number of Positive OCRs for Each Brand' '
' ' ' ' ' ' ' '
%
%
%
%
%
%
%
%
%
%
' '' ' ' ' ' ' ' '
%
%
%
%
' '' ' ' ' ' ' ' '
%
%
%
%
' '' ' ' ' ' ' ' '
%
%
%
%
' '' ' ' ' ' ' ' '
%
%
%
%
' '' ' ' ' ' ' ' '
%
%
%
%
' '' ' ' ' ' ' ' '
%
%
%
%
' '' ' ' ' ' ' ' '
%
%
%
%
' '' ' ' ' ' ' ' '
%
%
%
%
' '' ' ' ' ' ' ' '
%
%
%
%
%
%
%
' '' ' ' ' ' ' ' '
%
%
%
%
' '' ' ' ' ' ' ' '
%
%
%
%
' '' ' ' ' ' ' ' '
%
%
%
%
' '' ' ' ' ' ' ' '
%
%
%
%
' '' ' ' ' ' ' ' '
%
%
%
%
%
%
%
1 3 5 7 9
600
500
400
300
200
100
0
Week
OCRs
Denon LG Marantz Onkyo PanasonicPhilips Pioneer Sharp Sylvania Yamaha
' '' ' ' ' ' ' ' ' ' ' ' '
%
%
%
%
%
%
%
%
%
%
' '' ' ' ' ' ' ' ' ' ' ' '
%
%
%
%
' '' ' ' ' ' ' ' ' ' ' ' '
%
%
%
%
' '' ' ' ' ' ' ' ' ' ' ' '
%
%
%
%
' '' ' ' ' ' ' ' ' ' ' ' '
%
%
%
%
' '' ' ' ' ' ' ' ' ' ' ' '
%
%
%
%
' '' ' ' ' ' ' ' ' ' ' ' '
%
%
%
%
' '' ' ' ' ' ' ' ' ' ' ' '
%
%
%
%
' '' ' ' ' ' ' ' ' ' ' ' '
%
%
%
%
' '' ' ' ' ' ' ' ' ' ' ' '
%
%
%
%
%
%
%
' '' ' ' ' ' ' ' ' ' ' ' '
%
%
%
%
' '' ' ' ' ' ' ' ' ' ' ' '
%
%
%
%
' '' ' ' ' ' ' ' ' ' ' ' '
%
%
%
%
' '' ' ' ' ' ' ' ' ' ' ' '
%
%
%
%
' '' ' ' ' ' ' ' ' ' ' ' '
%
%
%
%
%
%
%
' '' ' ' ' ' ' ' ' ' ' ' '
%
%
%
%
%
%
%
%
%
%
' '' ' ' ' ' ' ' ' ' ' ' '
%
%
%
%
' '' ' ' ' ' ' ' ' ' ' ' '
%
%
%
%
' '' ' ' ' ' ' ' ' ' ' ' '
%
%
%
%
' '' ' ' ' ' ' ' ' ' ' ' '
%
%
%
%
' '' ' ' ' ' ' ' ' ' ' ' '
%
%
%
%
' '' ' ' ' ' ' ' ' ' ' ' '
%
%
%
%
' '' ' ' ' ' ' ' ' ' ' ' '
%
%
%
%
' '' ' ' ' ' ' ' ' ' ' ' '
%
%
%
%
' '' ' ' ' ' ' ' ' ' ' ' '
%
%
%
%
%
%
%
' '' ' ' ' ' ' ' ' ' ' ' '
%
%
%
%
' '' ' ' ' ' ' ' ' ' ' ' '
%
%
%
%
' '' ' ' ' ' ' ' ' ' ' ' '
%
%
%
%
' '' ' ' ' ' ' ' ' ' ' ' '
%
%
%
%
' '' ' ' ' ' ' ' ' ' ' ' '
%
%
%
%
%
%
%
' '' ' ' ' ' ' ' ' ' ' ' '
%
%
%
%
%
%
%
%
%
%
' '' ' ' ' ' ' ' ' ' ' ' '
%
%
%
%
' '' ' ' ' ' ' ' ' ' ' ' '
%
%
%
%
' '' ' ' ' ' ' ' ' ' ' ' '
%
%
%
%
' '' ' ' ' ' ' ' ' ' ' ' '
%
%
%
%
' '' ' ' ' ' ' ' ' ' ' ' '
%
%
%
%
' '' ' ' ' ' ' ' ' ' ' ' '
%
%
%
%
' '' ' ' ' ' ' ' ' ' ' ' '
%
%
%
%
' '' ' ' ' ' ' ' ' ' ' ' '
%
%
%
%
' '' ' ' ' ' ' ' ' ' ' ' '
%
%
%
%
%
%
%
' '' ' ' ' ' ' ' ' ' ' ' '
%
%
%
%
' '' ' ' ' ' ' ' ' ' ' ' '
%
%
%
%
' '' ' ' ' ' ' ' ' ' ' ' '
%
%
%
%
' '' ' ' ' ' ' ' ' ' ' ' '
%
%
%
%
' '' ' ' ' ' ' ' ' ' ' ' '
%
%
%
%
%
%
%
' '' ' ' ' ' ' ' ' ' ' ' '
%
%
%
%
%
%
%
%
%
%
' '' ' ' ' ' ' ' ' ' ' ' '
%
%
%
%
' '' ' ' ' ' ' ' ' ' ' ' '
%
%
%
%
' '' ' ' ' ' ' ' ' ' ' ' '
%
%
%
%
' '' ' ' ' ' ' ' ' ' ' ' '
%
%
%
%
' '' ' ' ' ' ' ' ' ' ' ' '
%
%
%
%
' '' ' ' ' ' ' ' ' ' ' ' '
%
%
%
%
' '' ' ' ' ' ' ' ' ' ' ' '
%
%
%
%
' '' ' ' ' ' ' ' ' ' ' ' '
%
%
%
%
' '' ' ' ' ' ' ' ' ' ' ' '
%
%
%
%
%
%
%
' '' ' ' ' ' ' ' ' ' ' ' '
%
%
%
%
' '' ' ' ' ' ' ' ' ' ' ' '
%
%
%
%
' '' ' ' ' ' ' ' ' ' ' ' '
%
%
%
%
' '' ' ' ' ' ' ' ' ' ' ' '
%
%
%
%
' '' ' ' ' ' ' ' ' ' ' ' '
%
%
%
%
%
%
%
' '' ' ' ' ' ' ' ' ' ' ' '
%
%
%
%
%
%
%
%
%
%
' '' ' ' ' ' ' ' ' ' ' ' '
%
%
%
%
' '' ' ' ' ' ' ' ' ' ' ' '
%
%
%
%
' '' ' ' ' ' ' ' ' ' ' ' '
%
%
%
%
' '' ' ' ' ' ' ' ' ' ' ' '
%
%
%
%
' '' ' ' ' ' ' ' ' ' ' ' '
%
%
%
%
' '' ' ' ' ' ' ' ' ' ' ' '
%
%
%
%
' '' ' ' ' ' ' ' ' ' ' ' '
%
%
%
%
' '' ' ' ' ' ' ' ' ' ' ' '
%
%
%
%
' '' ' ' ' ' ' ' ' ' ' ' '
%
%
%
%
%
%
%
' '' ' ' ' ' ' ' ' ' ' ' '
%
%
%
%
' '' ' ' ' ' ' ' ' ' ' ' '
%
%
%
%
' '' ' ' ' ' ' ' ' ' ' ' '
%
%
%
%
' '' ' ' ' ' ' ' ' ' ' ' '
%
%
%
%
' '' ' ' ' ' ' ' ' ' ' ' '
%
%
%
%
%
%
%
' '' ' ' ' ' ' ' ' ' ' ' '
%
%
%
%
%
%
%
%
%
%
' '' ' ' ' ' ' ' ' ' ' ' '
%
%
%
%
' '' ' ' ' ' ' ' ' ' ' ' '
%
%
%
%
' '' ' ' ' ' ' ' ' ' ' ' '
%
%
%
%
' '' ' ' ' ' ' ' ' ' ' ' '
%
%
%
%
' '' ' ' ' ' ' ' ' ' ' ' '
%
%
%
%
' '' ' ' ' ' ' ' ' ' ' ' '
%
%
%
%
' '' ' ' ' ' ' ' ' ' ' ' '
%
%
%
%
' '' ' ' ' ' ' ' ' ' ' ' '
%
%
%
%
' '' ' ' ' ' ' ' ' ' ' ' '
%
%
%
%
%
%
%
' '' ' ' ' ' ' ' ' ' ' ' '
%
%
%
%
' '' ' ' ' ' ' ' ' ' ' ' '
%
%
%
%
' '' ' ' ' ' ' ' ' ' ' ' '
%
%
%
%
' '' ' ' ' ' ' ' ' ' ' ' '
%
%
%
%
' '' ' ' ' ' ' ' ' ' ' ' '
%
%
%
%
%
%
%
' '' ' ' ' ' ' ' ' ' ' ' '
%
%
%
%
%
%
%
%
%
%
' '' ' ' ' ' ' ' ' ' ' ' '
%
%
%
%
' '' ' ' ' ' ' ' ' ' ' ' '
%
%
%
%
' '' ' ' ' ' ' ' ' ' ' ' '
%
%
%
%
' '' ' ' ' ' ' ' ' ' ' ' '
%
%
%
%
' '' ' ' ' ' ' ' ' ' ' ' '
%
%
%
%
' '' ' ' ' ' ' ' ' ' ' ' '
%
%
%
%
' '' ' ' ' ' ' ' ' ' ' ' '
%
%
%
%
' '' ' ' ' ' ' ' ' ' ' ' '
%
%
%
%
' '' ' ' ' ' ' ' ' ' ' ' '
%
%
%
%
%
%
%
' '' ' ' ' ' ' ' ' ' ' ' '
%
%
%
%
' '' ' ' ' ' ' ' ' ' ' ' '
%
%
%
%
' '' ' ' ' ' ' ' ' ' ' ' '
%
%
%
%
' '' ' ' ' ' ' ' ' ' ' ' '
%
%
%
%
' '' ' ' ' ' ' ' ' ' ' ' '
%
%
%
%
%
%
%
' '' ' ' ' ' ' ' ' ' ' ' '
%
%
%
%
%
%
%
%
%
%
' '' ' ' ' ' ' ' ' ' ' ' '
%
%
%
%
' '' ' ' ' ' ' ' ' ' ' ' '
%
%
%
%
' '' ' ' ' ' ' ' ' ' ' ' '
%
%
%
%
' '' ' ' ' ' ' ' ' ' ' ' '
%
%
%
%
' '' ' ' ' ' ' ' ' ' ' ' '
%
%
%
%
' '' ' ' ' ' ' ' ' ' ' ' '
%
%
%
%
' '' ' ' ' ' ' ' ' ' ' ' '
%
%
%
%
' '' ' ' ' ' ' ' ' ' ' ' '
%
%
%
%
' '' ' ' ' ' ' ' ' ' ' ' '
%
%
%
%
%
%
%
' '' ' ' ' ' ' ' ' ' ' ' '
%
%
%
%
' '' ' ' ' ' ' ' ' ' ' ' '
%
%
%
%
' '' ' ' ' ' ' ' ' ' ' ' '
%
%
%
%
' '' ' ' ' ' ' ' ' ' ' ' '
%
%
%
%
' '' ' ' ' ' ' ' ' ' ' ' '
%
%
%
%
%
%
%
' '' ' ' ' ' ' ' ' ' ' ' '
%
%
%
%
%
%
%
%
%
%
' '' ' ' ' ' ' ' ' ' ' ' '
%
%
%
%
' '' ' ' ' ' ' ' ' ' ' ' '
%
%
%
%
' '' ' ' ' ' ' ' ' ' ' ' '
%
%
%
%
' '' ' ' ' ' ' ' ' ' ' ' '
%
%
%
%
' '' ' ' ' ' ' ' ' ' ' ' '
%
%
%
%
' '' ' ' ' ' ' ' ' ' ' ' '
%
%
%
%
' '' ' ' ' ' ' ' ' ' ' ' '
%
%
%
%
' '' ' ' ' ' ' ' ' ' ' ' '
%
%
%
%
' '' ' ' ' ' ' ' ' ' ' ' '
%
%
%
%
%
%
%
' '' ' ' ' ' ' ' ' ' ' ' '
%
%
%
%
' '' ' ' ' ' ' ' ' ' ' ' '
%
%
%
%
' '' ' ' ' ' ' ' ' ' ' ' '
%
%
%
%
' '' ' ' ' ' ' ' ' ' ' ' '
%
%
%
%
' '' ' ' ' ' ' ' ' ' ' ' '
%
%
%
%
%
%
%
' '' ' ' ' ' ' ' ' ' ' ' '
%
%
%
%
%
%
%
%
%
%
' '' ' ' ' ' ' ' ' ' ' ' '
%
%
%
%
' '' ' ' ' ' ' ' ' ' ' ' '
%
%
%
%
' '' ' ' ' ' ' ' ' ' ' ' '
%
%
%
%
' '' ' ' ' ' ' ' ' ' ' ' '
%
%
%
%
' '' ' ' ' ' ' ' ' ' ' ' '
%
%
%
%
' '' ' ' ' ' ' ' ' ' ' ' '
%
%
%
%
' '' ' ' ' ' ' ' ' ' ' ' '
%
%
%
%
' '' ' ' ' ' ' ' ' ' ' ' '
%
%
%
%
' '' ' ' ' ' ' ' ' ' ' ' '
%
%
%
%
%
%
%
' '' ' ' ' ' ' ' ' ' ' ' '
%
%
%
%
' '' ' ' ' ' ' ' ' ' ' ' '
%
%
%
%
' '' ' ' ' ' ' ' ' ' ' ' '
%
%
%
%
' '' ' ' ' ' ' ' ' ' ' ' '
%
%
%
%
' '' ' ' ' ' ' ' ' ' ' ' '
%
%
%
%
%
%
%
11 13 15 17 19 21 23 25 27 29 31 33 35 37 39 41 43 45 47
TABLE 3Effect of Cumulative OCRs on Brand Strength
All Models Leading Model
Coefficients p-Values Coefficients p-ValuesTotal cumulative number of positive OCRs for the brandkt .018 .006Total cumulative number of negative OCRs for the brandkt .011 .813Cumulative number of positive OCRs for the leading modelkt .055 .012Cumulative number of negative OCRs for the leading modelkt .080 .643Advertising expenditurekt .000 .940 .000 .962Number of models in the product line of the brandkt .592 .604 .811 .685
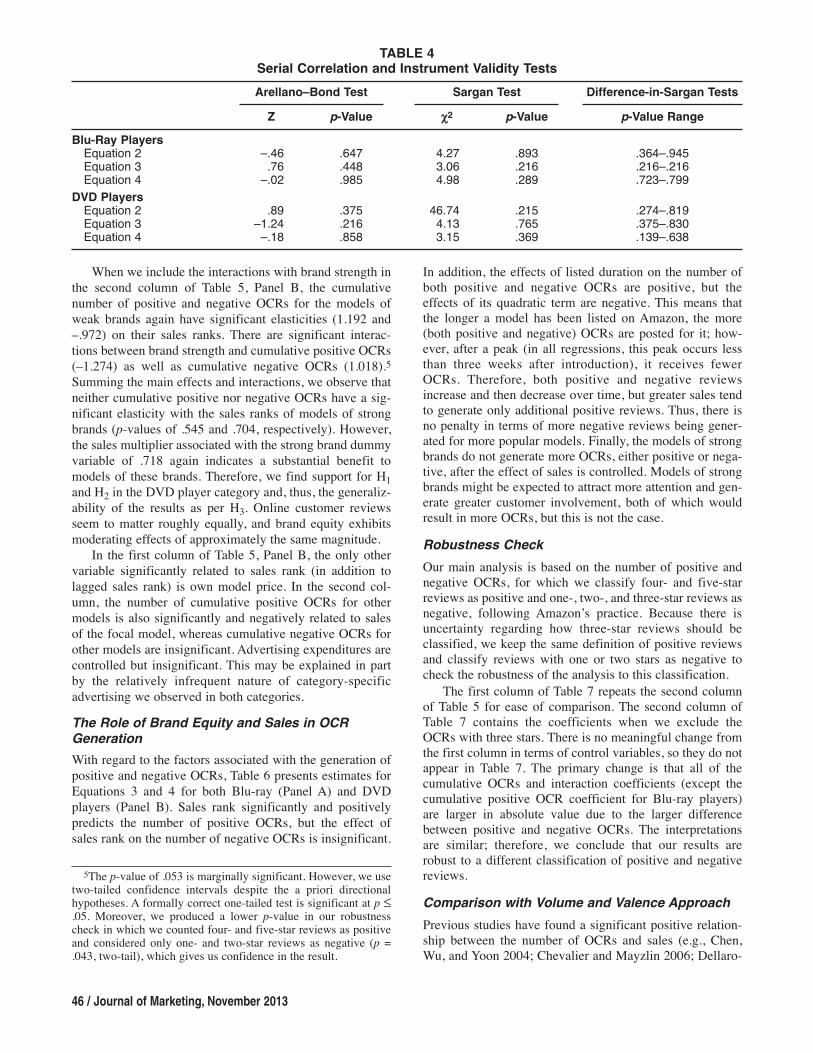
When we include the interactions with brand strength inthe second column of Table 5, Panel B, the cumulativenumber of positive and negative OCRs for the models ofweak brands again have significant elasticities (1.192 and–.972) on their sales ranks. There are significant interac-tions between brand strength and cumulative positive OCRs(–1.274) as well as cumulative negative OCRs (1.018).5Summing the main effects and interactions, we observe thatneither cumulative positive nor negative OCRs have a sig-nificant elasticity with the sales ranks of models of strongbrands (p-values of .545 and .704, respectively). However,the sales multiplier associated with the strong brand dummyvariable of .718 again indicates a substantial benefit tomodels of these brands. Therefore, we find support for H1and H2 in the DVD player category and, thus, the generaliz-ability of the results as per H3. Online customer reviewsseem to matter roughly equally, and brand equity exhibitsmoderating effects of approximately the same magnitude.
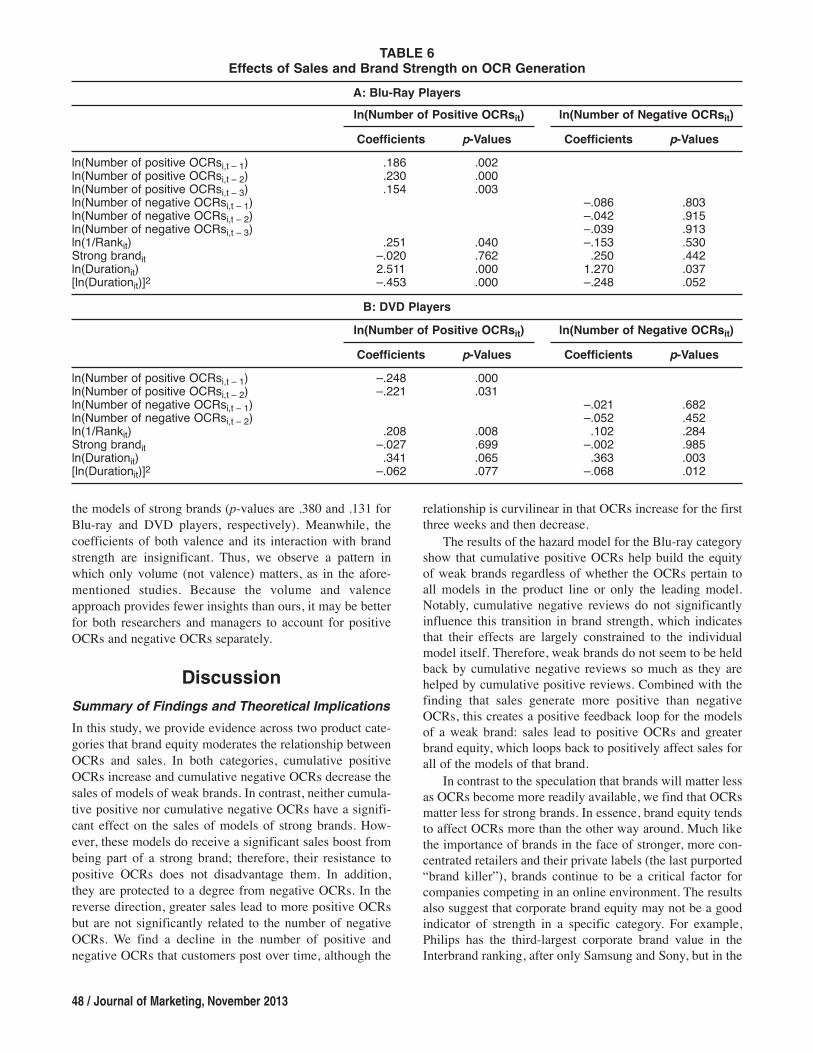
In the first column of Table 5, Panel B, the only othervariable significantly related to sales rank (in addition tolagged sales rank) is own model price. In the second col-umn, the number of cumulative positive OCRs for othermodels is also significantly and negatively related to salesof the focal model, whereas cumulative negative OCRs forother models are insignificant. Advertising expenditures arecontrolled but insignificant. This may be explained in partby the relatively infrequent nature of category-specificadvertising we observed in both categories.The Role of Brand Equity and Sales in OCRGenerationWith regard to the factors associated with the generation ofpositive and negative OCRs, Table 6 presents estimates forEquations 3 and 4 for both Blu-ray (Panel A) and DVDplayers (Panel B). Sales rank significantly and positivelypredicts the number of positive OCRs, but the effect ofsales rank on the number of negative OCRs is insignificant.
46 / Journal of Marketing, November 2013
In addition, the effects of listed duration on the number ofboth positive and negative OCRs are positive, but theeffects of its quadratic term are negative. This means thatthe longer a model has been listed on Amazon, the more(both positive and negative) OCRs are posted for it; how-ever, after a peak (in all regressions, this peak occurs lessthan three weeks after introduction), it receives fewerOCRs. Therefore, both positive and negative reviewsincrease and then decrease over time, but greater sales tendto generate only additional positive reviews. Thus, there isno penalty in terms of more negative reviews being gener-ated for more popular models. Finally, the models of strongbrands do not generate more OCRs, either positive or nega-tive, after the effect of sales is controlled. Models of strongbrands might be expected to attract more attention and gen-erate greater customer involvement, both of which wouldresult in more OCRs, but this is not the case.Robustness CheckOur main analysis is based on the number of positive andnegative OCRs, for which we classify four- and five-starreviews as positive and one-, two-, and three-star reviews asnegative, following Amazon’s practice. Because there isuncertainty regarding how three-star reviews should beclassified, we keep the same definition of positive reviewsand classify reviews with one or two stars as negative tocheck the robustness of the analysis to this classification.
The first column of Table 7 repeats the second columnof Table 5 for ease of comparison. The second column ofTable 7 contains the coefficients when we exclude theOCRs with three stars. There is no meaningful change fromthe first column in terms of control variables, so they do notappear in Table 7. The primary change is that all of thecumulative OCRs and interaction coefficients (except thecumulative positive OCR coefficient for Blu-ray players)are larger in absolute value due to the larger differencebetween positive and negative OCRs. The interpretationsare similar; therefore, we conclude that our results arerobust to a different classification of positive and negativereviews.Comparison with Volume and Valence ApproachPrevious studies have found a significant positive relation-ship between the number of OCRs and sales (e.g., Chen,Wu, and Yoon 2004; Chevalier and Mayzlin 2006; Dellaro-
TABLE 4Serial Correlation and Instrument Validity TestsArellano–Bond Test Sargan Test Difference-in-Sargan Tests
Z p-Value c2 p-Value p-Value RangeBlu-Ray PlayersEquation 2 –.46 .647 4.27 .893 .364–.945Equation 3 .76 .448 3.06 .216 .216–.216Equation 4 –.02 .985 4.98 .289 .723–.799
DVD PlayersEquation 2 .89 .375 46.74 .215 .274–.819Equation 3 –1.24 .216 4.13 .765 .375–.830Equation 4 –.18 .858 3.15 .369 .139–.638
5The p-value of .053 is marginally significant. However, we usetwo-tailed confidence intervals despite the a priori directionalhypotheses. A formally correct one-tailed test is significant at p £.05. Moreover, we produced a lower p-value in our robustnesscheck in which we counted four- and five-star reviews as positiveand considered only one- and two-star reviews as negative (p =.043, two-tail), which gives us confidence in the result.
cas, Zhang, and Awad 2007; Li and Hitt 2008; Liu 2006).However, the relationship between the valence of OCRs(average customer rating) and sales is mixed. Whereassome studies have shown that the valence of customerreviews affects sales positively (e.g., Chevalier and Mayzlin2006; Dellarocas, Zhang, and Awad 2007; Karniouchina2011; Li and Hitt 2008), others have found an insignificantrelationship (e.g., Chen, Wu, and Yoon 2004; Duan, Gu,and Whinston 2008a, b; Liu 2006). Duan, Gu, and Whin-ston attribute the result to controlling endogeneity. If onetakes the position that positive reviews help sales, whereasnegative reviews hurt them, it may be better to estimatethese two effects separately than to estimate the effect oftheir sum and average. Therefore, we compare our approachwith the volume and valence approach.
The third column of Table 7 replaces cumulative positiveand negative OCRs with cumulative total OCRs and valance.As with the second column, most of the control variables
The Effects of Positive and Negative Online Customer Reviews / 47
retain the same size, sign, and significance as those in thefirst column, so they do not appear in Table 7. Turning tothe key comparison, in Column 3, the cumulative totalnumber of OCRs is significantly related to sales, but thecoefficient is smaller than the coefficient of cumulativepositive OCRs in the first column. Therefore, it is possiblethat the effect of cumulative total OCRs is a compromisebetween the positive effect of cumulative positive OCRsand the negative effect of cumulative negative OCRs. Notethat both Blu-ray and DVD players have many more posi-tive OCRs than negative OCRs, so the cumulative totalOCRs have a positive effect overall.
The coefficient of the interaction between cumulativetotal OCRs and brand strength is significantly negative,indicating that the products of strong brands benefit lessfrom cumulative total OCRs, which is consistent with ourtheory. An estimation with reverse brand coding shows thatcumulative total OCRs have no significant effect on sales of
TABLE 5Effects of Cumulative OCRs and Brand Strength on Sales
A: Blu-Ray PlayersEstimation of Equation 2 Full Estimation ofWithout Interactions Equation 2
ln(1/Rankit) Coefficients p-Values Coefficients p-Valuesln(1/Ranki, t – 1) .371 .000 .236 .010ln(1/Ranki, t – 2) .092 .027 .053 .201ln(Cumulative number of positive OCRsit) .568 .051 1.091 .000ln(Cumulative number of negative OCRsit) –.327 .176 –.579 .010Strong brandit –.014 .917 2.186 .017Strong brandit ¥ ln(Cumulative number of positive OCRsit) –1.154 .011Strong brandit ¥ ln(Cumulative number of negative OCRsit) .902 .015ln(Cumulative number of positive OCRs for othersit) –1.016 .011 –1.230 .001ln(Cumulative number of negative OCRs for othersit) .499 .187 .486 .191ln(Advertising expenditureit) –.002 .471 –.002 .412ln(Priceit) –.183 .004 –.195 .002ln(Average price of othersit) .427 .036 .408 .040ln(Total number of modelst) –.263 .229 –.385 .076Offered by Amazonit .013 .677 .021 .497
B: DVD PlayersEstimation of Equation 2 Full Estimation ofWithout Interactions Equation 2
ln(1/Rankit) Coefficients p-Values Coefficients p-Valuesln(1/Ranki, t – 1) .869 .000 .726 .000ln(1/Ranki, t – 2) –.014 .889 .101 .217ln(1/Ranki, t – 3) .048 .430 .078 .127ln(Cumulative number of positive OCRsit) .125 .128 1.192 .001ln(Cumulative number of negative OCRsit) –.130 .114 –.972 .038Strong brandit .052 .392 .718 .047Strong brandit ¥ ln(Cumulative number of positive OCRsit) –1.274 .005Strong brandit ¥ ln(Cumulative number of negative OCRsit) 1.018 .053ln(Cumulative number of positive OCRs for othersit) –.105 .472 –.411 .053ln(Cumulative number of negative OCRs for othersit) .054 .856 .152 .577ln(Advertising expenditureit) –.001 .766 –.002 .635ln(Priceit) –.170 .006 –.217 .000ln(Average price of othersit) –.056 .841 –.220 .400ln(Total number of modelst) –.009 .971 .169 .502Offered by Amazonit .047 .360 .033 .482
the models of strong brands (p-values are .380 and .131 forBlu-ray and DVD players, respectively). Meanwhile, thecoefficients of both valence and its interaction with brandstrength are insignificant. Thus, we observe a pattern inwhich only volume (not valence) matters, as in the afore-mentioned studies. Because the volume and valenceapproach provides fewer insights than ours, it may be betterfor both researchers and managers to account for positiveOCRs and negative OCRs separately.
DiscussionSummary of Findings and Theoretical ImplicationsIn this study, we provide evidence across two product cate-gories that brand equity moderates the relationship betweenOCRs and sales. In both categories, cumulative positiveOCRs increase and cumulative negative OCRs decrease thesales of models of weak brands. In contrast, neither cumula-tive positive nor cumulative negative OCRs have a signifi-cant effect on the sales of models of strong brands. How-ever, these models do receive a significant sales boost frombeing part of a strong brand; therefore, their resistance topositive OCRs does not disadvantage them. In addition,they are protected to a degree from negative OCRs. In thereverse direction, greater sales lead to more positive OCRsbut are not significantly related to the number of negativeOCRs. We find a decline in the number of positive andnegative OCRs that customers post over time, although the
48 / Journal of Marketing, November 2013
relationship is curvilinear in that OCRs increase for the firstthree weeks and then decrease.
The results of the hazard model for the Blu-ray categoryshow that cumulative positive OCRs help build the equityof weak brands regardless of whether the OCRs pertain toall models in the product line or only the leading model.Notably, cumulative negative reviews do not significantlyinfluence this transition in brand strength, which indicatesthat their effects are largely constrained to the individualmodel itself. Therefore, weak brands do not seem to be heldback by cumulative negative reviews so much as they arehelped by cumulative positive reviews. Combined with thefinding that sales generate more positive than negativeOCRs, this creates a positive feedback loop for the modelsof a weak brand: sales lead to positive OCRs and greaterbrand equity, which loops back to positively affect sales forall of the models of that brand.
In contrast to the speculation that brands will matter lessas OCRs become more readily available, we find that OCRsmatter less for strong brands. In essence, brand equity tendsto affect OCRs more than the other way around. Much likethe importance of brands in the face of stronger, more con-centrated retailers and their private labels (the last purported“brand killer”), brands continue to be a critical factor forcompanies competing in an online environment. The resultsalso suggest that corporate brand equity may not be a goodindicator of strength in a specific category. For example,Philips has the third-largest corporate brand value in theInterbrand ranking, after only Samsung and Sony, but in the
TABLE 6Effects of Sales and Brand Strength on OCR Generation
A: Blu-Ray Playersln(Number of Positive OCRsit) ln(Number of Negative OCRsit)
Coefficients p-Values Coefficients p-Valuesln(Number of positive OCRsi,t – 1) .186 .002ln(Number of positive OCRsi,t – 2) .230 .000ln(Number of positive OCRsi,t – 3) .154 .003ln(Number of negative OCRsi,t – 1) –.086 .803ln(Number of negative OCRsi,t – 2) –.042 .915ln(Number of negative OCRsi,t – 3) –.039 .913ln(1/Rankit) .251 .040 –.153 .530Strong brandit –.020 .762 .250 .442ln(Durationit) 2.511 .000 1.270 .037[ln(Durationit)]2 –.453 .000 –.248 .052
B: DVD Playersln(Number of Positive OCRsit) ln(Number of Negative OCRsit)
Coefficients p-Values Coefficients p-Valuesln(Number of positive OCRsi,t – 1) –.248 .000ln(Number of positive OCRsi,t – 2) –.221 .031ln(Number of negative OCRsi,t – 1) –.021 .682ln(Number of negative OCRsi,t – 2) –.052 .452ln(1/Rankit) .208 .008 .102 .284Strong brandit –.027 .699 –.002 .985ln(Durationit) .341 .065 .363 .003[ln(Durationit)]2 –.062 .077 –.068 .012
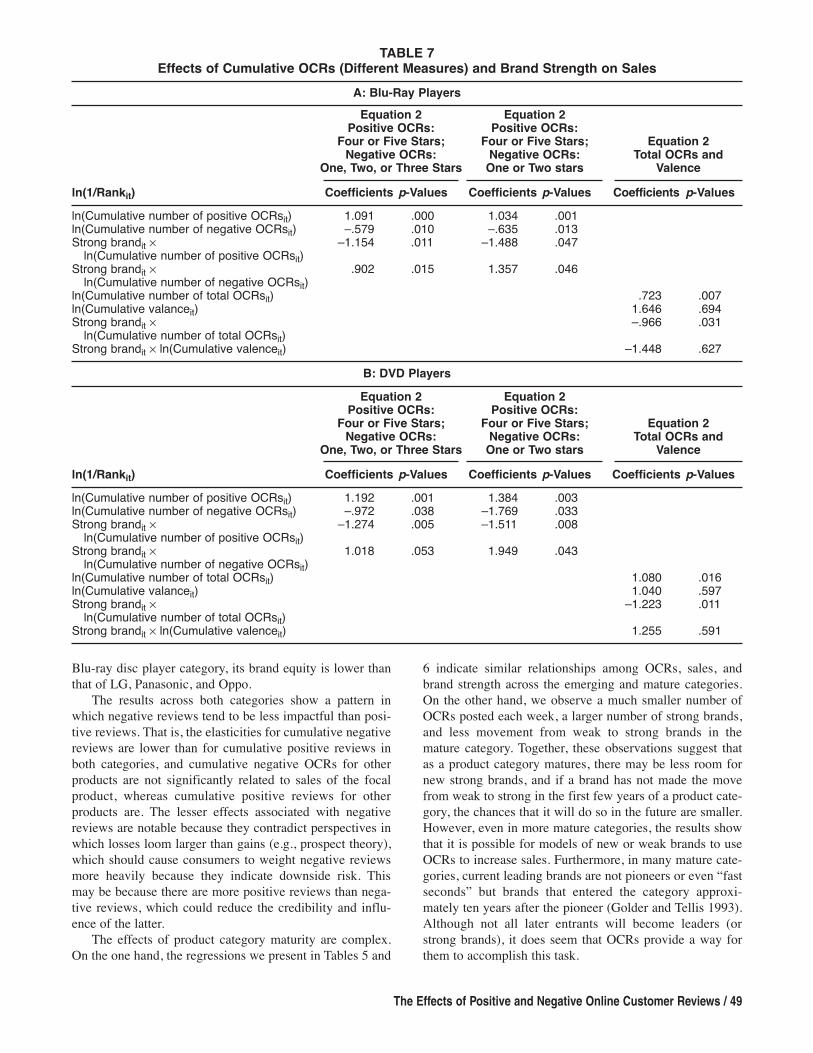
Blu-ray disc player category, its brand equity is lower thanthat of LG, Panasonic, and Oppo.
The results across both categories show a pattern inwhich negative reviews tend to be less impactful than posi-tive reviews. That is, the elasticities for cumulative negativereviews are lower than for cumulative positive reviews inboth categories, and cumulative negative OCRs for otherproducts are not significantly related to sales of the focalproduct, whereas cumulative positive reviews for otherproducts are. The lesser effects associated with negativereviews are notable because they contradict perspectives inwhich losses loom larger than gains (e.g., prospect theory),which should cause consumers to weight negative reviewsmore heavily because they indicate downside risk. Thismay be because there are more positive reviews than nega-tive reviews, which could reduce the credibility and influ-ence of the latter.
The effects of product category maturity are complex.On the one hand, the regressions we present in Tables 5 and
The Effects of Positive and Negative Online Customer Reviews / 49
6 indicate similar relationships among OCRs, sales, andbrand strength across the emerging and mature categories.On the other hand, we observe a much smaller number ofOCRs posted each week, a larger number of strong brands,and less movement from weak to strong brands in themature category. Together, these observations suggest thatas a product category matures, there may be less room fornew strong brands, and if a brand has not made the movefrom weak to strong in the first few years of a product cate-gory, the chances that it will do so in the future are smaller.However, even in more mature categories, the results showthat it is possible for models of new or weak brands to useOCRs to increase sales. Furthermore, in many mature cate-gories, current leading brands are not pioneers or even “fastseconds” but brands that entered the category approxi-mately ten years after the pioneer (Golder and Tellis 1993).Although not all later entrants will become leaders (orstrong brands), it does seem that OCRs provide a way forthem to accomplish this task.
TABLE 7Effects of Cumulative OCRs (Different Measures) and Brand Strength on Sales
A: Blu-Ray PlayersEquation 2 Equation 2
Positive OCRs: Positive OCRs: Four or Five Stars; Four or Five Stars; Equation 2Negative OCRs: Negative OCRs: Total OCRs and
One, Two, or Three Stars One or Two stars Valence
ln(1/Rankit) Coefficients p-Values Coefficients p-Values Coefficients p-Valuesln(Cumulative number of positive OCRsit) 1.091 .000 1.034 .001ln(Cumulative number of negative OCRsit) –.579 .010 –.635 .013Strong brandit ¥ –1.154 .011 –1.488 .047ln(Cumulative number of positive OCRsit)
Strong brandit ¥ .902 .015 1.357 .046ln(Cumulative number of negative OCRsit)
ln(Cumulative number of total OCRsit) .723 .007ln(Cumulative valanceit) 1.646 .694Strong brandit ¥ –.966 .031ln(Cumulative number of total OCRsit)
Strong brandit ¥ ln(Cumulative valenceit) –1.448 .627
B: DVD PlayersEquation 2 Equation 2
Positive OCRs: Positive OCRs: Four or Five Stars; Four or Five Stars; Equation 2Negative OCRs: Negative OCRs: Total OCRs and
One, Two, or Three Stars One or Two stars Valence
ln(1/Rankit) Coefficients p-Values Coefficients p-Values Coefficients p-Valuesln(Cumulative number of positive OCRsit) 1.192 .001 1.384 .003ln(Cumulative number of negative OCRsit) –.972 .038 –1.769 .033Strong brandit ¥ –1.274 .005 –1.511 .008ln(Cumulative number of positive OCRsit)
Strong brandit ¥ 1.018 .053 1.949 .043ln(Cumulative number of negative OCRsit)
ln(Cumulative number of total OCRsit) 1.080 .016ln(Cumulative valanceit) 1.040 .597Strong brandit ¥ –1.223 .011ln(Cumulative number of total OCRsit)
Strong brandit ¥ ln(Cumulative valenceit) 1.255 .591
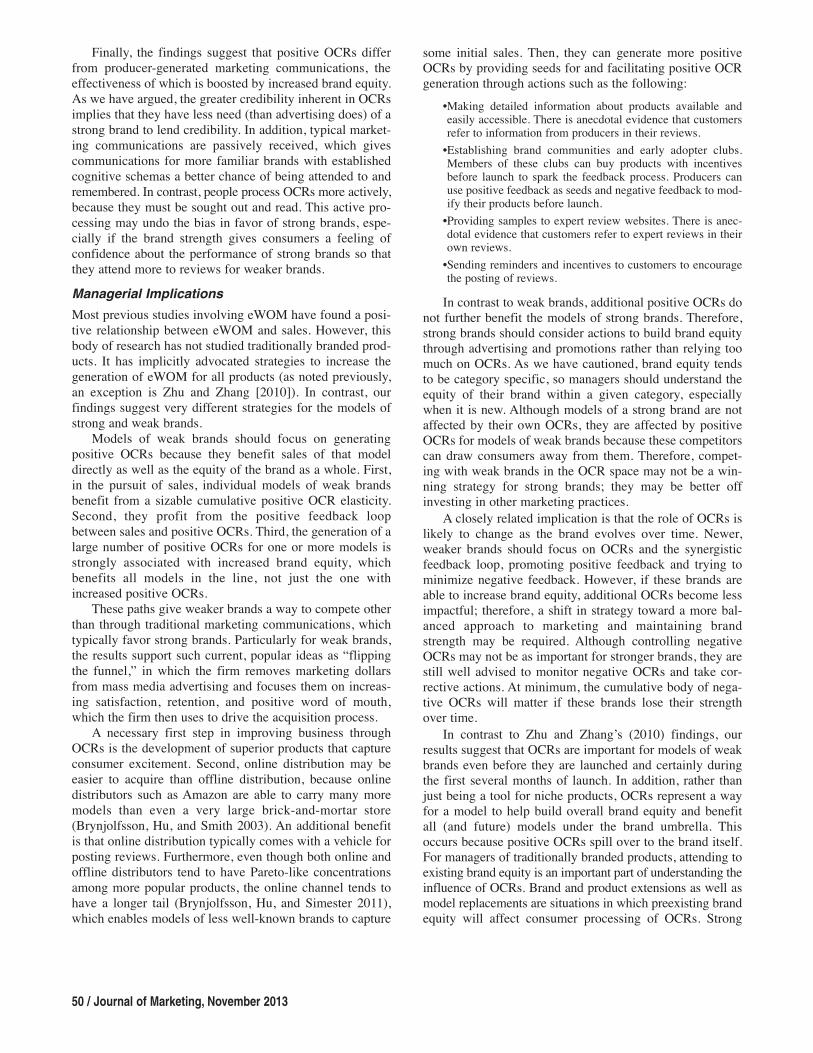
Finally, the findings suggest that positive OCRs differfrom producer-generated marketing communications, theeffectiveness of which is boosted by increased brand equity.As we have argued, the greater credibility inherent in OCRsimplies that they have less need (than advertising does) of astrong brand to lend credibility. In addition, typical market-ing communications are passively received, which givescommunications for more familiar brands with establishedcognitive schemas a better chance of being attended to andremembered. In contrast, people process OCRs more actively,because they must be sought out and read. This active pro-cessing may undo the bias in favor of strong brands, espe-cially if the brand strength gives consumers a feeling ofconfidence about the performance of strong brands so thatthey attend more to reviews for weaker brands.Managerial ImplicationsMost previous studies involving eWOM have found a posi-tive relationship between eWOM and sales. However, thisbody of research has not studied traditionally branded prod-ucts. It has implicitly advocated strategies to increase thegeneration of eWOM for all products (as noted previously,an exception is Zhu and Zhang [2010]). In contrast, ourfindings suggest very different strategies for the models ofstrong and weak brands.
Models of weak brands should focus on generatingpositive OCRs because they benefit sales of that modeldirectly as well as the equity of the brand as a whole. First,in the pursuit of sales, individual models of weak brandsbenefit from a sizable cumulative positive OCR elasticity.Second, they profit from the positive feedback loopbetween sales and positive OCRs. Third, the generation of alarge number of positive OCRs for one or more models isstrongly associated with increased brand equity, whichbenefits all models in the line, not just the one withincreased positive OCRs.
These paths give weaker brands a way to compete otherthan through traditional marketing communications, whichtypically favor strong brands. Particularly for weak brands,the results support such current, popular ideas as “flippingthe funnel,” in which the firm removes marketing dollarsfrom mass media advertising and focuses them on increas-ing satisfaction, retention, and positive word of mouth,which the firm then uses to drive the acquisition process.
A necessary first step in improving business throughOCRs is the development of superior products that captureconsumer excitement. Second, online distribution may beeasier to acquire than offline distribution, because onlinedistributors such as Amazon are able to carry many moremodels than even a very large brick-and-mortar store(Brynjolfsson, Hu, and Smith 2003). An additional benefitis that online distribution typically comes with a vehicle forposting reviews. Furthermore, even though both online andoffline distributors tend to have Pareto-like concentrationsamong more popular products, the online channel tends tohave a longer tail (Brynjolfsson, Hu, and Simester 2011),which enables models of less well-known brands to capture
50 / Journal of Marketing, November 2013
some initial sales. Then, they can generate more positiveOCRs by providing seeds for and facilitating positive OCRgeneration through actions such as the following:
•Making detailed information about products available andeasily accessible. There is anecdotal evidence that customersrefer to information from producers in their reviews.•Establishing brand communities and early adopter clubs.Members of these clubs can buy products with incentivesbefore launch to spark the feedback process. Producers canuse positive feedback as seeds and negative feedback to mod-ify their products before launch.•Providing samples to expert review websites. There is anec-dotal evidence that customers refer to expert reviews in theirown reviews.•Sending reminders and incentives to customers to encouragethe posting of reviews.In contrast to weak brands, additional positive OCRs do
not further benefit the models of strong brands. Therefore,strong brands should consider actions to build brand equitythrough advertising and promotions rather than relying toomuch on OCRs. As we have cautioned, brand equity tendsto be category specific, so managers should understand theequity of their brand within a given category, especiallywhen it is new. Although models of a strong brand are notaffected by their own OCRs, they are affected by positiveOCRs for models of weak brands because these competitorscan draw consumers away from them. Therefore, compet-ing with weak brands in the OCR space may not be a win-ning strategy for strong brands; they may be better offinvesting in other marketing practices.
A closely related implication is that the role of OCRs islikely to change as the brand evolves over time. Newer,weaker brands should focus on OCRs and the synergisticfeedback loop, promoting positive feedback and trying tominimize negative feedback. However, if these brands areable to increase brand equity, additional OCRs become lessimpactful; therefore, a shift in strategy toward a more bal-anced approach to marketing and maintaining brandstrength may be required. Although controlling negativeOCRs may not be as important for stronger brands, they arestill well advised to monitor negative OCRs and take cor-rective actions. At minimum, the cumulative body of nega-tive OCRs will matter if these brands lose their strengthover time.
In contrast to Zhu and Zhang’s (2010) findings, ourresults suggest that OCRs are important for models of weakbrands even before they are launched and certainly duringthe first several months of launch. In addition, rather thanjust being a tool for niche products, OCRs represent a wayfor a model to help build overall brand equity and benefitall (and future) models under the brand umbrella. Thisoccurs because positive OCRs spill over to the brand itself.For managers of traditionally branded products, attending toexisting brand equity is an important part of understanding theinfluence of OCRs. Brand and product extensions as well asmodel replacements are situations in which preexisting brandequity will affect consumer processing of OCRs. Strong
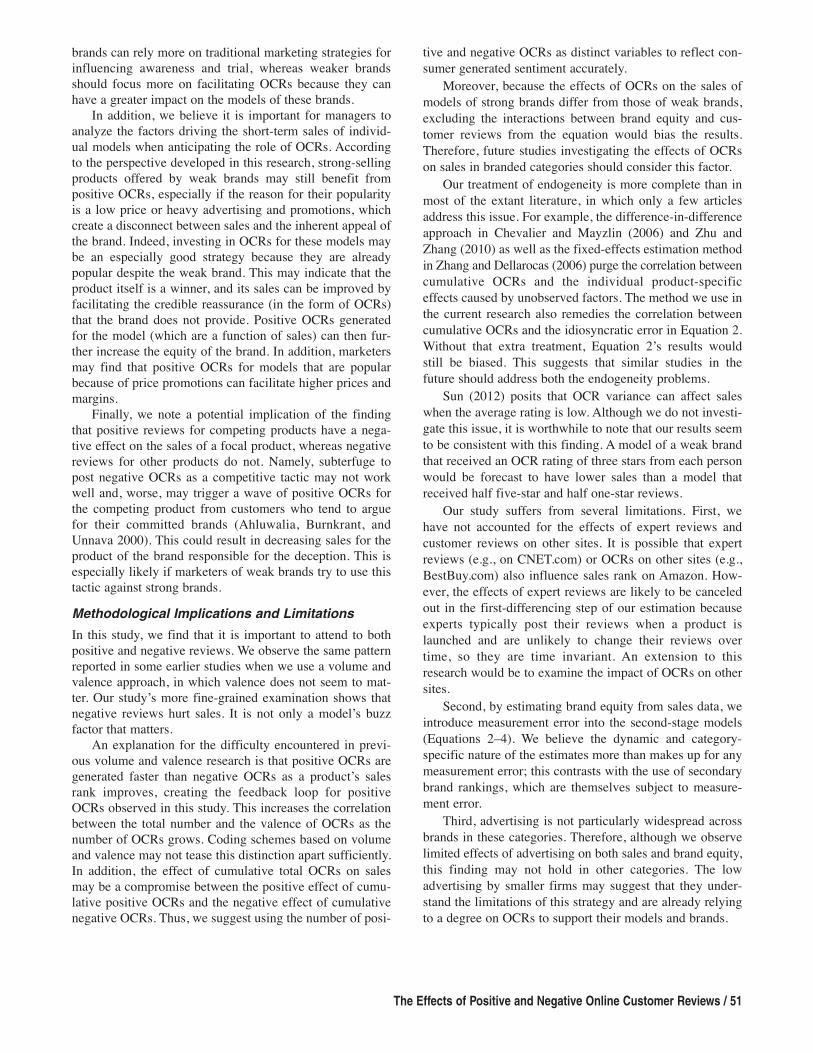
brands can rely more on traditional marketing strategies forinfluencing awareness and trial, whereas weaker brandsshould focus more on facilitating OCRs because they canhave a greater impact on the models of these brands.
In addition, we believe it is important for managers toanalyze the factors driving the short-term sales of individ-ual models when anticipating the role of OCRs. Accordingto the perspective developed in this research, strong-sellingproducts offered by weak brands may still benefit frompositive OCRs, especially if the reason for their popularityis a low price or heavy advertising and promotions, whichcreate a disconnect between sales and the inherent appeal ofthe brand. Indeed, investing in OCRs for these models maybe an especially good strategy because they are alreadypopular despite the weak brand. This may indicate that theproduct itself is a winner, and its sales can be improved byfacilitating the credible reassurance (in the form of OCRs)that the brand does not provide. Positive OCRs generatedfor the model (which are a function of sales) can then fur-ther increase the equity of the brand. In addition, marketersmay find that positive OCRs for models that are popularbecause of price promotions can facilitate higher prices andmargins.
Finally, we note a potential implication of the findingthat positive reviews for competing products have a nega-tive effect on the sales of a focal product, whereas negativereviews for other products do not. Namely, subterfuge topost negative OCRs as a competitive tactic may not workwell and, worse, may trigger a wave of positive OCRs forthe competing product from customers who tend to arguefor their committed brands (Ahluwalia, Burnkrant, andUnnava 2000). This could result in decreasing sales for theproduct of the brand responsible for the deception. This isespecially likely if marketers of weak brands try to use thistactic against strong brands.Methodological Implications and LimitationsIn this study, we find that it is important to attend to bothpositive and negative reviews. We observe the same patternreported in some earlier studies when we use a volume andvalence approach, in which valence does not seem to mat-ter. Our study’s more fine-grained examination shows thatnegative reviews hurt sales. It is not only a model’s buzzfactor that matters.
An explanation for the difficulty encountered in previ-ous volume and valence research is that positive OCRs aregenerated faster than negative OCRs as a product’s salesrank improves, creating the feedback loop for positiveOCRs observed in this study. This increases the correlationbetween the total number and the valence of OCRs as thenumber of OCRs grows. Coding schemes based on volumeand valence may not tease this distinction apart sufficiently.In addition, the effect of cumulative total OCRs on salesmay be a compromise between the positive effect of cumu-lative positive OCRs and the negative effect of cumulativenegative OCRs. Thus, we suggest using the number of posi-
The Effects of Positive and Negative Online Customer Reviews / 51
tive and negative OCRs as distinct variables to reflect con-sumer generated sentiment accurately.
Moreover, because the effects of OCRs on the sales ofmodels of strong brands differ from those of weak brands,excluding the interactions between brand equity and cus-tomer reviews from the equation would bias the results.Therefore, future studies investigating the effects of OCRson sales in branded categories should consider this factor.
Our treatment of endogeneity is more complete than inmost of the extant literature, in which only a few articlesaddress this issue. For example, the difference-in-differenceapproach in Chevalier and Mayzlin (2006) and Zhu andZhang (2010) as well as the fixed-effects estimation methodin Zhang and Dellarocas (2006) purge the correlation betweencumulative OCRs and the individual product-specificeffects caused by unobserved factors. The method we use inthe current research also remedies the correlation betweencumulative OCRs and the idiosyncratic error in Equation 2.Without that extra treatment, Equation 2’s results wouldstill be biased. This suggests that similar studies in thefuture should address both the endogeneity problems.
Sun (2012) posits that OCR variance can affect saleswhen the average rating is low. Although we do not investi-gate this issue, it is worthwhile to note that our results seemto be consistent with this finding. A model of a weak brandthat received an OCR rating of three stars from each personwould be forecast to have lower sales than a model thatreceived half five-star and half one-star reviews.
Our study suffers from several limitations. First, wehave not accounted for the effects of expert reviews andcustomer reviews on other sites. It is possible that expertreviews (e.g., on CNET.com) or OCRs on other sites (e.g.,BestBuy.com) also influence sales rank on Amazon. How-ever, the effects of expert reviews are likely to be canceledout in the first-differencing step of our estimation becauseexperts typically post their reviews when a product islaunched and are unlikely to change their reviews overtime, so they are time invariant. An extension to thisresearch would be to examine the impact of OCRs on othersites.
Second, by estimating brand equity from sales data, weintroduce measurement error into the second-stage models(Equations 2–4). We believe the dynamic and category-specific nature of the estimates more than makes up for anymeasurement error; this contrasts with the use of secondarybrand rankings, which are themselves subject to measure-ment error.
Third, advertising is not particularly widespread acrossbrands in these categories. Therefore, although we observelimited effects of advertising on both sales and brand equity,this finding may not hold in other categories. The lowadvertising by smaller firms may suggest that they under-stand the limitations of this strategy and are already relyingto a degree on OCRs to support their models and brands.
52 / Journal of Marketing, November 2013
Erdem, Tülin and Joffre Swait (1998), “Brand Equity as a Signal-ing Phenomenon,” Journal of Consumer Psychology, 7 (2),131–57.
———, ———, and Ana Valenzuela (2006), “Brands as Signals: ACross-Country Validation Study,” Journal of Marketing, 70(January), 34–49.
Ghose, Anindya and Arun Sundararajan (2006), “Evaluating Pric-ing Strategy Using e-Commerce Data: Evidence and Estima-tion Challenges,” Statistical Science, 27 (6), 995–1011.
Golder, Peter N. and Gerard J. Tellis (1993), “Pioneer Advantage:Marketing Logic or Marketing Legend?” Journal of MarketingResearch, 30 (May), 158–70.
Goolsbee, Austan and Judith A. Chevalier (2002), “MeasuringPrices and Price Competition Online: Amazon and Barnes andNoble,” Working Paper No. 02-23, Yale School of Manage-ment International Center for Finance.
Hausman, Jerry A. and William E. Taylor (1981), “Panel Data andUnobservable Individual Effects,” Econometrica, 49 (6),1377–98.
Hoeffler, Steve and Kevin L. Keller (2003), “The MarketingAdvantages of Strong Brands,” Journal of Brand Management,10 (6), 421–45.
Horsky, Dan, Sanjog Misra, and Paul Nelson (2006), “Observedand Unobserved Preference Heterogeneity in Brand-ChoiceModels,” Marketing Science, 25 (4), 322–35.
Hung, Kineta H. and Stella Y. Li (2007), “The Influence of eWOMon Virtual Consumer Communities: Social Capital, ConsumerLearning, and Behavioral Outcomes,” Journal of AdvertisingResearch, 47 (4), 485–95.
Interbrand (2009), “Best Global Brands 2009,” (accessed July 16,2013), [available at http://www.interbrand.com/de/best-global-brands/previous-years/best-global-brands-2009.aspx]
Kamakura, Wagner and Gary Russell (1993), “Measuring BrandValue with Scanner Data,” International Journal for Researchin Marketing, 10 (1), 9–22.
Karniouchina, Ekaterina V. (2011), “Impact of Star and Movie Buzzon Motion Picture Distribution and Box Office Revenue,”International Journal of Research in Marketing, 28 (1), 62–74.
Kirmani, Amna (1990), “The Effect of Perceived AdvertisingCosts on Brand Perceptions,” Journal of Consumer Research,17 (2), 160–71.
Li, Xinxin and Lorin M. Hitt (2008), “Self Selection and Informa-tion Role of Online Product Reviews,” Information SystemsResearch, 19 (4), 456–74.
Liu, Yong (2006), “Word of Mouth for Movies: Its Dynamics andImpact on Box Office Revenue,” Journal of Marketing, 70(July), 74–89.
Montgomery, Cynthia A. and Berger Wernerfelt (1992), “RiskReduction and Umbrella Branding,” Journal of Business, 65(1), 31–50.
Mundlak, Yair (1978), “On the Pooling of Time Series and CrossSection Data,” Econometrica, 46 (1), 69–85.
Nelson, Phillip (1974), “Advertising as Information,” Journal ofPolitical Economy, 82 (4), 729–54.
Nickell, Stephen (1981), “Biases in Dynamic Models with FixedEffects,” Econometrica, 49 (6), 1417–26.
Petty, Richard E. and Jon A. Krosnick (1995), Attitude Strength:Antecedents and Consequences. Mahwah, NJ: Lawrence Erl-baum Associates.
Prasso, Sheridan (2011), “Chobani: The Unlikely King of Yogurt,”Fortune, (December 12), (accessed July 16, 2013), [availableat http://money.cnn.com/2011/11/29/smallbusiness/ chobani_yogurt_hamdi_ulukaya.fortune/index.htm].
Rao, Akshay R., Lu Qu, and Robert W. Ruekert (1999), “SignalingUnobservable Product Quality Through a Brand Ally,” Journalof Marketing Research, 36 (May), 258–68.
REFERENCESAhluwalia, Rohini, Robert E. Burnkrant, and H. Rao Unnava(2000), “Consumer Response to Negative Publicity: The Mod-erating Role of Commitment,” Journal of Marketing Research,37 (May), 203–214.
Archak, Nikolay, Anindya Ghose, and Panagiotis G. Ipeirotis(2011), “Deriving the Pricing Power of Product Features byMining Consumer Reviews,” Management Science, 58 (7),1485–1509.
Arellano, Manuel and Stephen Bond (1991), “Some Tests ofSpecification for Panel Data: Monte Carlo Evidence and anApplication to Employment Equations,” Review of EconomicStudies, 58 (2), 277–97.
Belch, George E. (1981), “An Examination of Comparative andNoncomparative Television Commercials: The Effects ofClaim Variation and Repetition on Cognitive Response andMessage Acceptance,” Journal of Marketing Research, 18(August), 333–49.
Bickart, Barbara and Robert M. Schindler (2001), “InternetForums as Influential Sources of Consumer Information,”Journal of Interactive Marketing, 15 (3), 31–40.
Boulding, William and Amna Kirmani (1993), “A Consumer-SideExperimental Examination of Signaling Theory: Do Con-sumers Perceive Warranties as Signals of Quality?” Journal ofConsumer Research, 20 (1), 111–23.
BrandZ (2009), “Top 100 Most Valuable Global Brands 2009,”(accessed July 23, 2011), [available at http://www. wpp.com/~/media/SharedWPP/BrandZ/BrandZ%202009%20report.pdf].
Brynjolfsson, Erik, Yu Hu, and Duncan Simester (2011), “Good-bye Pareto Principle, Hello Long Tail: The Effect of SearchCosts on the Concentration of Product Sales,” ManagementScience, 57 (8), 1371–86.
———, ———, and Michael D. Smith (2003), “Consumer Surplusin the Digital Economy: Estimating the Value of IncreasedProduct Variety,” Management Science, 49 (11), 540–46.
Chen, Pei-Yu, Shin-Yi Wu, and Jungsun Yoon (2004), “TheImpact of Online Recommendations and Consumer Feedbackon Sales,” in International Conference on Information Systems2004 Proceedings. Washington, DC: Association for Informa-tion Systems, 711–24.
Chen, Stephen (2001), “Assessing the Impact of the Internet onBrands,” Journal of Brand Management, 8 (4), 288–95.
Cheong, Hyuk J. and Margaret A. Morrison (2008), “Consumers’Reliance on Product Information and Recommendations Foundin UGC,” Journal of Interactive Advertising, 8 (2), 1–29.
Chevalier, Judith A. and Austan Goolsbee (2003), “MeasuringPrices and Price Competition Online: Amazon.com and BarnesandNoble. com,” Quantitative Marketing and Economics, 1 (2),203–222.
——— and ——— (2006), “The Effect of Word of Mouth on Sales:Online Book Reviews,” Journal of Marketing Research, 43(August), 345–54.
Dawar, Niraj and Madan M. Pillutla (2000), “Impact of Product-Harm Crises on Brand Equity: The Moderating Role of Con-sumer Expectations,” Journal of Marketing Research, 37(May), 215–26.
Dellarocas, Chrysanthos, Xiaoquan Zhang, and Neveen F. Awad(2007), “Exploring the Value of Online Product Reviews inForecasting Sales: The Case of Motion Pictures,” Journal ofInteractive Marketing, 21 (4), 23–45.
Duan, Wenjing, Bin Gu, and Andrew B. Whinston (2008a), “DoOnline Reviews Matter? An Empirical Investigation of PanelData,” Decision Support Systems, 45 (4), 1007–1016.
———, ———, and ——— (2008b), “The Dynamics of OnlineWord-of-Mouth and Product Sales: An Empirical Investigationof the Movie Industry,” Journal of Retailing, 84 (2), 233–42.
Roodman, David (2006), “How to Do Xtabond2: An Introductionto ‘Difference’ and ‘System’ GMM in Stata,” Working PaperNo. 103, Center for Global Development.
Rosenthal, Morris (2005), “Amazon Sales Ranking and AuthorRank: Calculate How Many Books Amazon Sells from Ranks,”(accessed July 16, 2013), [available at http://www.fonerbooks.com/surfing.htm].
Sargan, J.D. (1958), “The Estimation of Economic RelationshipsUsing Instrumental Variables,” Econometrica, 26 (3), 393–415.
Shimp, Terrance A. and William O. Bearden (1982), “The Use ofExtrinsic Cues to Facilitate Product Adoption,” Journal ofMarketing Research, 19 (May), 229–40.
Sriram, S., Subramanian Balachander, and Manohar U. Kalwani(2007), “Monitoring the Dynamics of Brand Equity UsingStore-Level Data,” Journal of Marketing, 71 (April), 61–78.
———, Pradeep K. Chintagunta, and Ramya Neelamegham(2006), “Effects of Brand Preference, Product Attributes, andMarketing Mix Variables in Technology Product Markets,”Marketing Science, 25 (5), 440–56.
Srivastava, Rajendra K. and Allan D. Shocker (1991), “BrandEquity: A Perspective on Its Meaning and Measurement,”Report No. 91-124, Marketing Science Institute.
The Effects of Positive and Negative Online Customer Reviews / 53
Stiglitz, Joseph (1989), “Imperfect Information in the ProductMarkets,” in Handbook of Industrial Organization, Vol. 1,Richard Schmalensee and Robert D. Willing, eds. Amsterdam:Elsevier, 769–847.
Sun, Monic (2012), “How Does the Variance of Product RatingsMatter?” Management Science, 58 (4), 696–707.
Tellis, Gerard J. and Birger Wernerfelt (1987), “Competitive Priceand Quality Under Asymmetric Information,” Marketing Sci-ence, 6 (3), 240–53.
Twice.com (2009), “Market Share Reports by Category,” (July 6),(accessed July 23, 2013), [available at http://www.twice.com/retailing/retailing/market-share-reports-category/22908].
Wernerfelt, Birger (1988), “Umbrella Branding as a Signal of NewProduct Quality: An Example of Signaling by Posting a Bond,”RAND Journal of Economics, 19 (3), 458–66.
Zhang, Xiaoquan M. and Chris Dellarocas (2006), “The Lord ofthe Ratings: How a Movie’s Fate Is Influenced by Reviews,” inProceedings of the 27th International Conference on Informa-tion Systems (ICIS). Milwaukee: Association for InformationSystems.
Zhu, Feng and Xiaoquan (Michael) Zhang (2010), “Impact ofOnline Consumer Reviews on Sales: The Moderating Role ofProduct and Consumer Characteristics,” Journal of Marketing,74 (March), 133–48.